


Características


¿Tienes alguna pregunta?
Recomendar


5 diapositivas
Strategic Inquiry Mapping Presentation
Bring your ideas to life with a fresh visual flow that maps key questions into action. This strategic template helps you organize complex inquiries across five stages—from insights and communication to analysis and execution. Fully editable and easy to use in PowerPoint, Keynote, and Google Slides for clear visual storytelling.


3 diapositivas
Breakthroughs in Biology and Chemistry Presentation
Highlight your scientific discoveries with this Breakthroughs in Biology and Chemistry Presentation Template. Featuring illustrated lab elements like microscopes, DNA, and petri dishes, it's perfect for researchers and educators. Easily editable in PowerPoint, Keynote, or Google Slides, this template helps convey key insights with clarity and visual appeal.


6 diapositivas
Process Direction Flow Mapping
Showcase linear progress with clarity using the Process Direction Flow Mapping Presentation. This layout features a clean, step-by-step directional flow with five stages, ideal for outlining project phases, business workflows, or timeline milestones. Each stage is color-coded with editable text areas, making it easy to customize and adapt for PowerPoint, Keynote, or Google Slides.
8 diapositivas
Performance Tracking Using OKRs Presentation
Track success effectively with the Performance Tracking Using OKRs presentation. This sleek infinity loop design showcases key metrics across People, Products, and Processes, making it ideal for business performance reviews, goal alignment, and strategic planning. Fully editable and compatible with PowerPoint, Keynote, and Google Slides for seamless customization.


6 diapositivas
Scrum Team Roles and Sprint Planning Presentation
Visualize your Agile workflow with this Scrum team diagram. Highlight roles, responsibilities, and key sprint planning phases in a clear, circular flow. Ideal for project managers, team leads, or Agile coaches. Fully editable in PowerPoint, Keynote, and Google Slides to support your software development or Agile training presentations.


6 diapositivas
SEO Services Infographic
Search Engine Optimization services are specialized strategies and practices aimed at improving a website's visibility and ranking in search engine results pages. The goal of SEO is to increase organic traffic to a website by optimizing various elements, such as content, keywords, website structure, and more. This template is designed to provide an overview of the different aspects of SEO that the agency specializes in. This Infographic is a valuable tool for SEO agencies to showcase their expertise, services, and track record to potential clients. This template is compatible with Powerpoint, Keynote, and Google Slides.


22 diapositivas
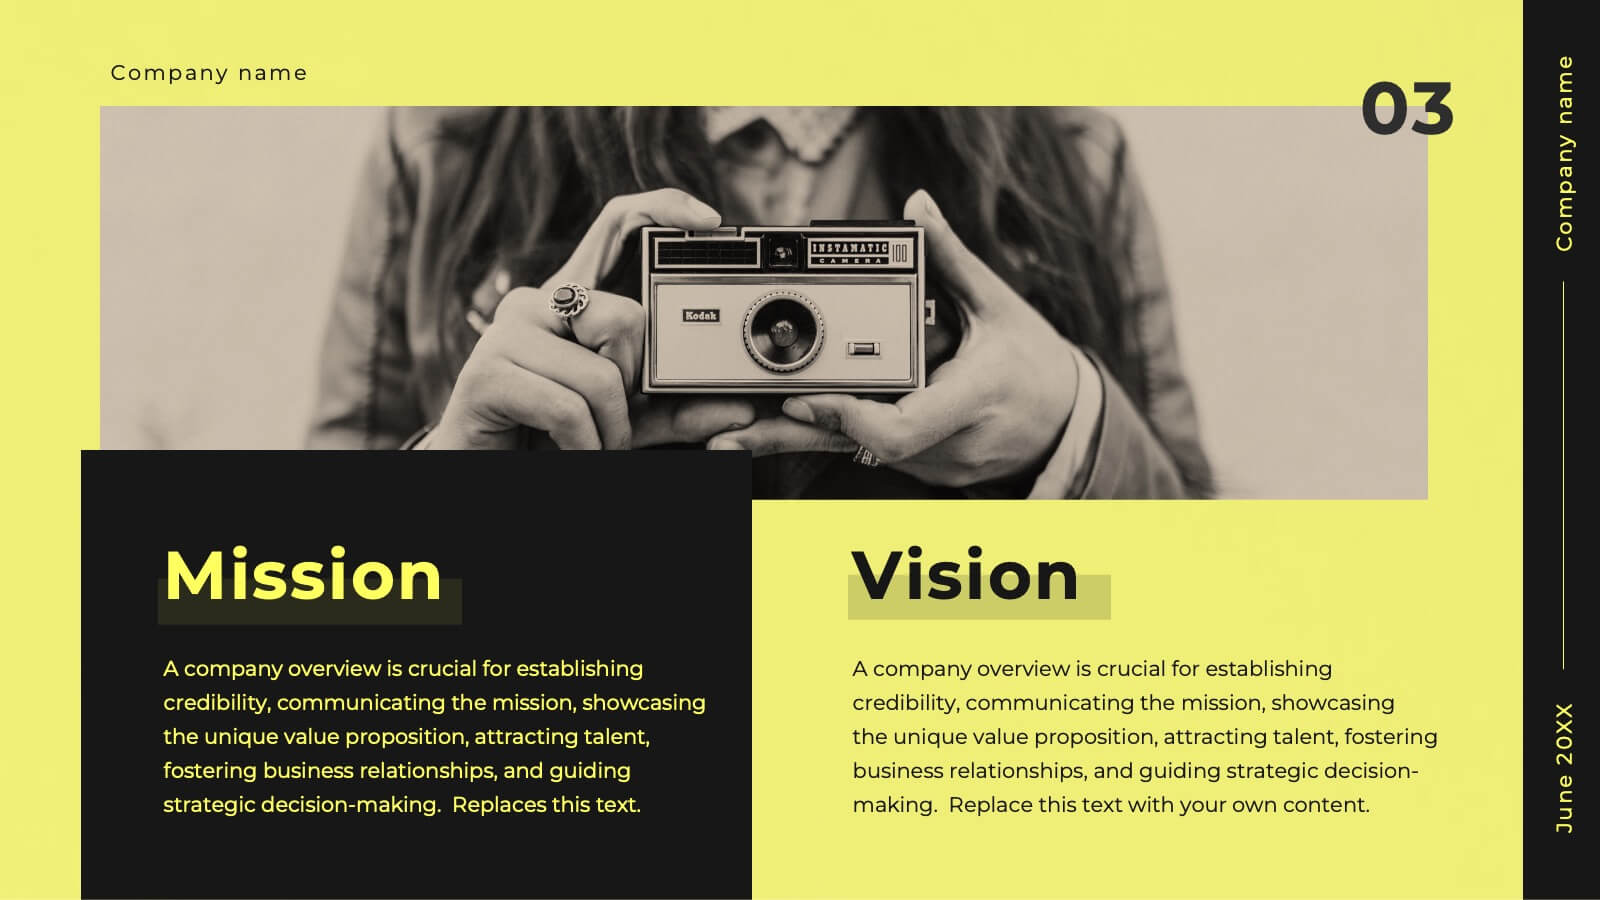
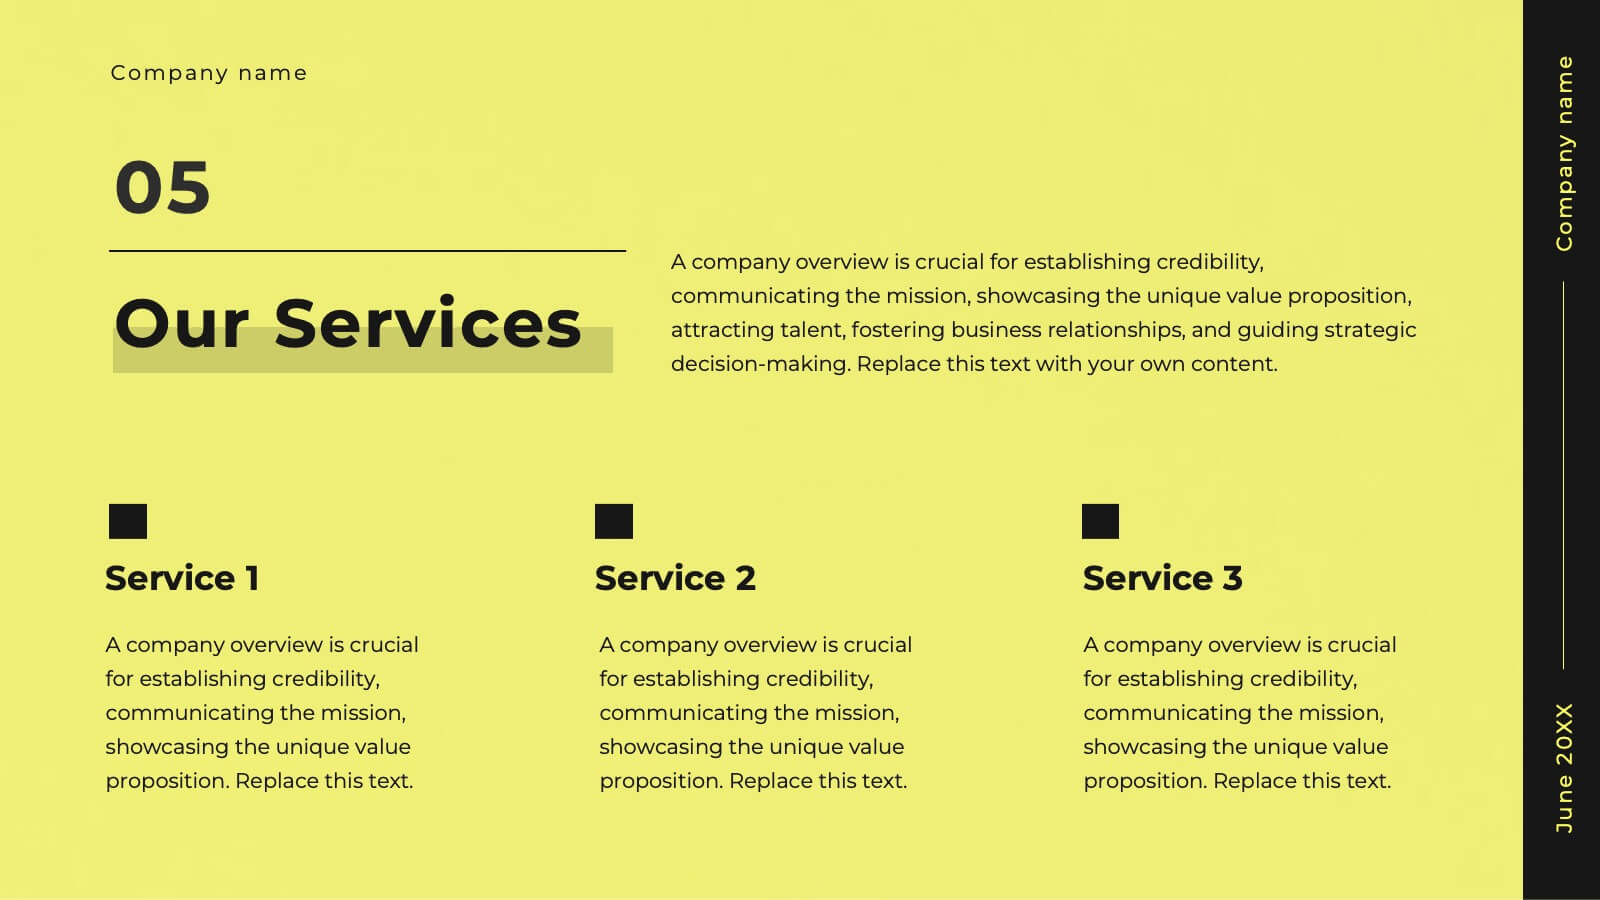
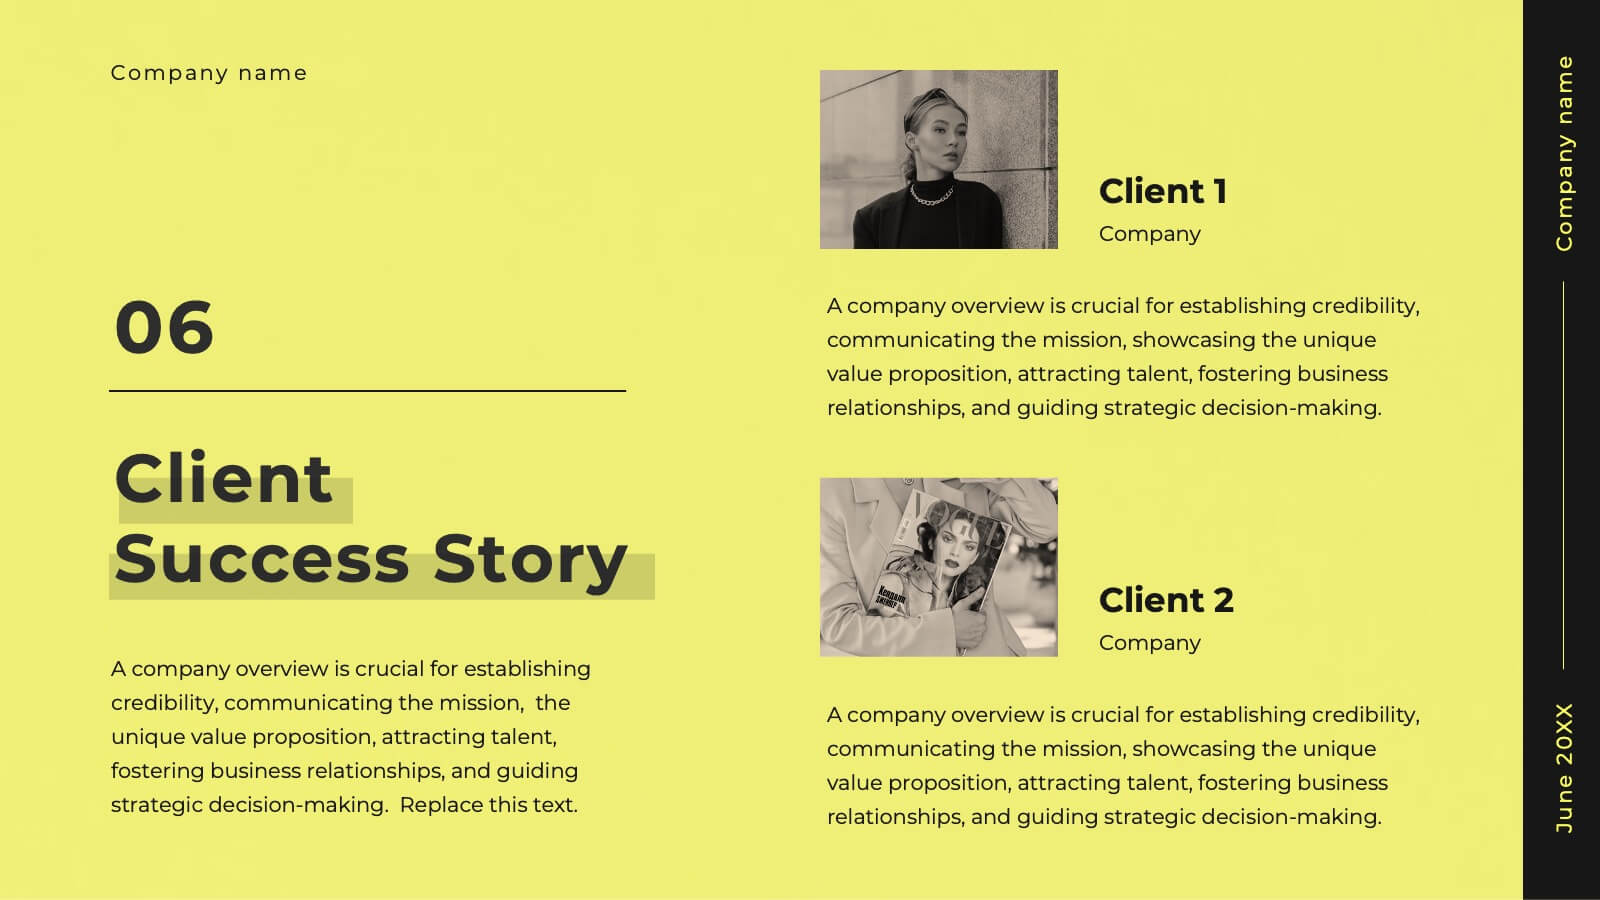
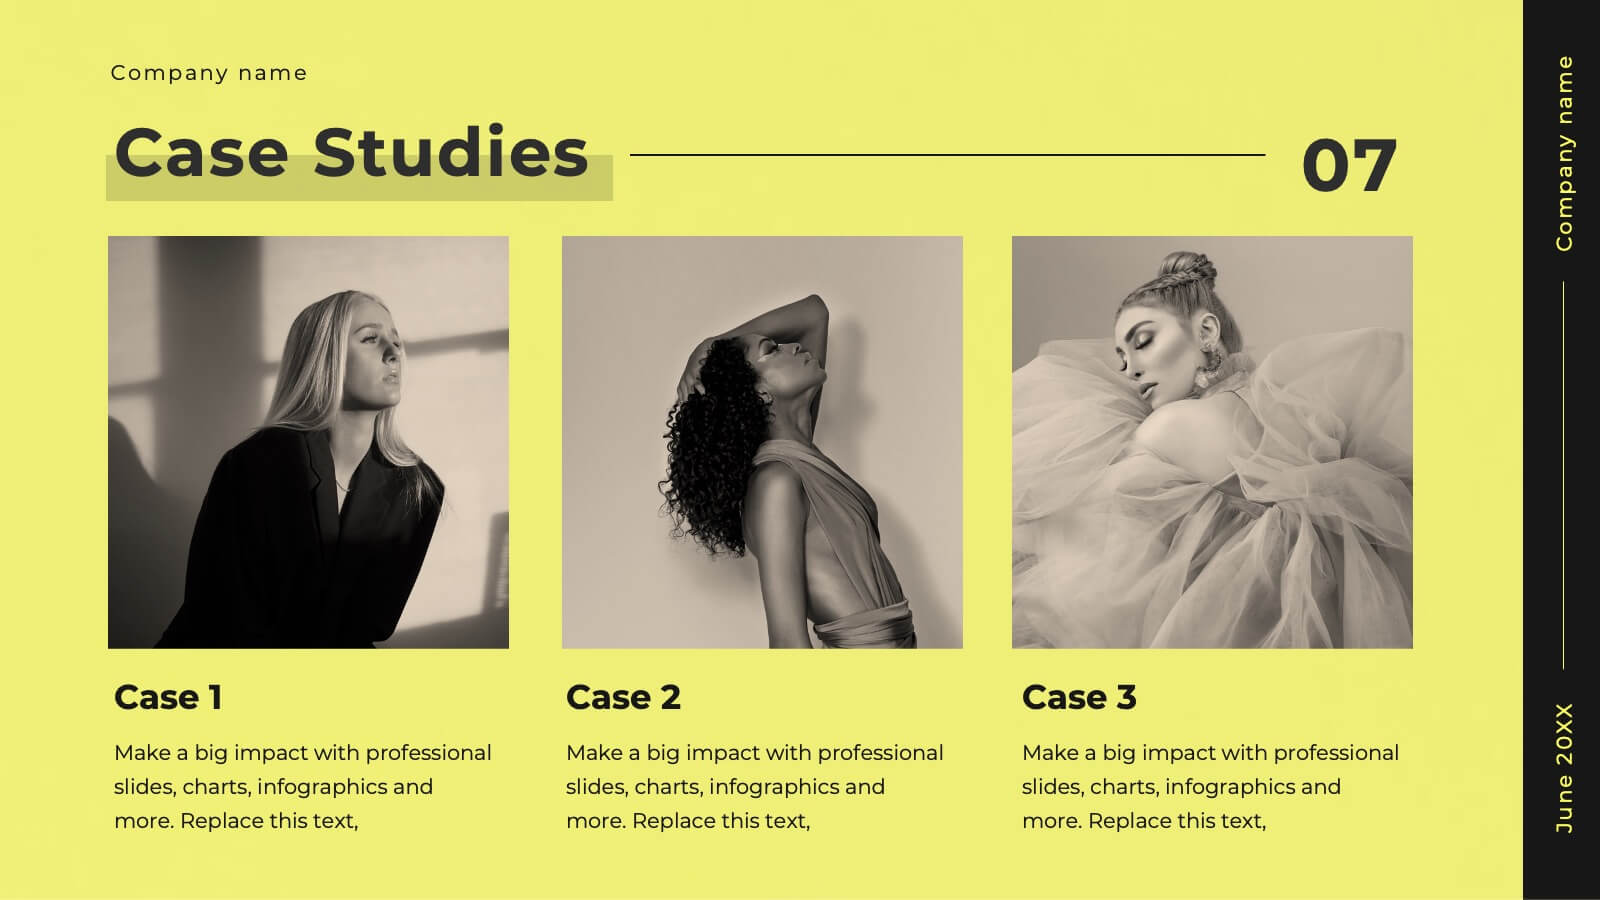
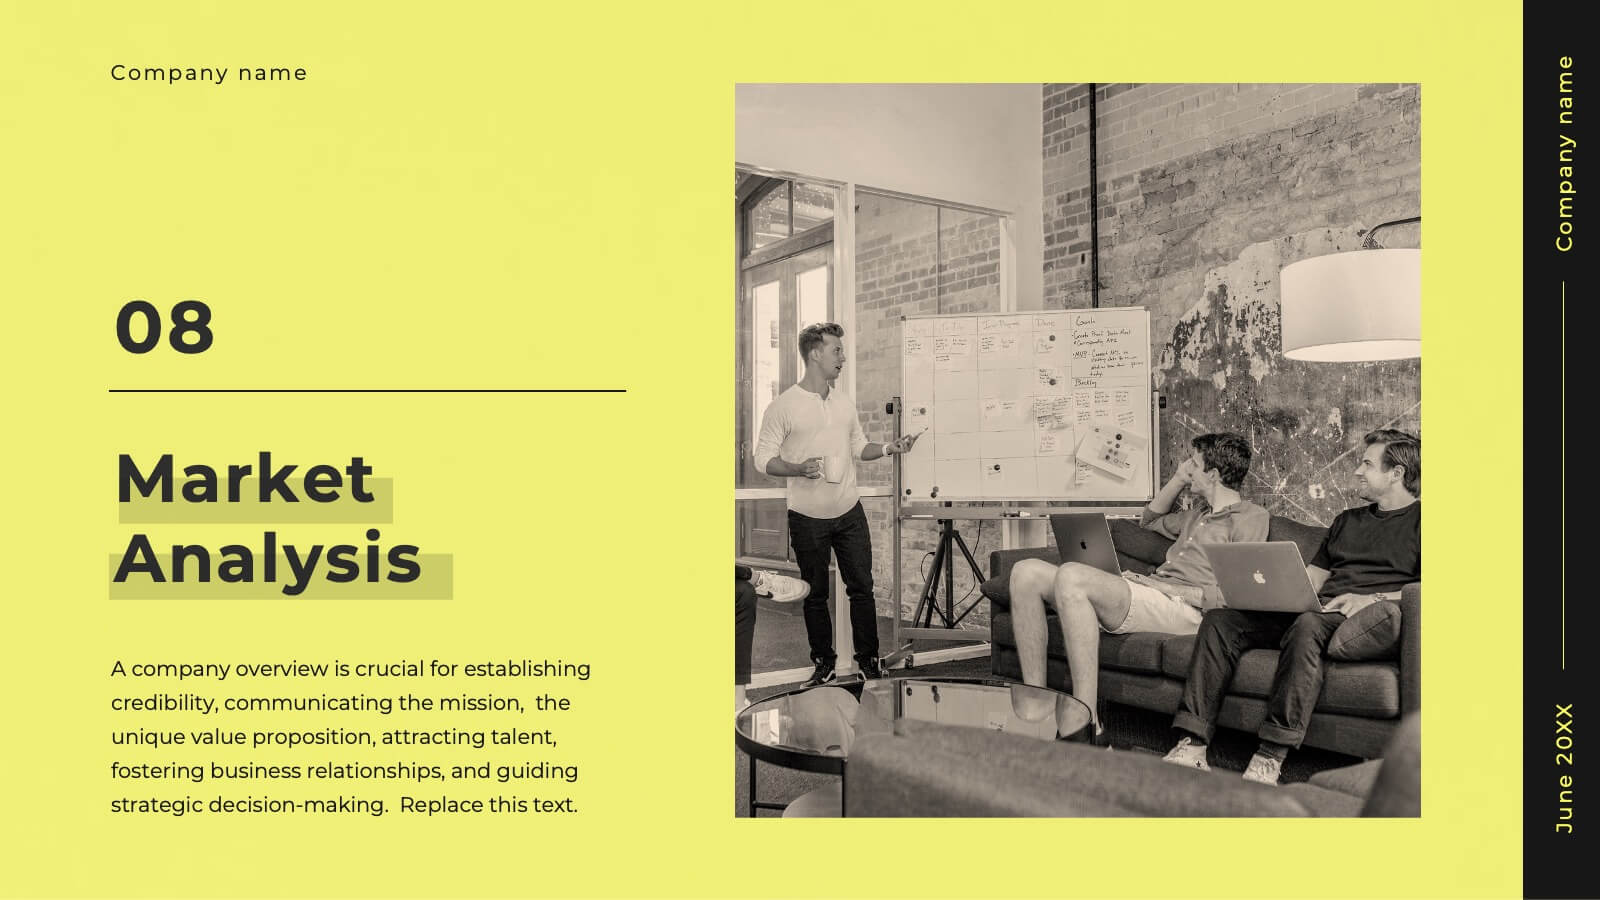
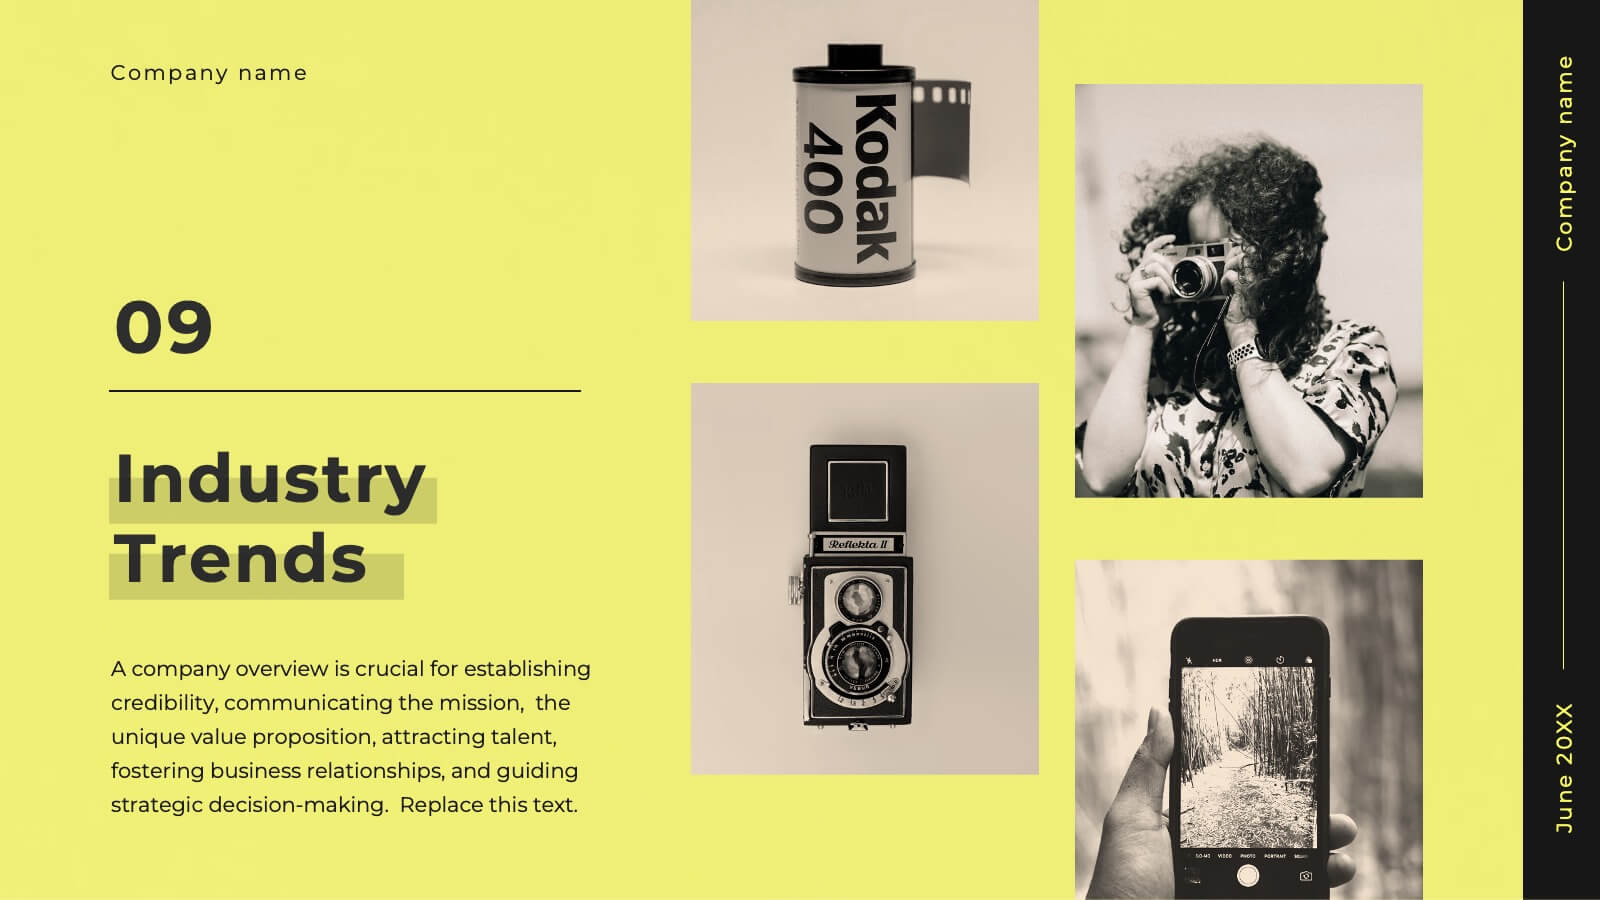
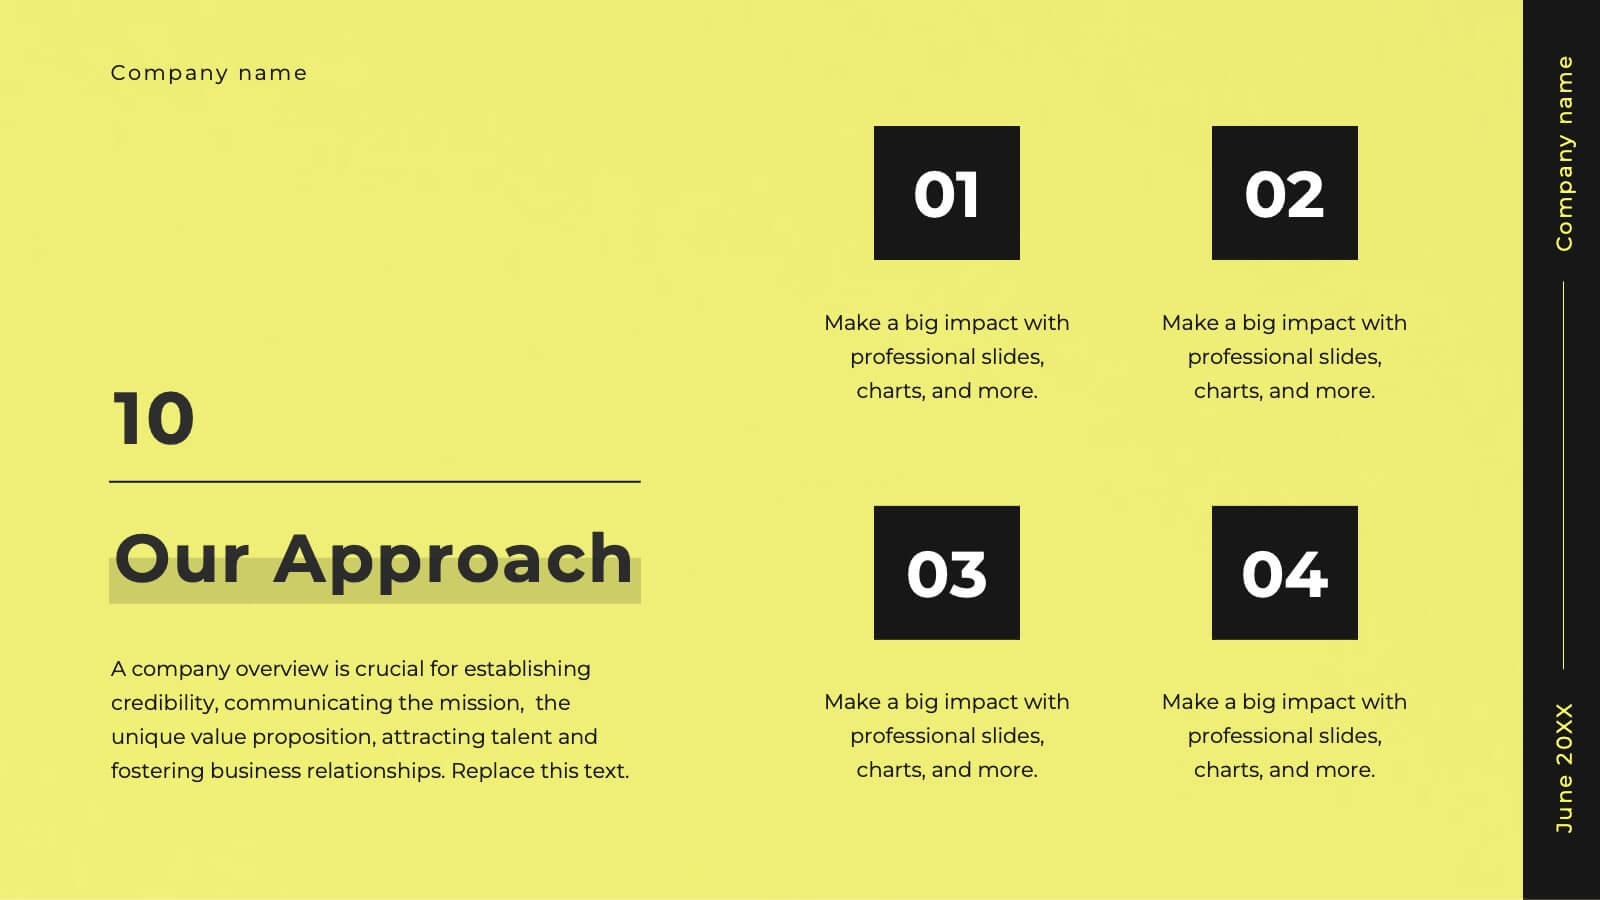
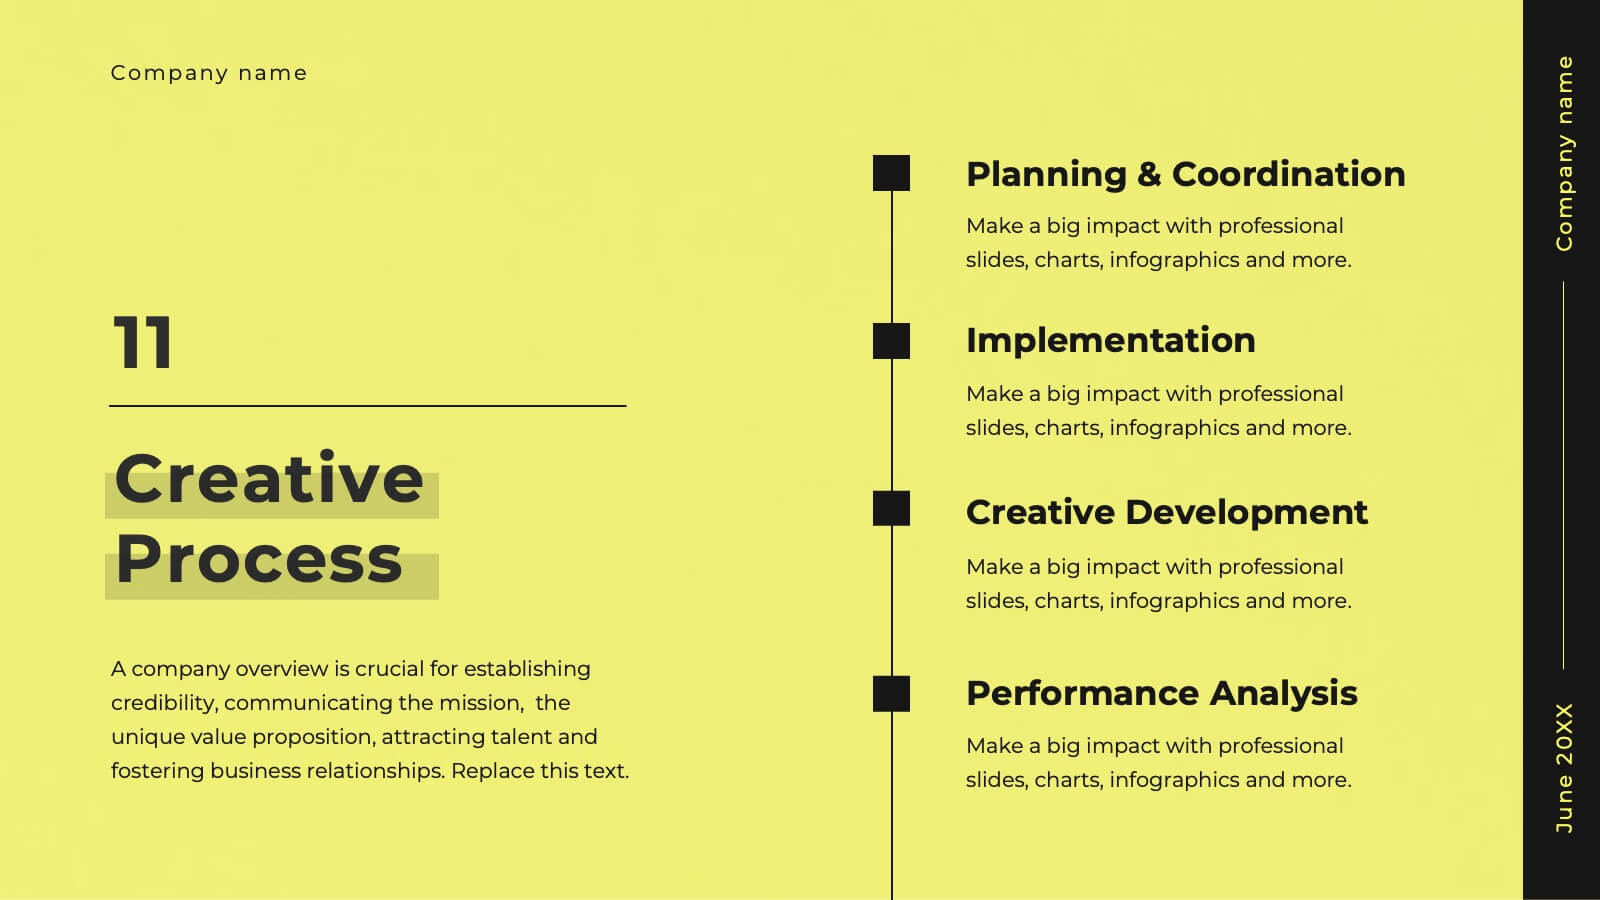
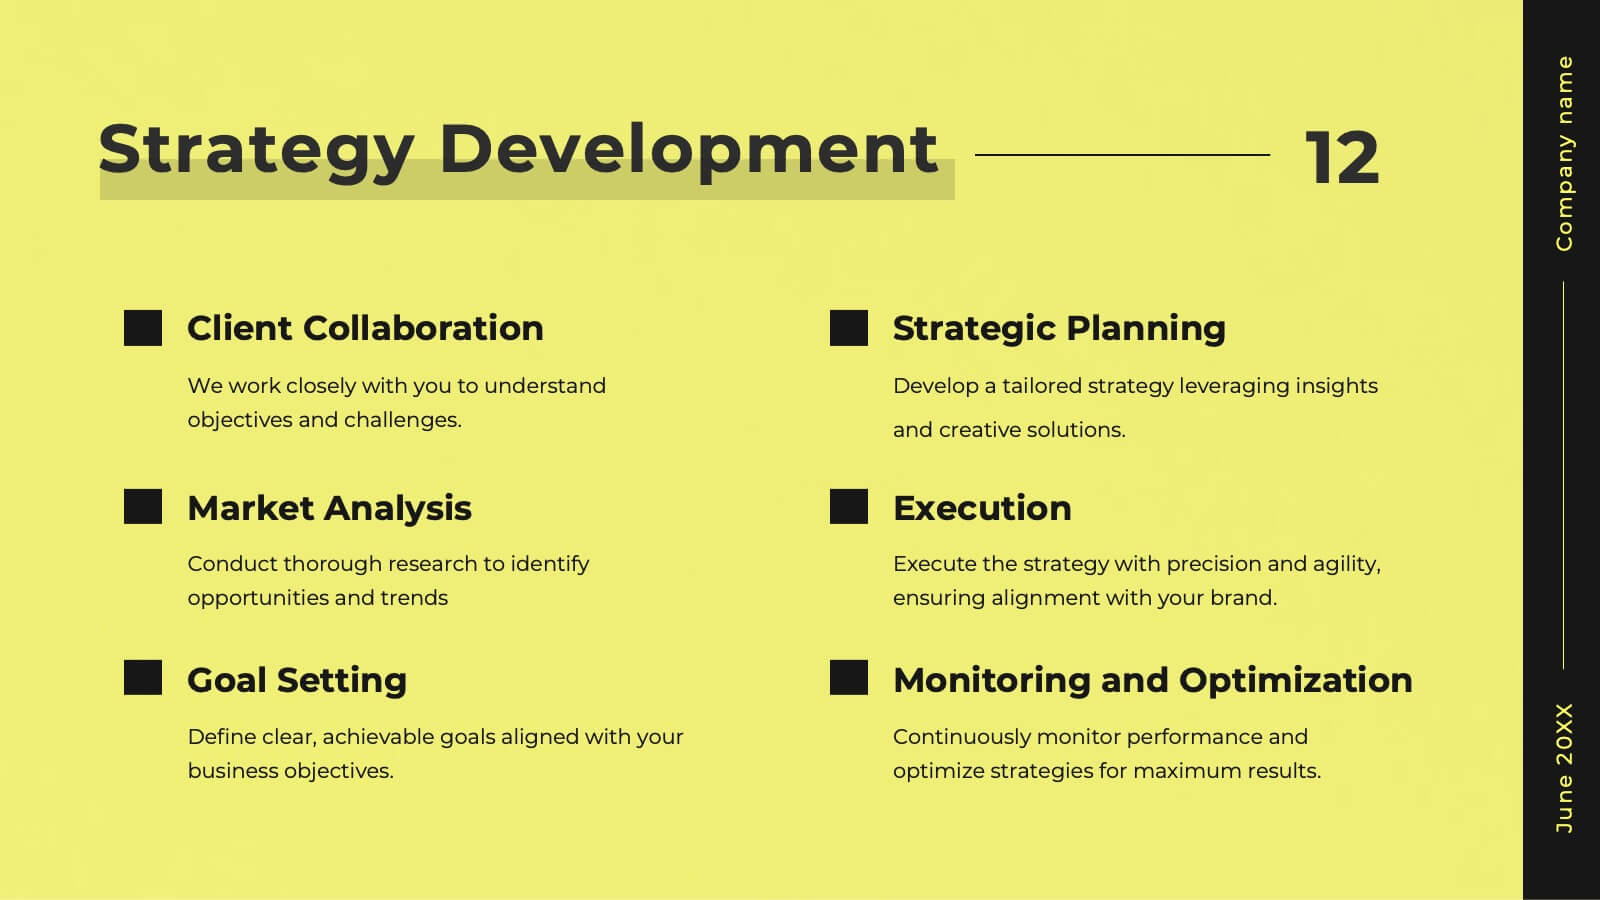
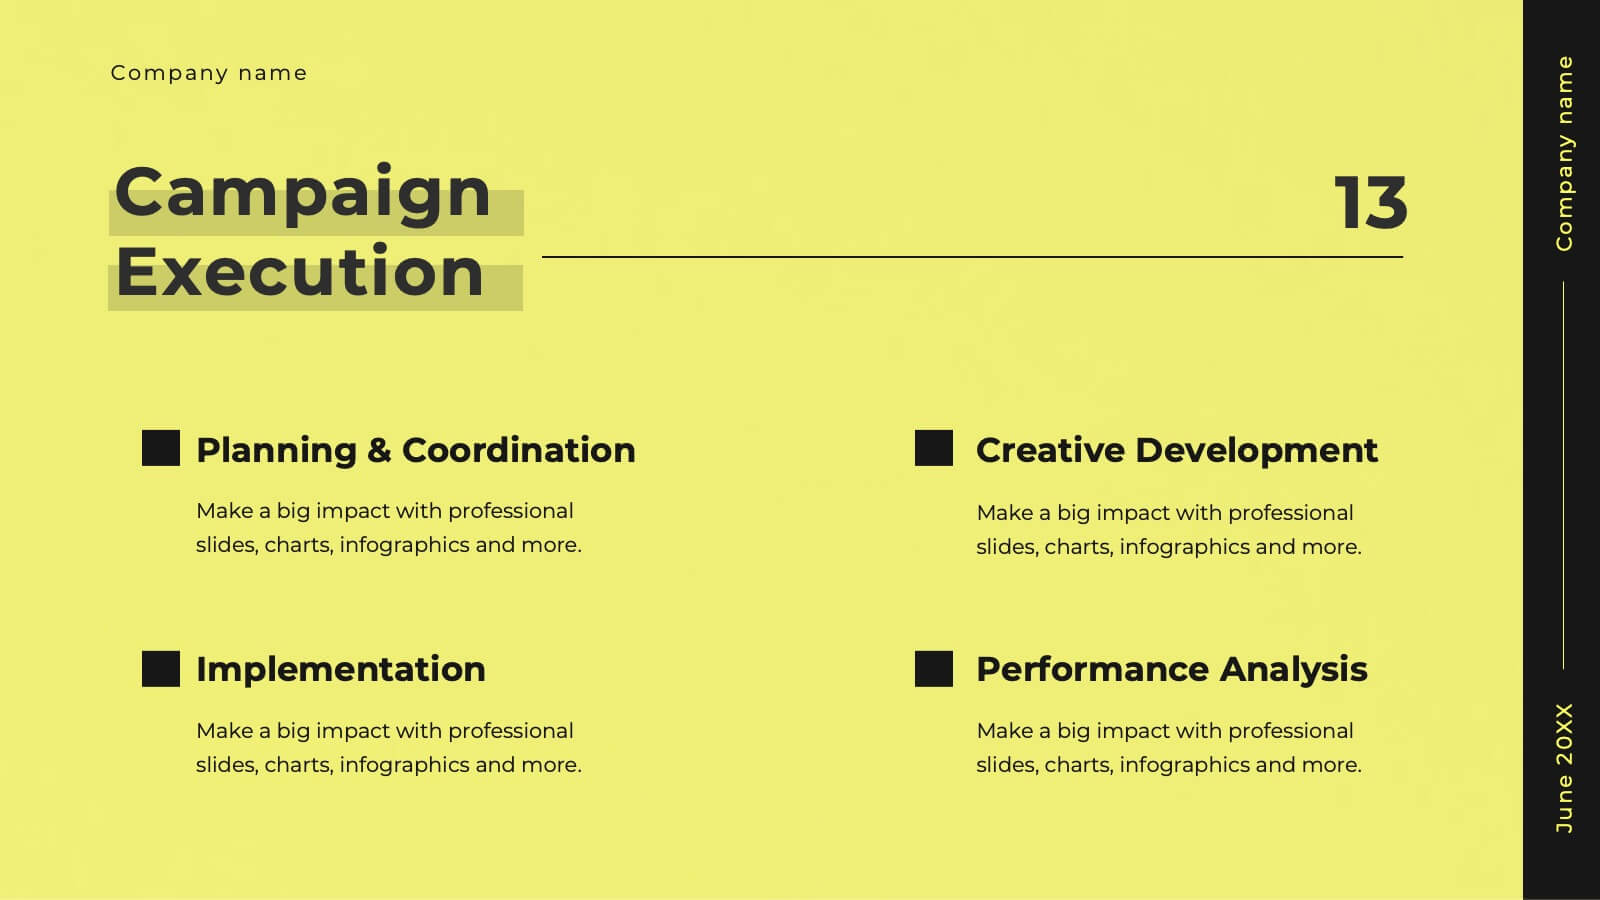
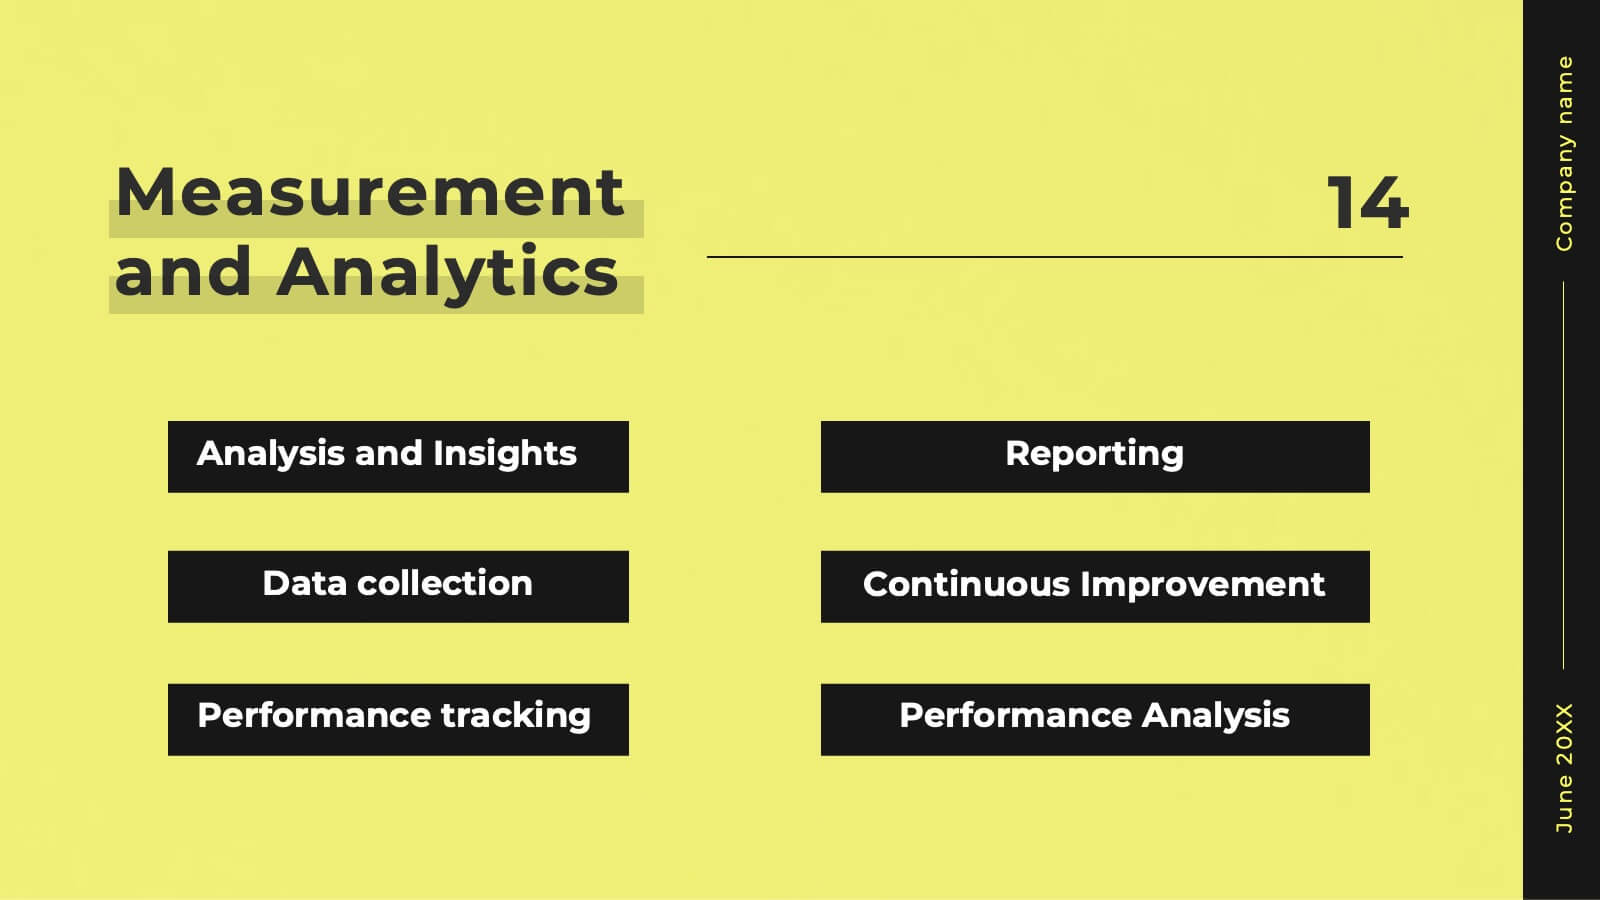
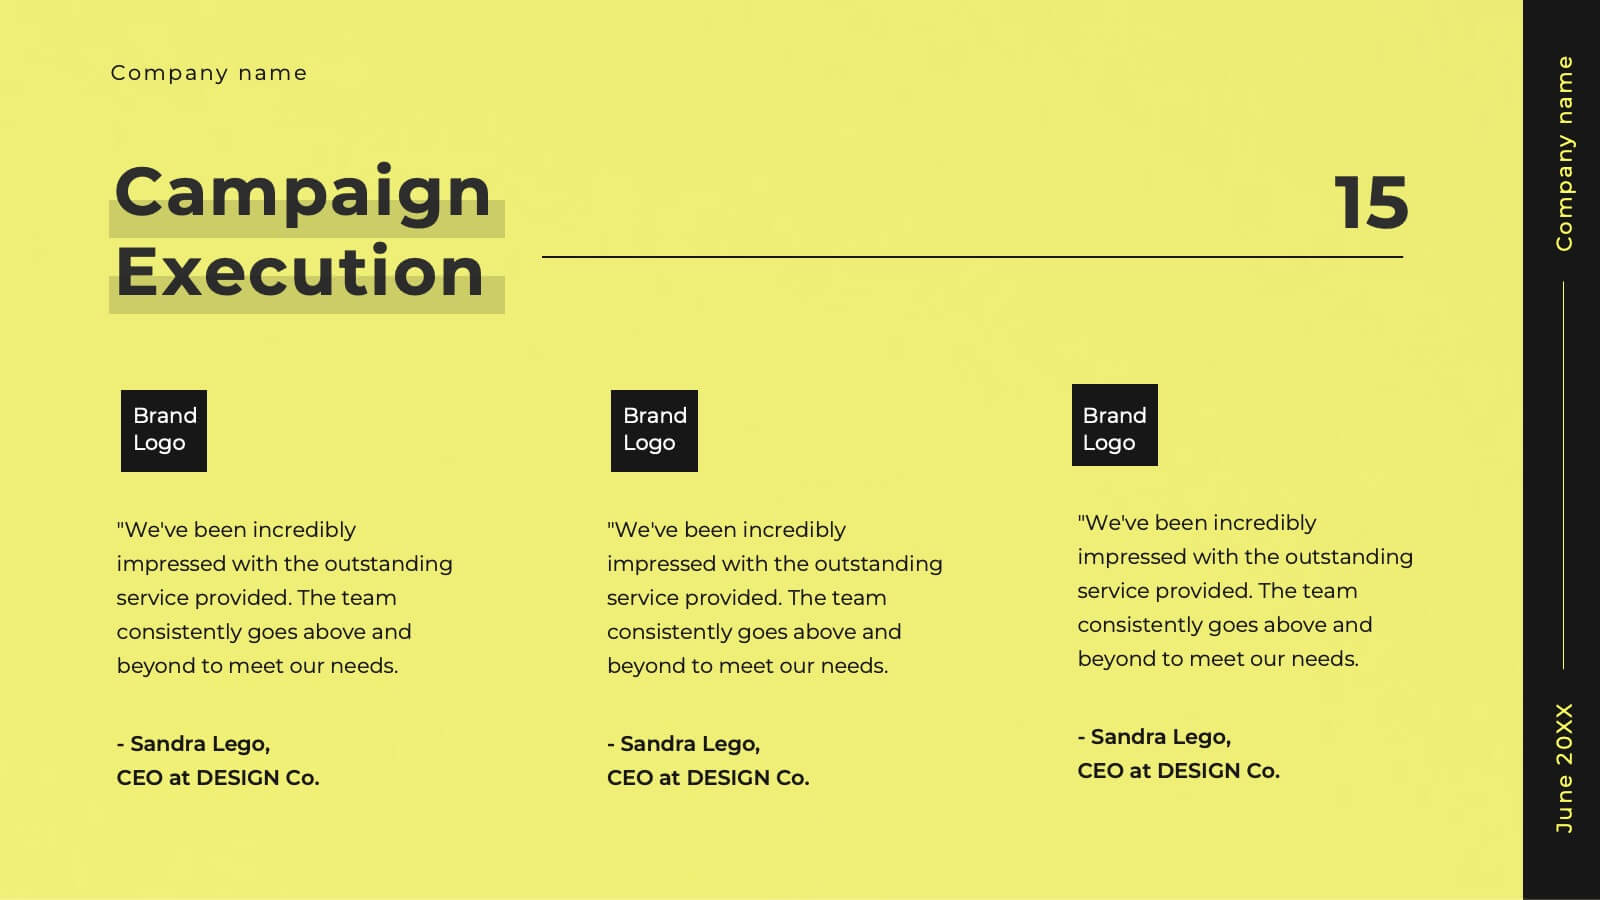
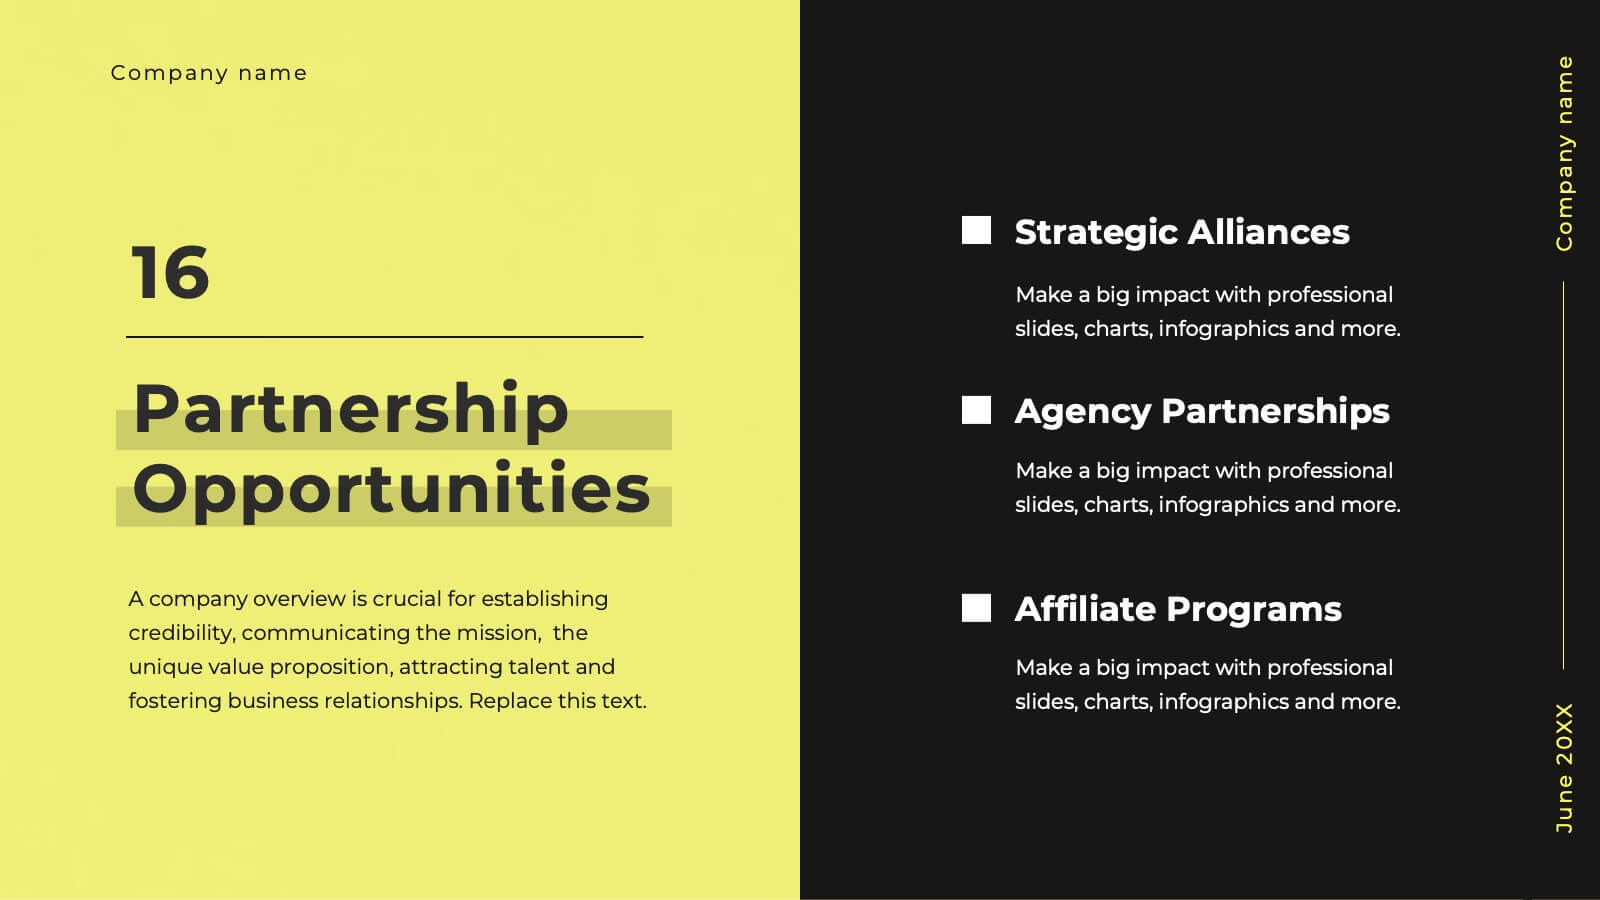
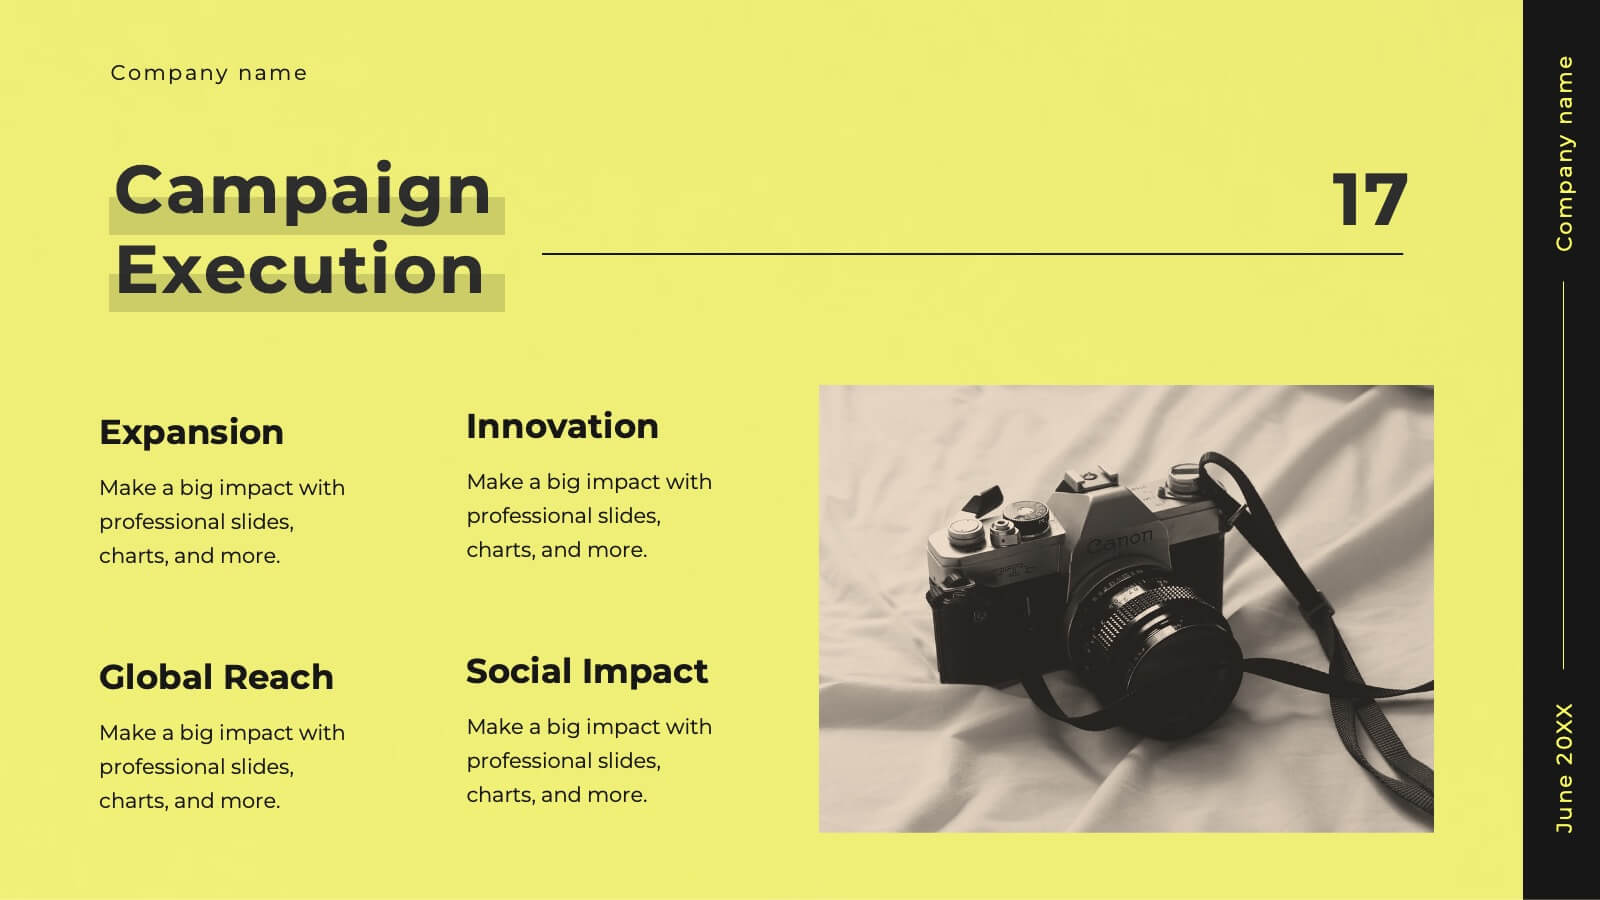
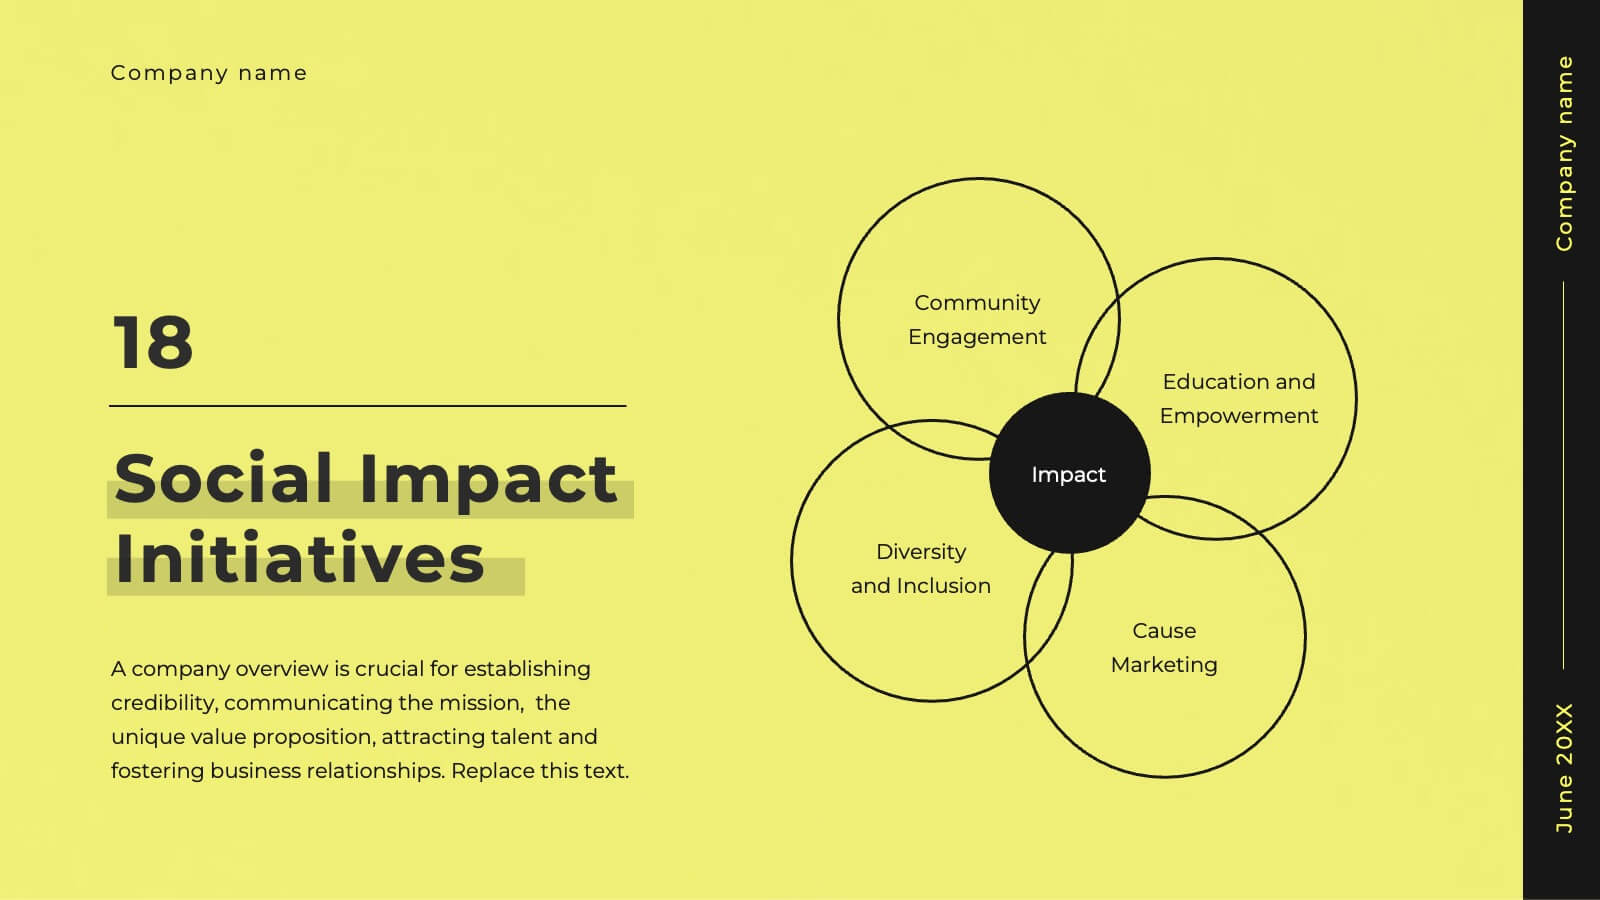
Glimmer Creative Agency Pitch Deck Presentation
Step up your game with this vibrant agency pitch deck template! Ideal for showcasing your services, client success stories, and strategic approach, it includes dynamic slides for market analysis and campaign execution. Engage potential clients with compelling visuals and well-organized content. Compatible with PowerPoint, Keynote, and Google Slides for a smooth presentation experience on any platform.


3 diapositivas
Clean Water Initiative Overview Presentation
Communicate sustainability goals with this clean, modern layout featuring water droplet and faucet visuals. Ideal for summarizing three core focus areas of your environmental or nonprofit program. The minimalist design keeps attention on your key points. Fully editable and compatible with PowerPoint, Keynote, and Google Slides for easy customization.


7 diapositivas
Annual Report Infographics Presentation Template
Annual reports are comprehensive documents designed to provide readers with information about a company's performance in the preceding year with a focus on all major aspects of its operations. They help investors, competitors and other stakeholders understand how well a business is performing. This template is designed to help users produce annual reports for their company. Annual reports provide insights into the company's direction in the preceding year. This template includes many features to make your document as professional as possible and includes various charts and graphs.


7 diapositivas
Business Plan Infographic Presentation Template
A business plan is a document that is prepared by entrepreneurs and analysts to support the decision of making a business venture. It typically helps individuals in raising capital and obtaining funds for their new ventures. A business plan often involves multiple steps that can be elaborate, sometimes difficult to explain during presentations in front of potential investors if not summarized properly. This is a comprehensive template that has all of the most important features of a well thought out business plan. This professional template that will present your plan in a sophisticated way.


5 diapositivas
Marijuana Industry Infographics
The Marijuana Industry refers to the cultivation, production, distribution, and sale of marijuana or cannabis-related products. These vertical infographics are designed to provide an overview of the marijuana industry. They offer a comprehensive look at the various aspects of the industry, including its history, growth, legalization, medical and recreational uses, and more. Inform and educate your viewers about the various aspects of the marijuana industry. Present data, trends, and insights related to the industry. This template is an effective tool for presenting key information about the marijuana industry in a visually engaging manner.


10 diapositivas
Financial Investment Strategy Presentation
Bring your financial ideas together with a clean, puzzle-style layout that instantly makes complex strategies feel organized and actionable. This presentation helps you explain key components, compare performance drivers, and present investment plans with clarity and confidence. Easy to edit and fully compatible with PowerPoint, Keynote, and Google Slides.


7 diapositivas
Editable Gantt Timeline Presentation
Stay on top of your project deadlines with this Editable Gantt Timeline Presentation. Designed with a clean monthly layout and six task rows, it makes scheduling and tracking progress simple. Customize task names, durations, and icons easily. Perfect for PowerPoint, Keynote, or Google Slides for professional project planning.


7 diapositivas
Development Team Infographic
The showcased slides are meticulously designed for development teams, aiming to present key project details, timelines, and development processes effectively. The templates utilize a mixture of sleek designs and intuitive layouts that help visualize the complexities of software development and project management. The selection includes various infographic styles that cater to different informational needs such as workflow diagrams, progress timelines, and team structures.These templates are essential for development teams to communicate their strategies, milestones, and team roles clearly. They allow for the integration of technical data in a user-friendly manner, which can be crucial during stakeholder presentations or team meetings. With options ranging from minimalistic to data-rich layouts, these slides support detailed reporting and strategic planning, ensuring that every member of the team and stakeholders are on the same page regarding the project’s progression and objectives. The use of modern graphics and customizable elements also ensures that these presentations can be adapted to match the branding and aesthetic of different companies.


5 diapositivas
Geometric Design Elements
Make your message stand out with this bold, 3D geometric infographic layout. Ideal for visualizing layered concepts, structural data, or multi-dimensional strategies. Each triangular section is color-coded and fully editable to align with your brand or topic. Compatible with PowerPoint, Keynote, and Google Slides.


5 diapositivas
Risk Analysis Bowtie Diagram Presentation
Visualize threats, controls, and consequences effectively with the Risk Analysis Bowtie Diagram Presentation. This dynamic template illustrates cause-and-effect relationships using a bowtie structure, making it ideal for safety audits, project risk planning, or corporate strategy. Fully customizable in PowerPoint, Keynote, and Google Slides for any industry.


4 diapositivas
Company Welcome and Overview Presentation
Set the tone for your business presentation with this professional welcome slide. Designed to introduce your company, services, or mission, it includes a customizable photo and clear text sections. Ideal for onboarding, team meetings, or proposals—fully editable in Canva, PowerPoint, or Google Slides for a polished first impression.