


Características


¿Tienes alguna pregunta?
Recomendar


5 diapositivas
HIV Prevention & Awareness Infographics
HIV Prevention and Awareness play a crucial role in combating the spread of the virus and reducing the impact of HIV/AIDS on individuals and communities. These infographic templates are designed to educate and raise awareness about HIV prevention and promote safer behaviors. These infographics provide a visually compelling way to present key information, statistics, and strategies related to HIV prevention and awareness. The templates features a range of eye-catching charts and icons that can be easily customized to suit your specific needs. Compatible with PowerPoint, Keynote, and Google Slides.

21 diapositivas
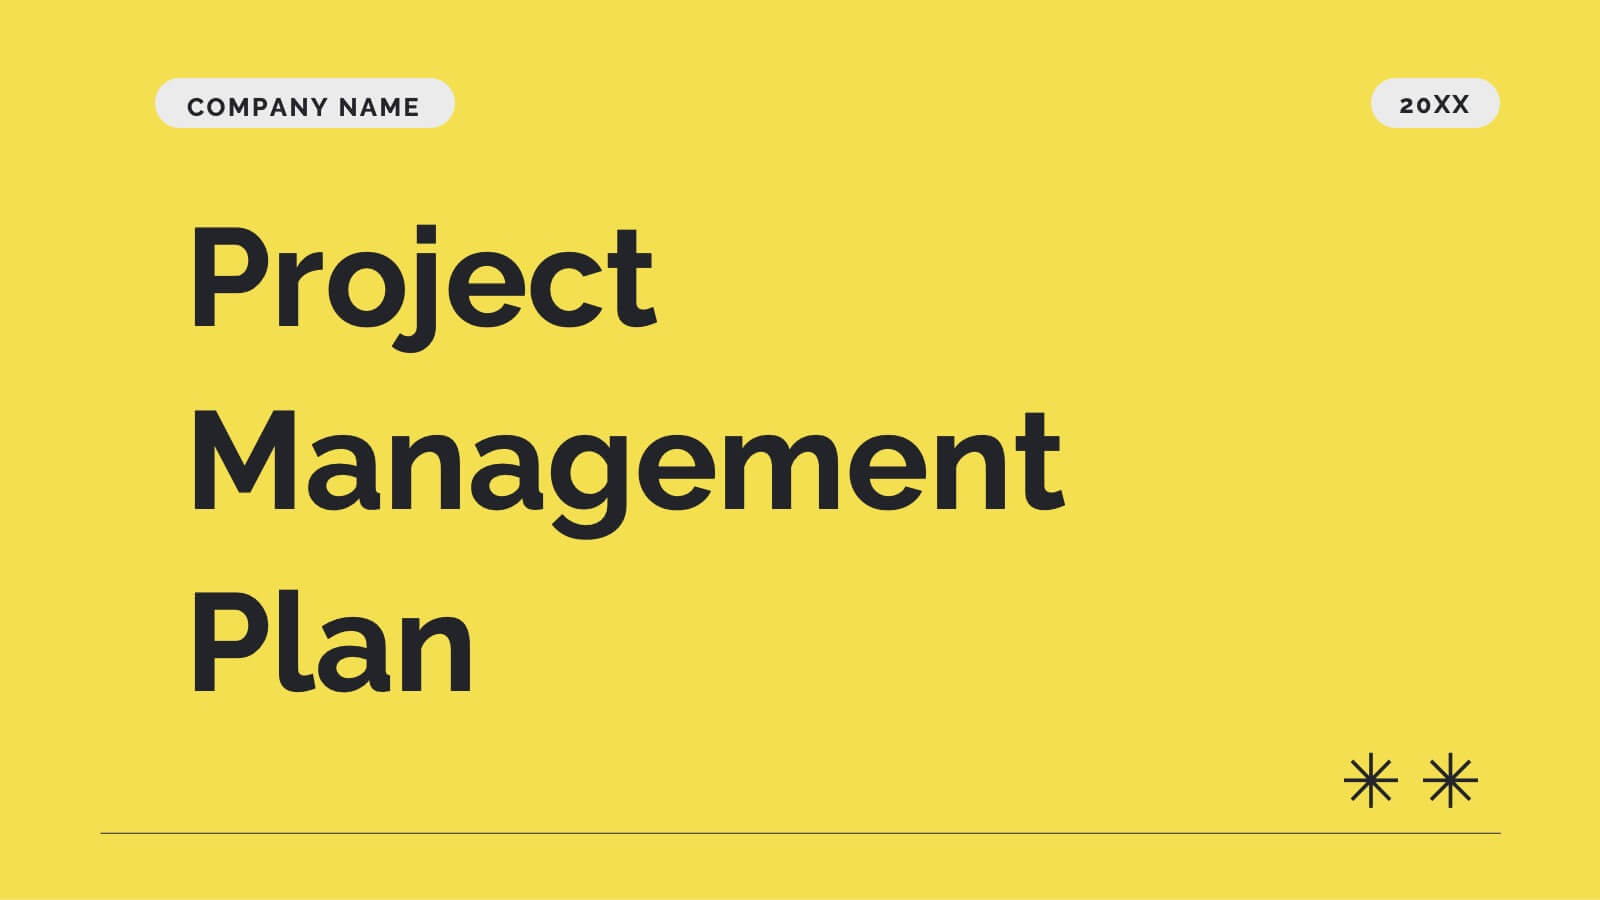
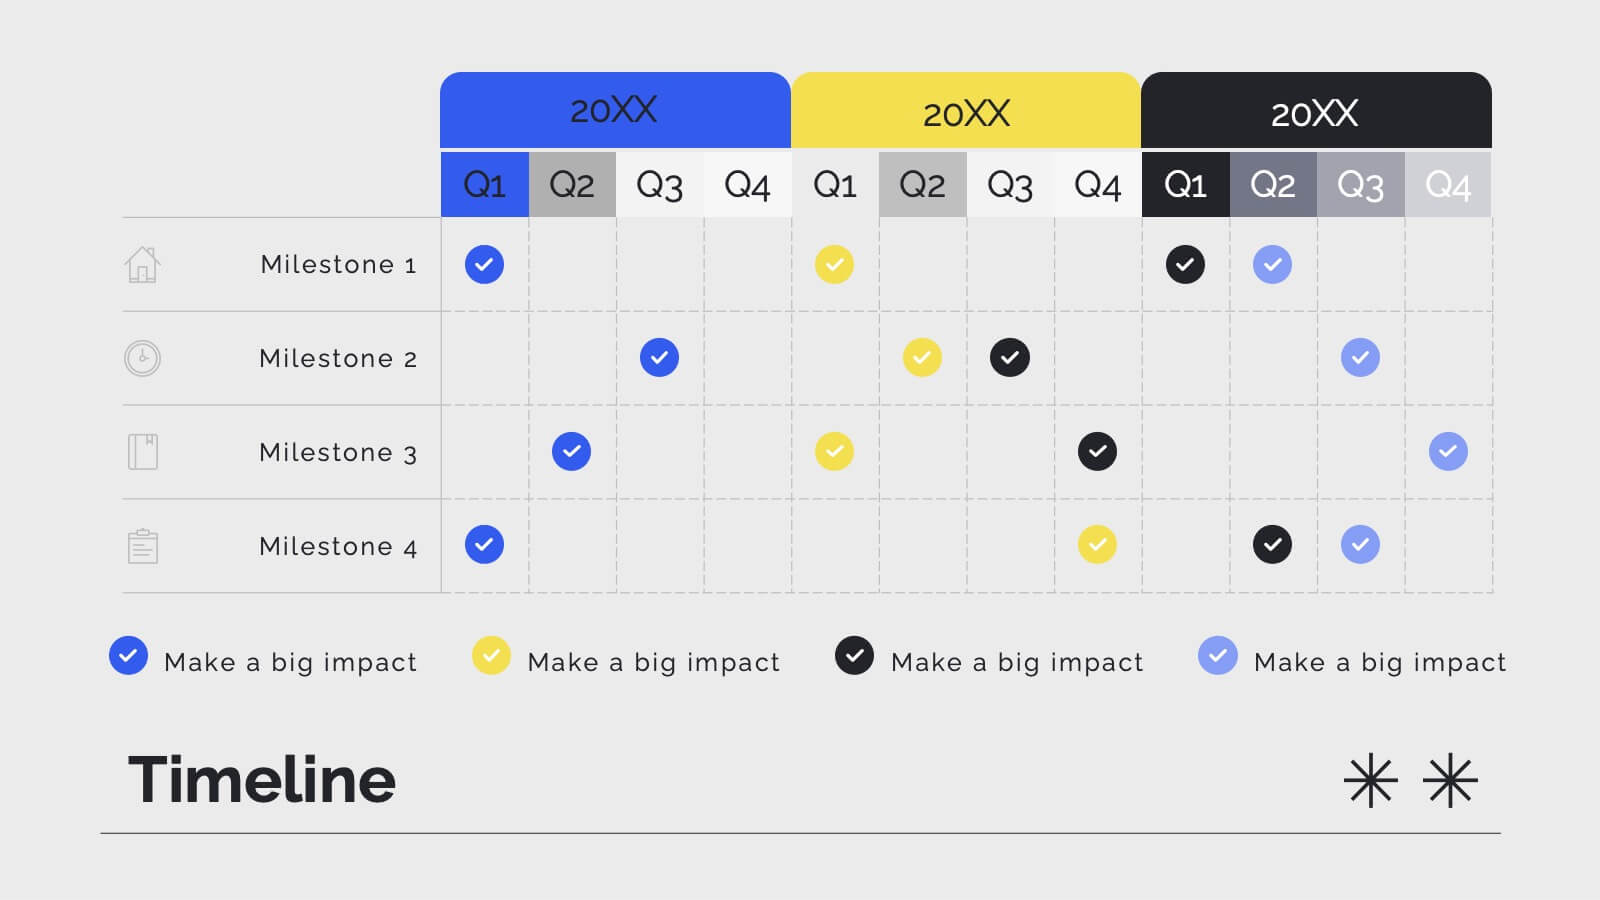
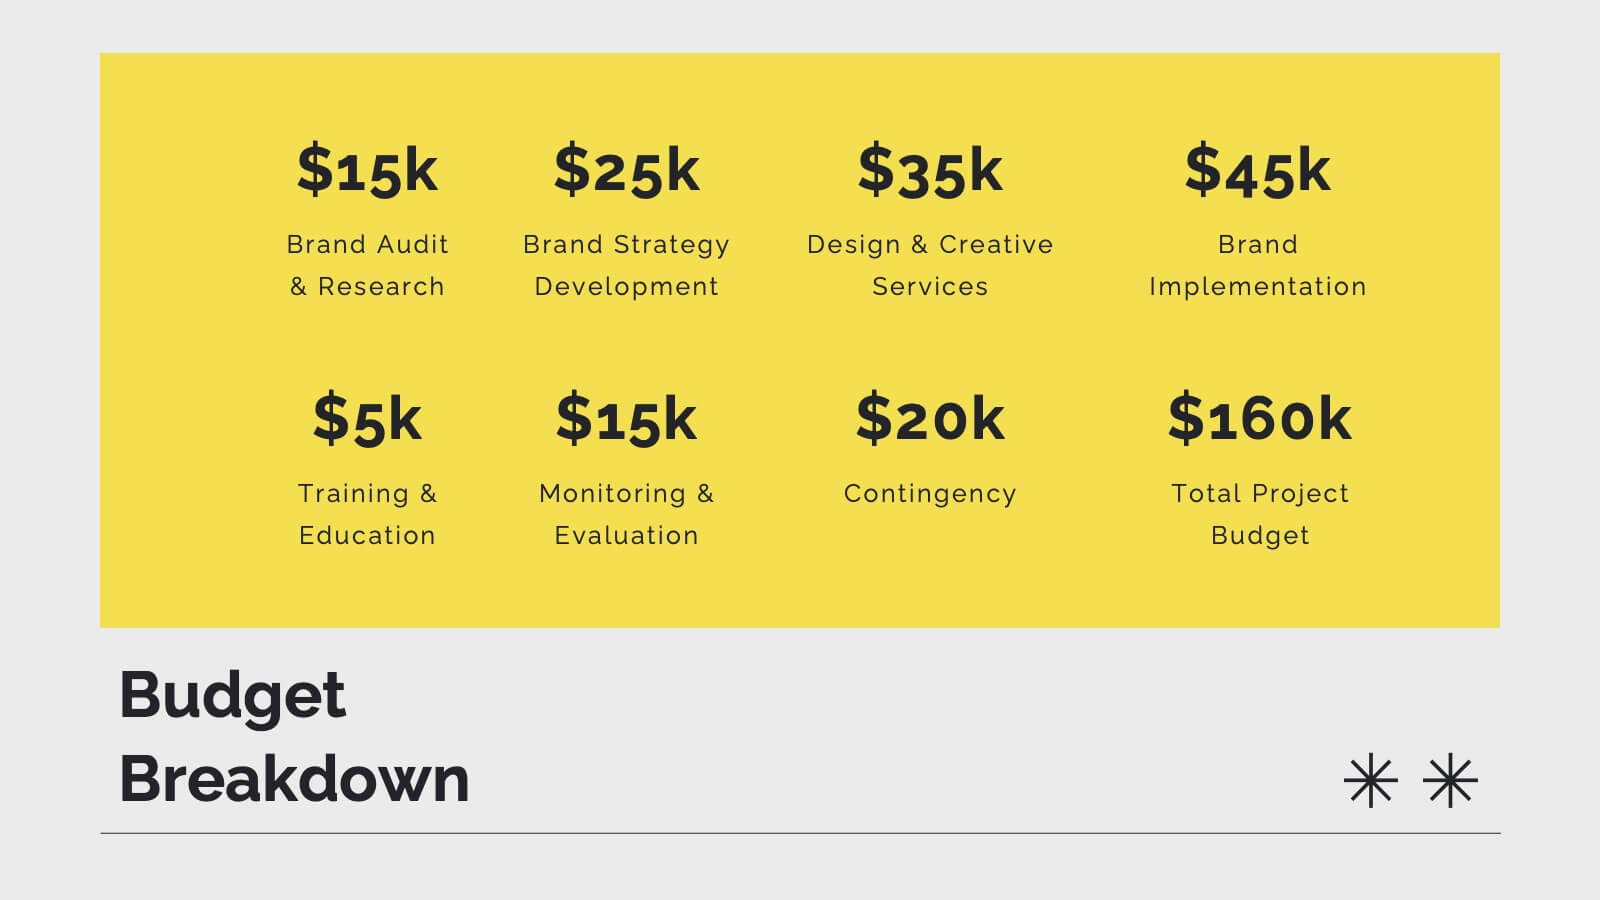
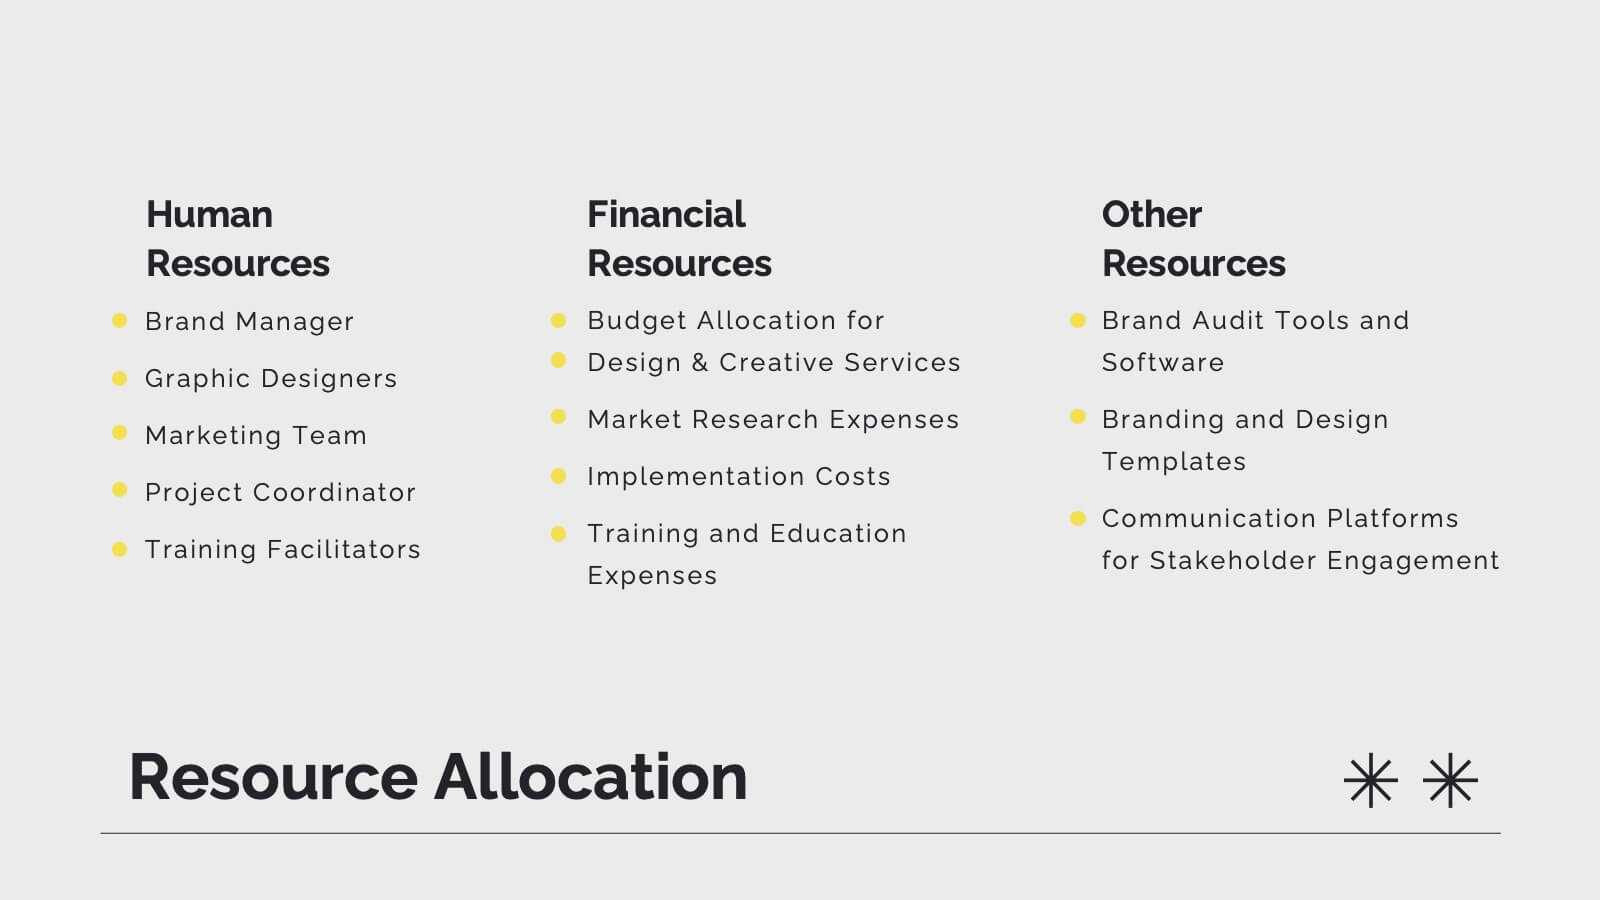
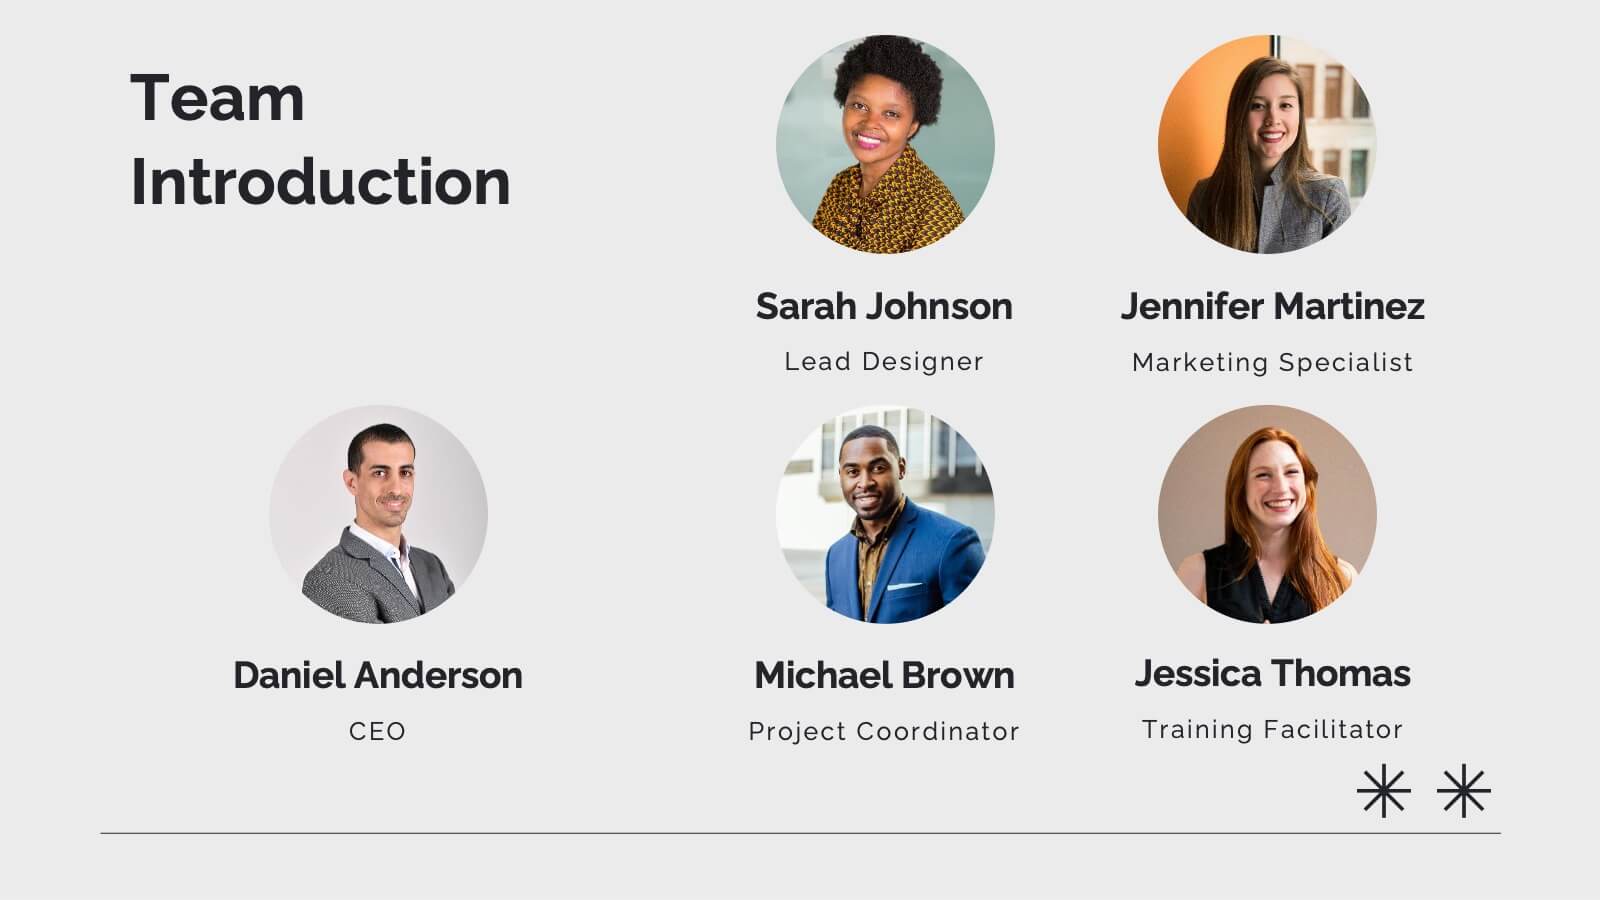
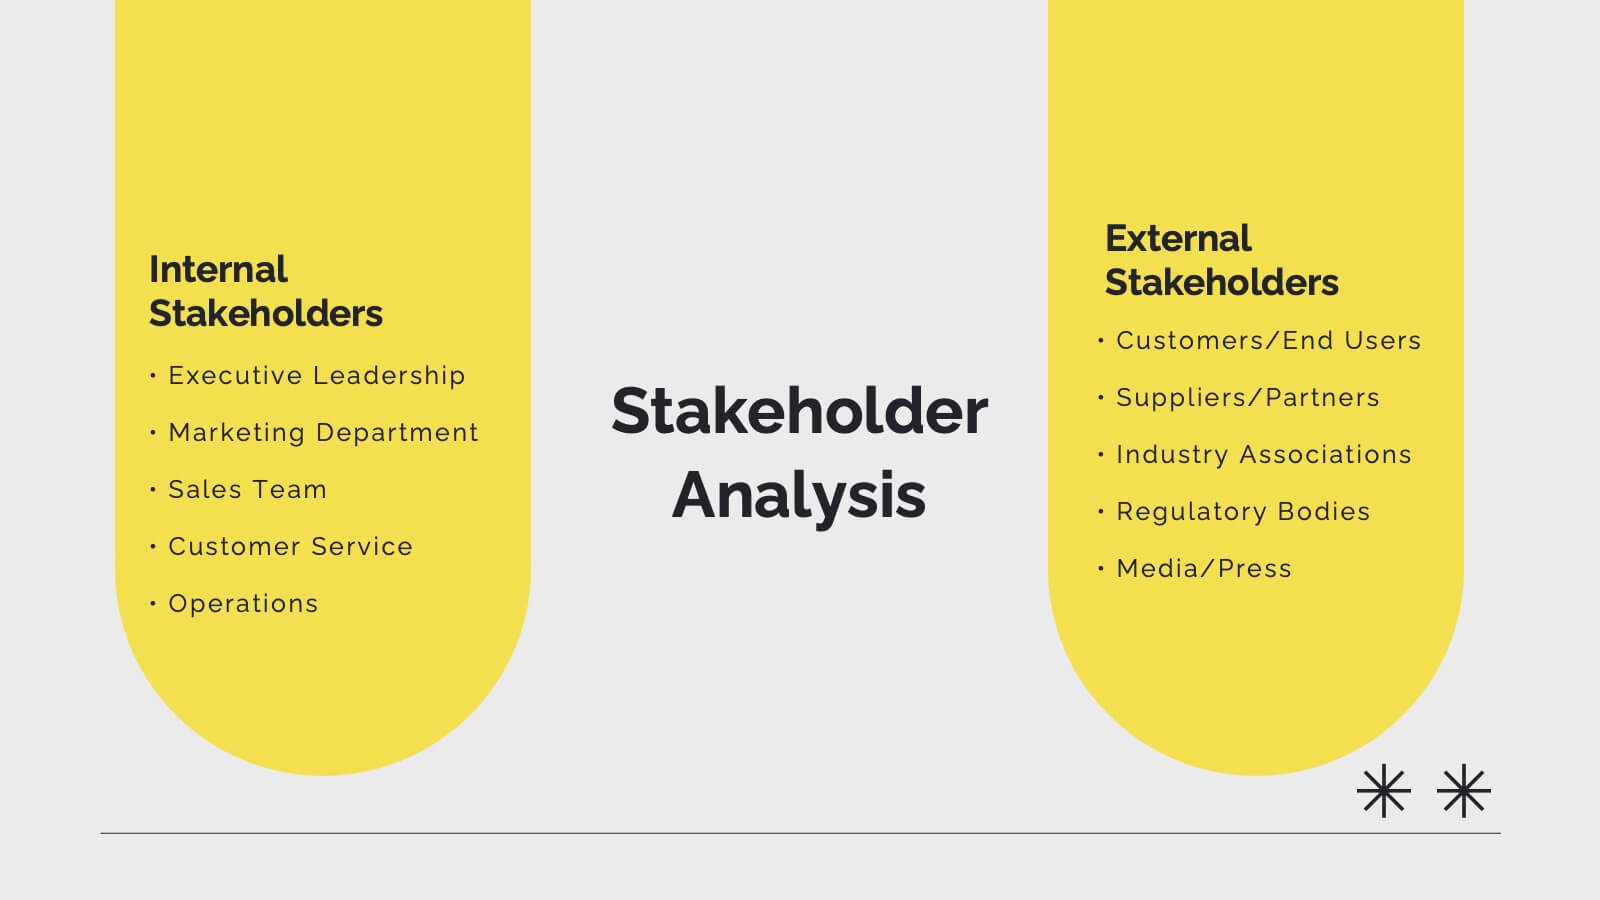
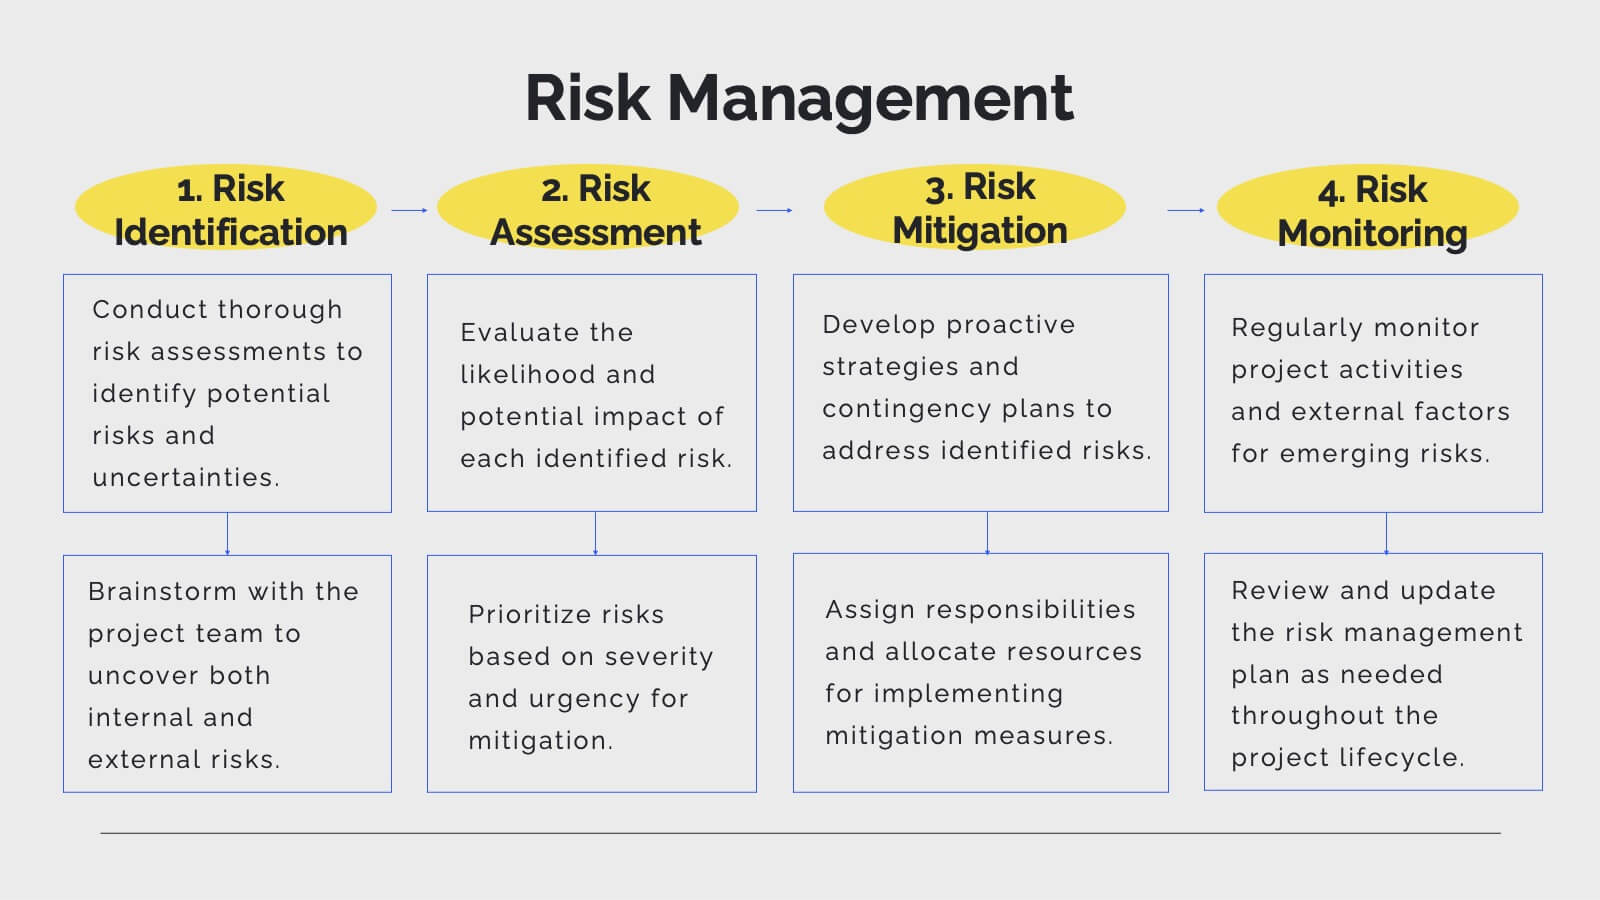
Pulse Project Management Plan Presentation
Streamline your project management with this vibrant template. It covers project overview, objectives, deliverables, methodology, timeline, budget, and risk management. Perfect for clear and engaging presentations. Compatible with PowerPoint, Keynote, and Google Slides for seamless customization.


2 diapositivas
Target Audience and Persona Development Presentation
Bring your audience straight into the heart of your ideal customer with a vibrant, story-focused slide that highlights goals, motivations, data insights, and key pain points. This presentation makes it easy to communicate who you’re targeting and why it matters. Fully compatible with PowerPoint, Keynote, and Google Slides.


21 diapositivas
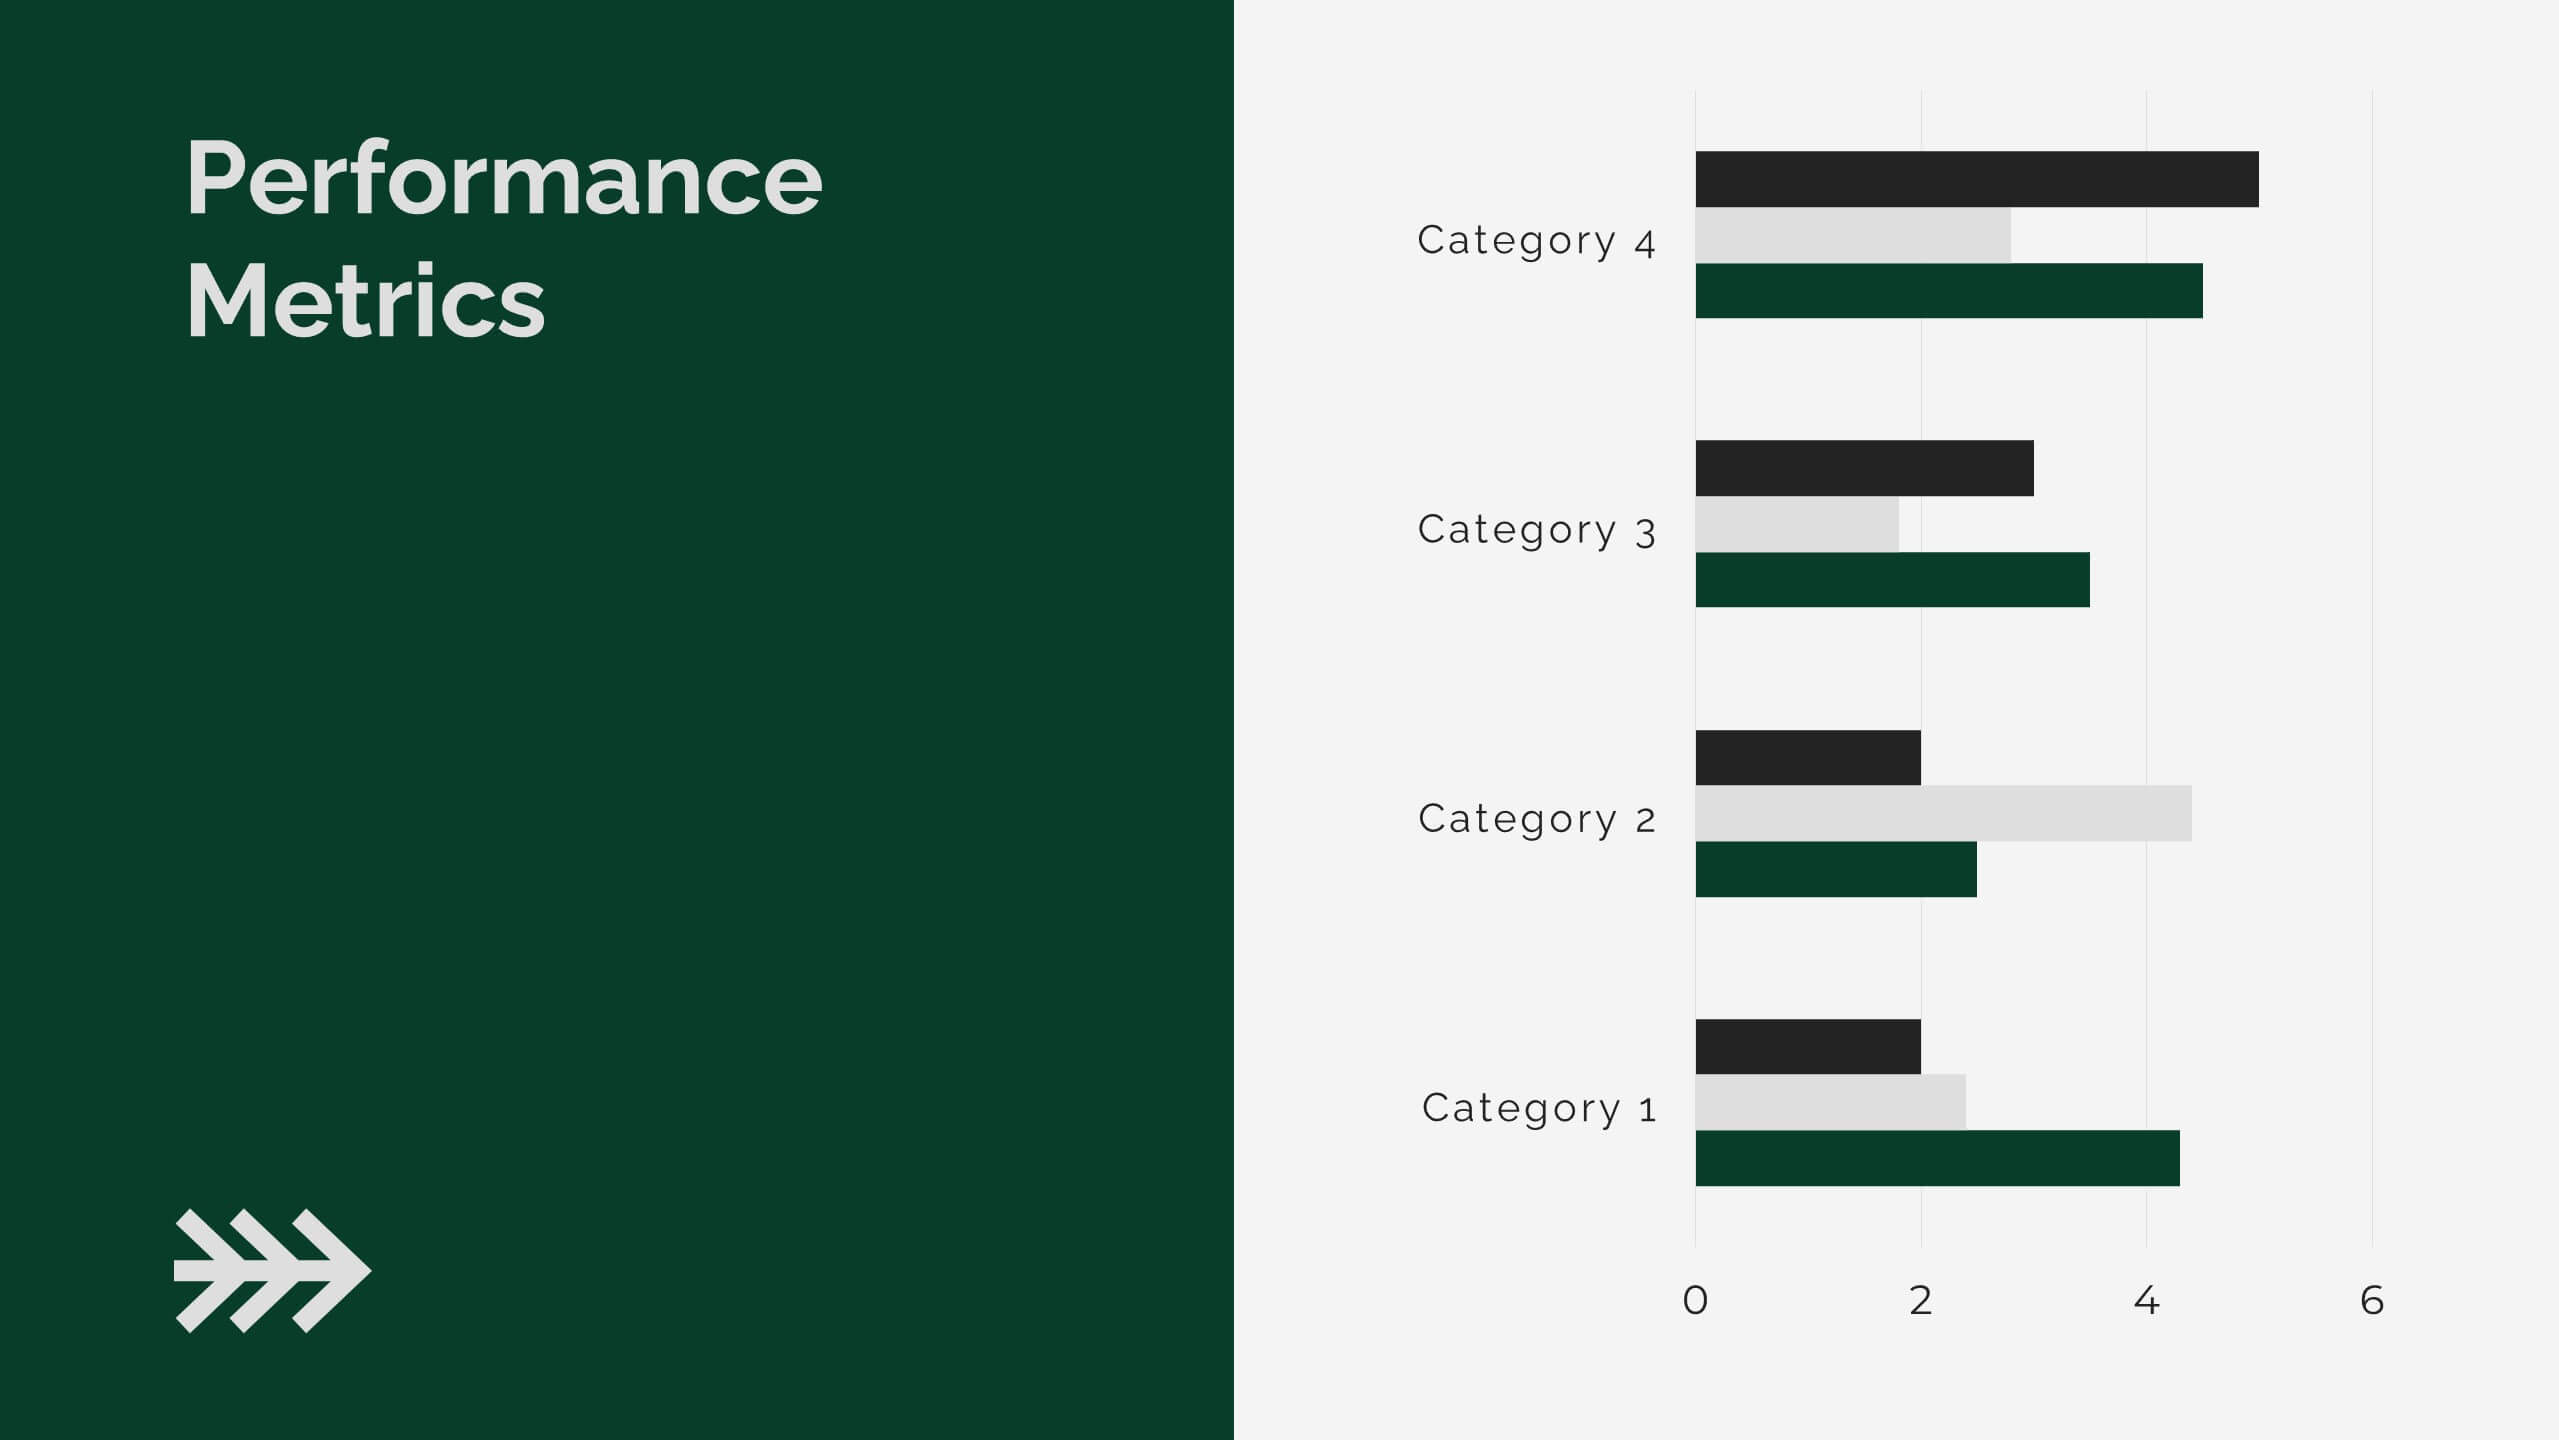
Manticore Financial Report Presentation
This financial report template features a sleek, modern design for presenting key highlights, performance metrics, and financial summaries. It includes sections for market trends, competitor insights, and strategic initiatives. Fully customizable and compatible with PowerPoint, Keynote, and Google Slides, it's perfect for delivering impactful financial presentations with clarity and style.


4 diapositivas
Strategic Project Proposal Plan Presentation
Plan with Precision! The Strategic Project Proposal Plan Presentation helps you outline key objectives, strategies, and milestones with a structured, professional design. Perfect for project managers, consultants, and business leaders, this template ensures clarity and impact. Fully editable and compatible with PowerPoint, Keynote, and Google Slides for effortless customization.


26 diapositivas
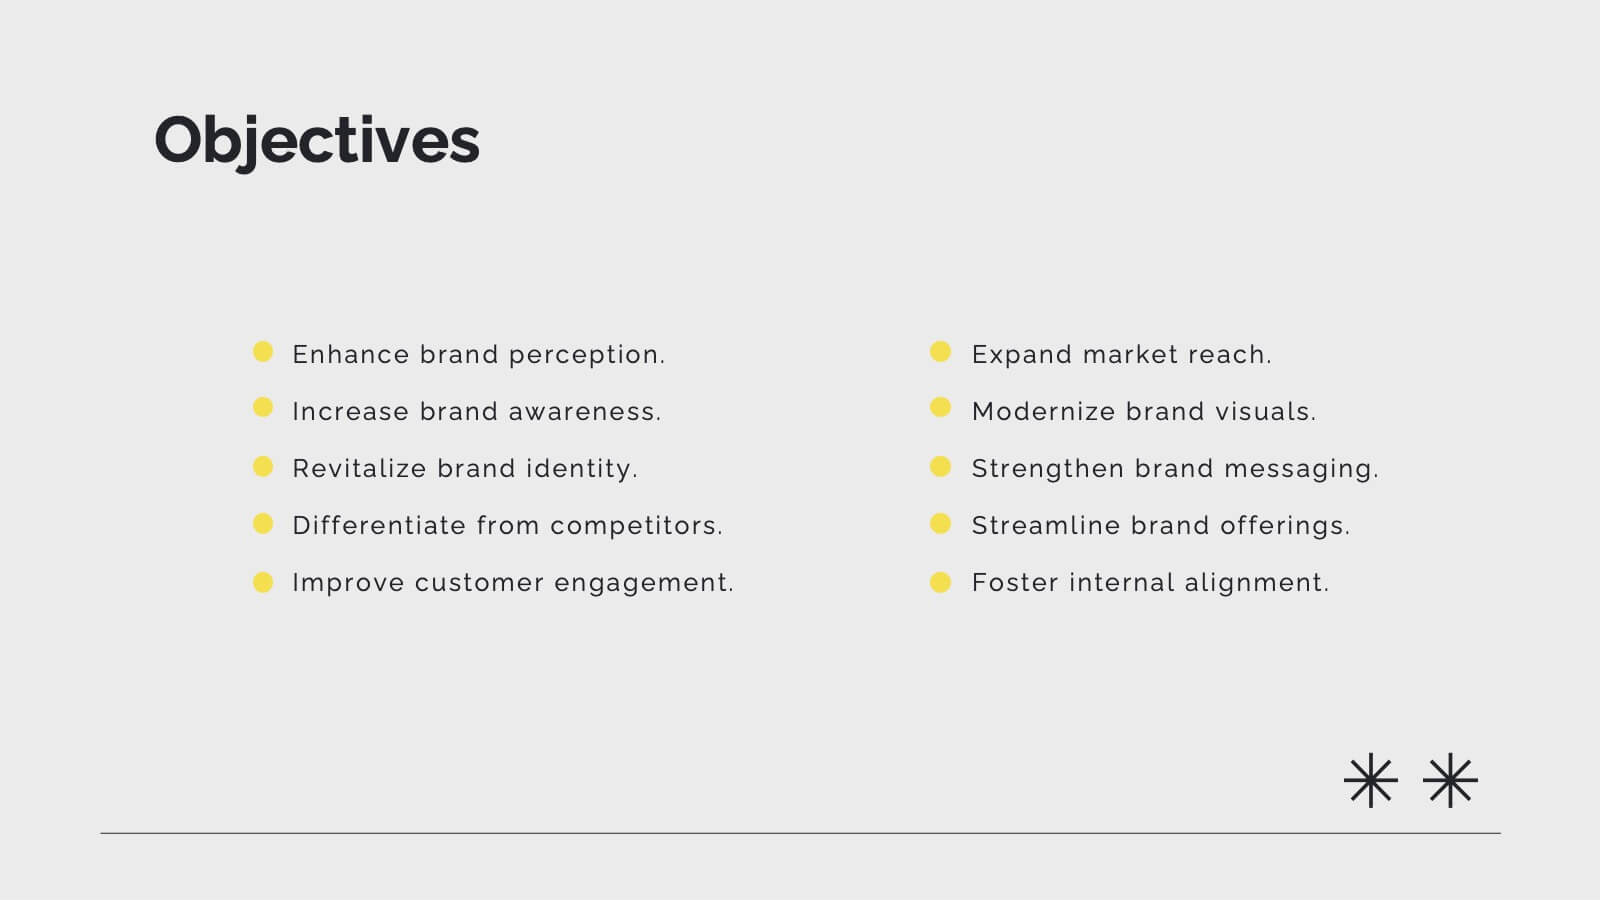
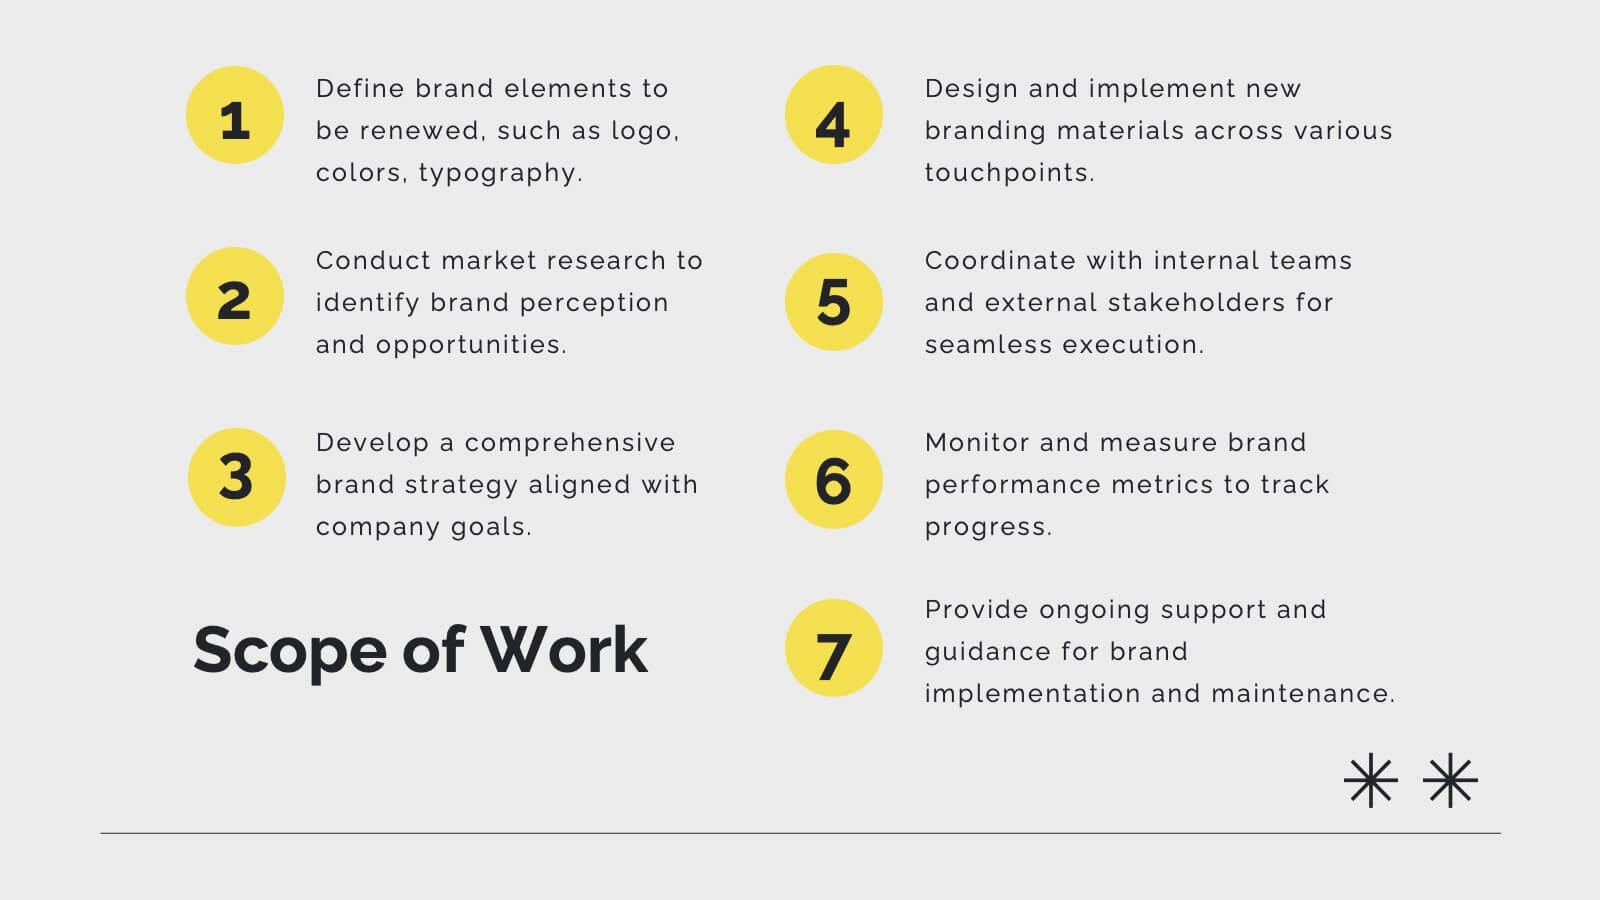
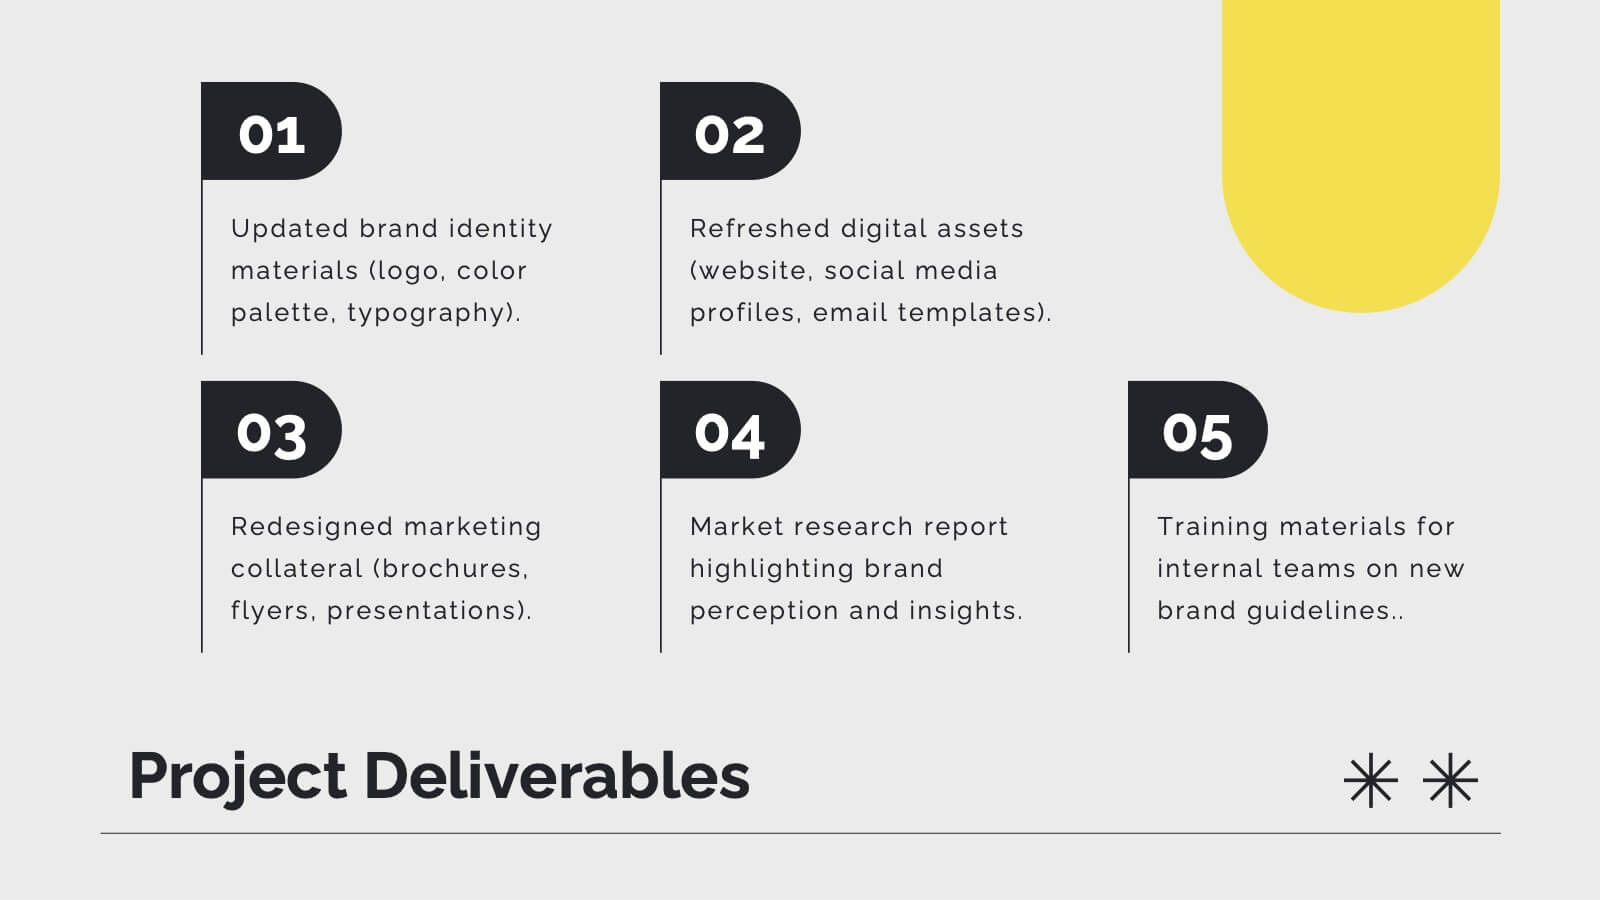
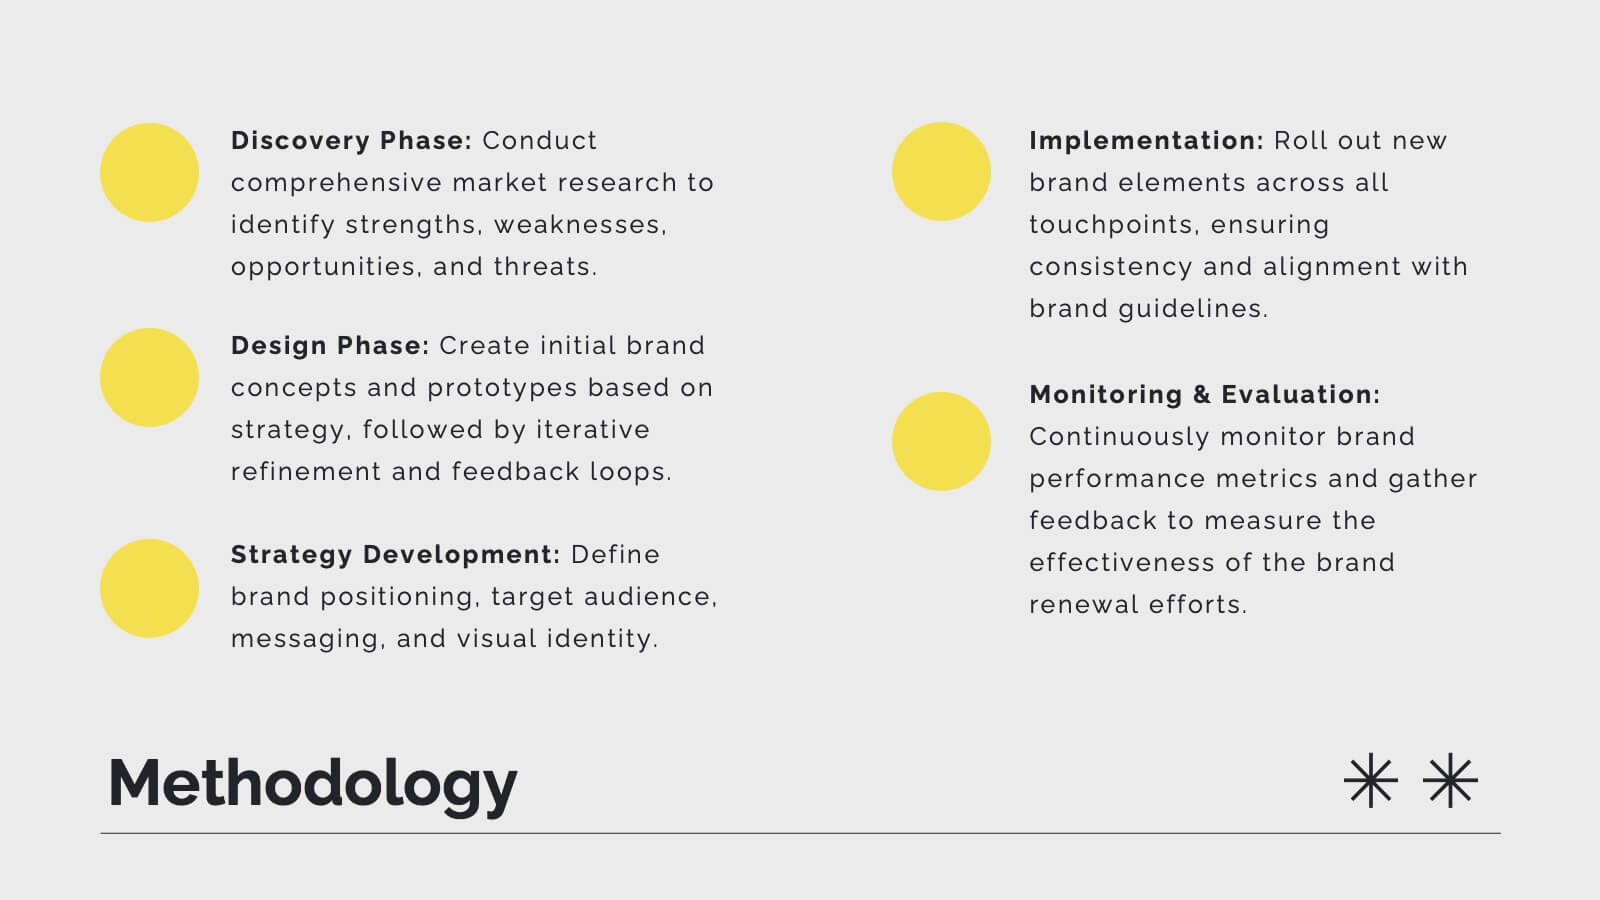
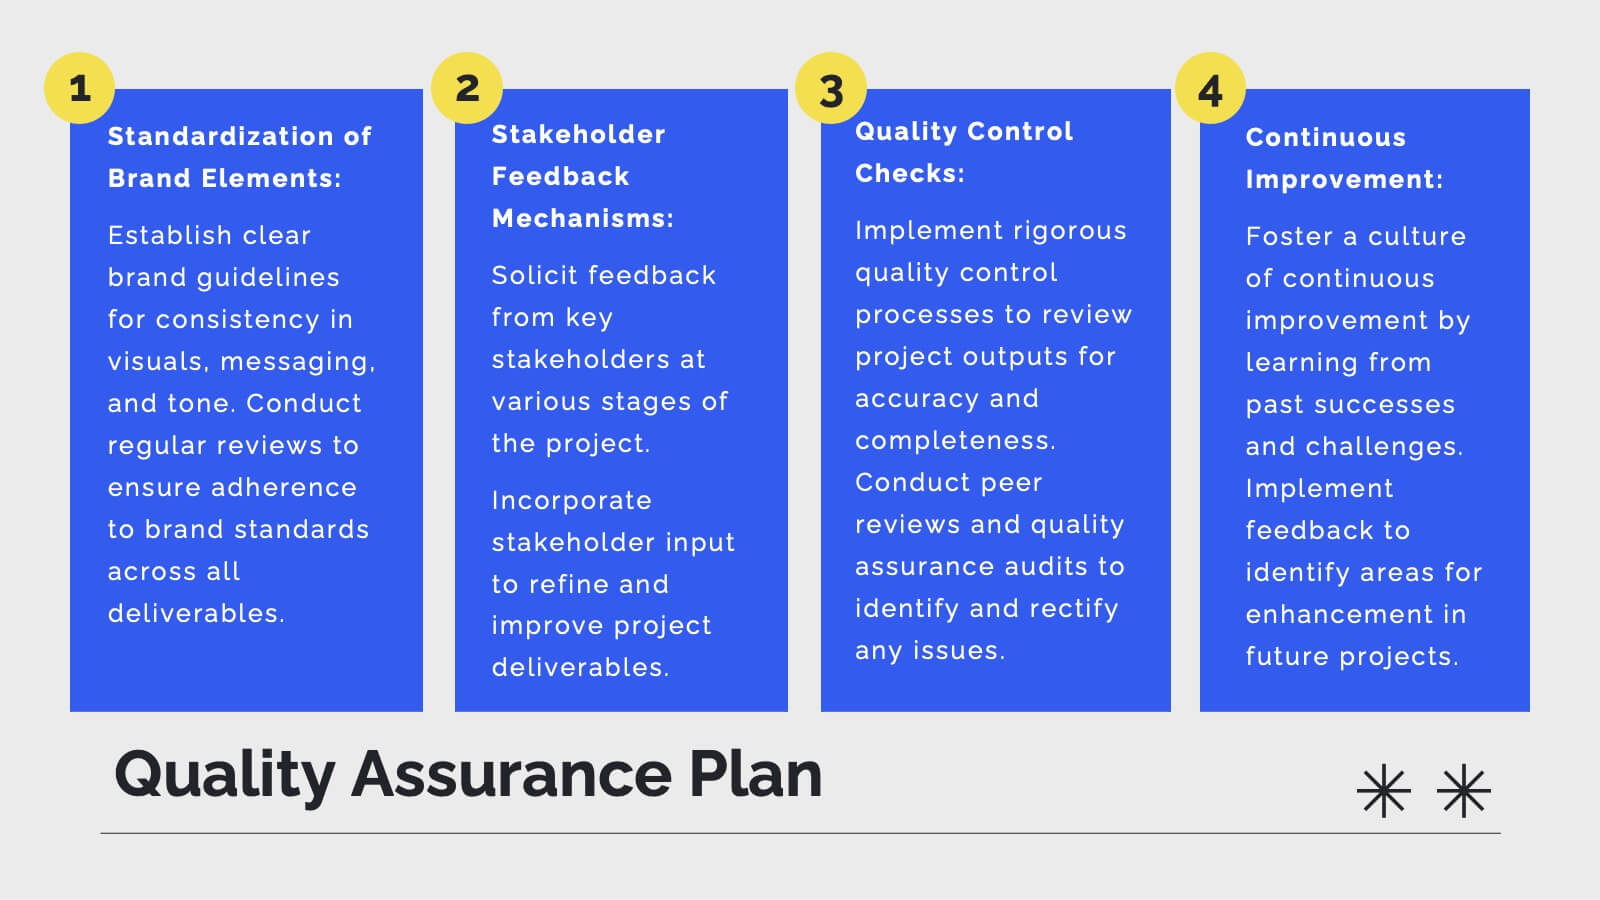
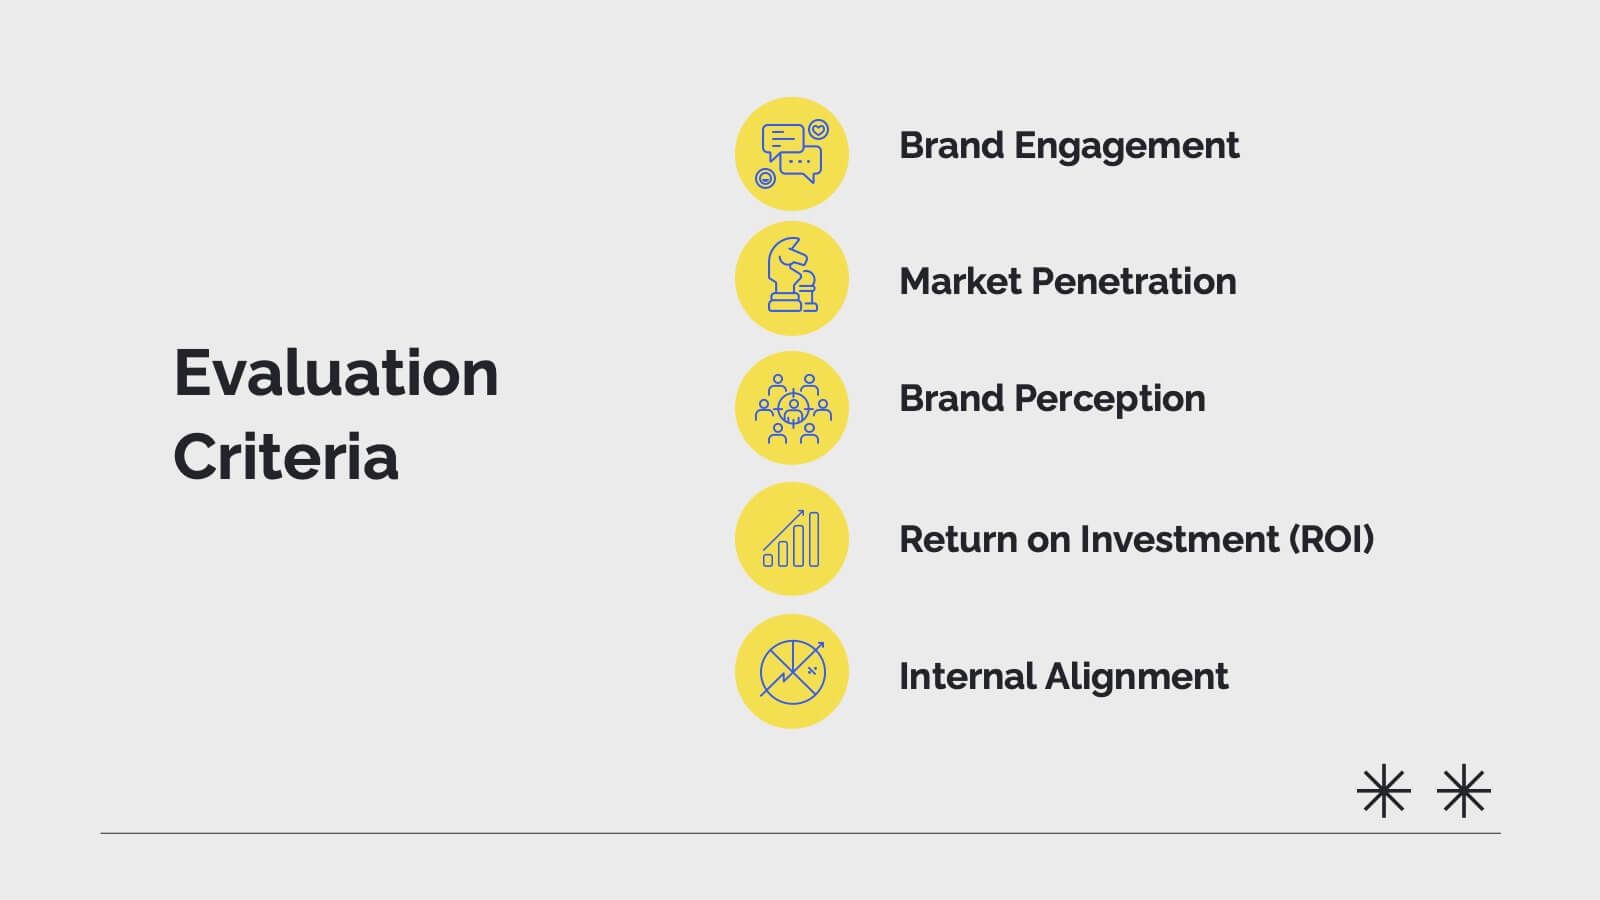
Salus Rebranding Project Plan Presentation
This rebranding project plan template offers a clear framework for presenting brand identity transformation. Covering brand values, identity components, target audience, positioning, and guidelines, it’s ideal for companies refreshing their brand. Compatible with PowerPoint, Keynote, and Google Slides, it ensures a streamlined, professional presentation of your rebranding strategy.


5 diapositivas
CBD Oil Infographics
CBD oil, also known as cannabidiol oil, is a natural extract derived from the cannabis plant. These infographic templates can effectively present information about CBD oil in an engaging and informative manner, allowing your audience to grasp the potential benefits and practical considerations associated with its use. It is designed to educate and inform the audience about the uses, benefits, and considerations related to CBD oil. The infographics are fully customizable with visually appealing vibrant colors, relevant icons, and eye-catching layouts to capture your audience's attention.


4 diapositivas
Audience Demographic Profile Overview
Present audience composition with clarity using the Audience Demographic Profile Overview Presentation. This slide is designed to showcase gender-based or group-specific data through visual figures, percentage markers, and supporting bar charts. Ideal for marketers, analysts, and researchers who need to communicate user distribution and behavior insights. Fully editable in PowerPoint, Keynote, and Google Slides.


6 diapositivas
Scientific Experiment Presentation Template Presentation
Showcase your research with clarity using this Scientific Experiment Presentation Template. Featuring lab-themed visuals like microscopes and molecular diagrams, it’s perfect for sharing hypotheses, procedures, and results. Ideal for science professionals and students, this editable deck works seamlessly with PowerPoint, Keynote, and Google Slides for compelling, educational presentations.


7 diapositivas
Law Infographics Presentation Template
Featuring our Law Infographic template it is a modern and stylish template for making a presentation about law. It comes with a clean design, typography and plenty of space for annotations and is compatible with powerpoint. This template is suitable for a presentation about business, management, finance or marketing. It contains a one page design, illustrations and many different elements to help you build a strong and compelling presentation. Essential and easy to use, this law Infographic template is a great tool for anyone who wants to make an attractive and professional presentation.


27 diapositivas
Drift Rebranding Project Plan Presentation
Transform your brand with this comprehensive rebranding project template! Perfect for presenting brand identity, market analysis, and strategic positioning, it includes slides for logos, color palettes, and brand guidelines. Engage your audience with visually striking designs and detailed content. Compatible with PowerPoint, Keynote, and Google Slides for easy, professional presentations on any platform.


10 diapositivas
Brain Function Infographic Presentation
Explore cognitive processes with the Brain Function Infographic. Featuring a layered human head design, this visual template highlights four key functions, making it ideal for psychology, neuroscience, and decision-making presentations. Fully customizable with editable colors, text, and icons. Compatible with PowerPoint, Keynote, and Google Slides for seamless presentation use.


6 diapositivas
Threat and Mitigation Bowtie Model
Break down complex threats and responses with the Threat and Mitigation Bowtie Model Presentation. This infographic visualizes the relationship between root causes, a central hazard event, and its potential consequences—alongside the controls that mitigate them. Clean, editable layouts and multiple visual states let you emphasize either side of the bowtie. Ideal for risk assessments, business continuity planning, and safety presentations. Compatible with PowerPoint, Keynote, and Google Slides.


6 diapositivas
6-Step Business Process Presentation
Clearly map out workflows with this 6-step business process presentation. Ideal for project managers and strategists, this horizontal timeline helps break complex tasks into digestible phases. With editable icons, color highlights, and step-by-step layout, it's easy to customize in PowerPoint, Keynote, or Google Slides for any professional setting.


2 diapositivas
Long-Term Vision Strategy Presentation
Spark forward momentum with a clean, modern slide that turns long-range planning into a story your audience can instantly follow. This presentation helps teams outline future goals, strategic priorities, and the actions needed to stay aligned over time. Fully compatible with PowerPoint, Keynote, and Google Slides.


4 diapositivas
Annual Calendar Layout for Projects
Plan your year like a pro with this clean and colorful visual layout—it’s designed to help you stay focused, organized, and on track month by month. Whether you're mapping out team projects, campaign milestones, or business goals, this annual calendar format makes it easy to see everything at a glance. Fully compatible with PowerPoint, Keynote, and Google Slides.


4 diapositivas
Team Planning and Event Calendar
Turn chaos into coordination with this visual-first layout that simplifies how your team plans, tracks, and communicates project milestones. Each calendar block highlights key players, deadlines, and status updates—perfect for keeping everyone aligned and informed at a glance. Fully compatible with PowerPoint, Keynote, and Google Slides.