


Características


¿Tienes alguna pregunta?
Recomendar


7 diapositivas
Strategy Wheel Options Infographic Presentation
A Strategy Wheel Infographic is a visual tool that helps organizations develop and communicate their strategic plans. This template uses a circular diagram that breaks down the elements of a strategy into categories or segments, with each segment representing a different aspect of the plan. This infographic includes a central circle that represents the organization's overall goal, surrounded by smaller circles or segments that represent specific strategies or tactics. Each segment may include additional information such as goals, objectives, key performance indicators, and action items.


21 diapositivas
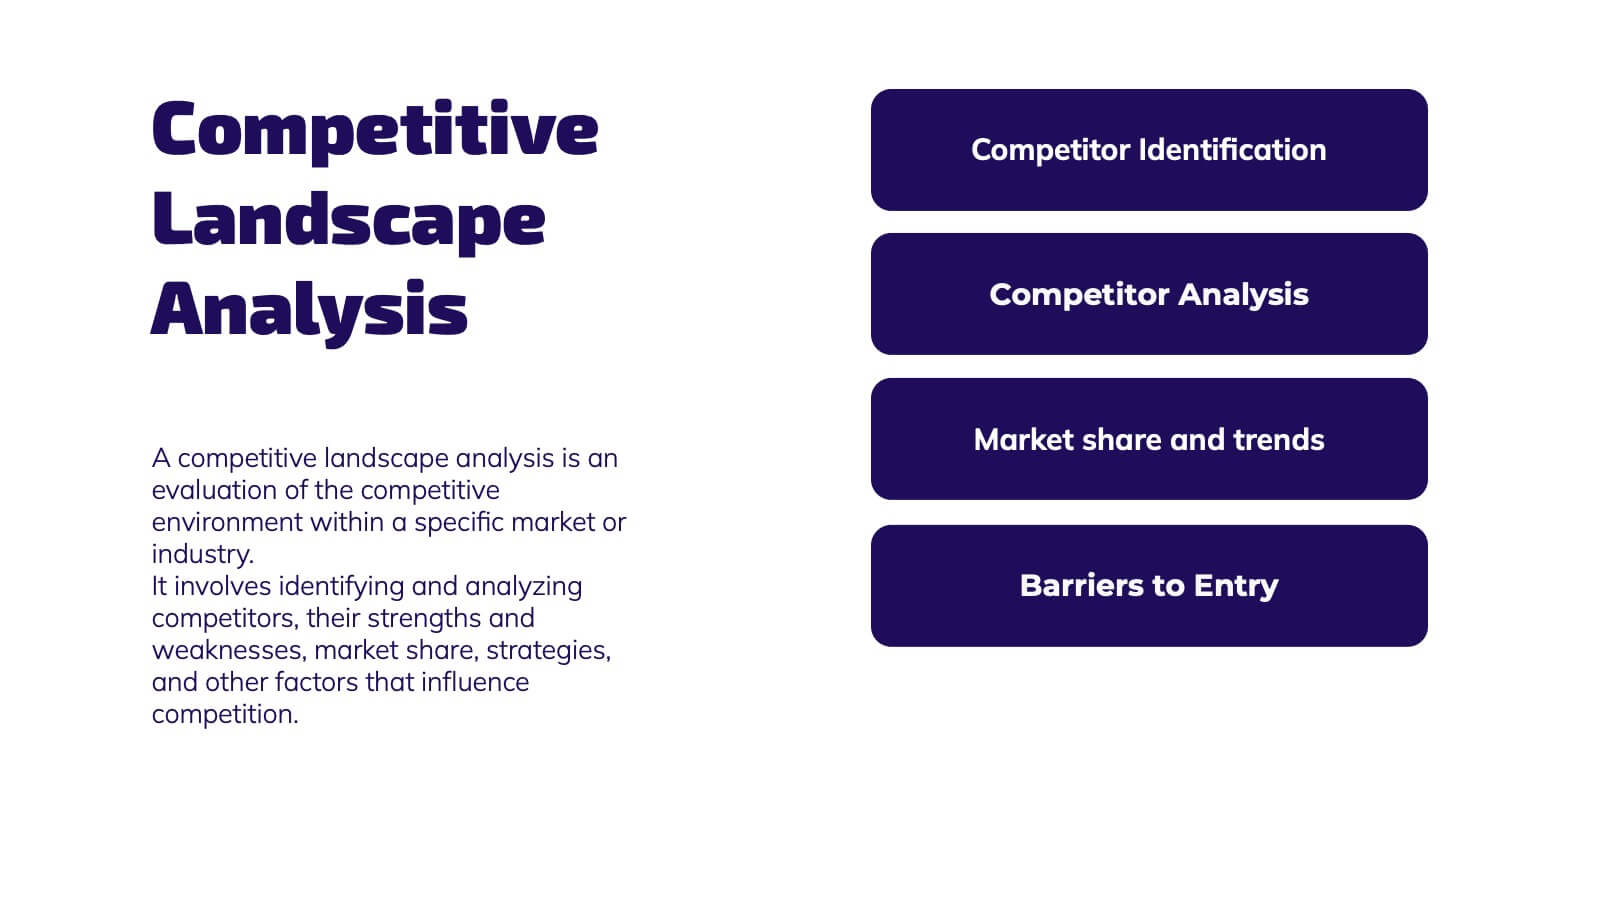
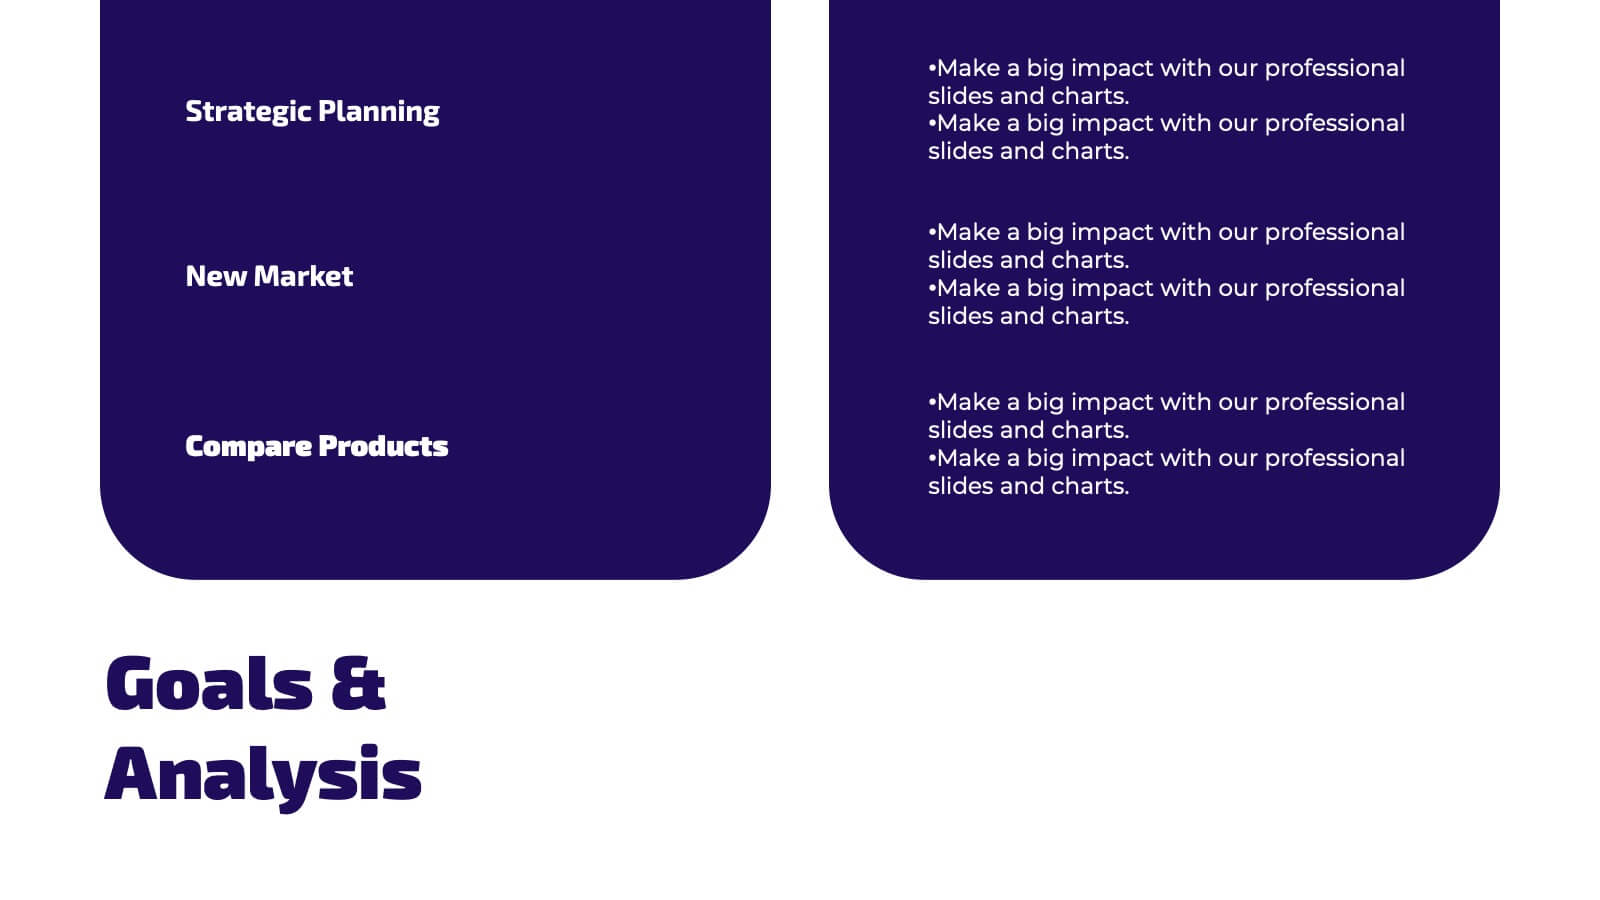
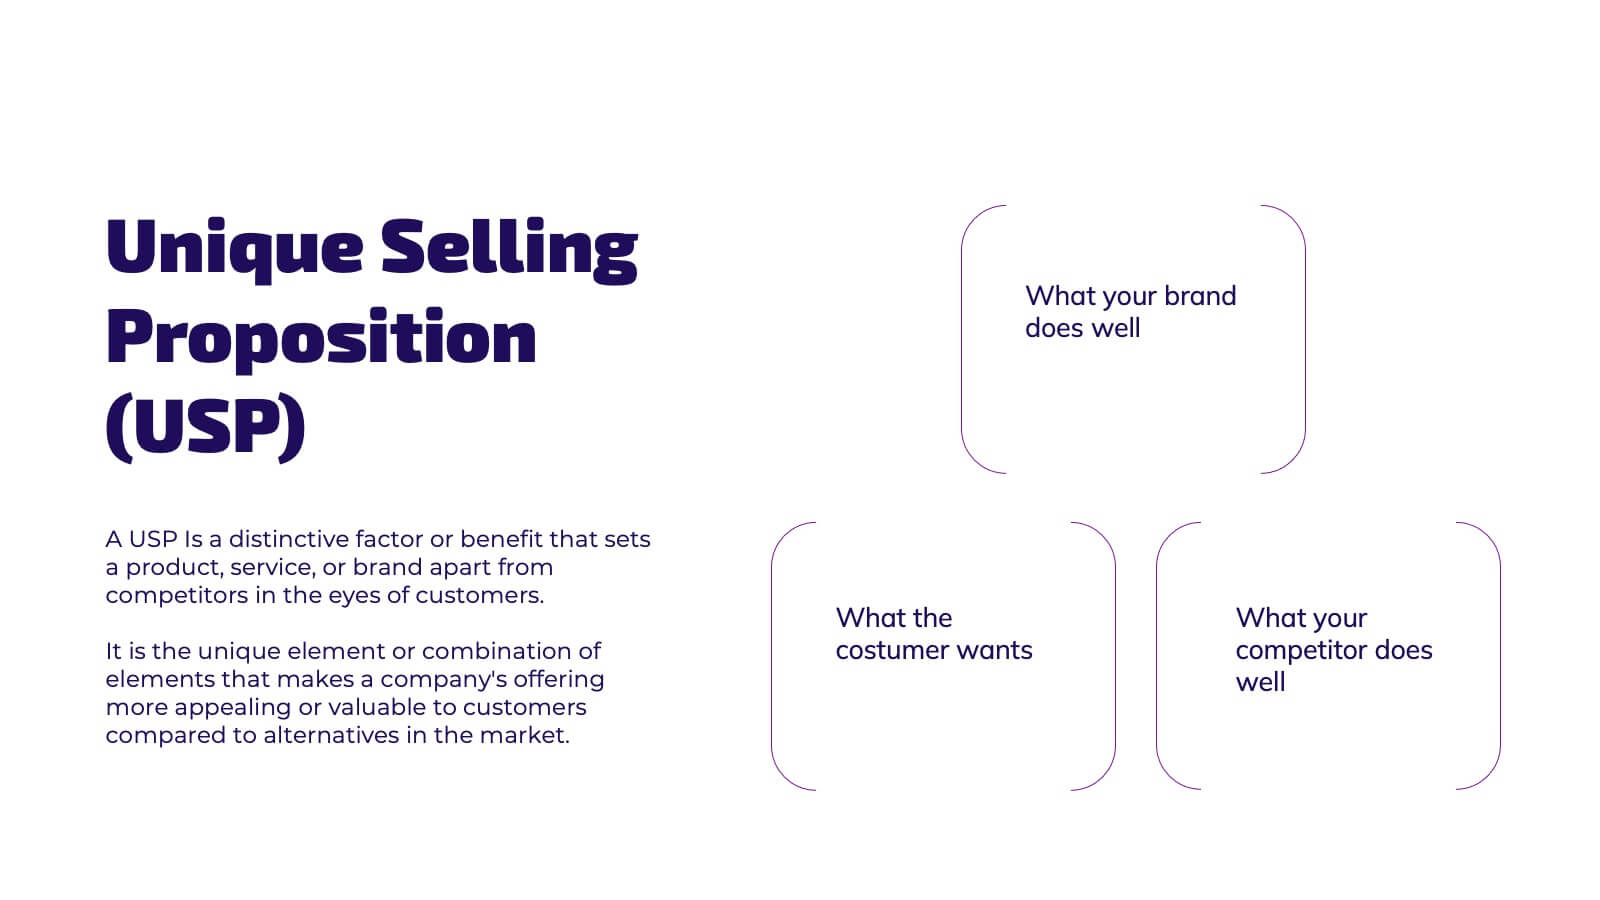
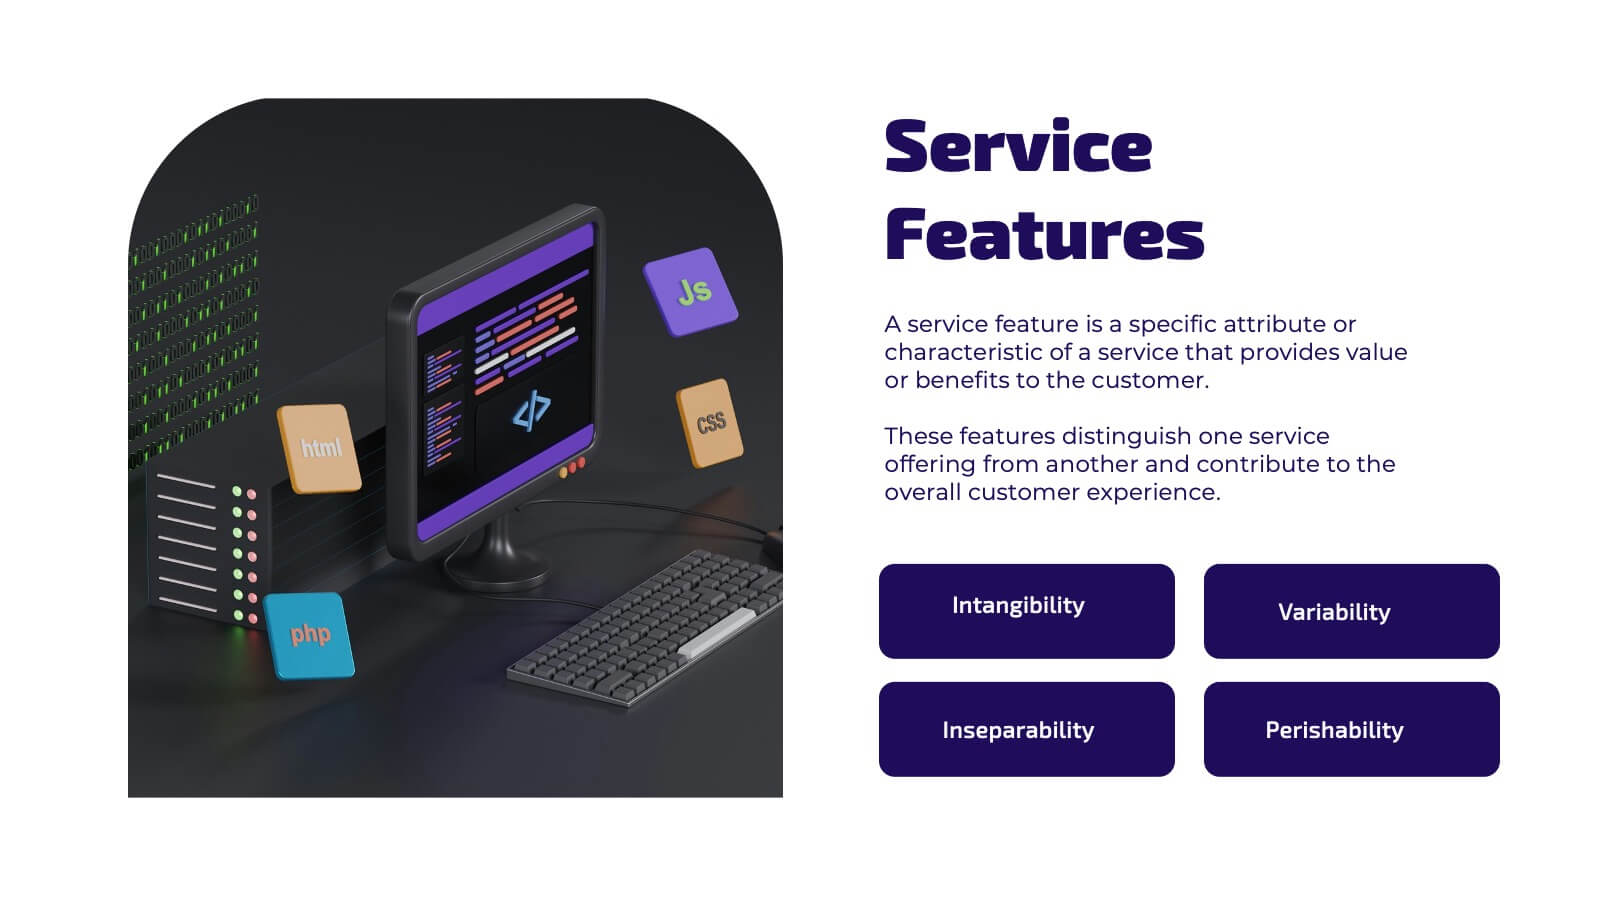
Illusion Marketing Research Report Presentation
Energize your marketing presentations with this bold, modern template. Perfect for showcasing company stories, market research, and competitive landscapes, it features a vibrant design and clear layout. Highlight key insights and strategies with ease, ensuring your marketing plan stands out. Compatible with PowerPoint, Keynote, and Google Slides, it’s ideal for any platform.


23 diapositivas
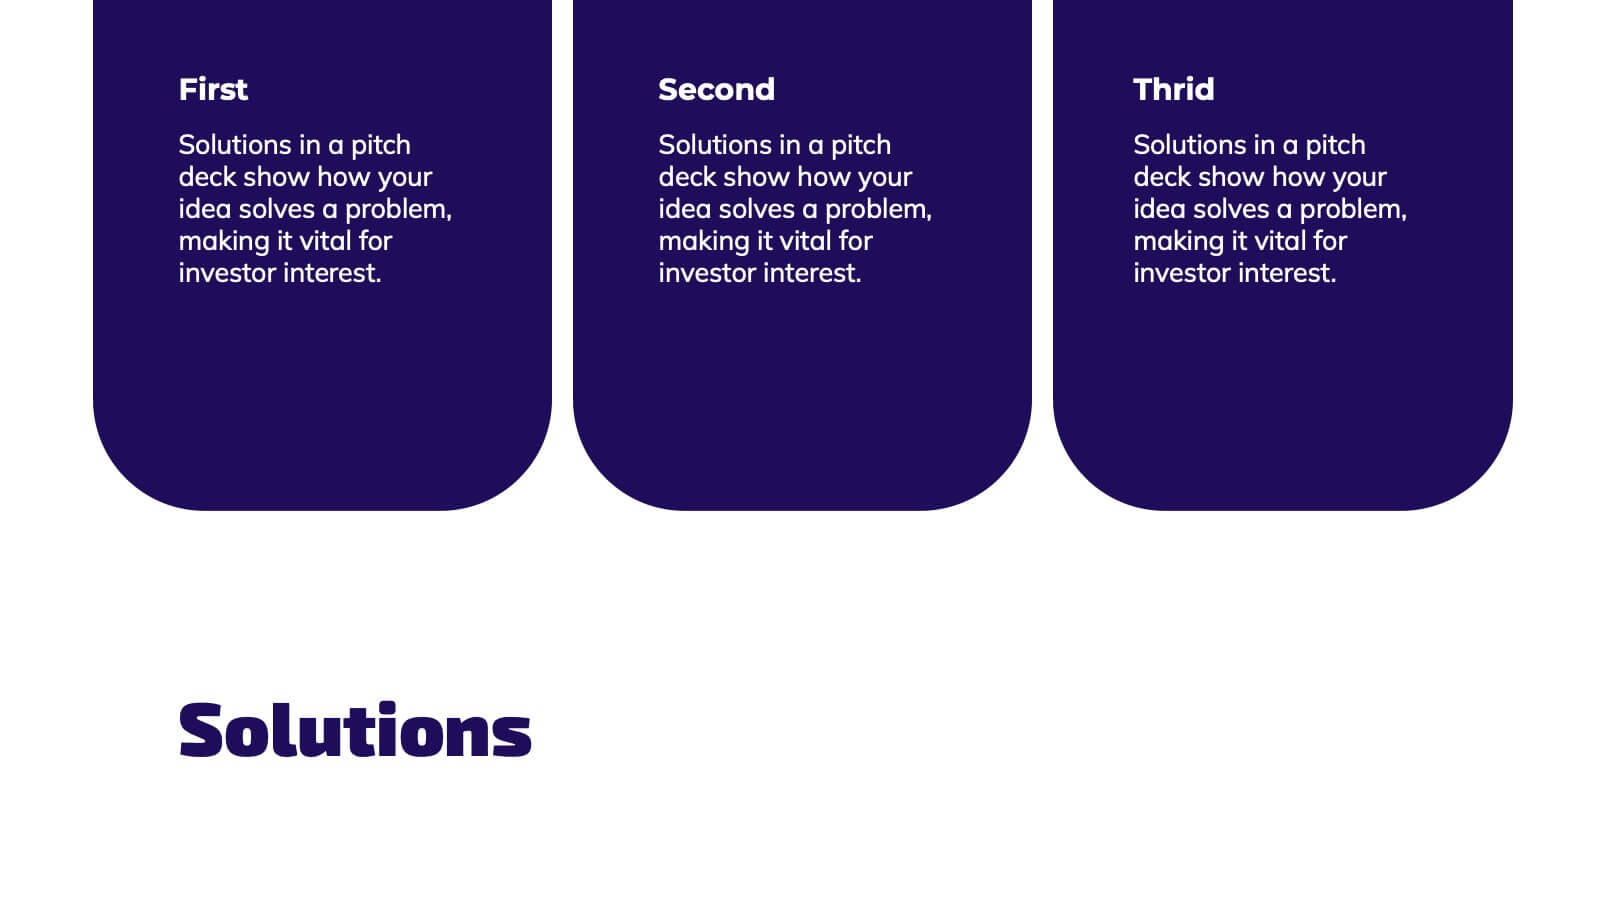
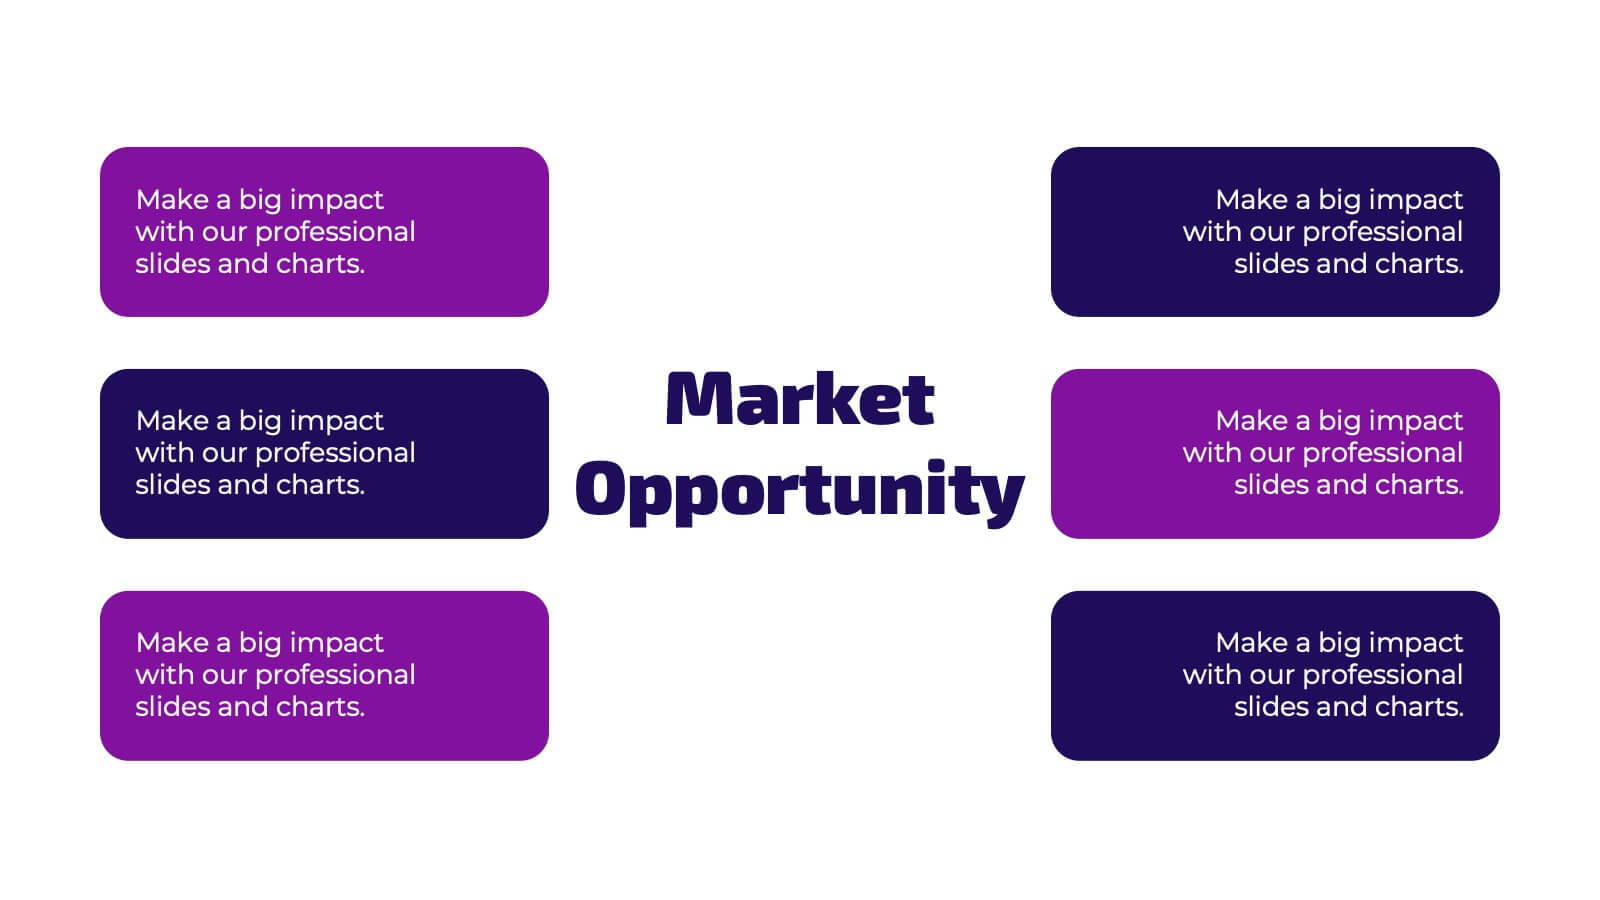
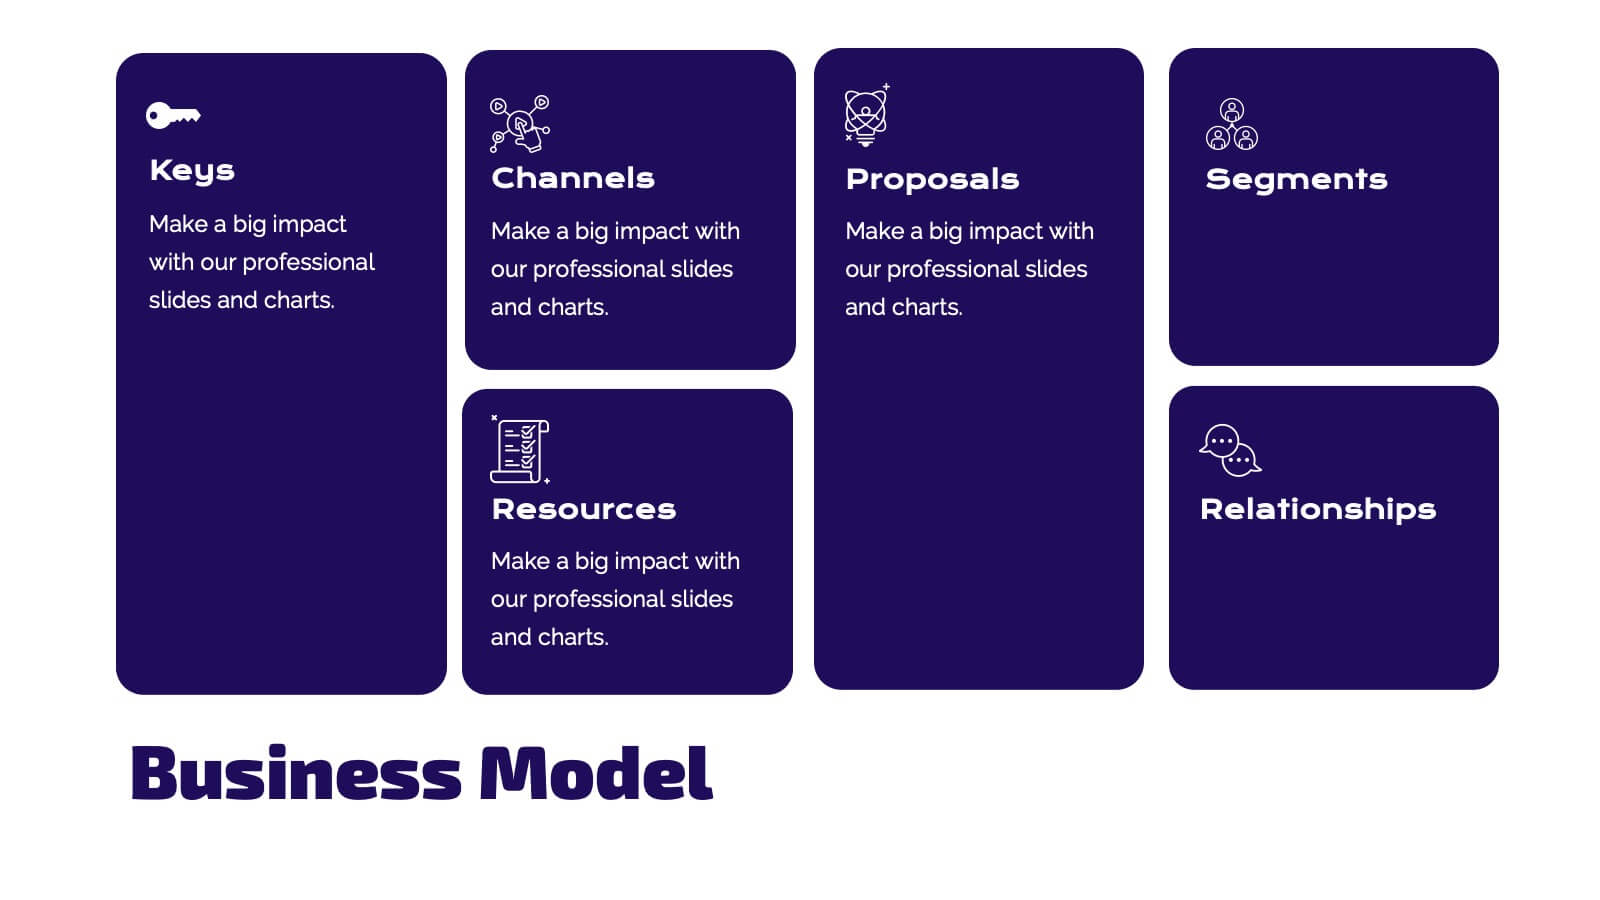
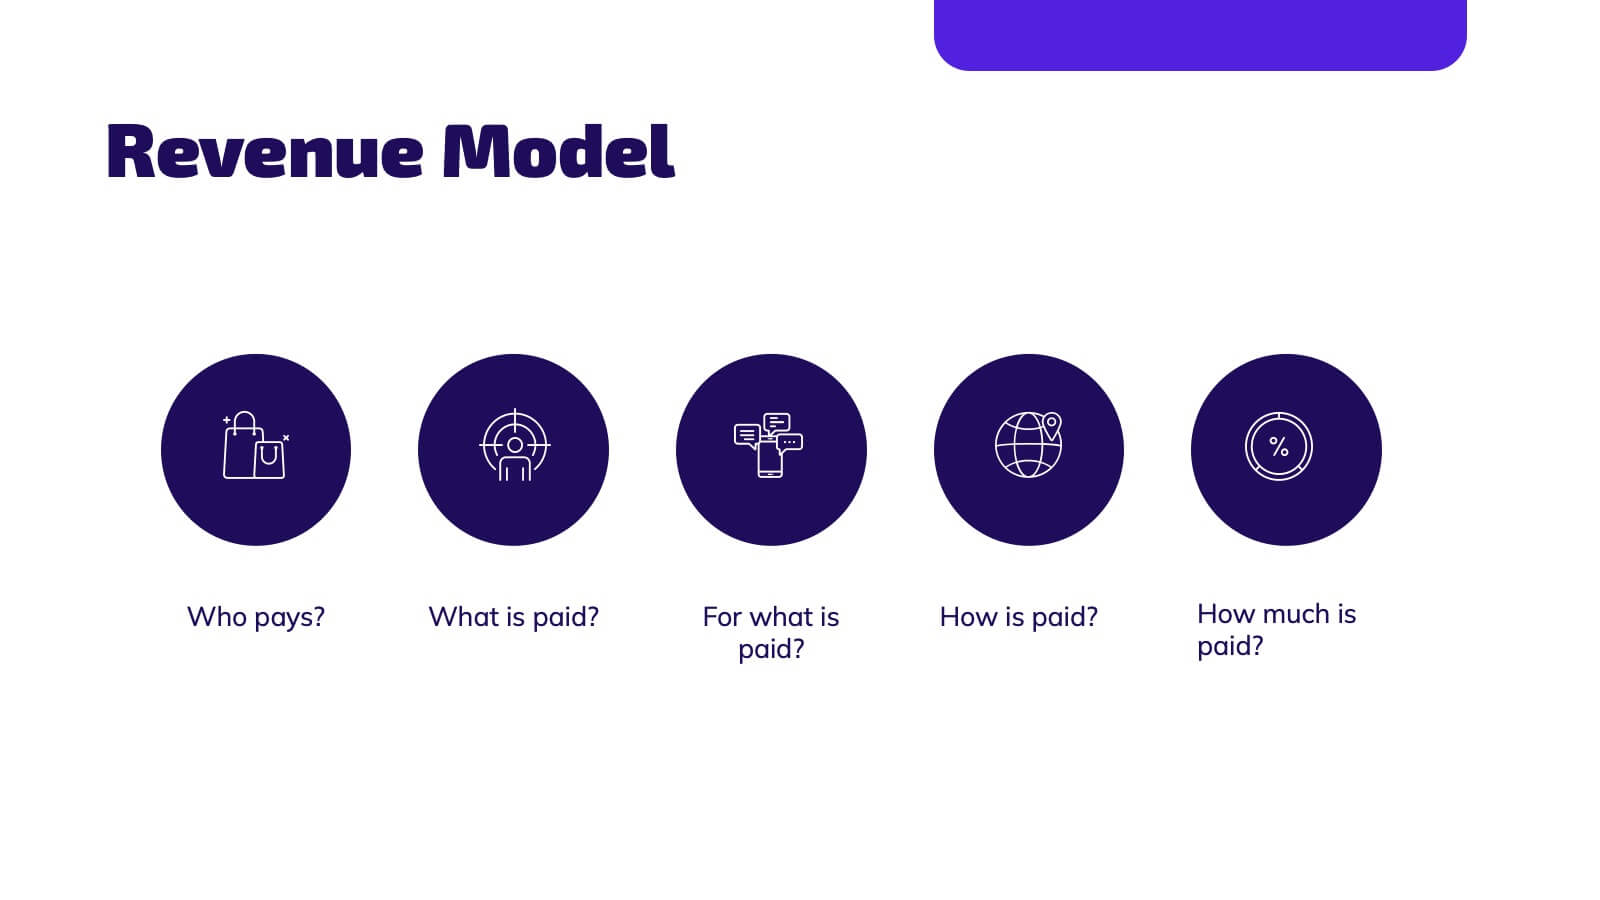
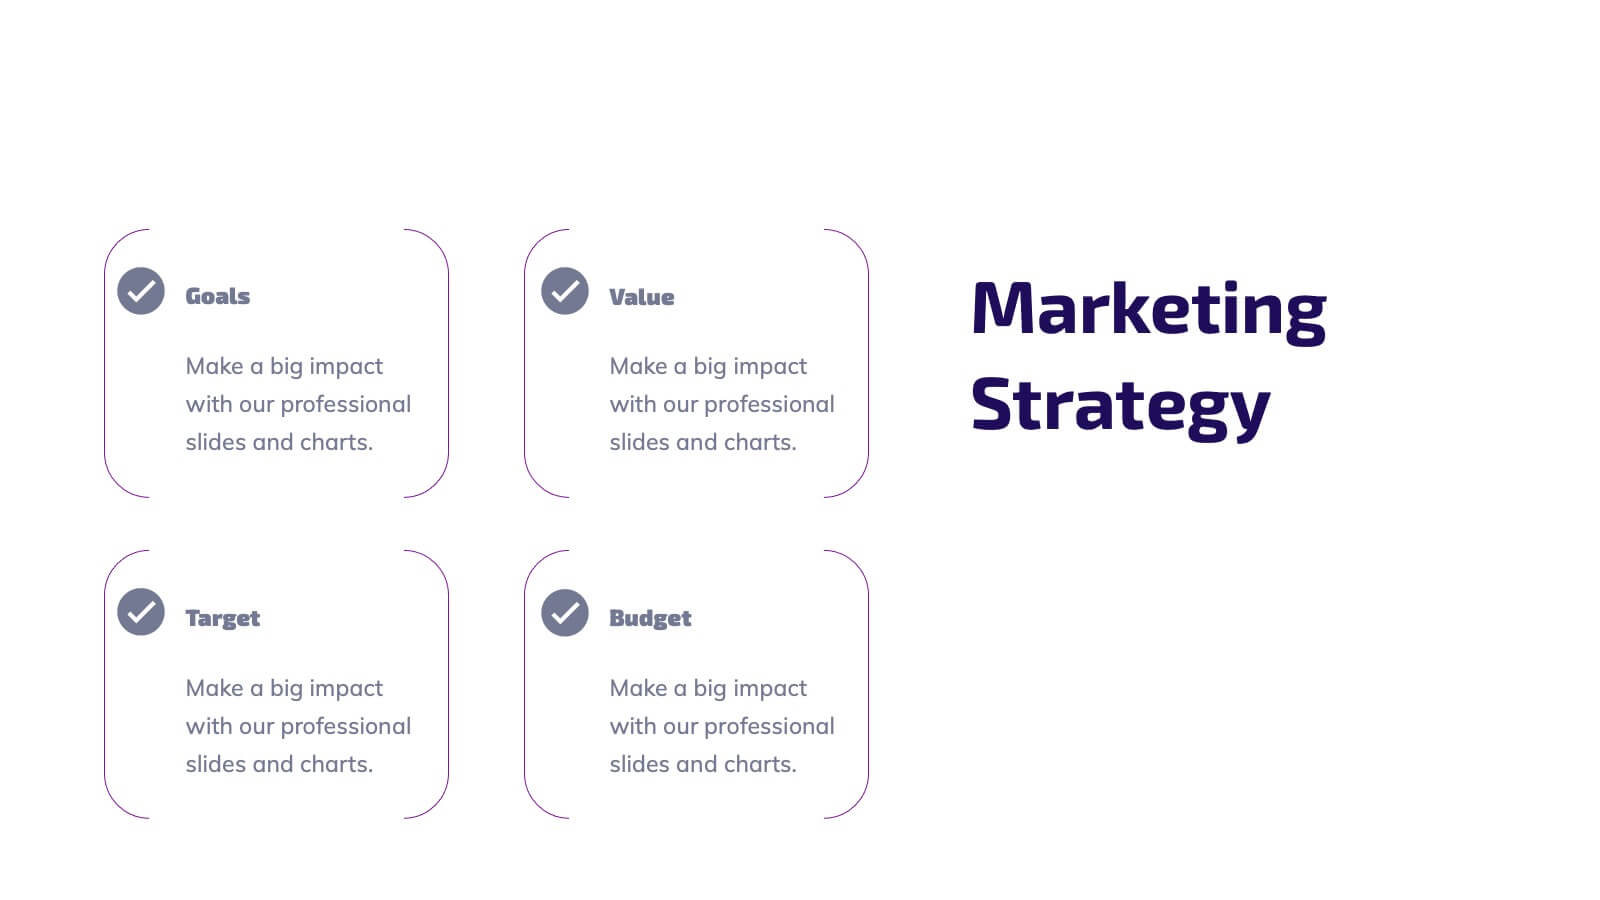
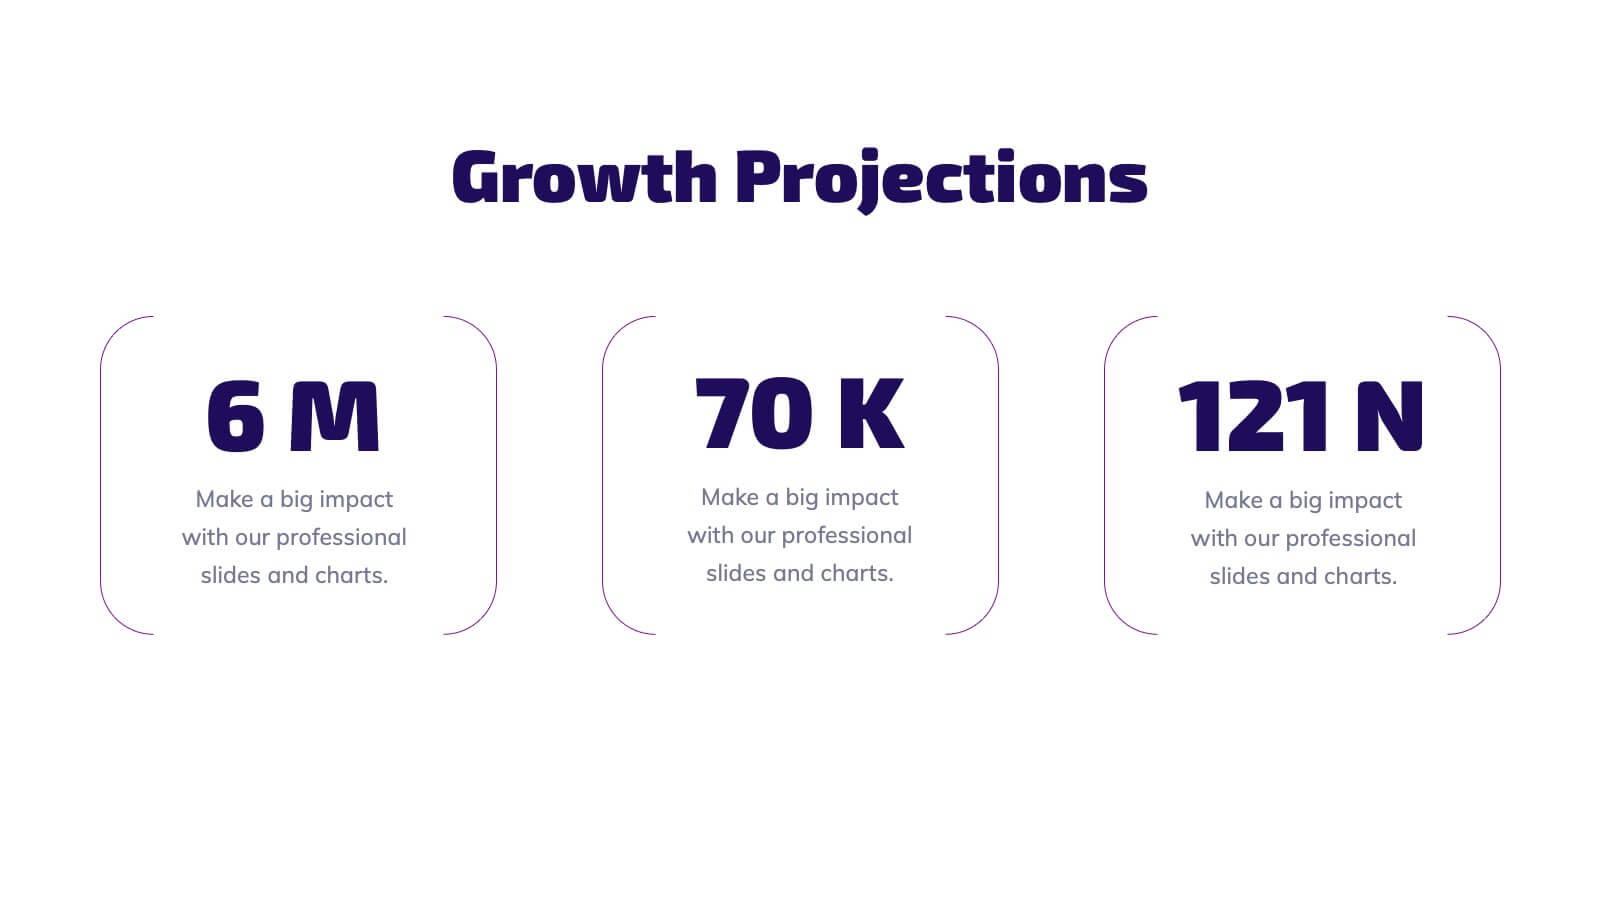
Illume Startup Pitch Deck Presentation
Light up your startup journey with this captivating presentation template! Perfect for pitching your business idea, it guides you through key elements like market analysis, financial projections, and growth strategies. With a modern design that grabs attention, this template will help you shine in front of investors. Compatible with PowerPoint, Keynote, and Google Slides.


4 diapositivas
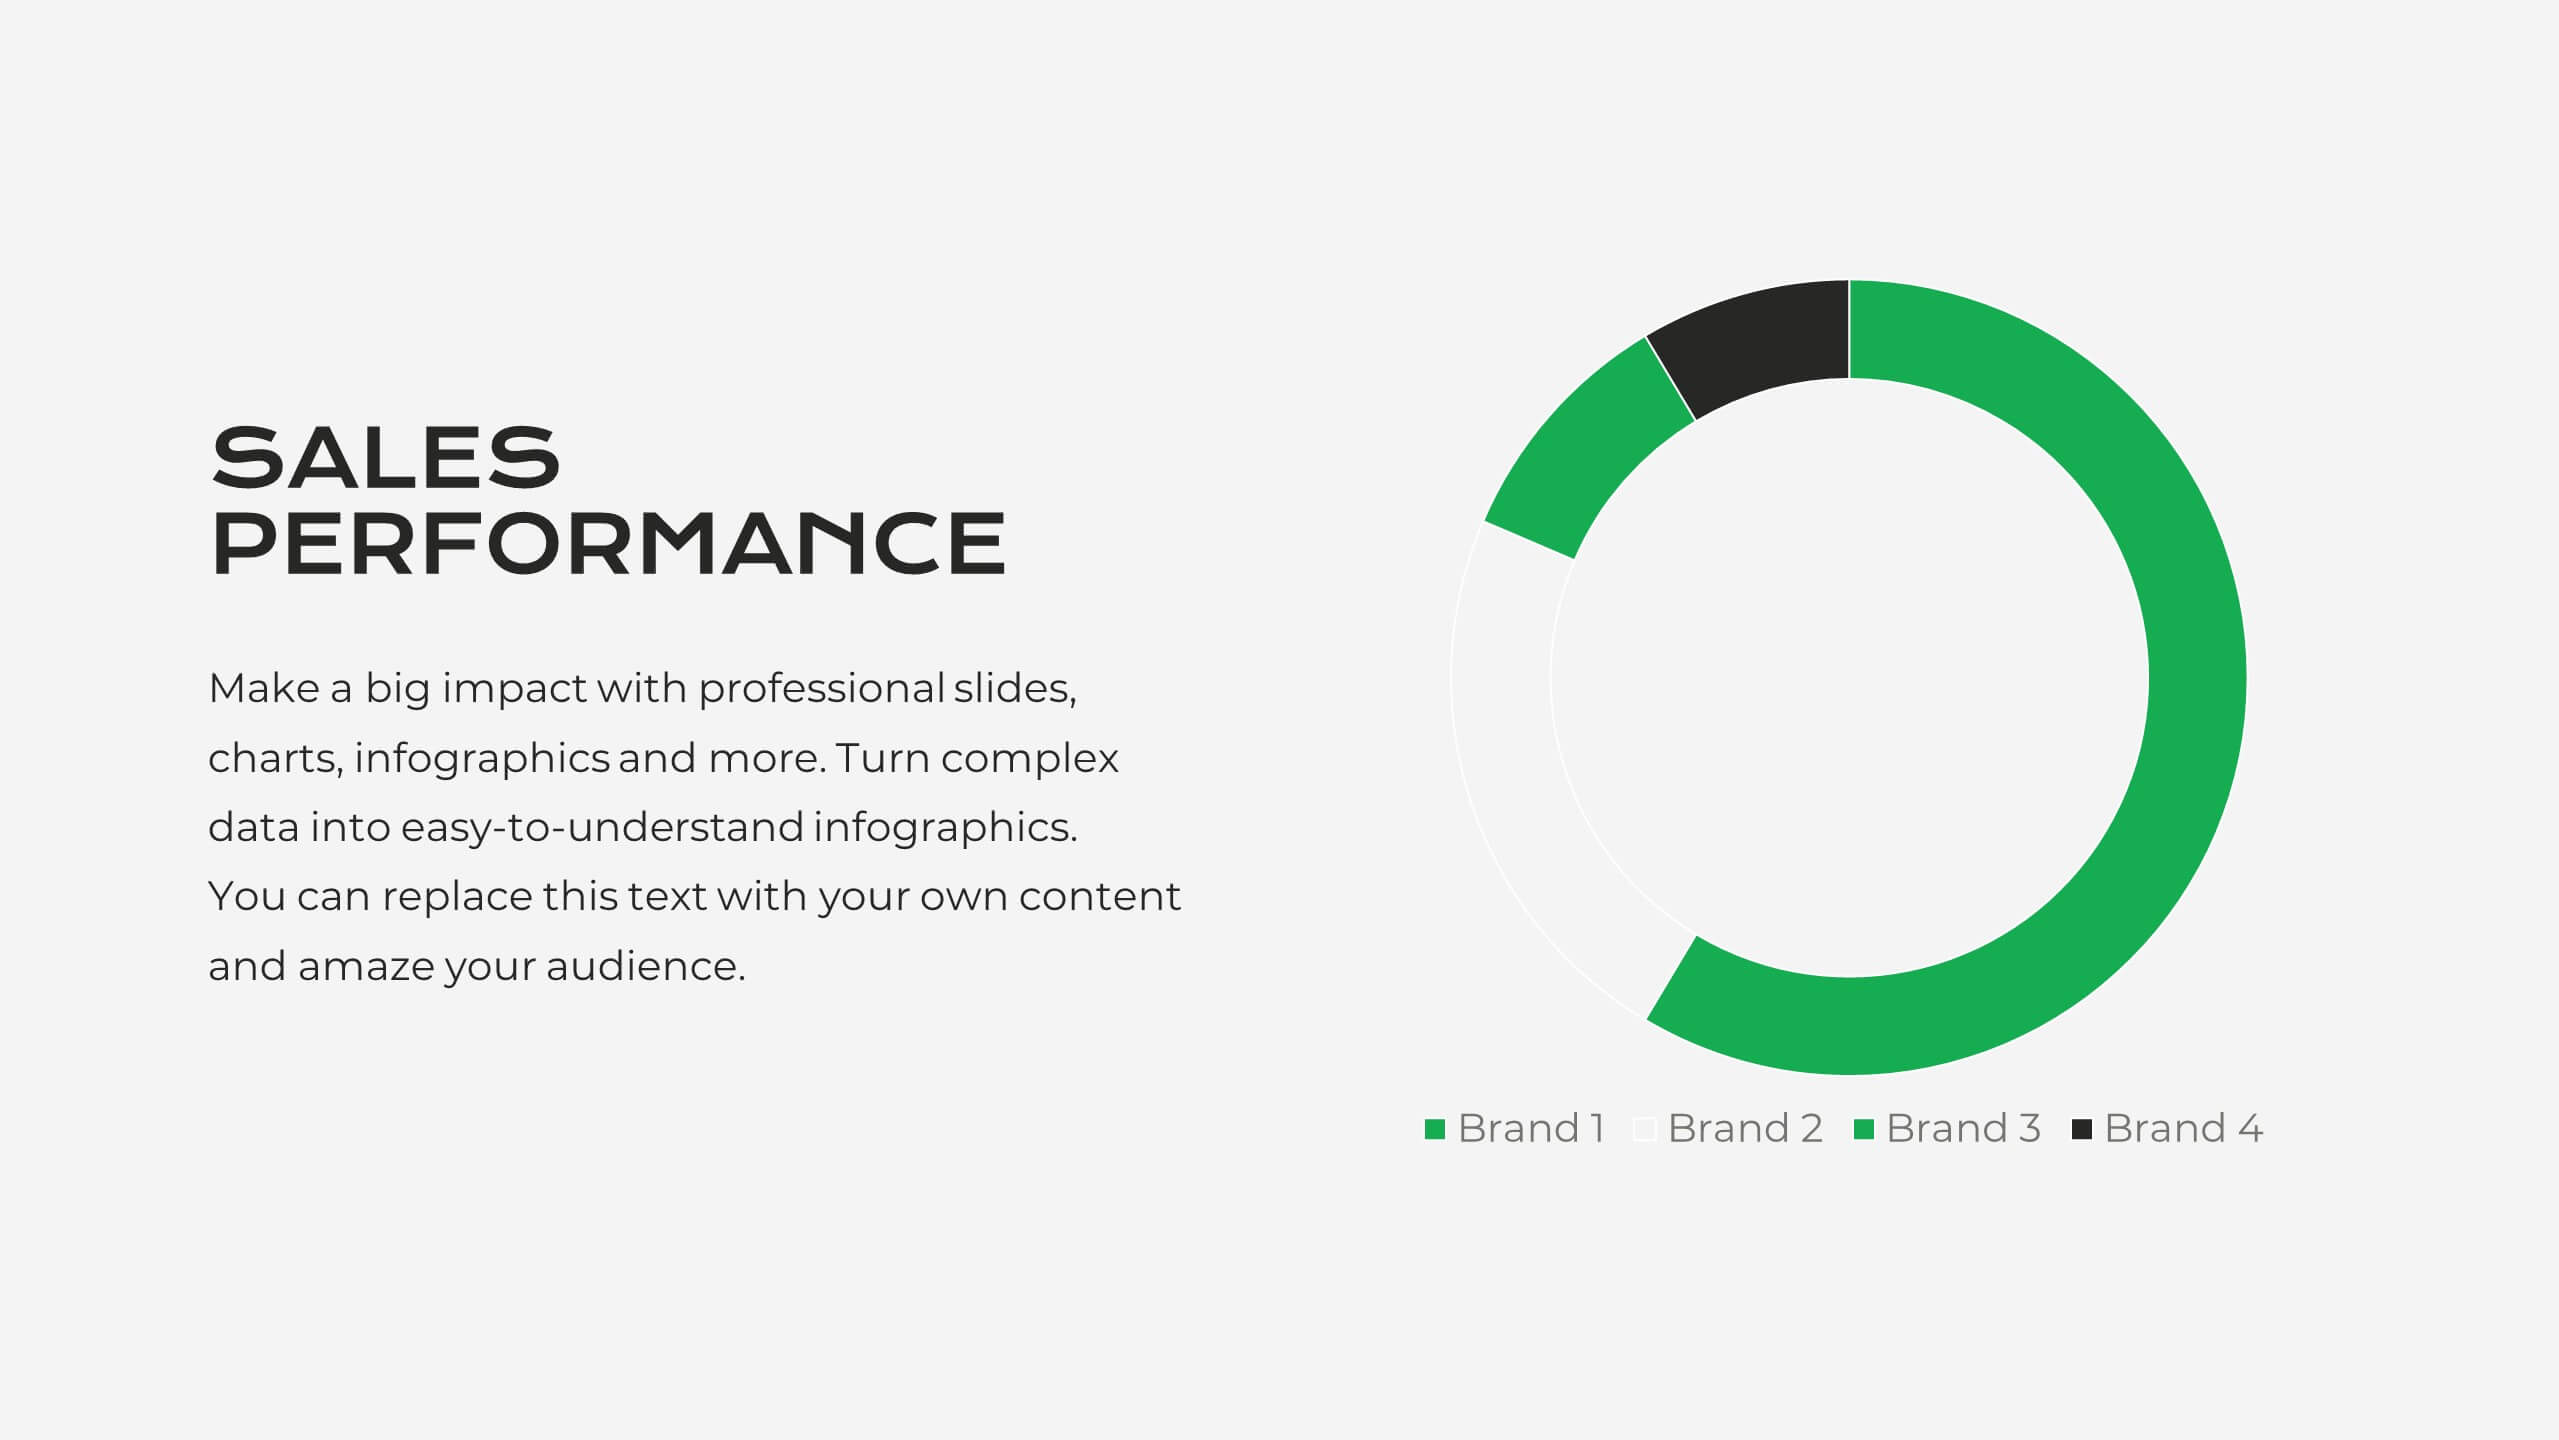
Sales Performance Dashboard Report Presentation
Track progress and showcase trends with the Sales Performance Dashboard Report Presentation. This template features a clean monthly line chart to visualize product growth, alongside three metric boxes for highlighting KPIs or category performance. Ideal for quarterly recaps, revenue reporting, or product analysis. Fully editable in Canva, PowerPoint, and Google Slides.


21 diapositivas
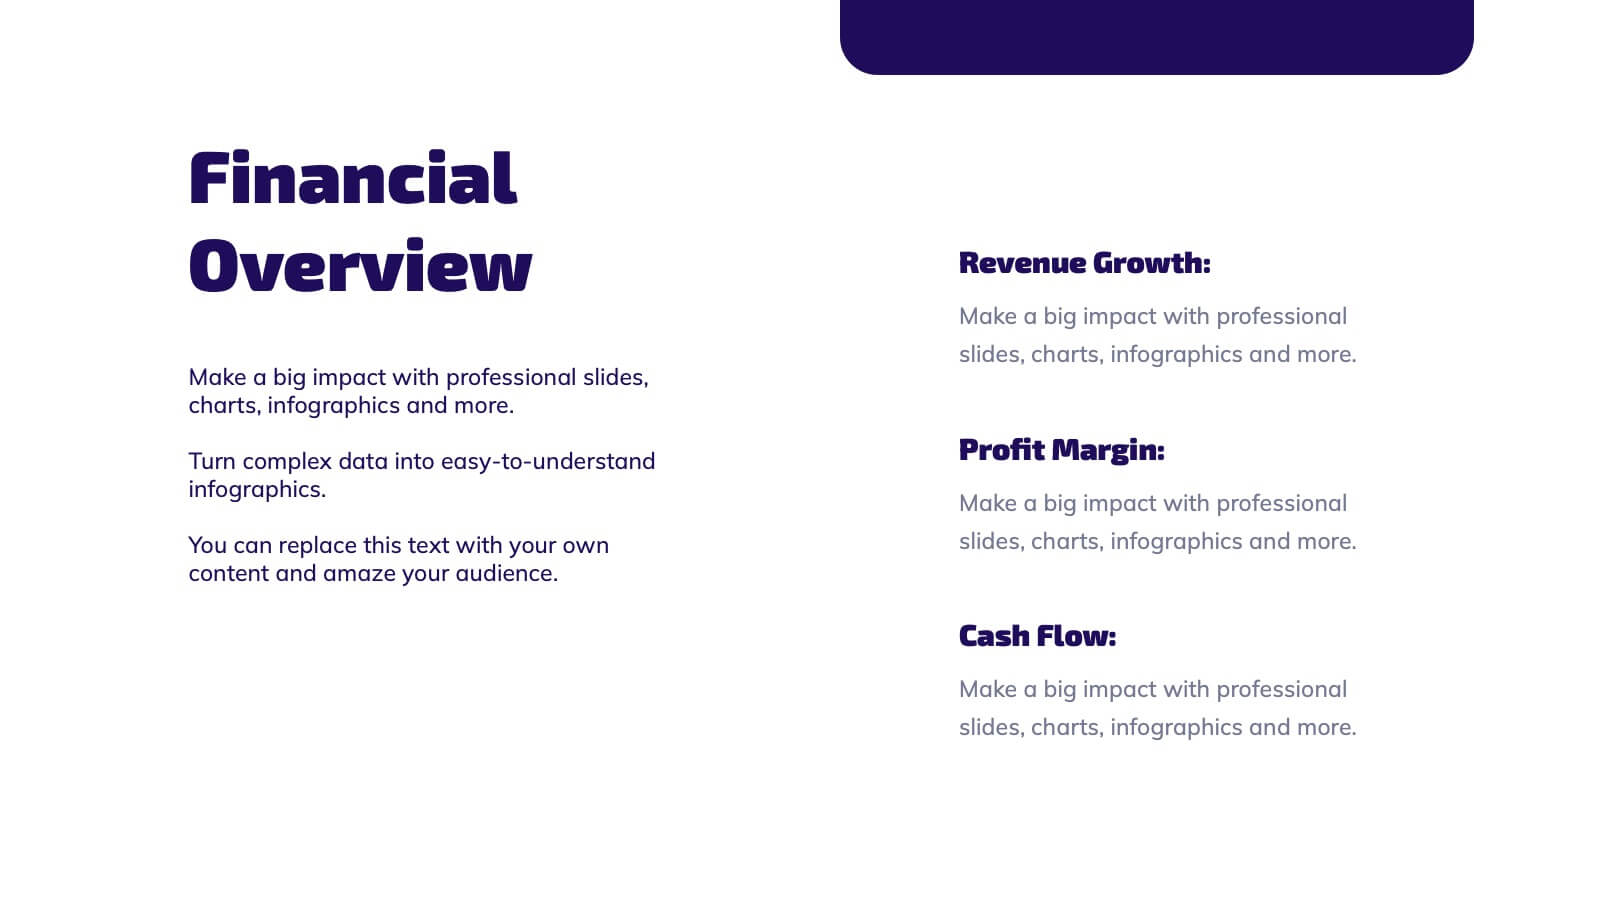
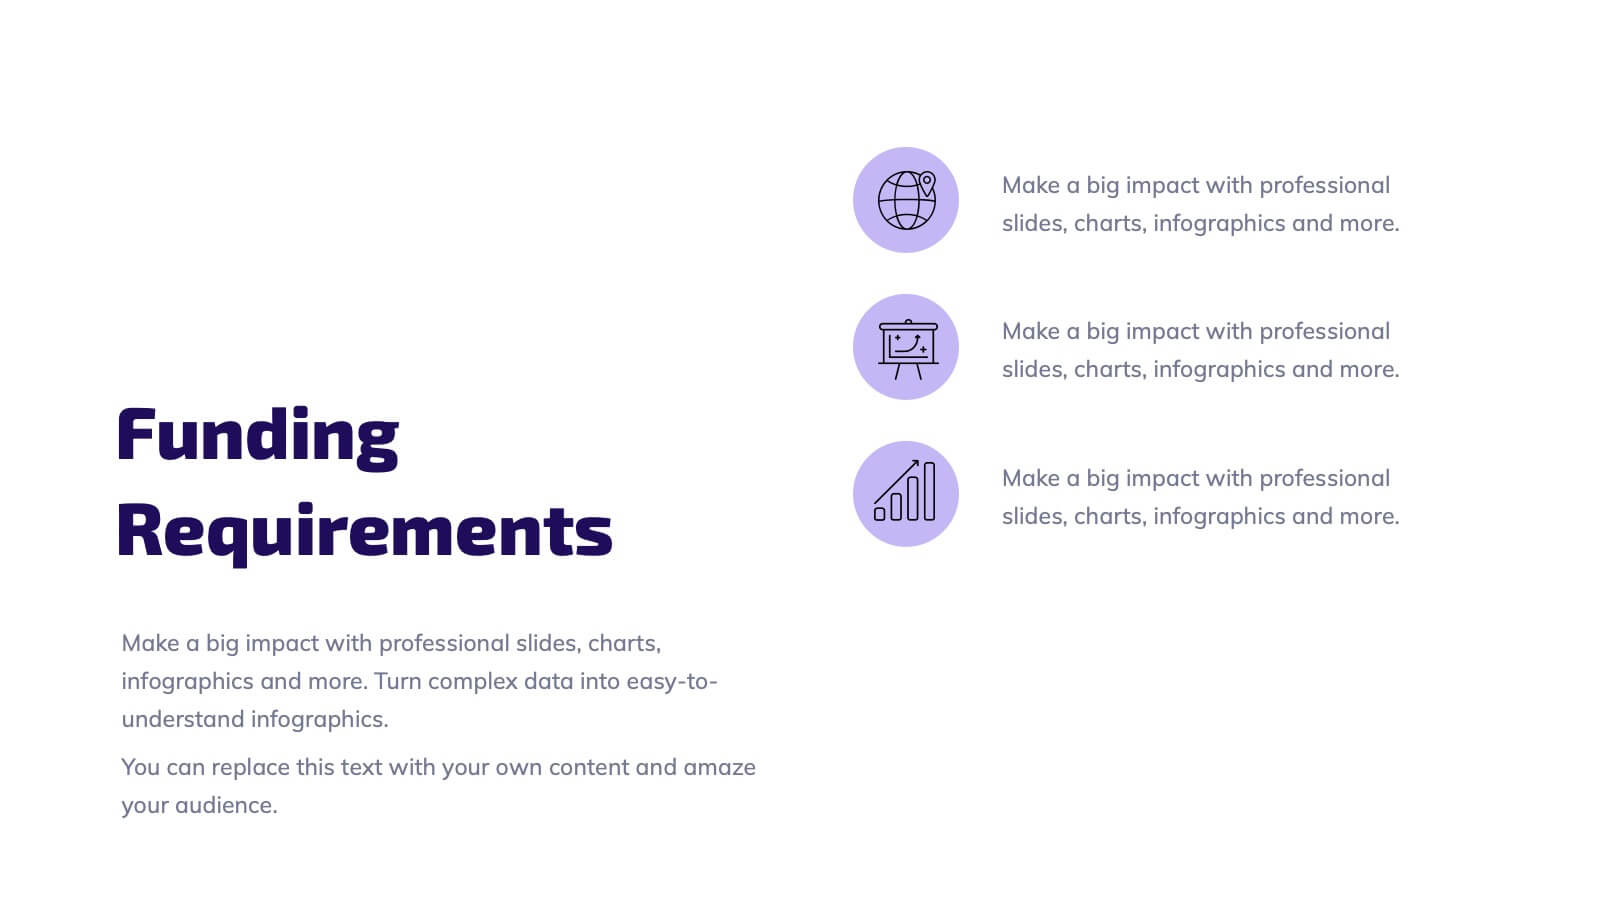
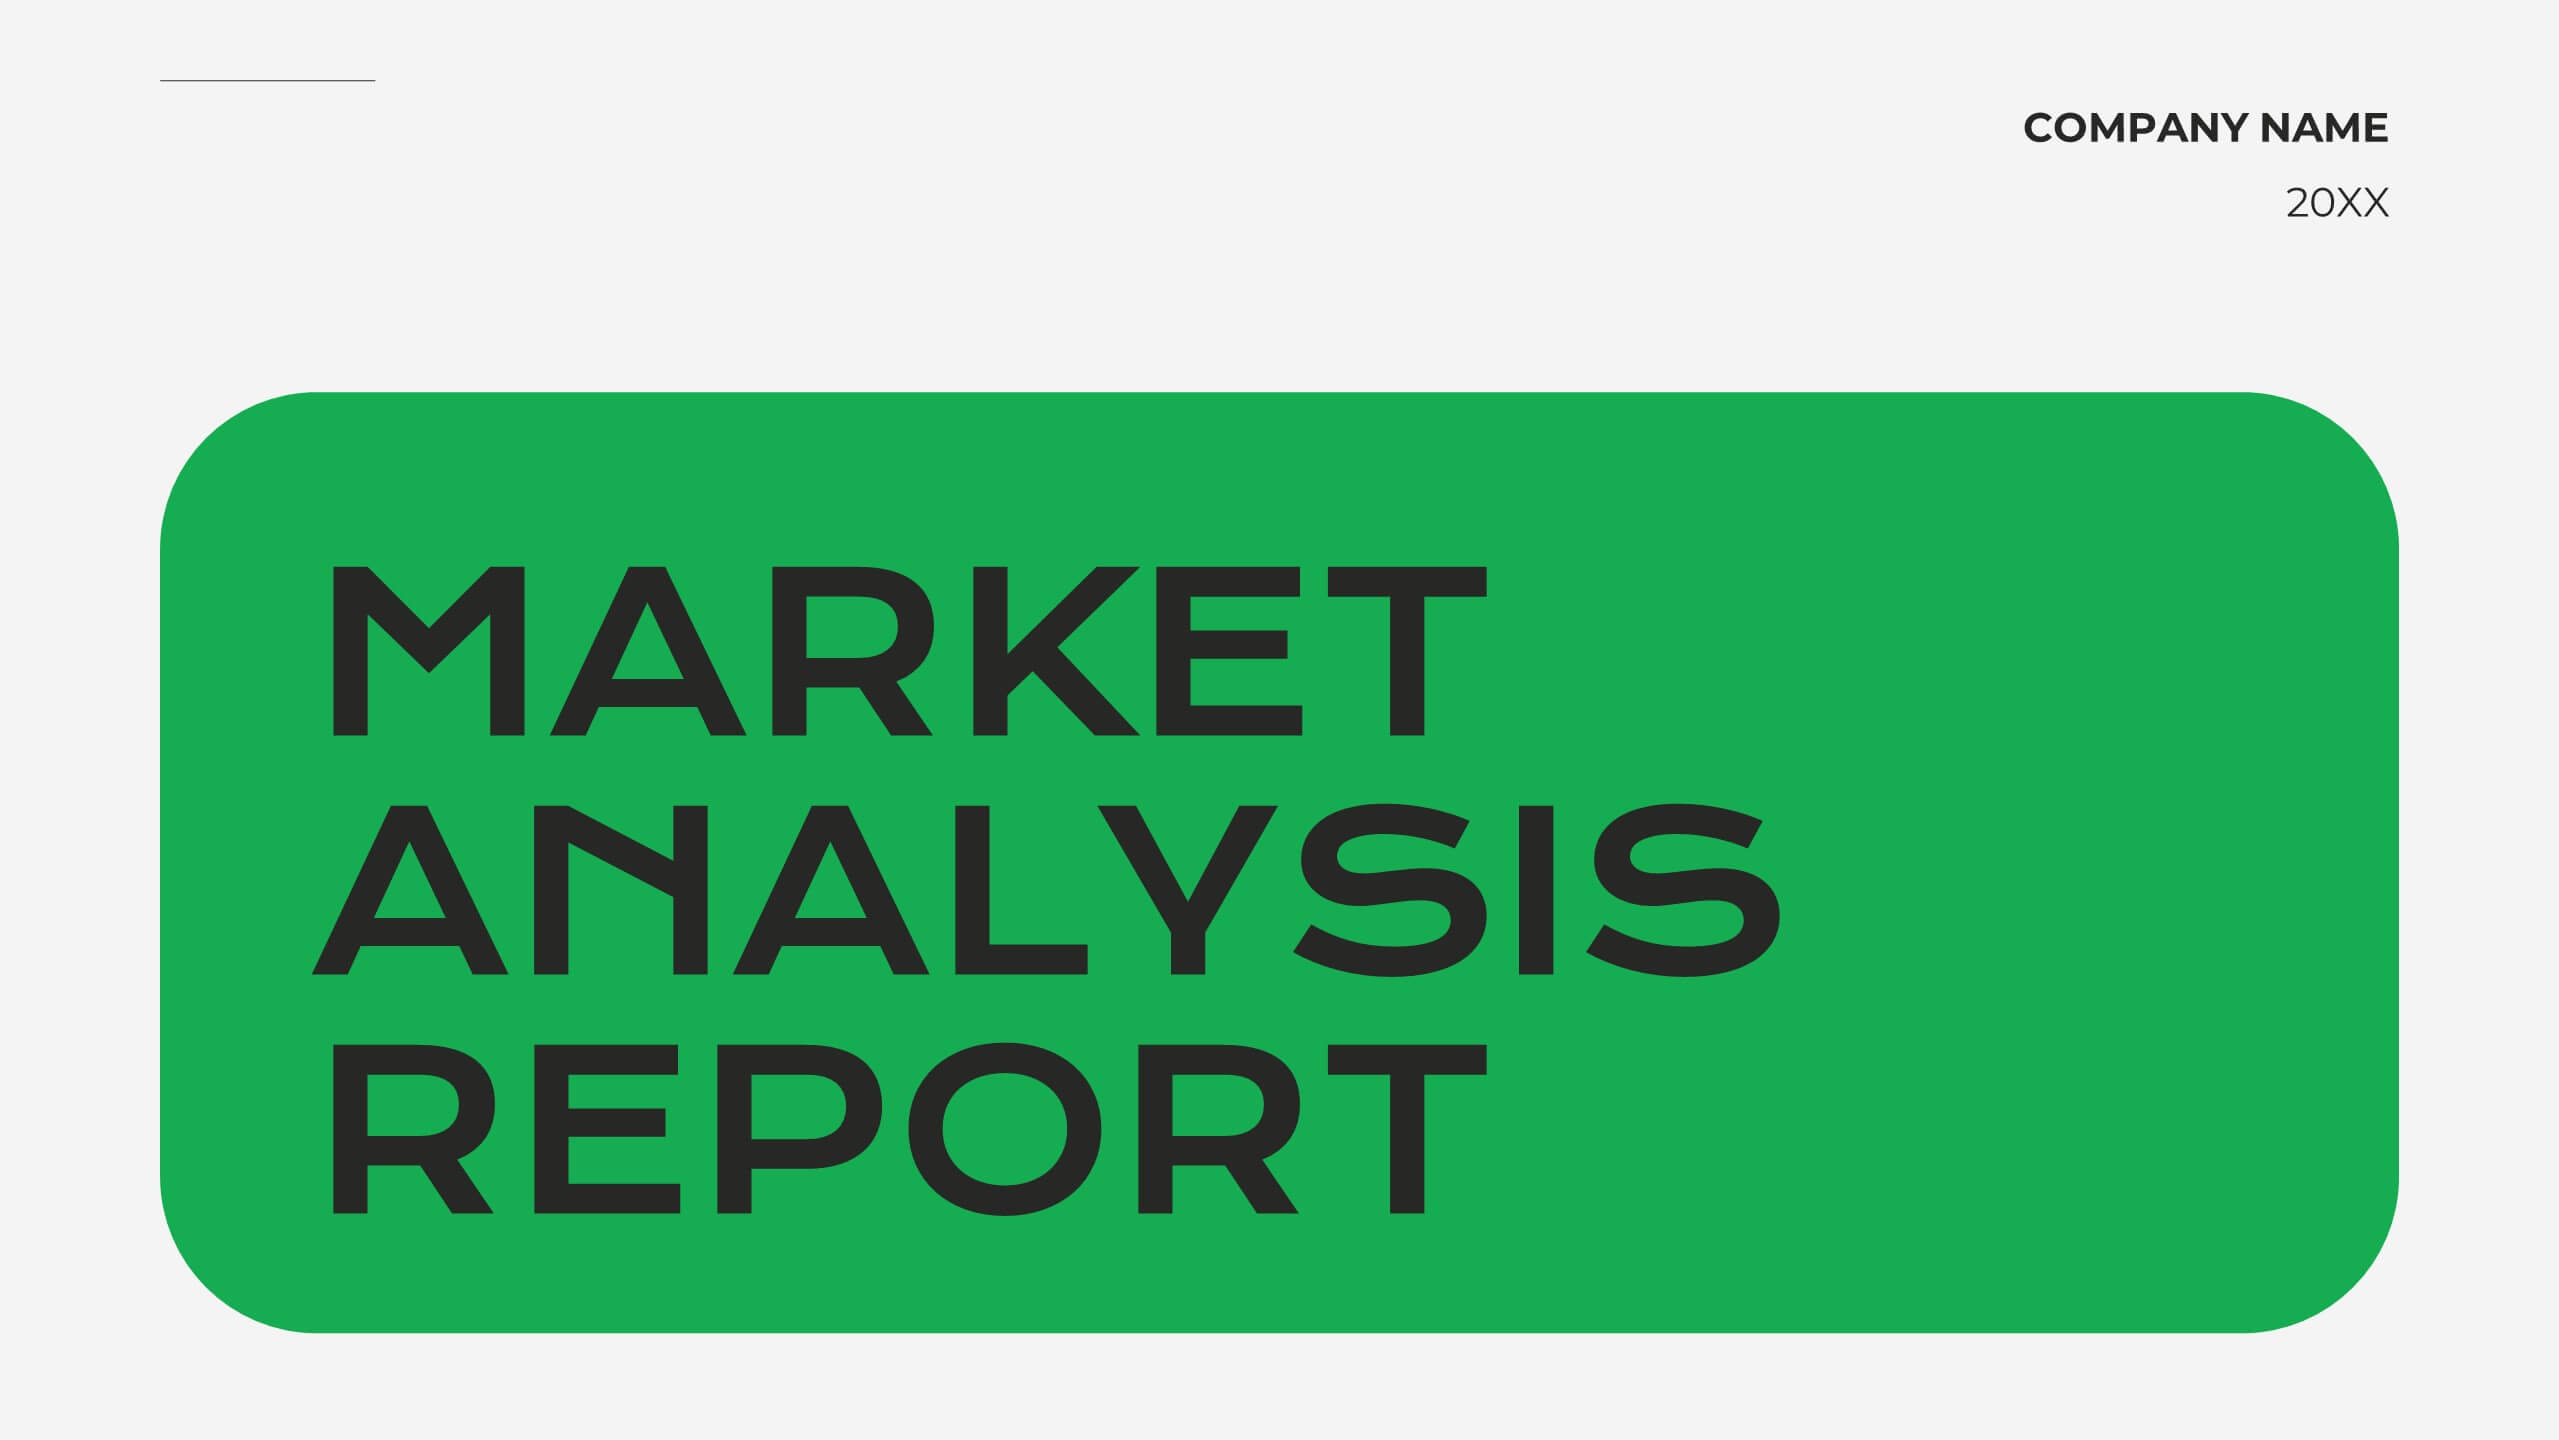
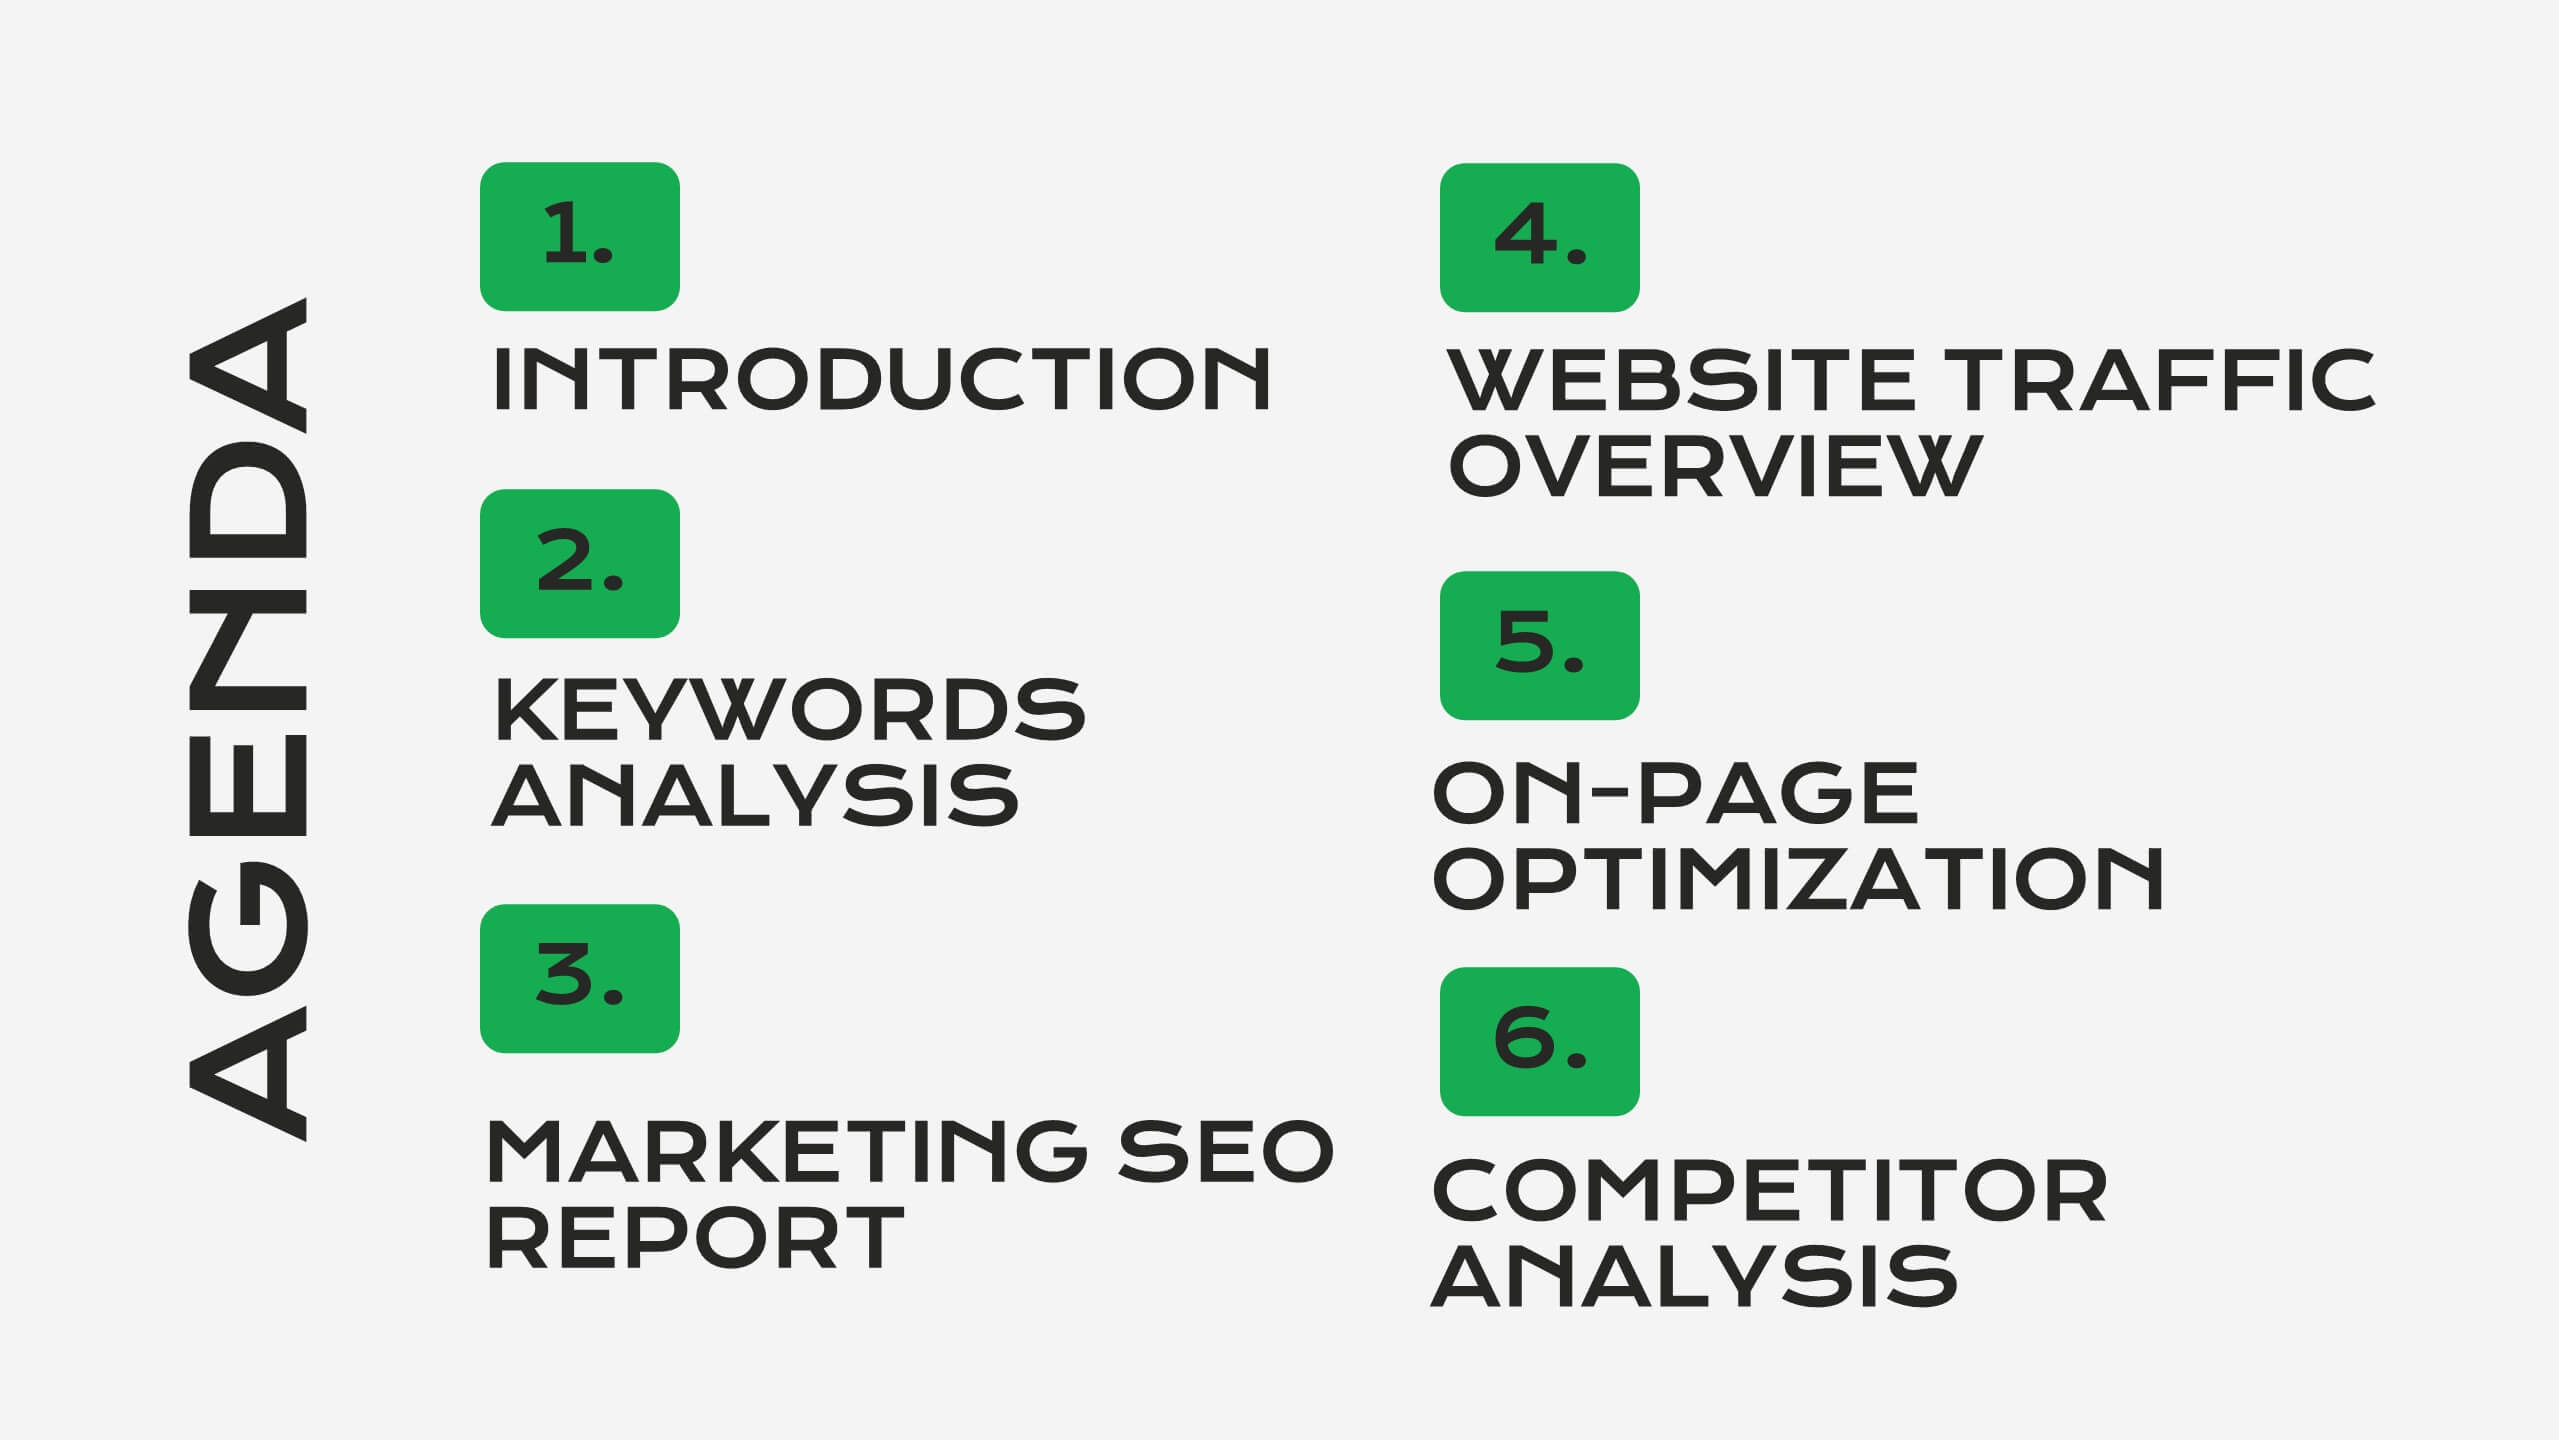
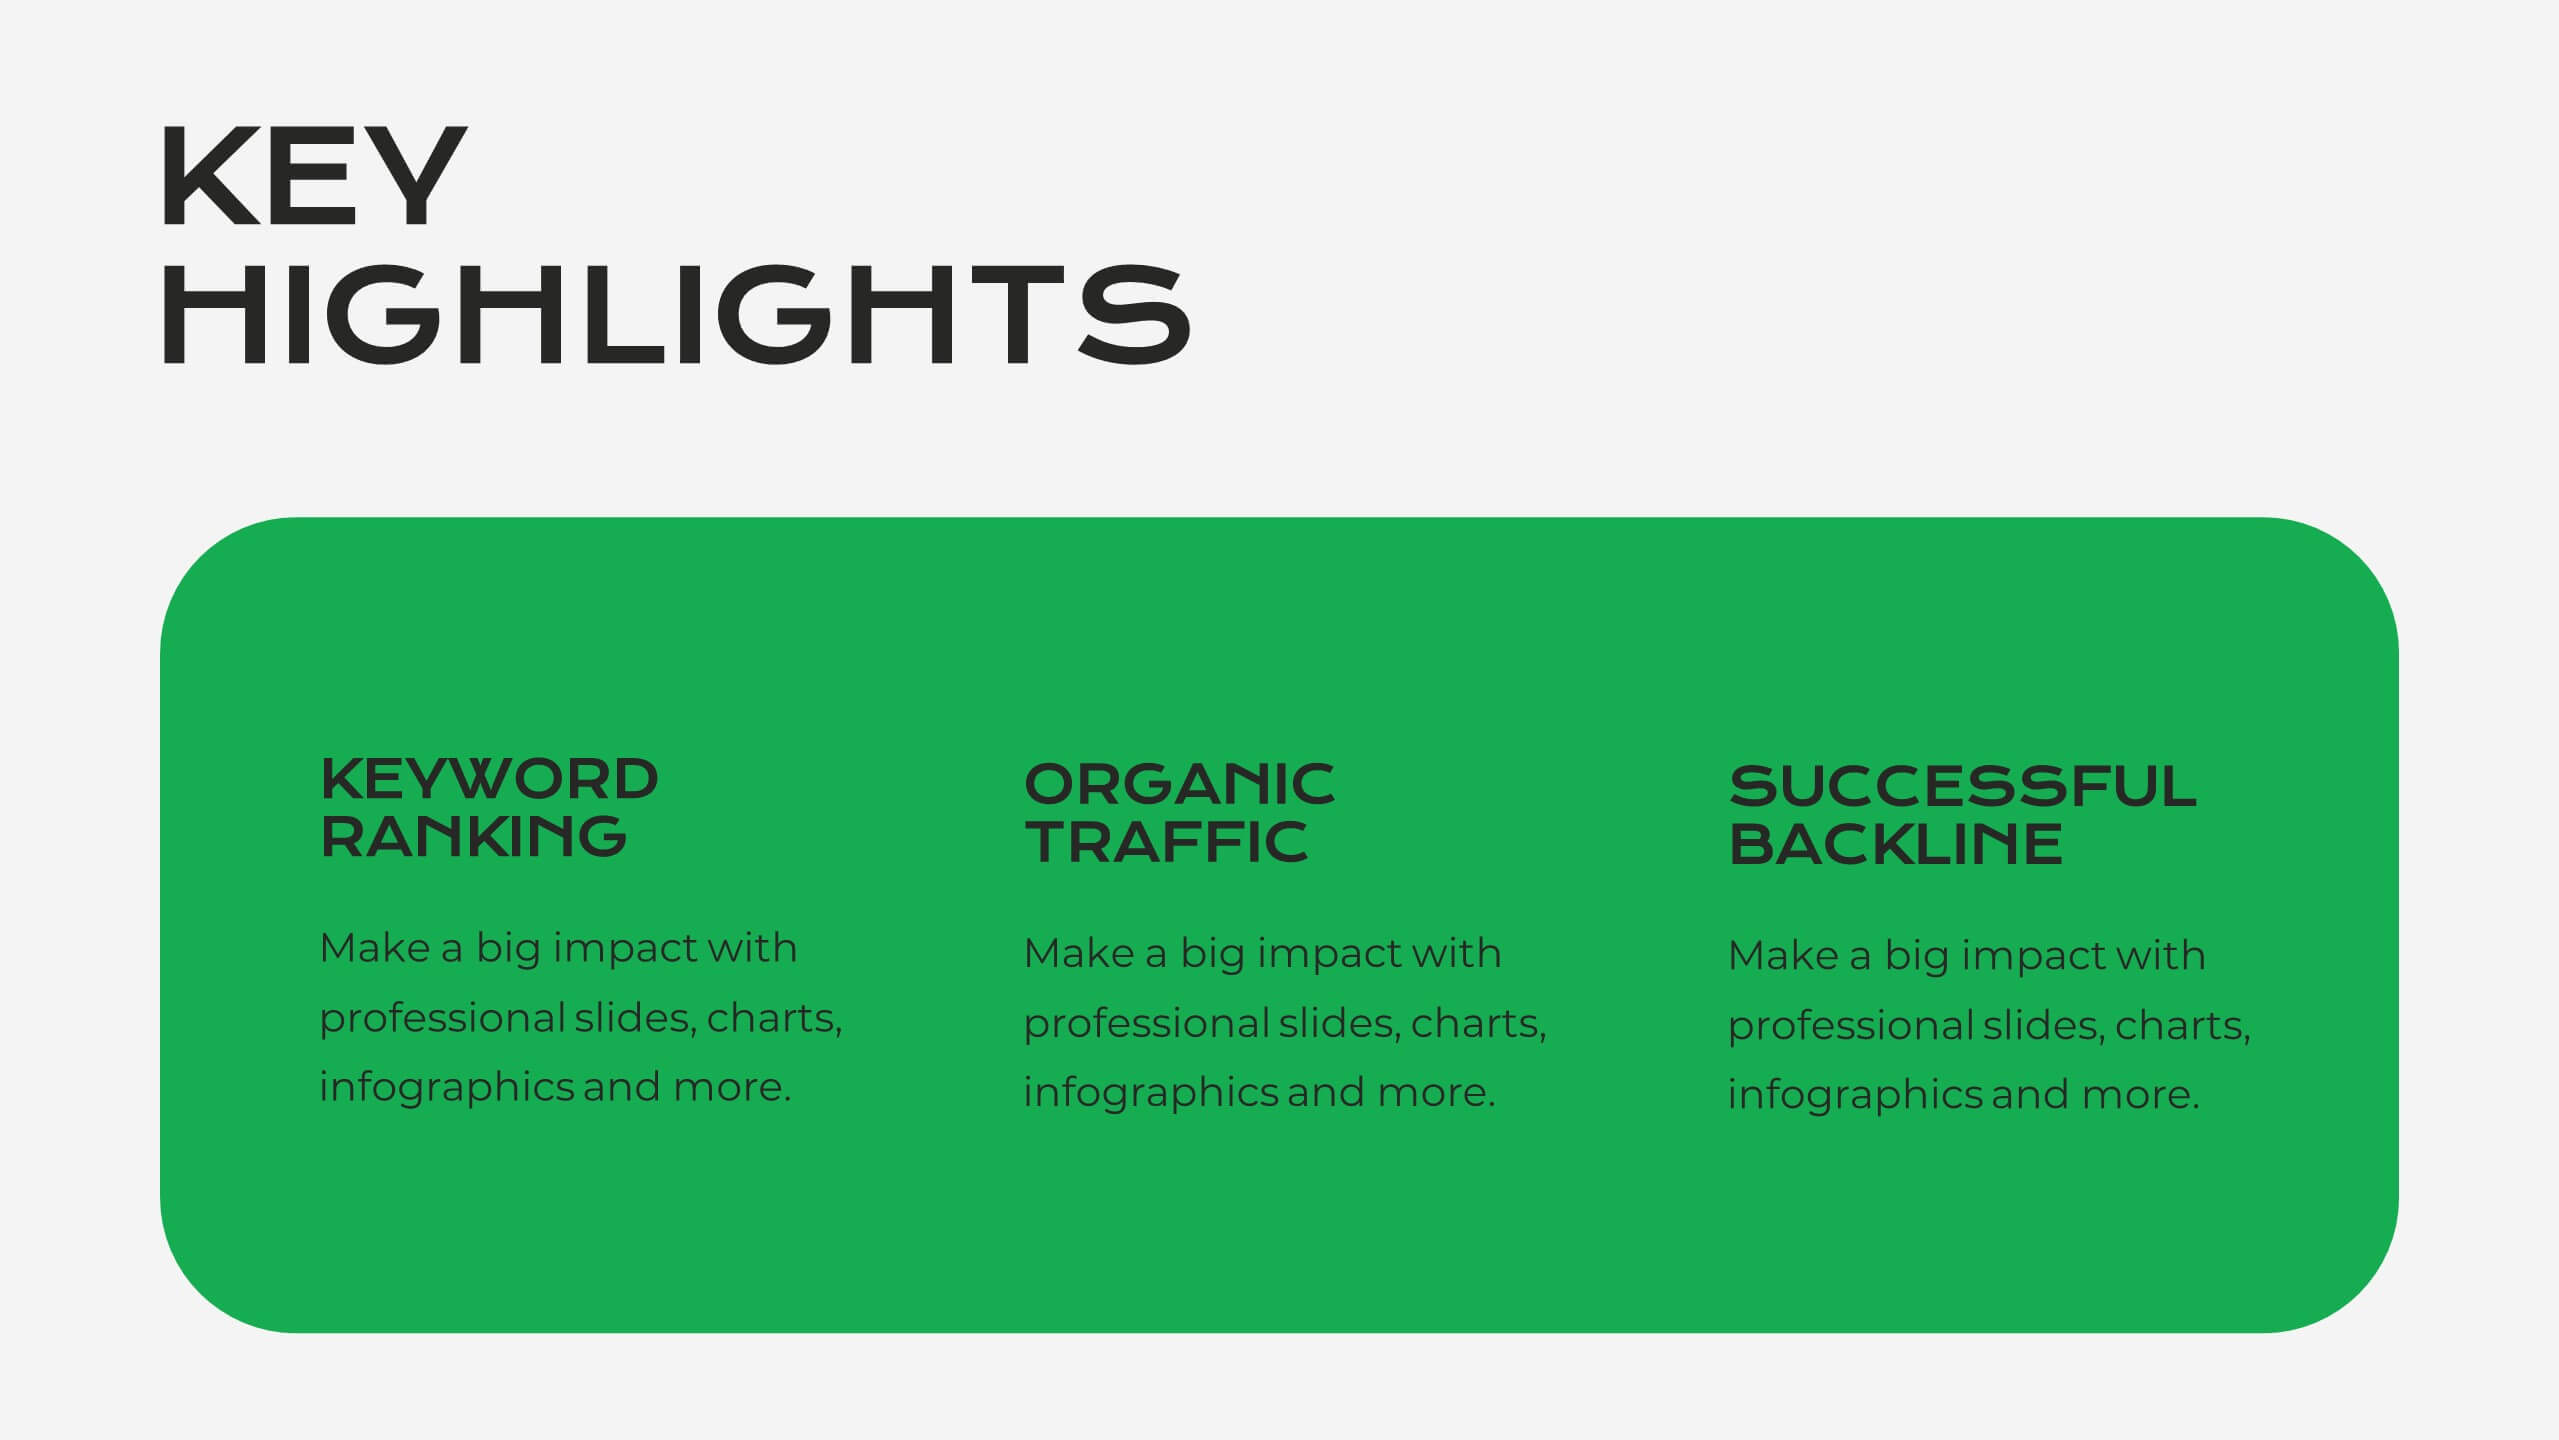
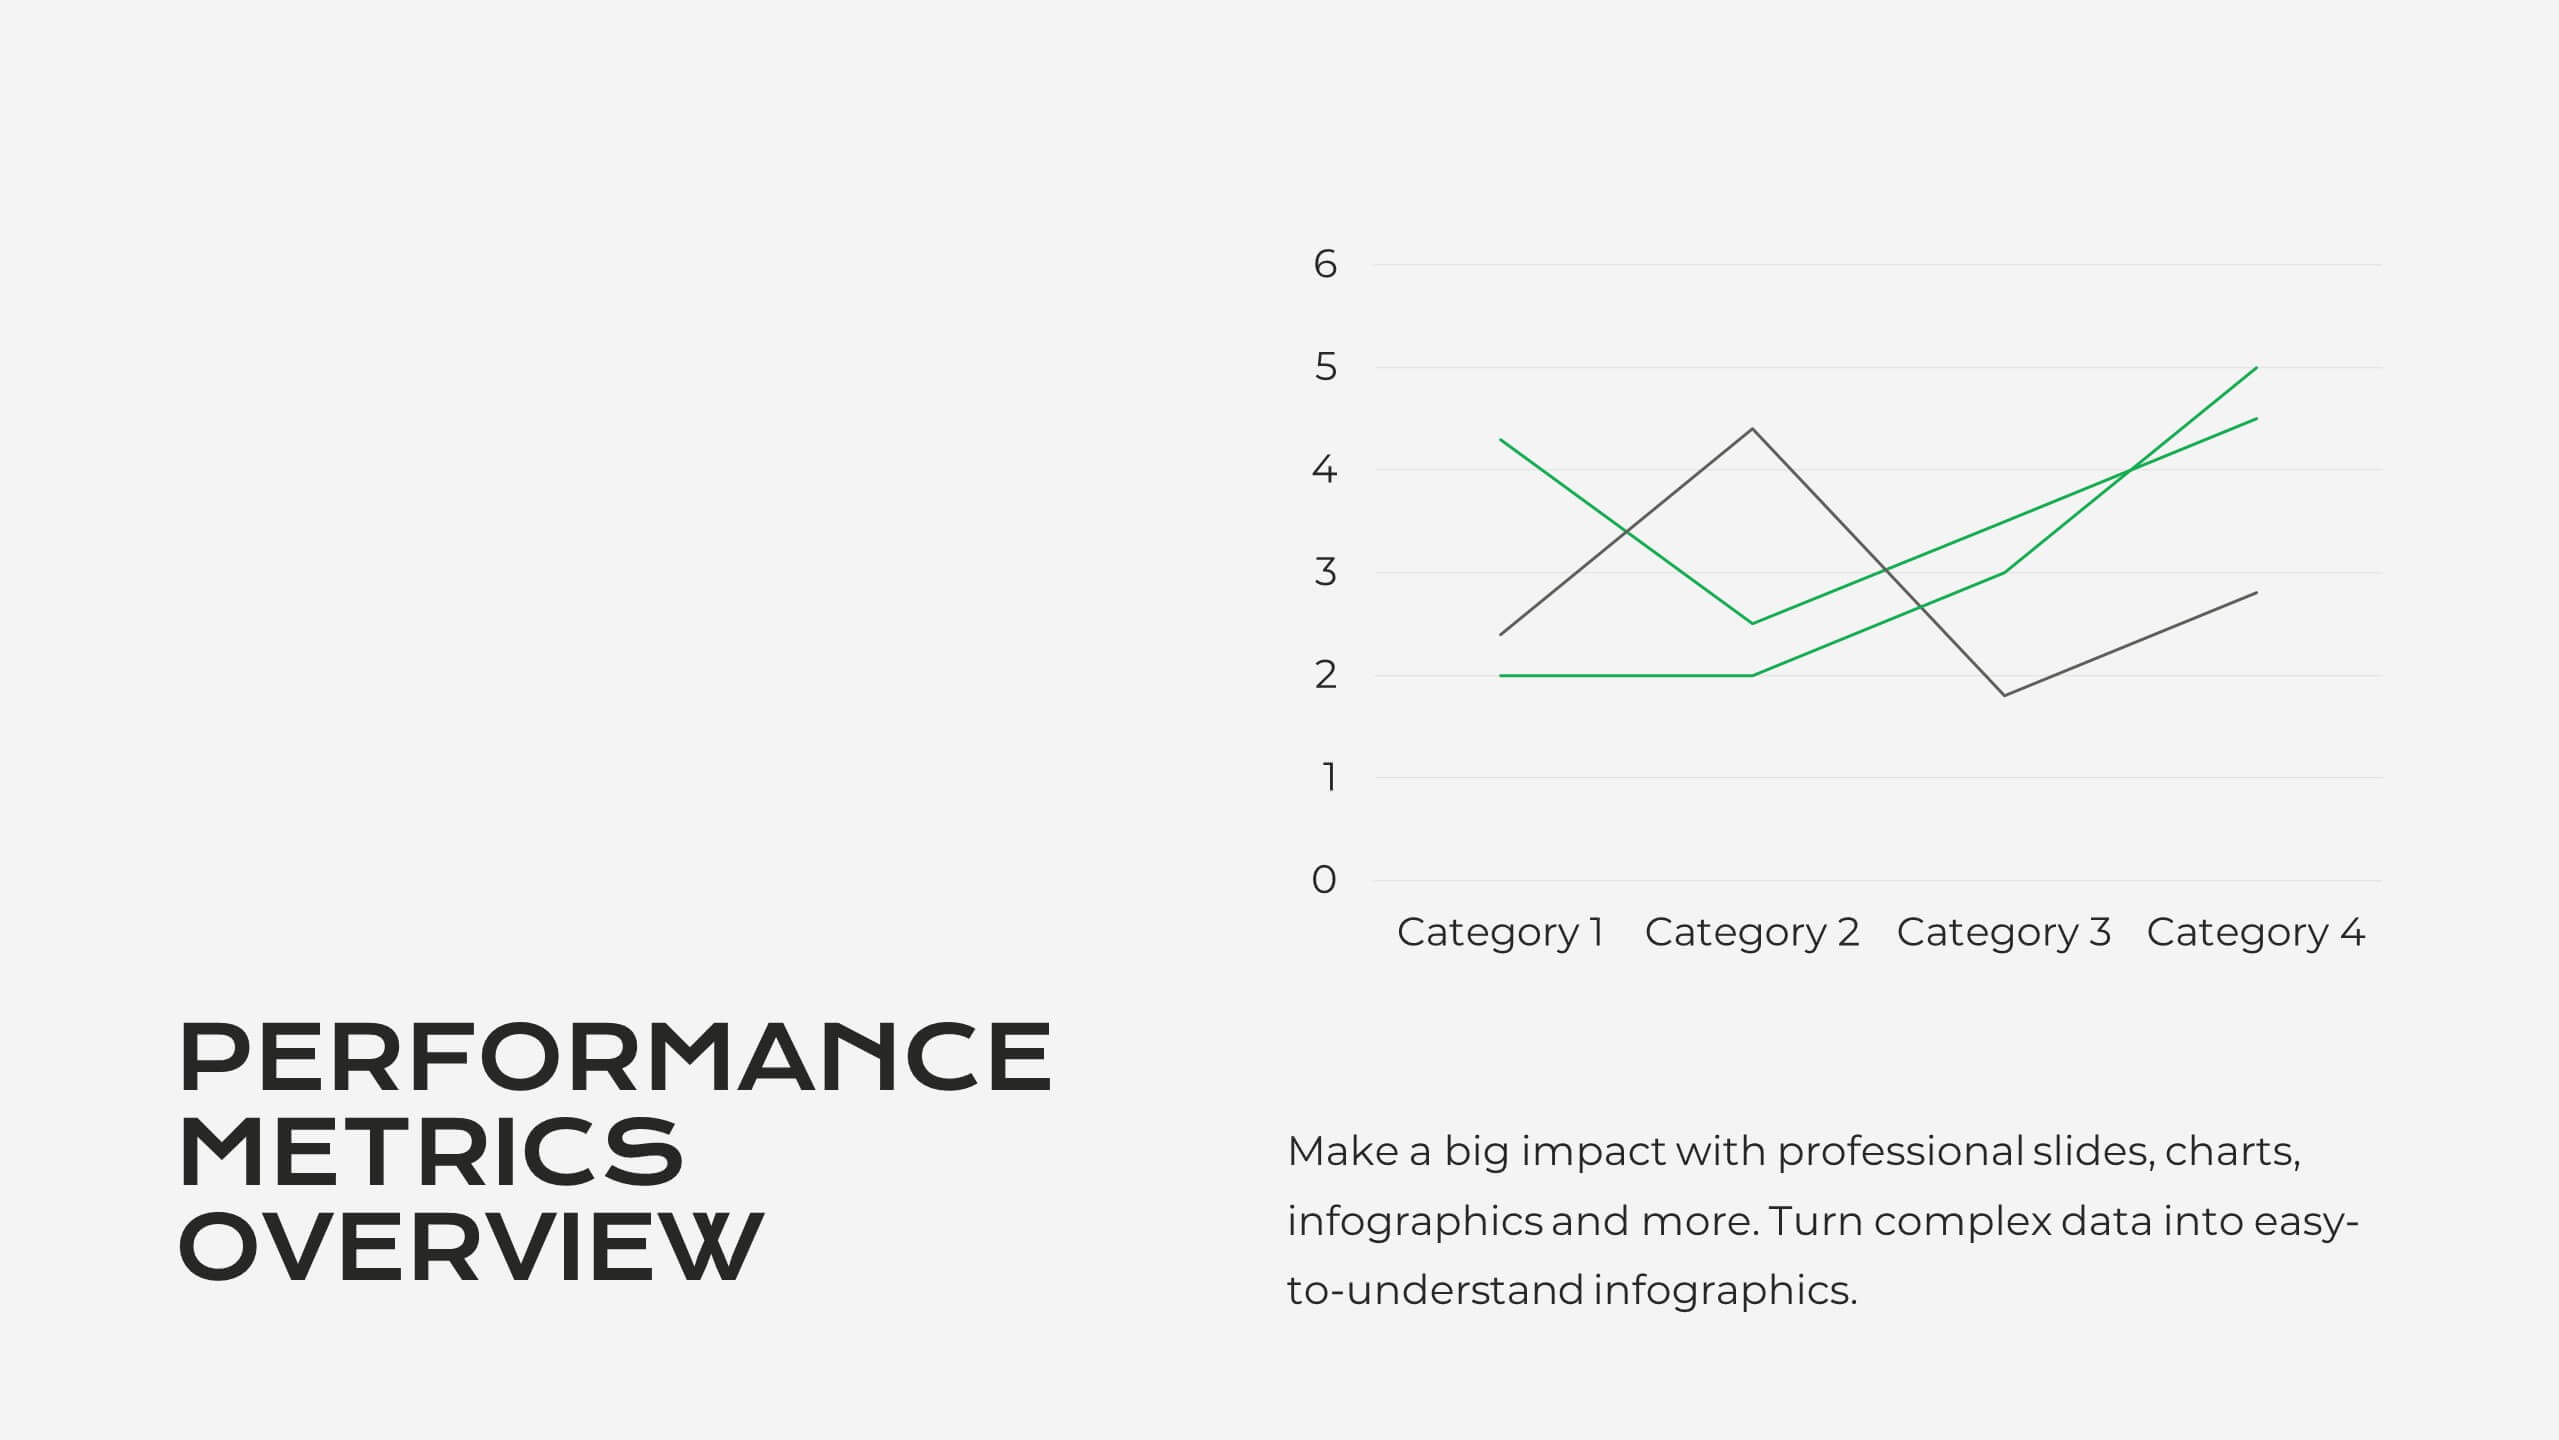
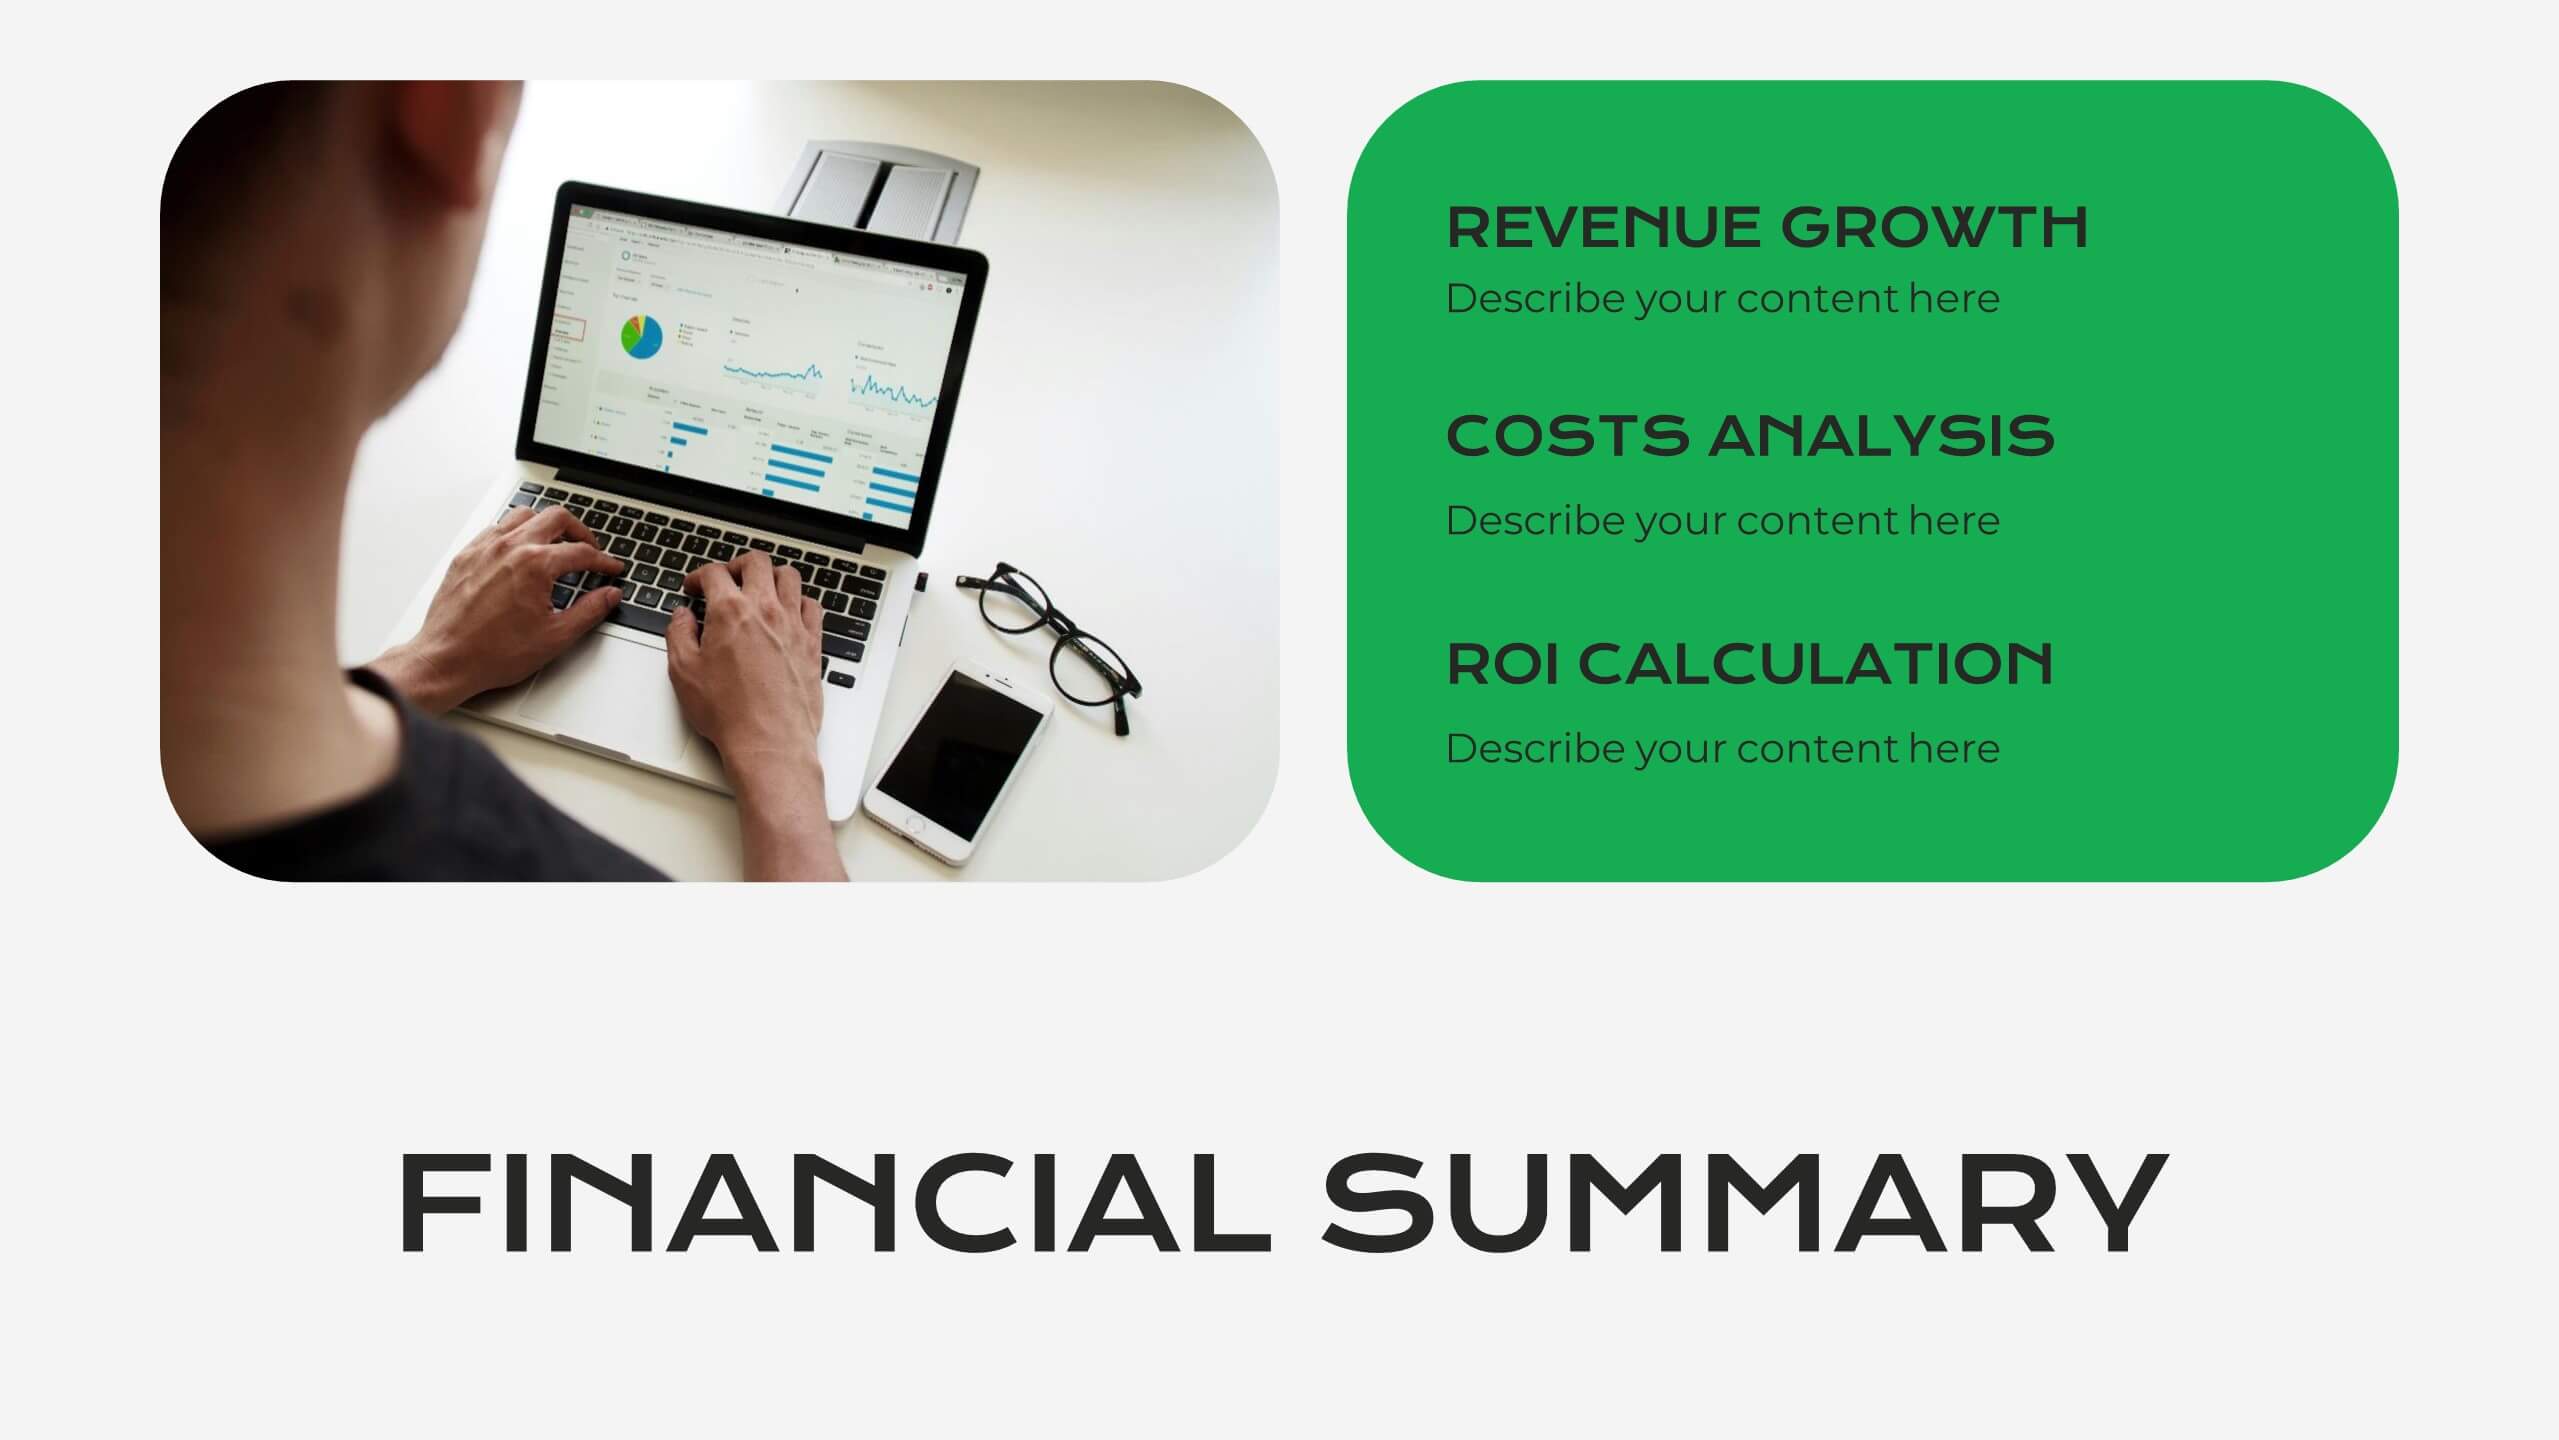
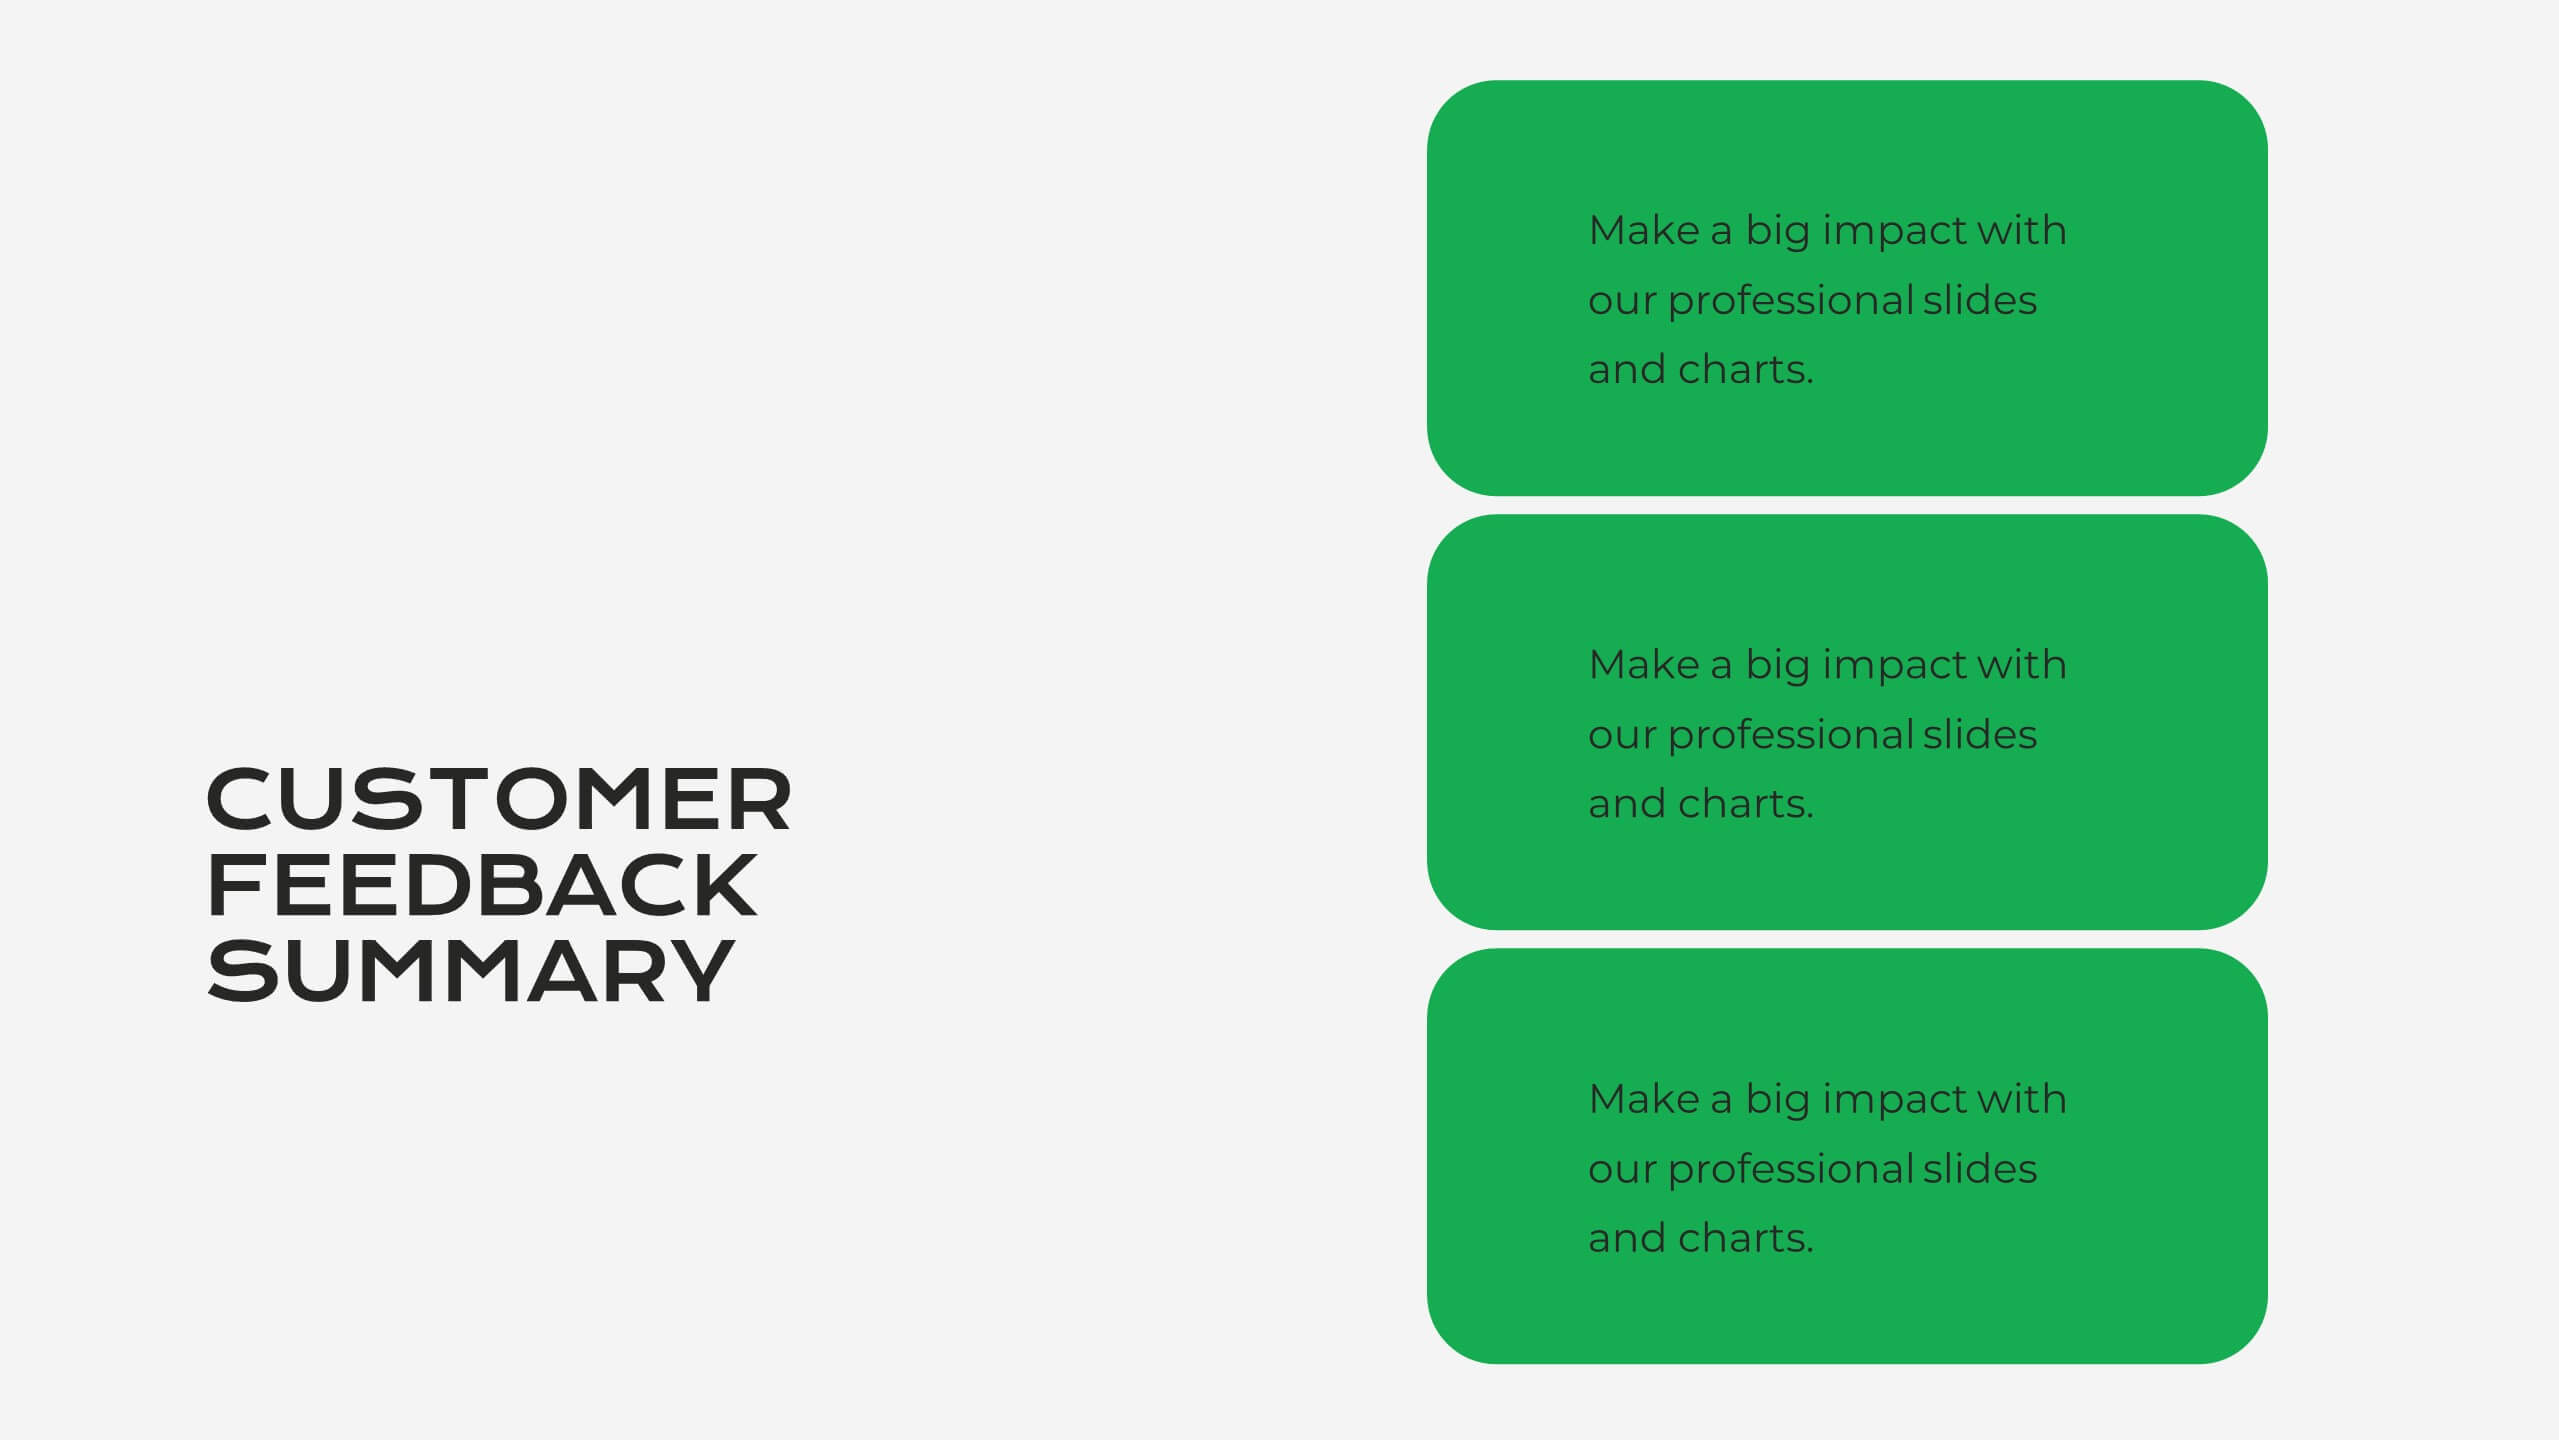
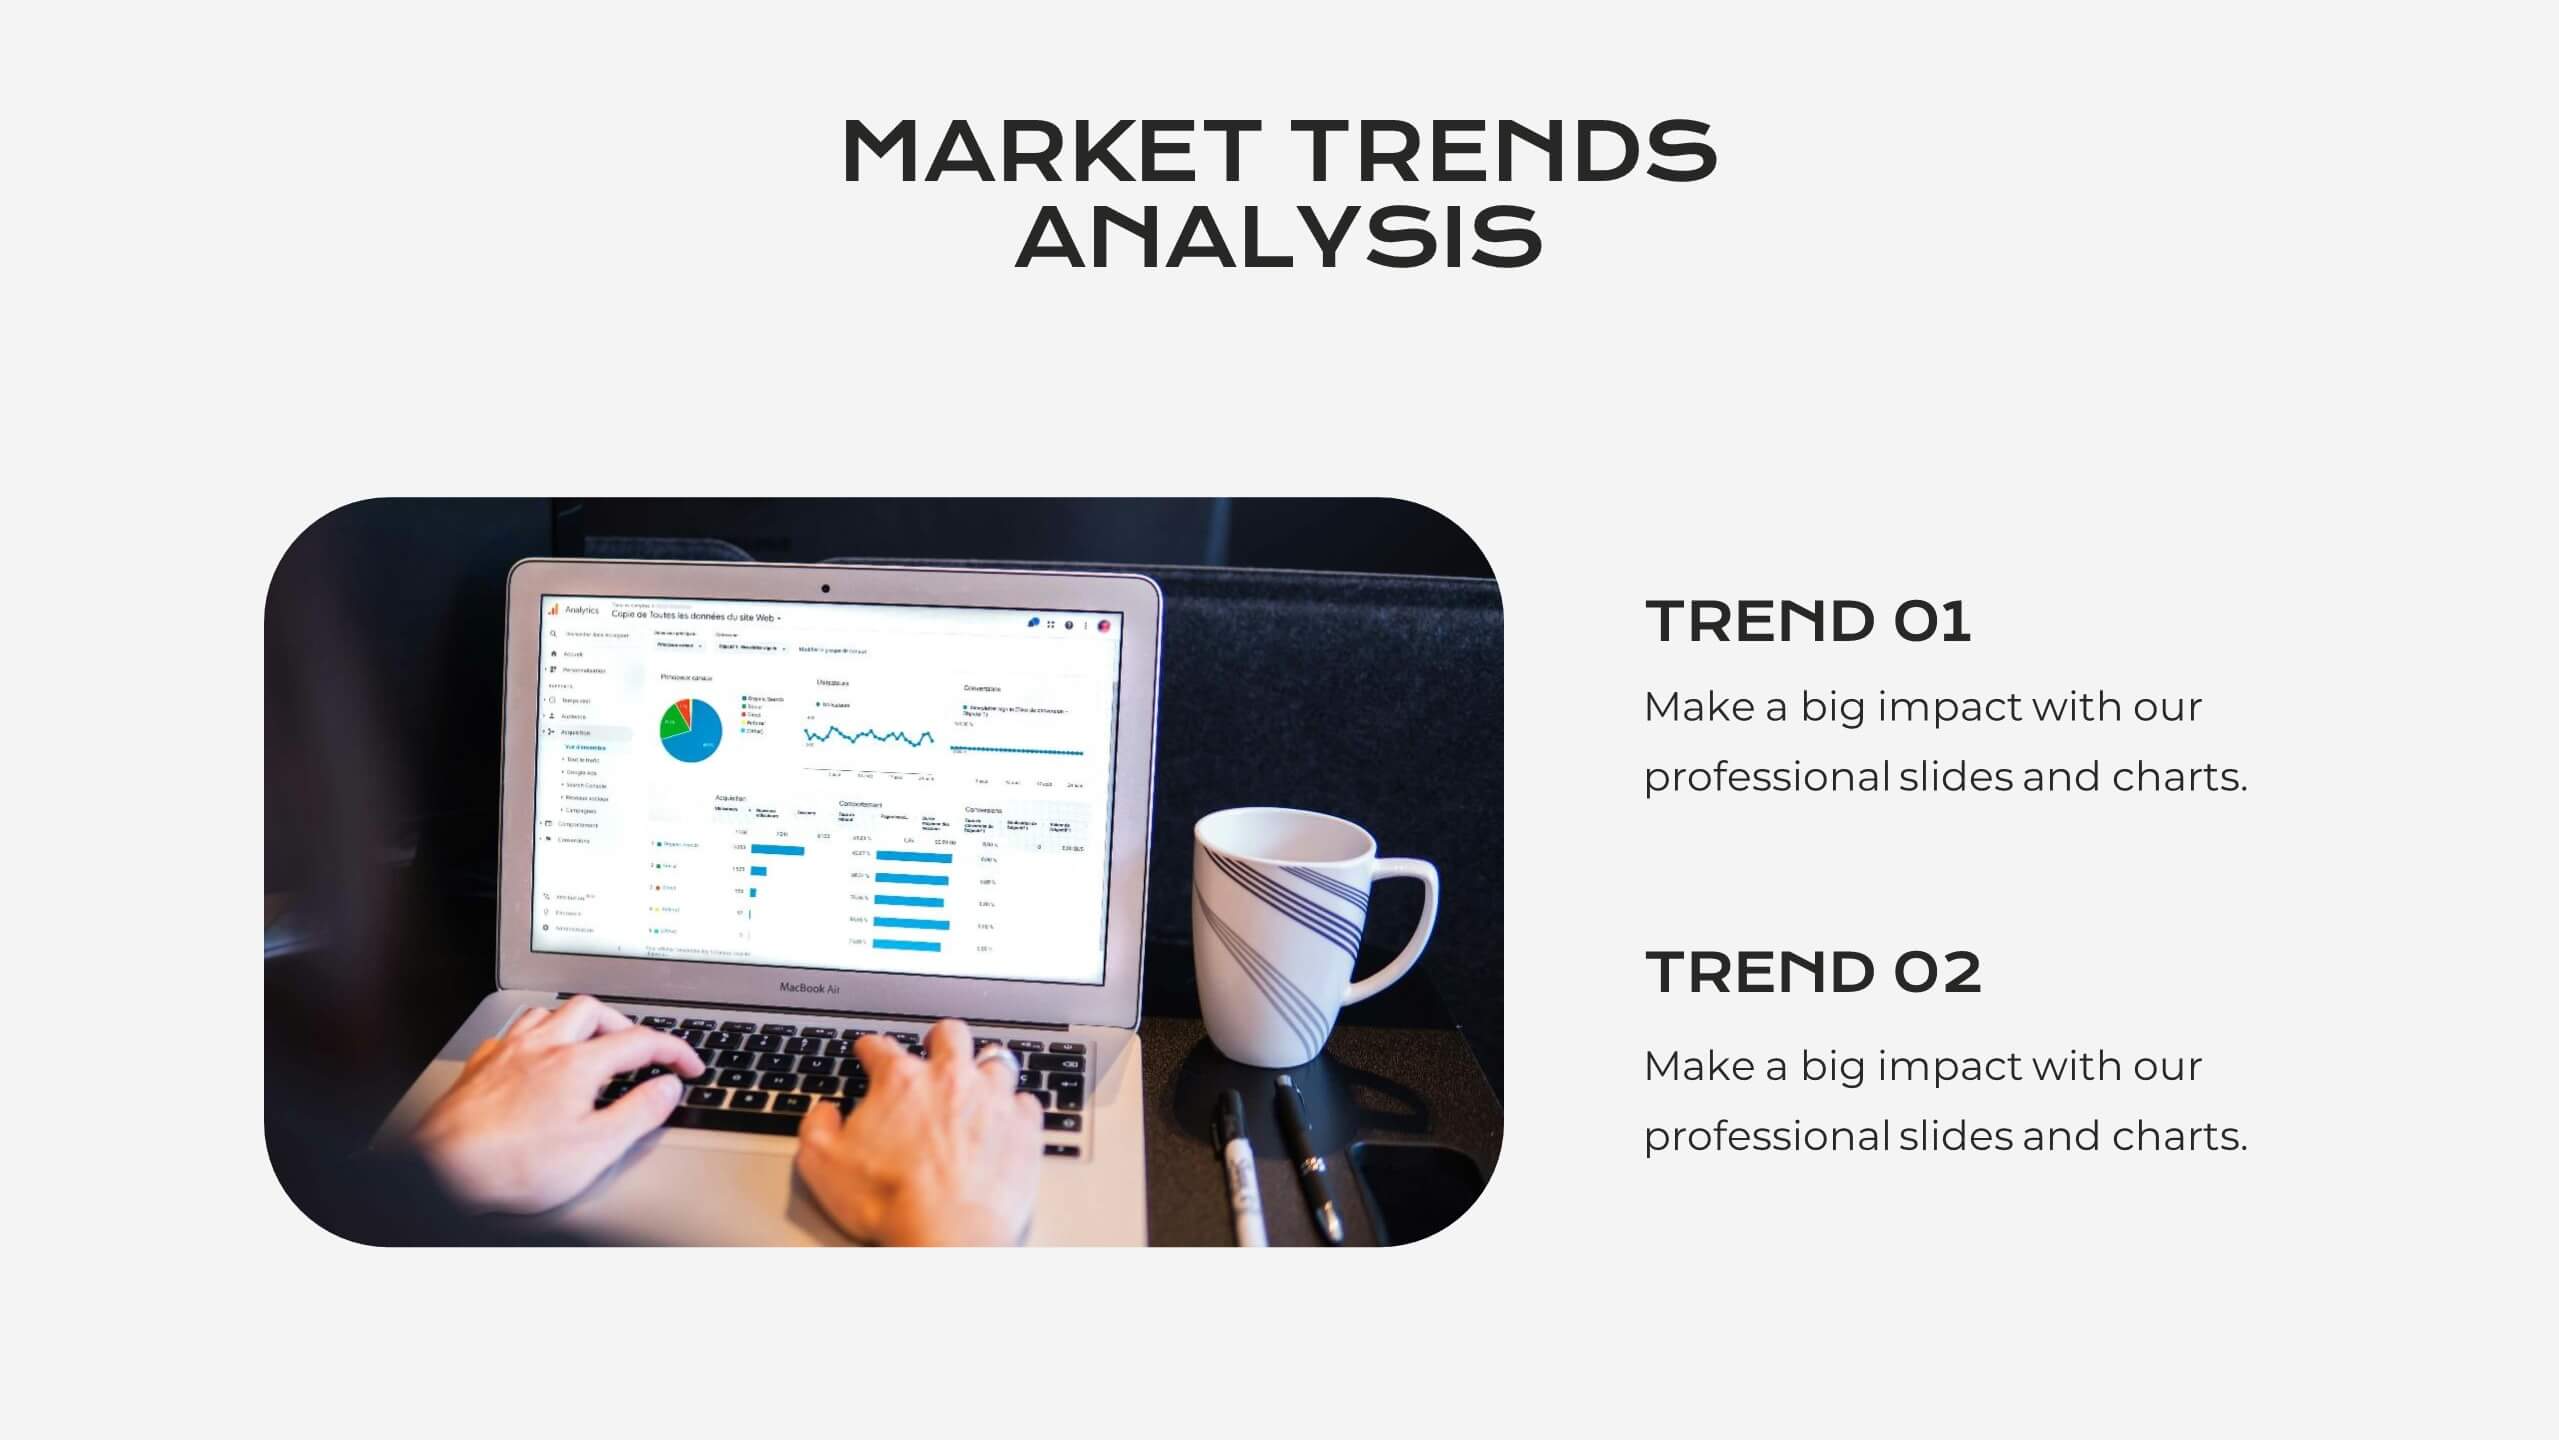
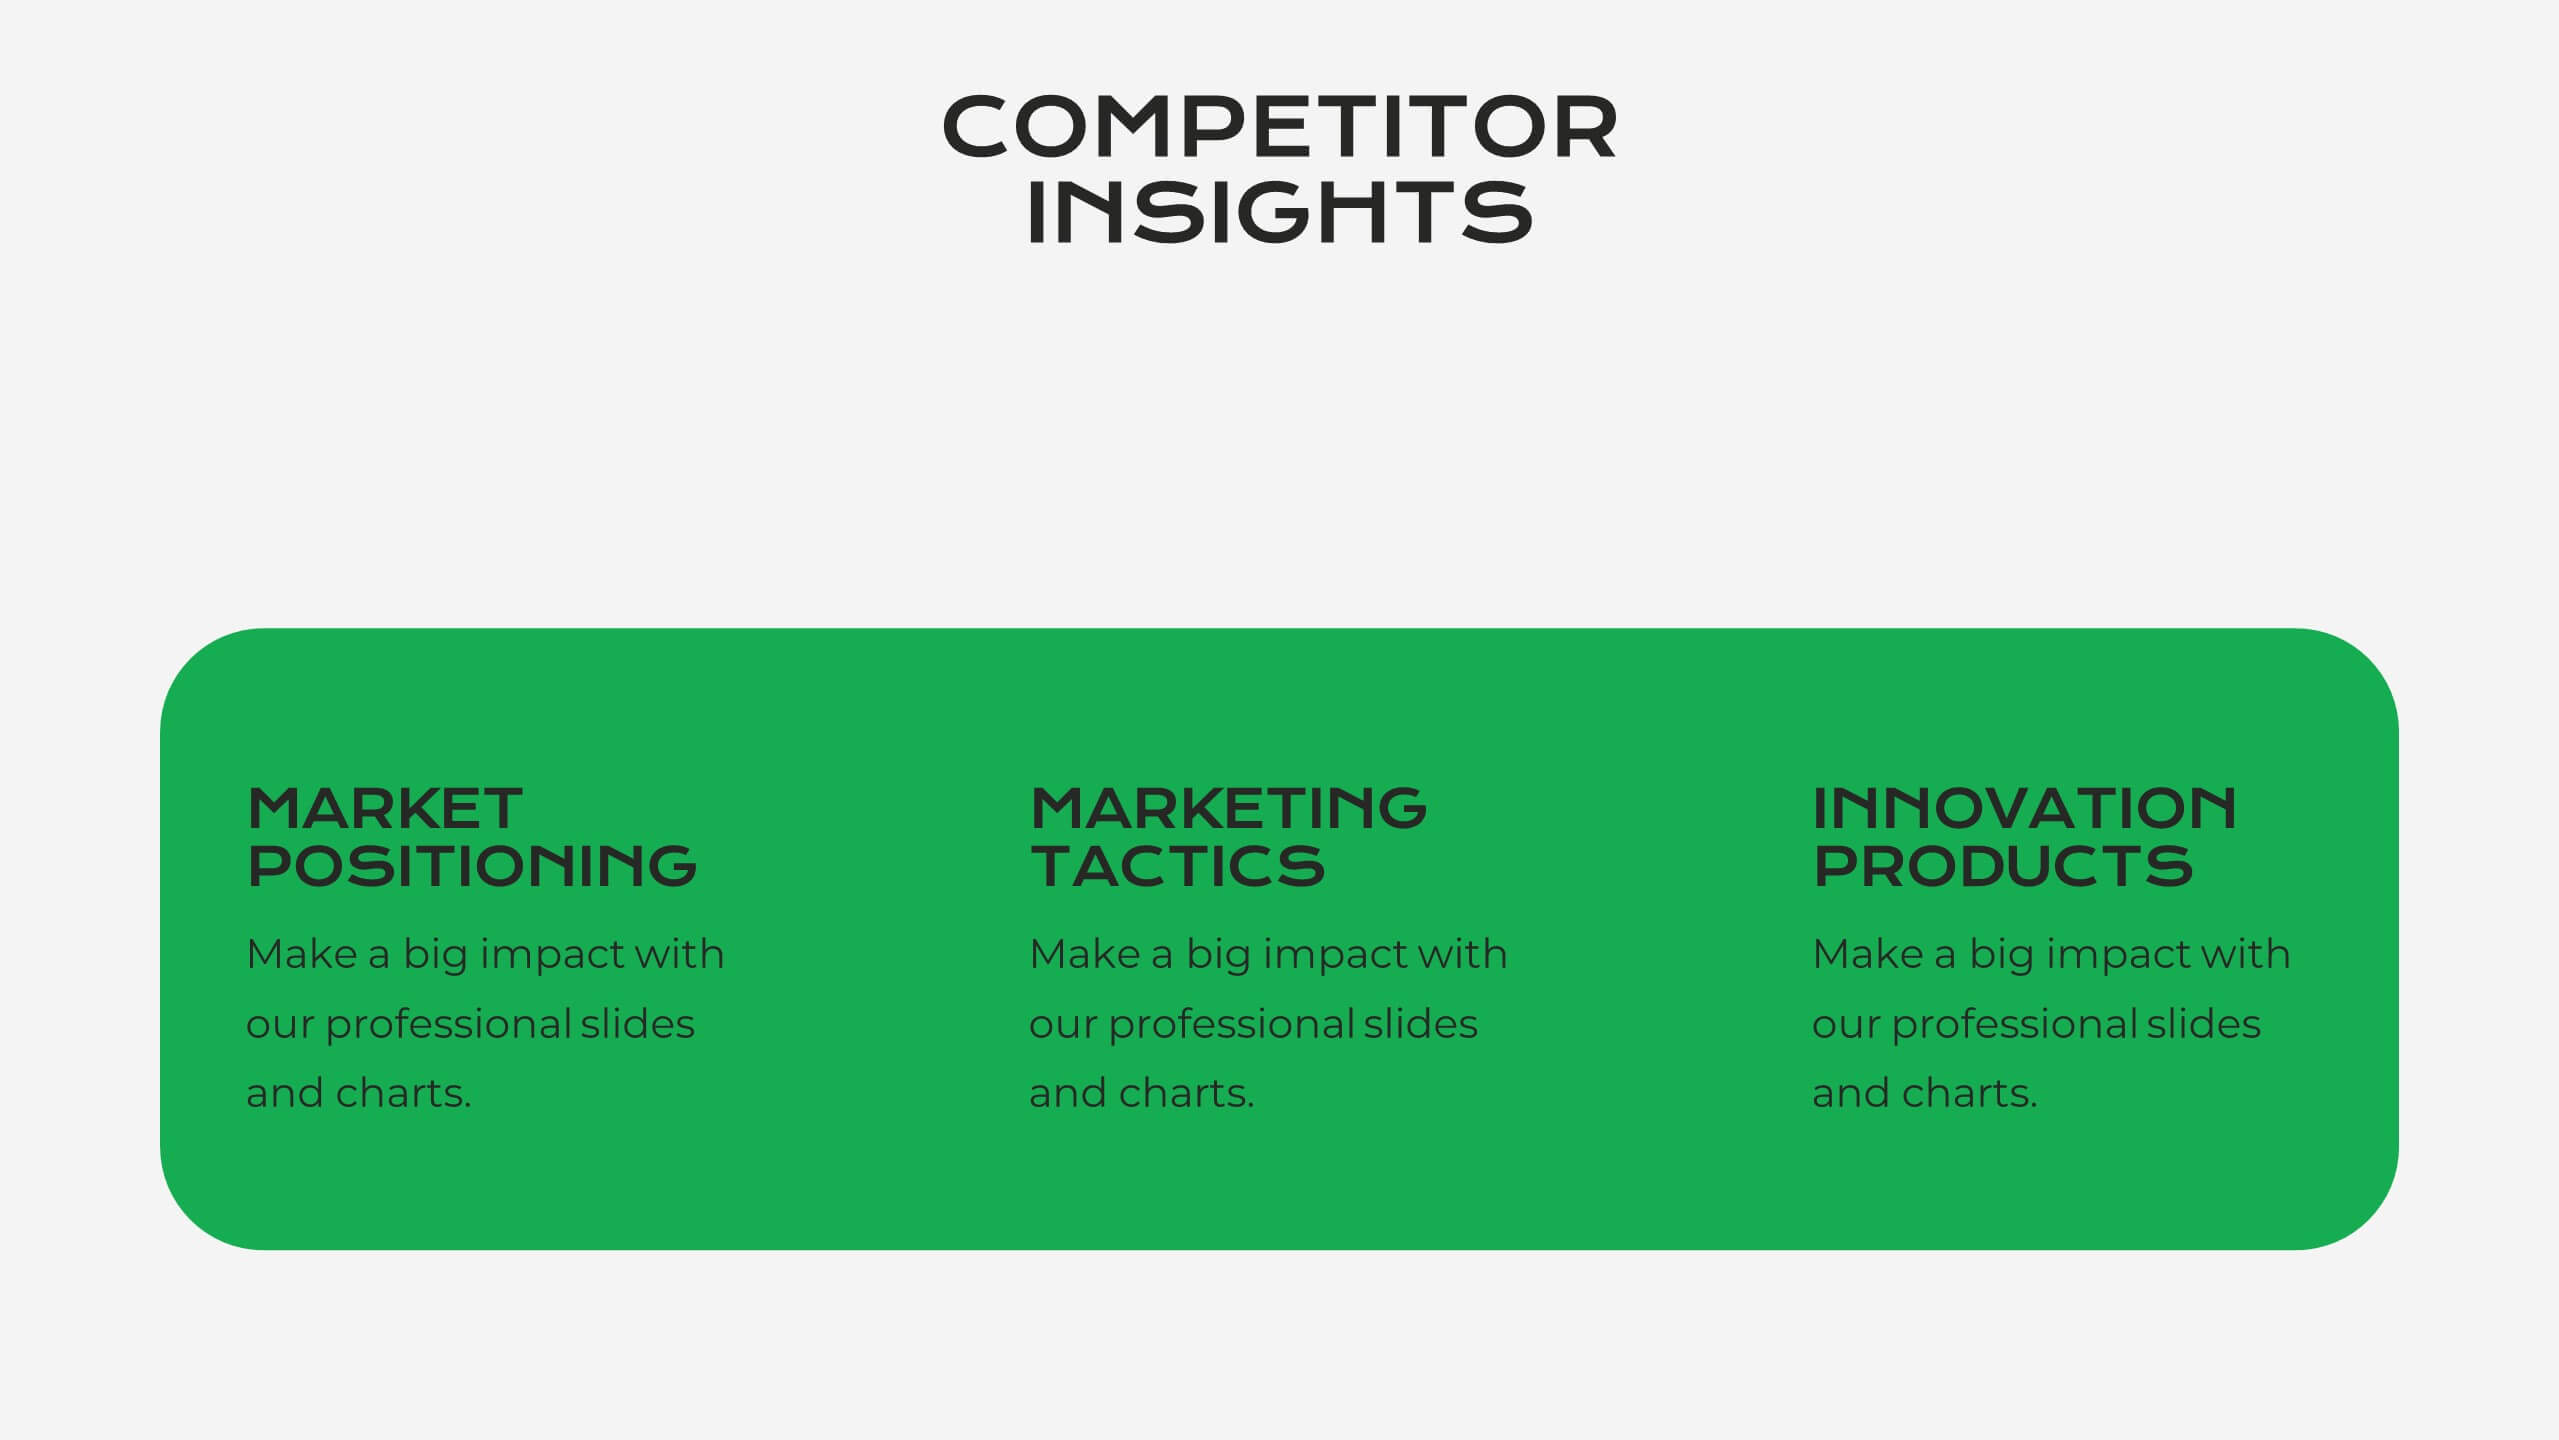
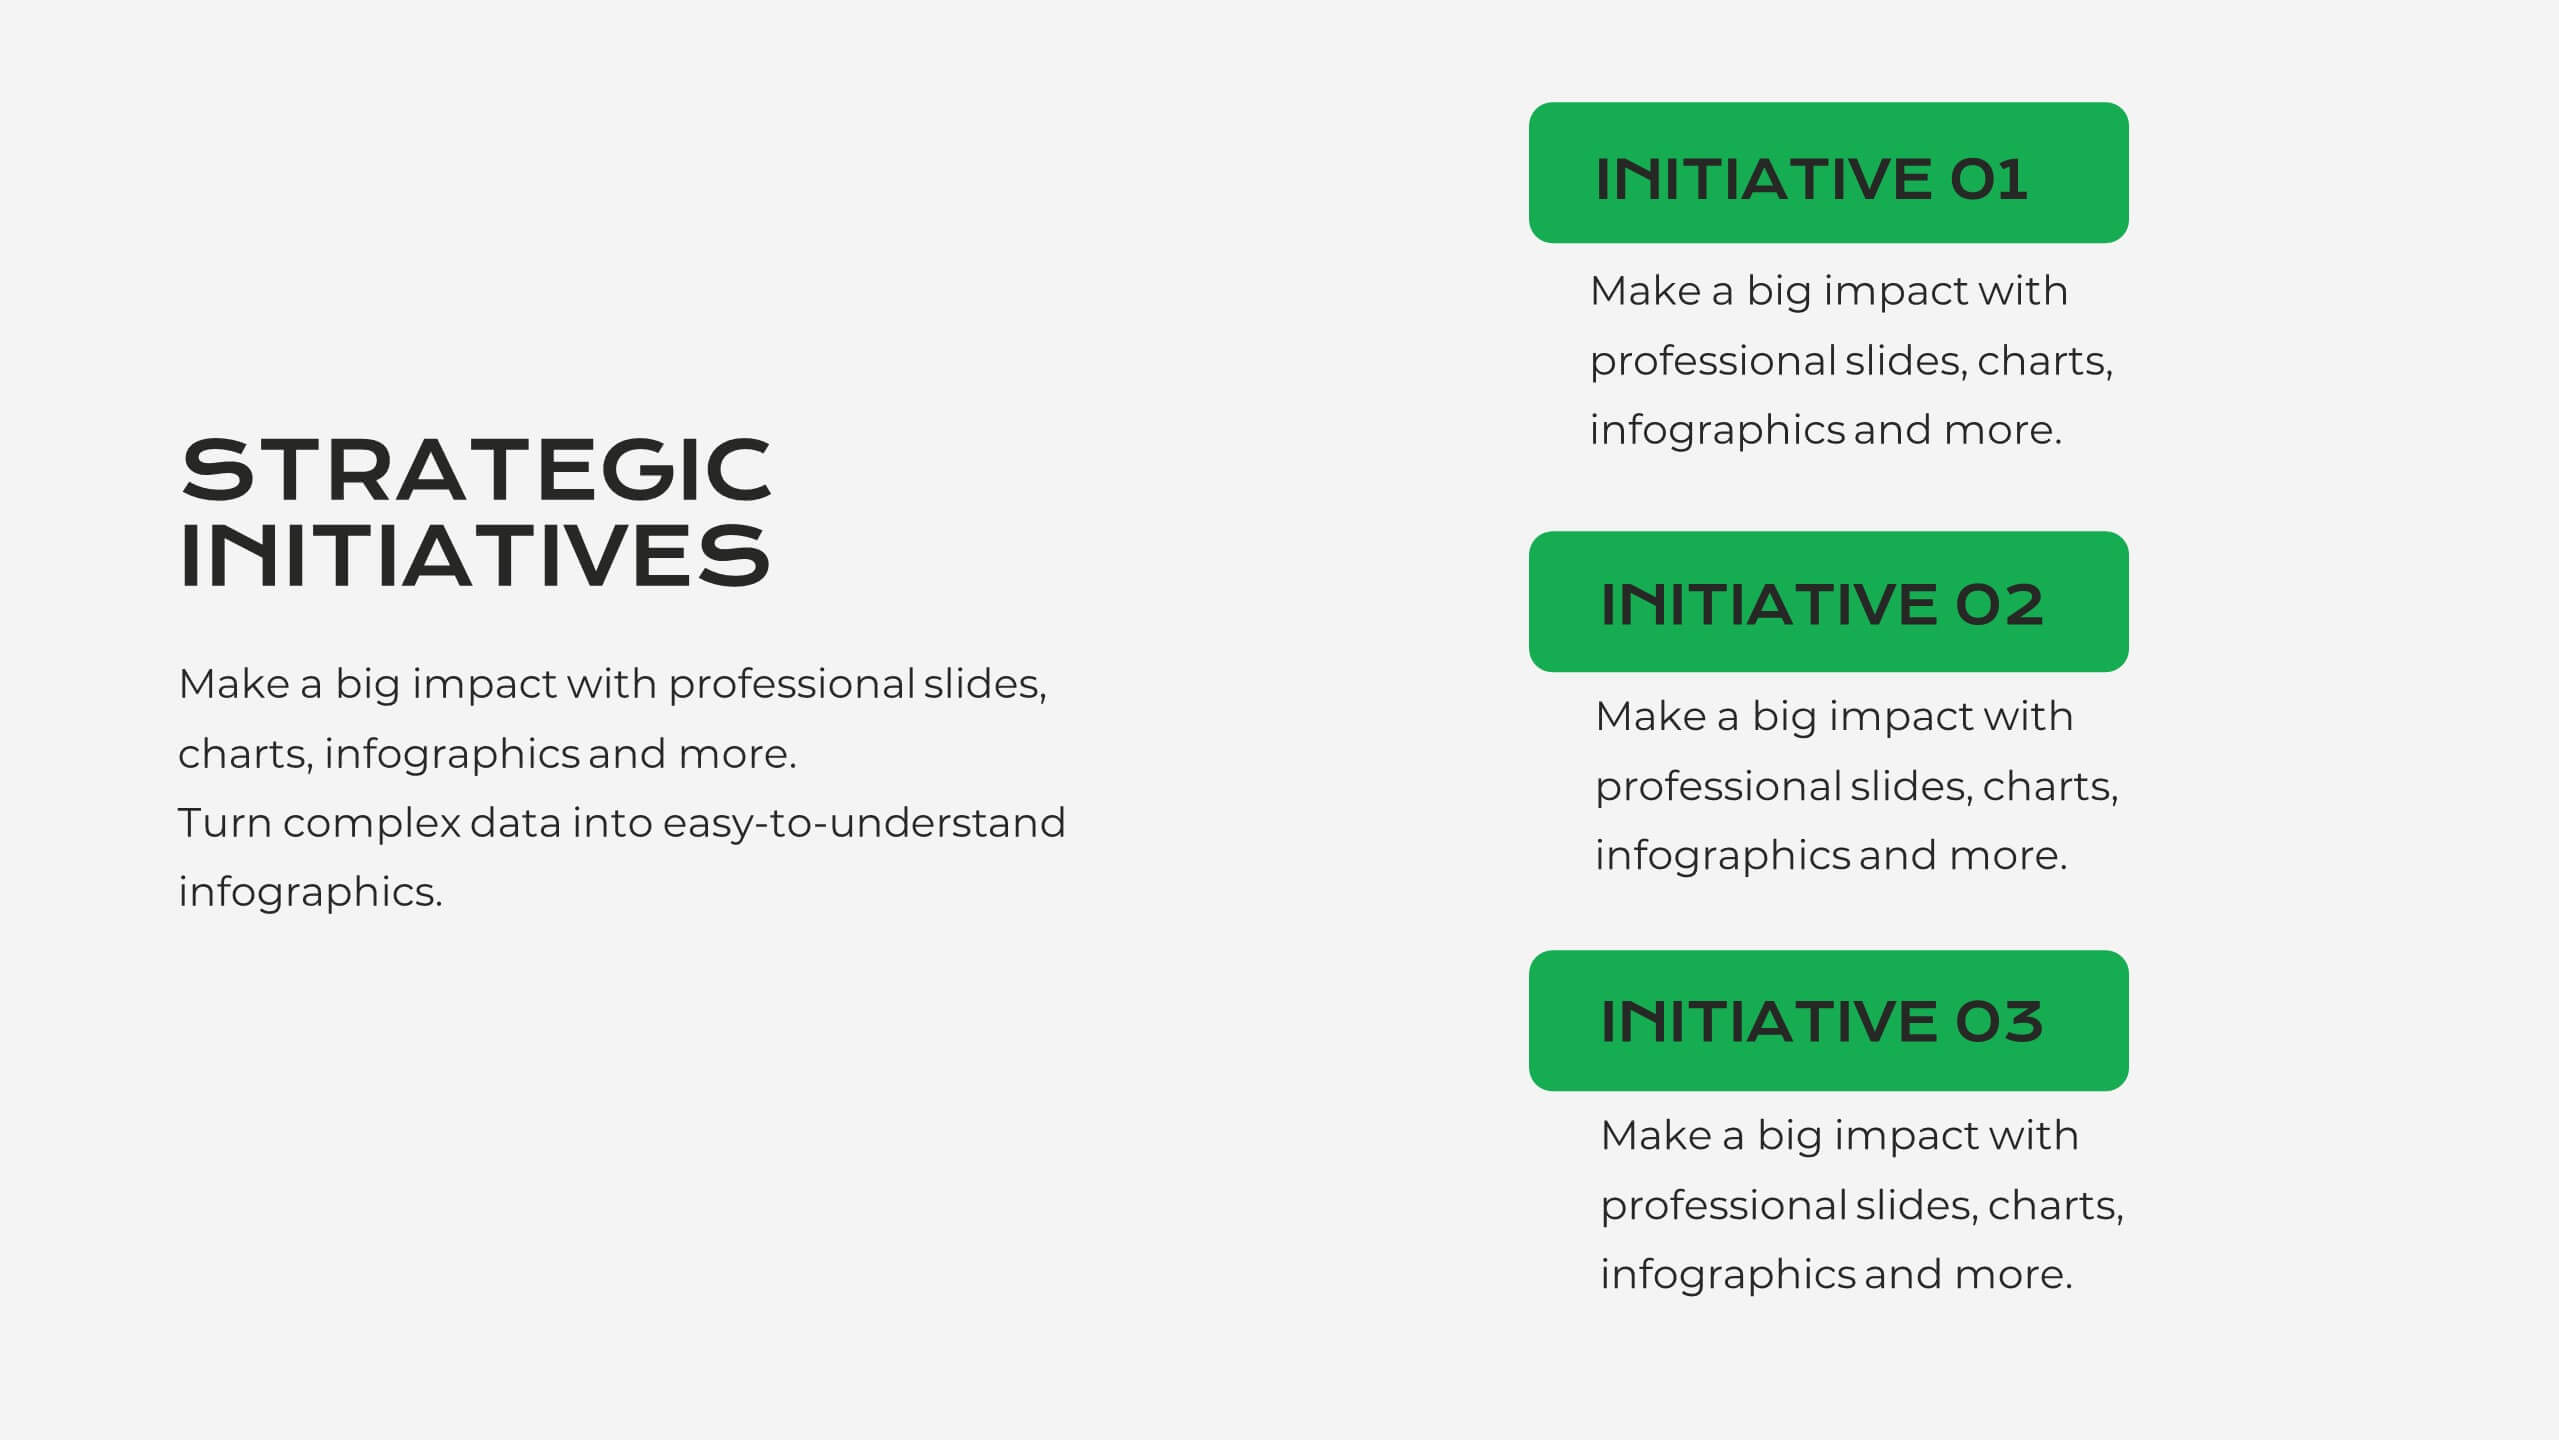
Serene Market Analysis Report Presentation
This modern and clean Market Analysis Report template is designed to help you present key data and insights with clarity and impact. Ideal for business professionals and analysts, it includes slides for key highlights, performance metrics, financial summaries, competitor insights, and strategic initiatives. The template's sleek layout ensures that your data is easy to understand and visually appealing, making it perfect for internal reports or client presentations. Customize it effortlessly in PowerPoint, Keynote, or Google Slides, and impress your audience with a polished and professional report.


6 diapositivas
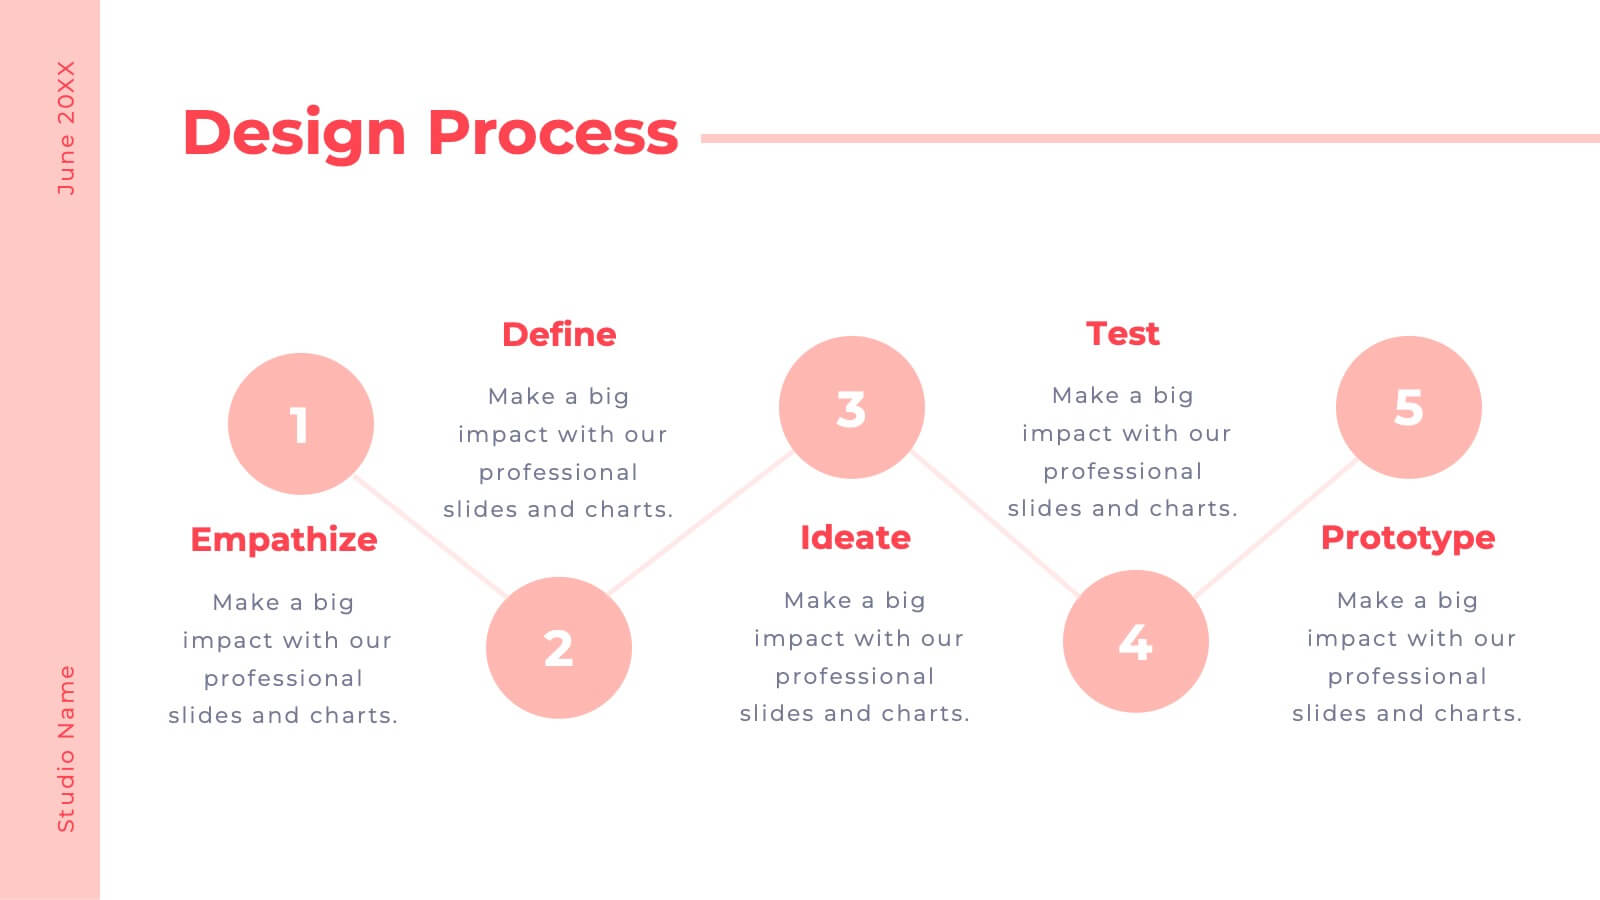
Unique Intersection Comparison Diagram
Illustrate complex relationships with clarity using the Unique Intersection Comparison Diagram Presentation. This visually engaging 5-circle diagram highlights overlaps and distinct points, ideal for showcasing cross-functional collaboration, multi-variable strategies, or layered comparisons. Each segment supports titles and brief text, making it perfect for business planning, product features, or audience segmentation. Fully editable in PowerPoint, Keynote, and Google Slides.


8 diapositivas
Agriculture Business Model Presentation
Turn your ideas into growth with this vibrant and modern presentation design. Perfect for explaining market strategies, production cycles, or investment models in agriculture, it helps visualize key stages from concept to harvest. Fully customizable and compatible with PowerPoint, Keynote, and Google Slides for a seamless presentation experience.


21 diapositivas
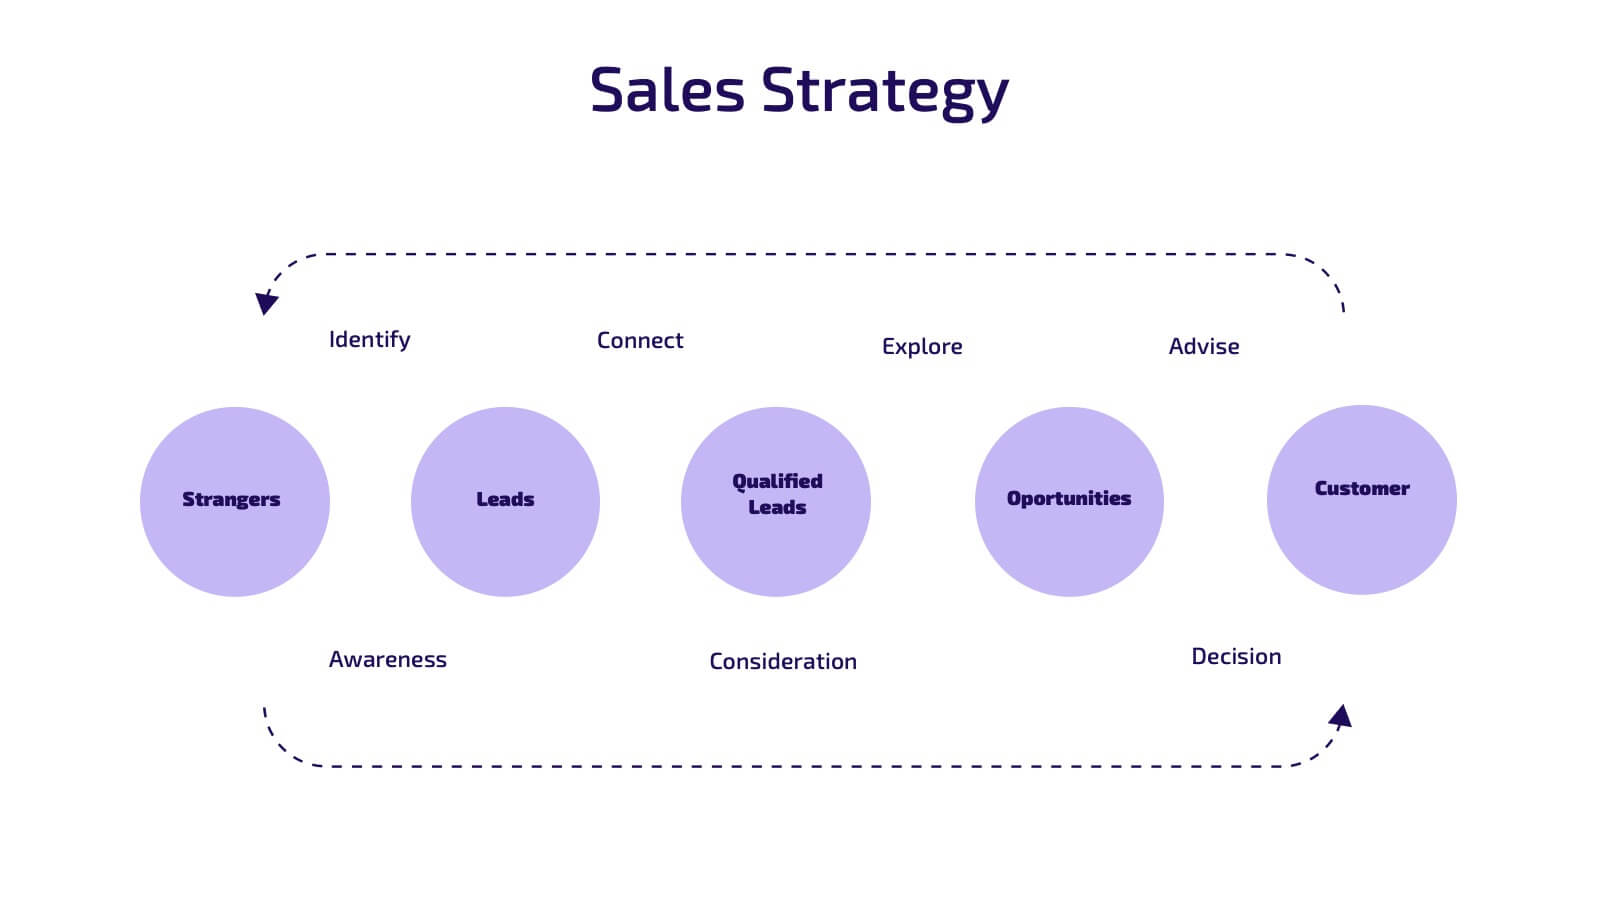
Runewood Marketing Proposal Template Presentation
The Marketing Proposal Presentation Template provides 21 slides covering core aspects like market presence, growth strategies, and financial highlights. Perfect for agencies and businesses to showcase their marketing strategies effectively. Fully customizable and compatible with PowerPoint, Keynote, and Google Slides.


5 diapositivas
Freight and Shipping Optimization Presentation
Streamline your logistics narrative with this world map–inspired layout designed for international freight strategies. This infographic-style slide features four customizable location markers with icons and descriptive text, perfect for mapping routes, warehouses, or shipping hubs. Ideal for global supply chain teams, logistics consultants, and shipping analysts. Fully editable in PowerPoint, Keynote, and Google Slides.


4 diapositivas
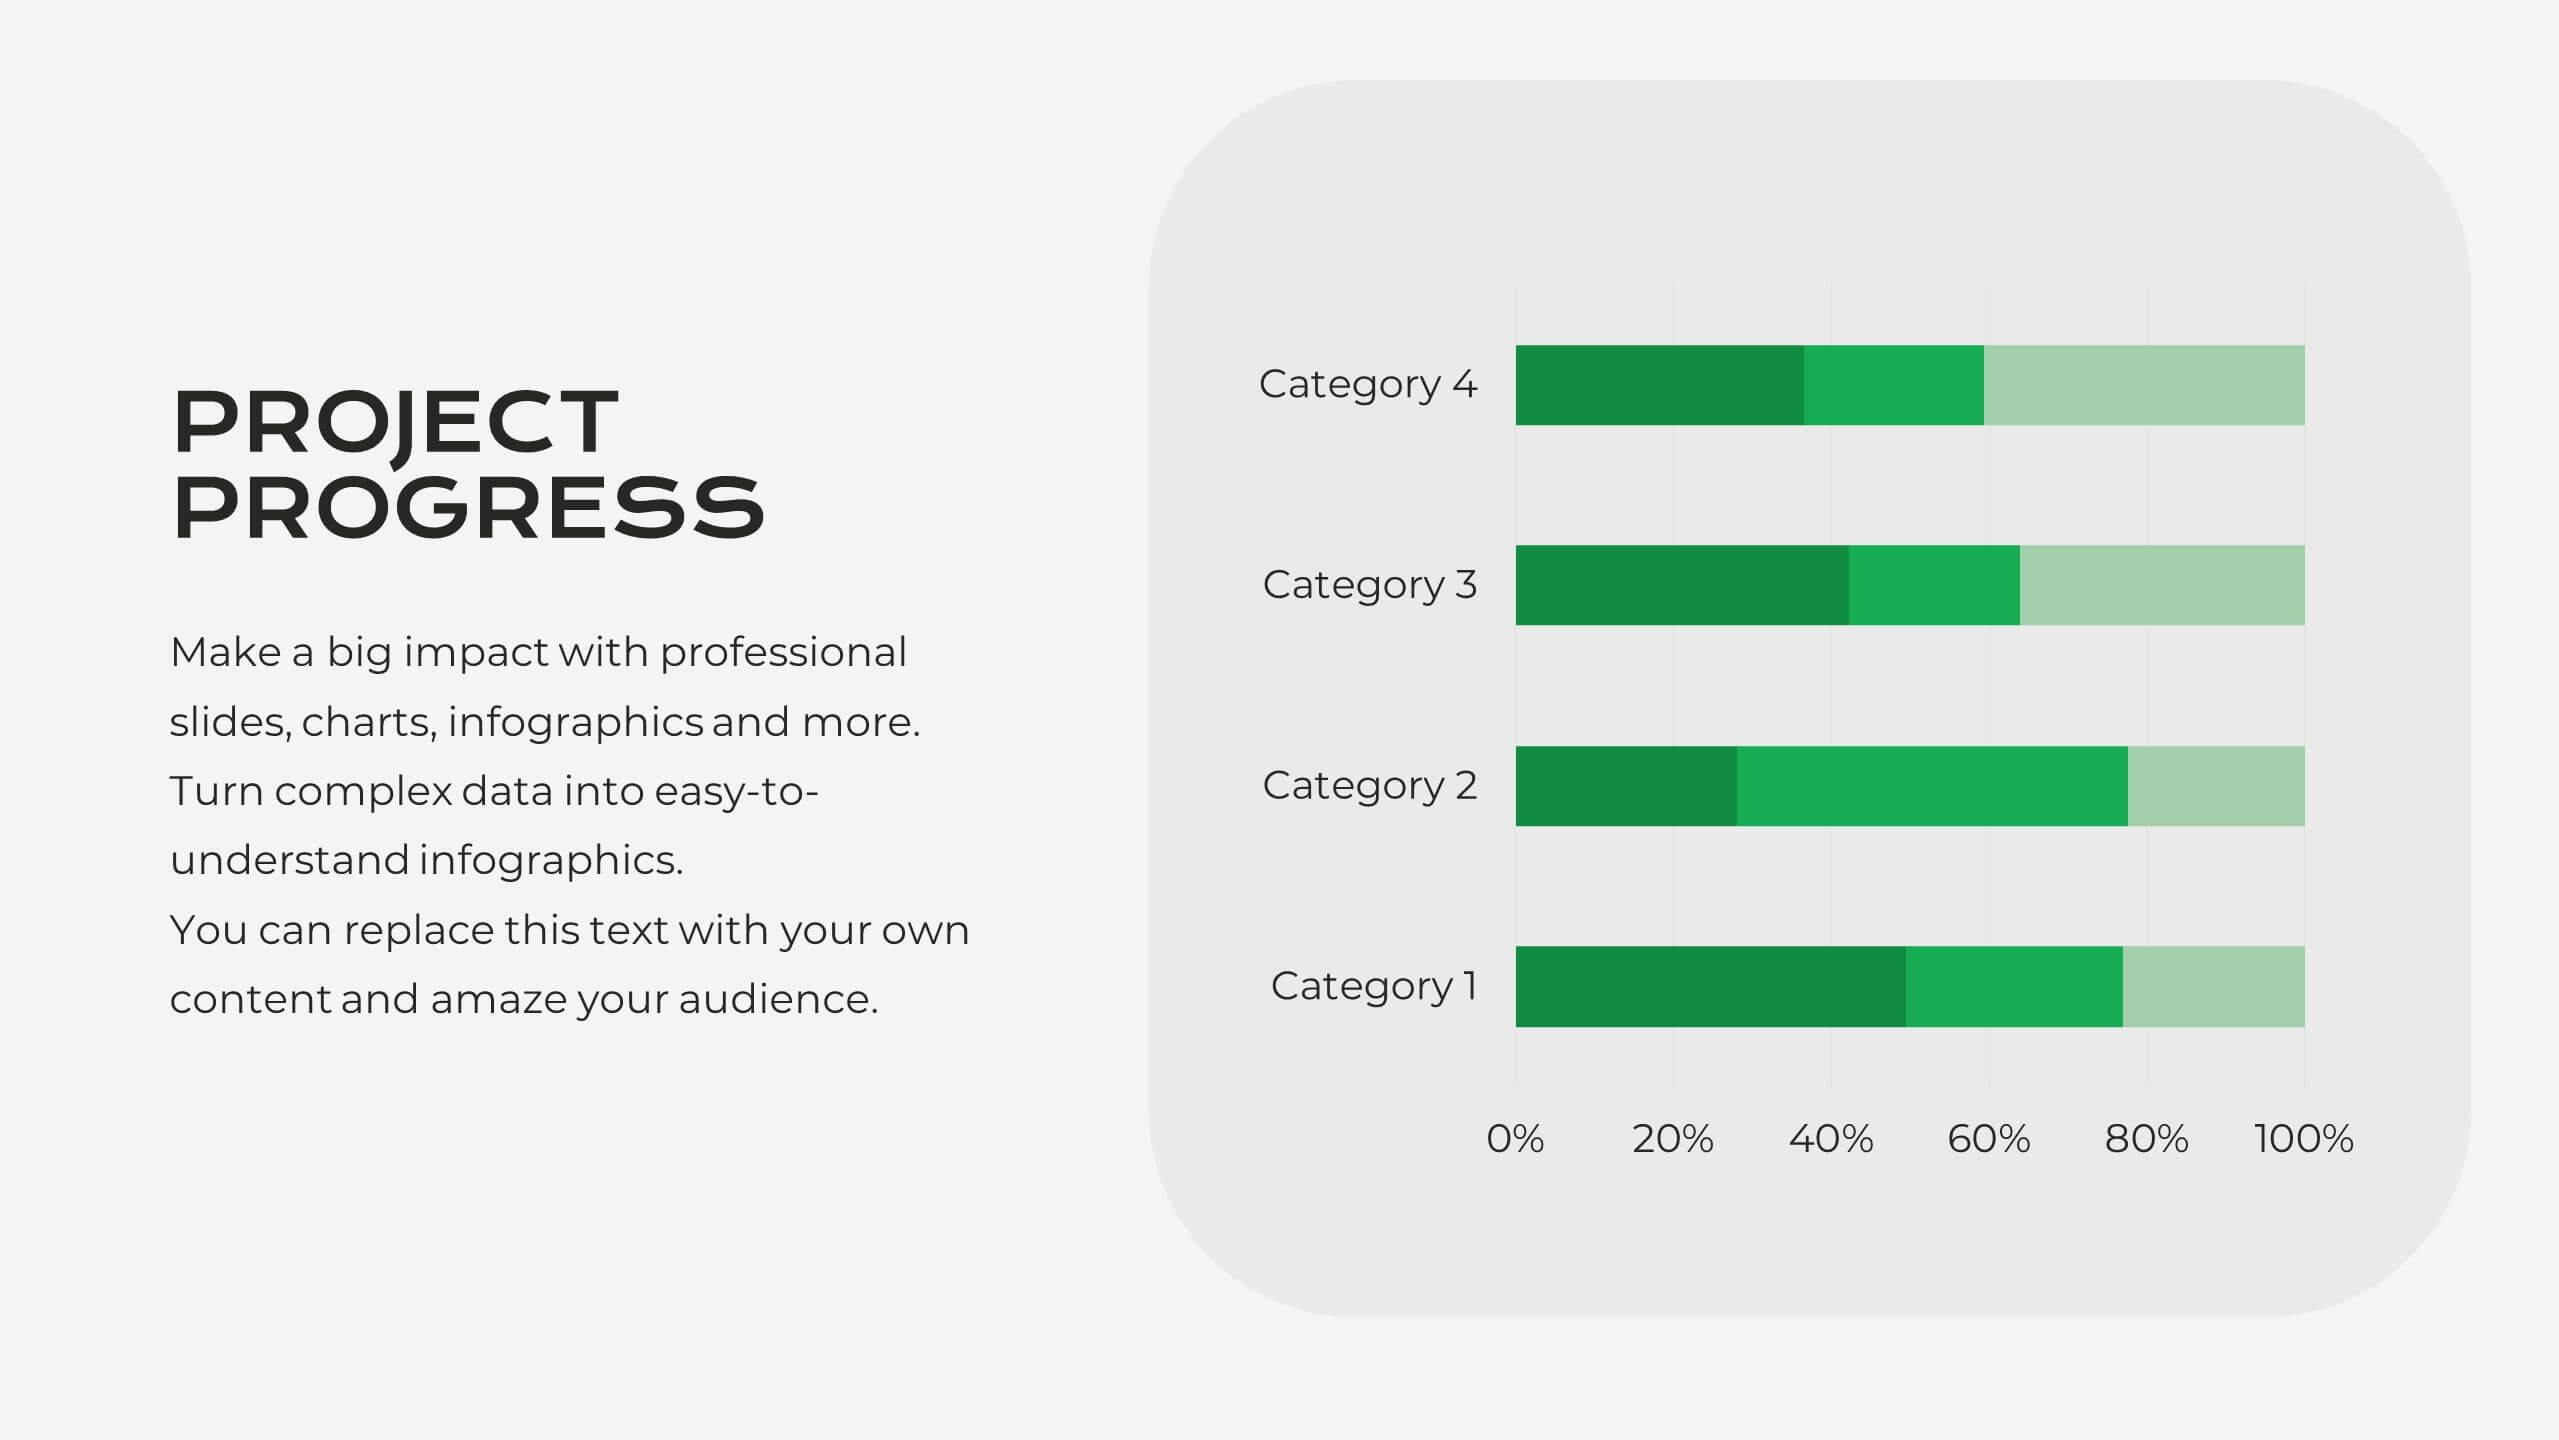
Layered Pyramid Structure Diagram Presentation
Break down your data into visual layers with this Layered Pyramid Structure Diagram presentation. Ideal for showing proportions, hierarchies, or step-based processes, each pyramid tier is color-coded and labeled with editable titles and percentage values. Fully customizable in Canva, PowerPoint, and Google Slides to match your business or educational needs.


20 diapositivas
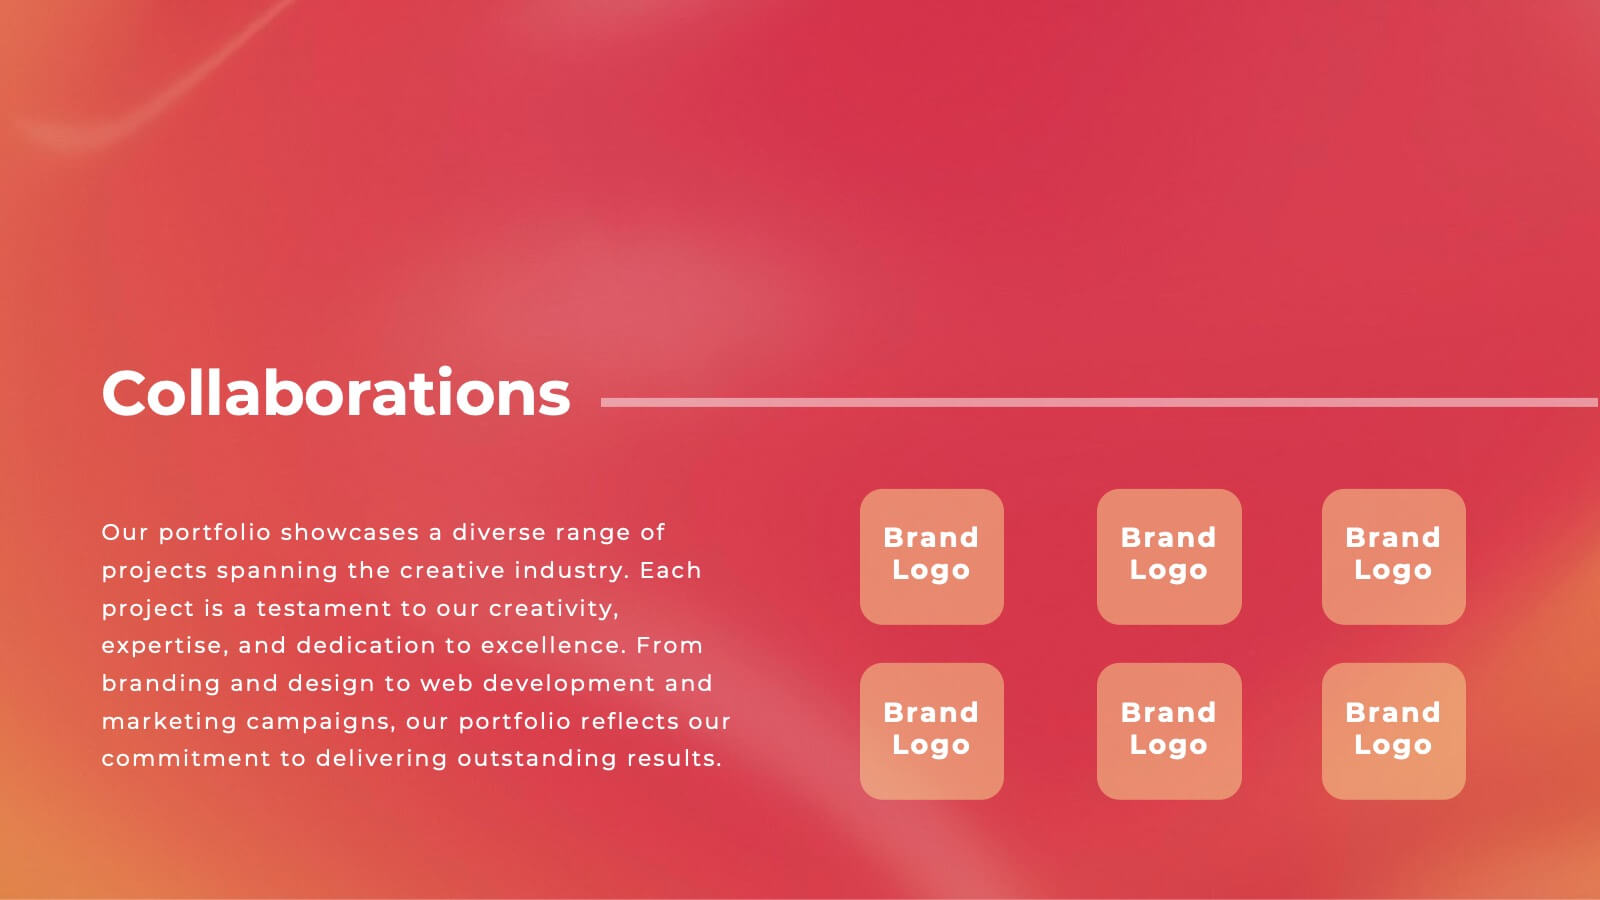
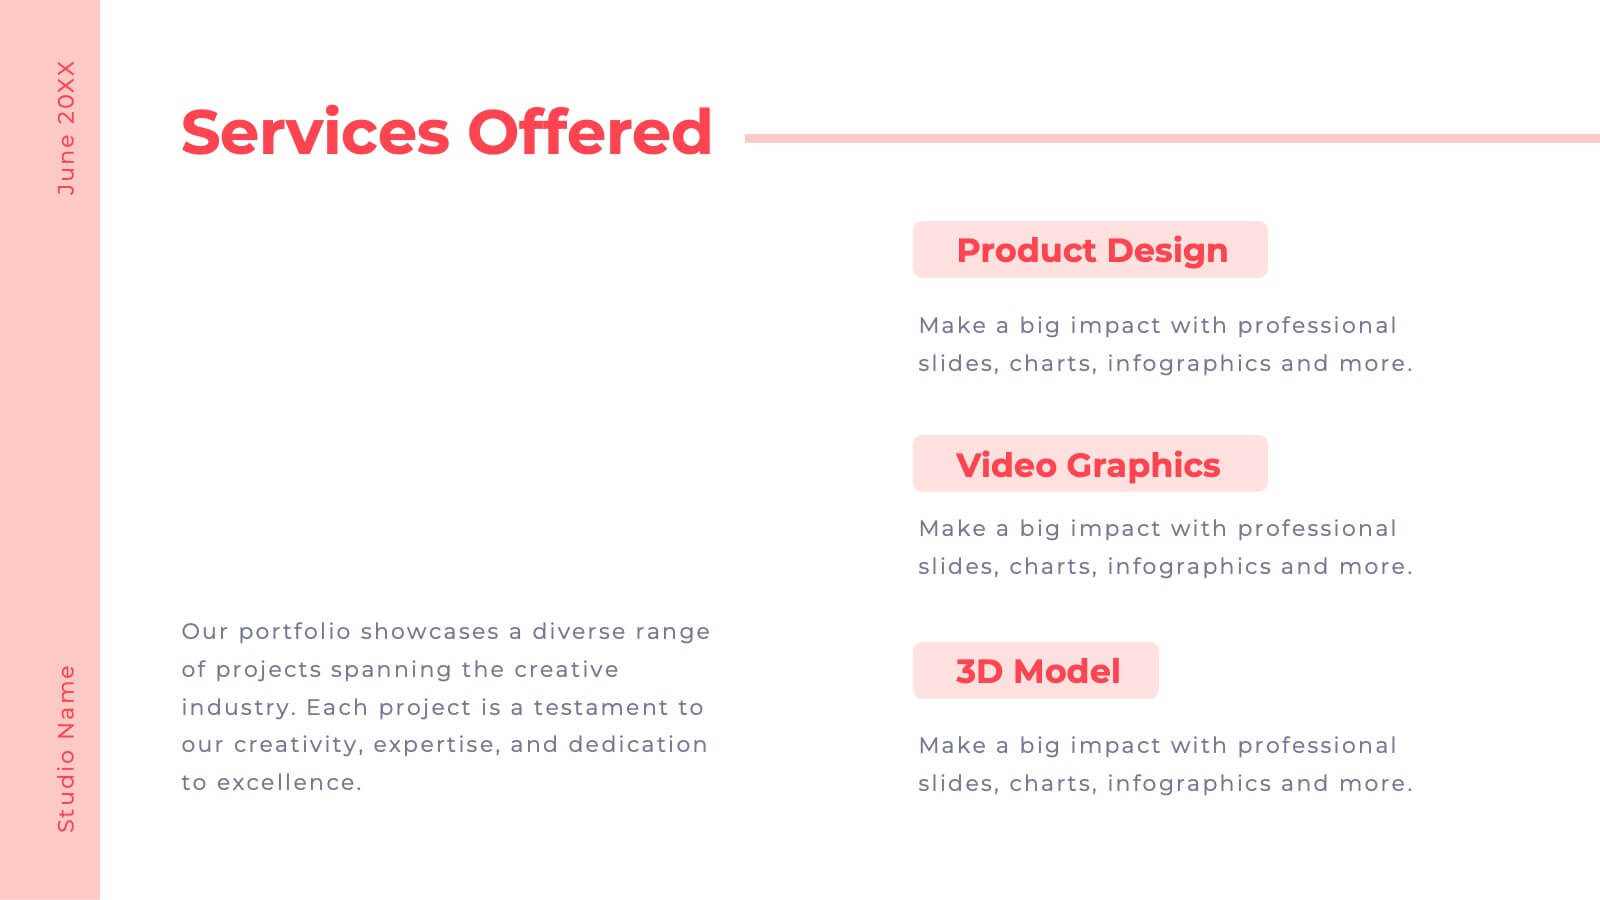
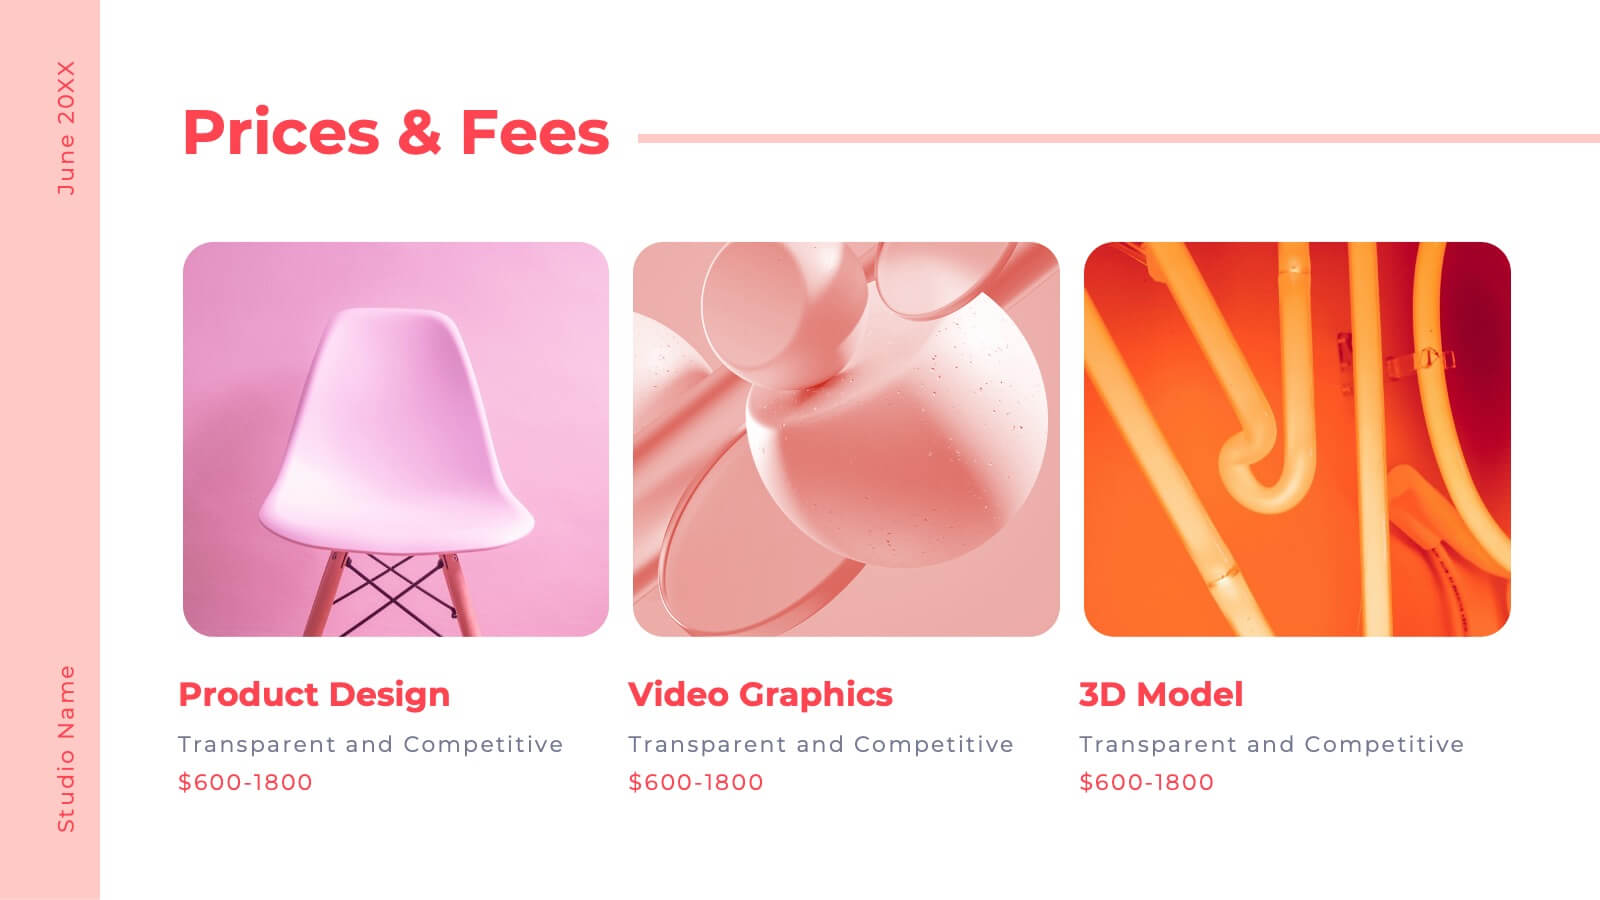
Valor Creative Portfolio Presentation
Step into creativity with this stunning portfolio template! Showcase your projects, design philosophy, and client testimonials with style and flair. Ideal for designers, artists, and creatives wanting to impress. Compatible with PowerPoint, Keynote, and Google Slides, this template elevates every portfolio to new heights. Perfect for making a lasting impact.


7 diapositivas
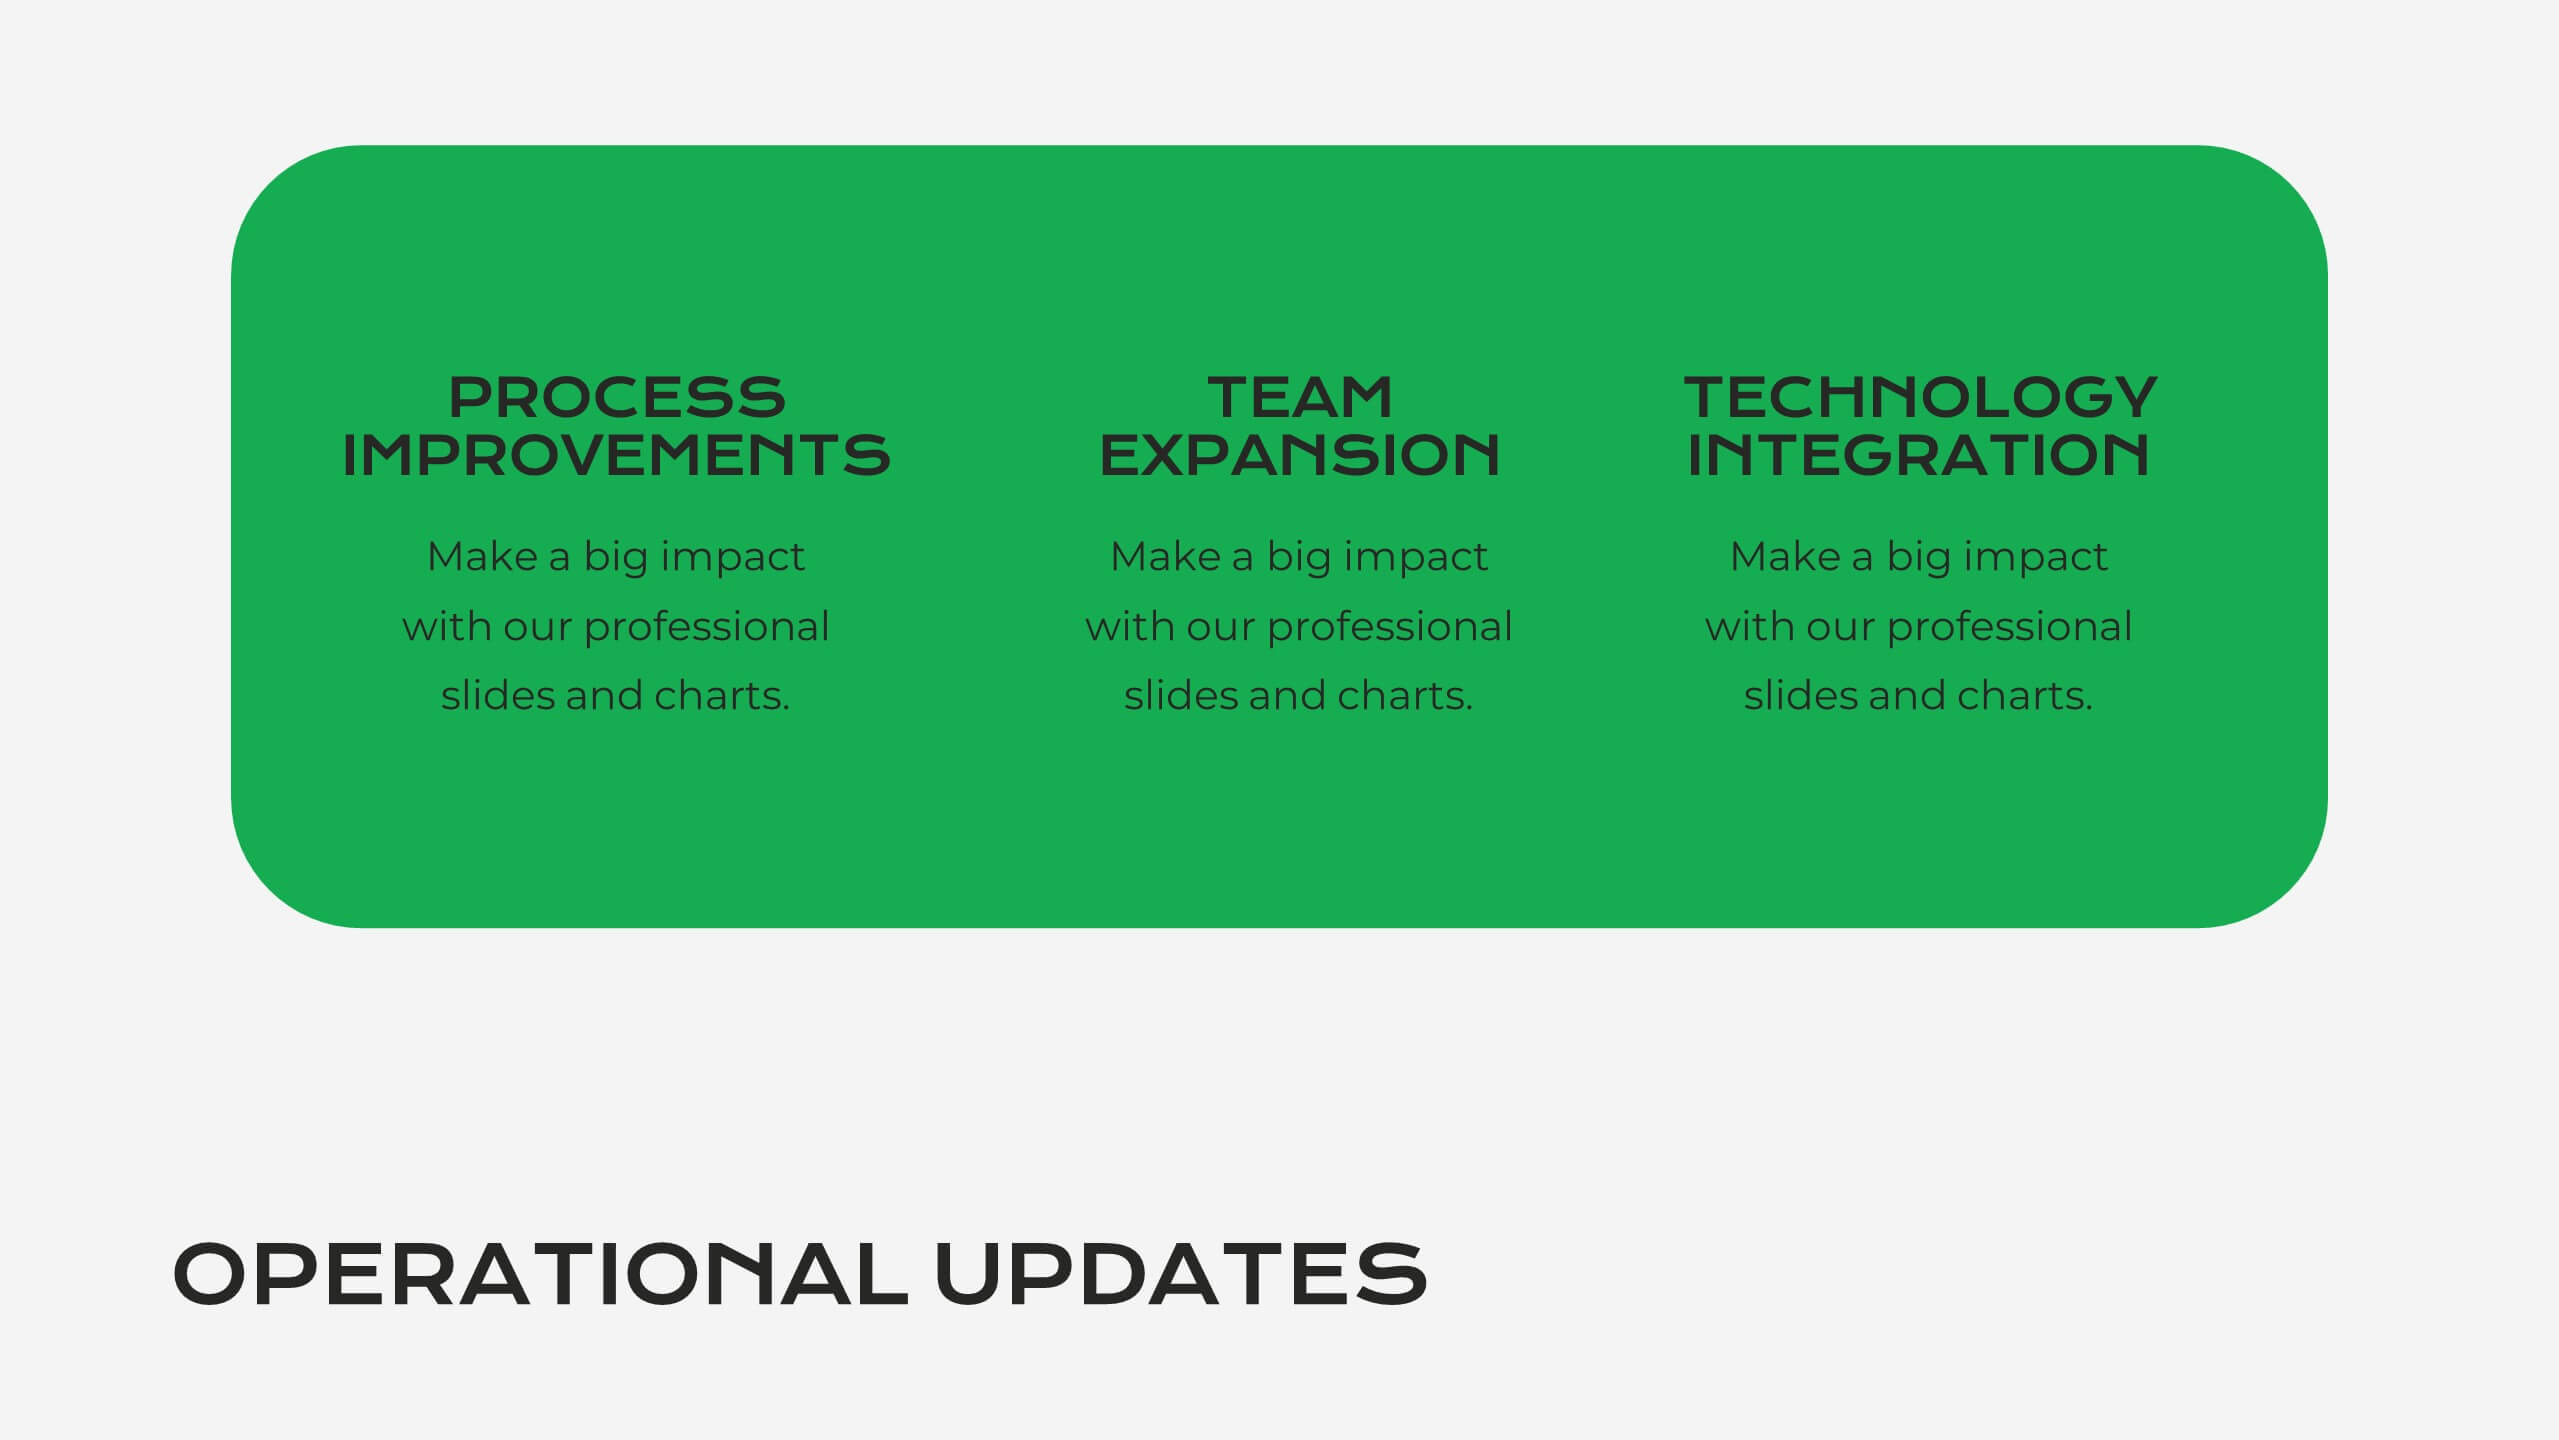
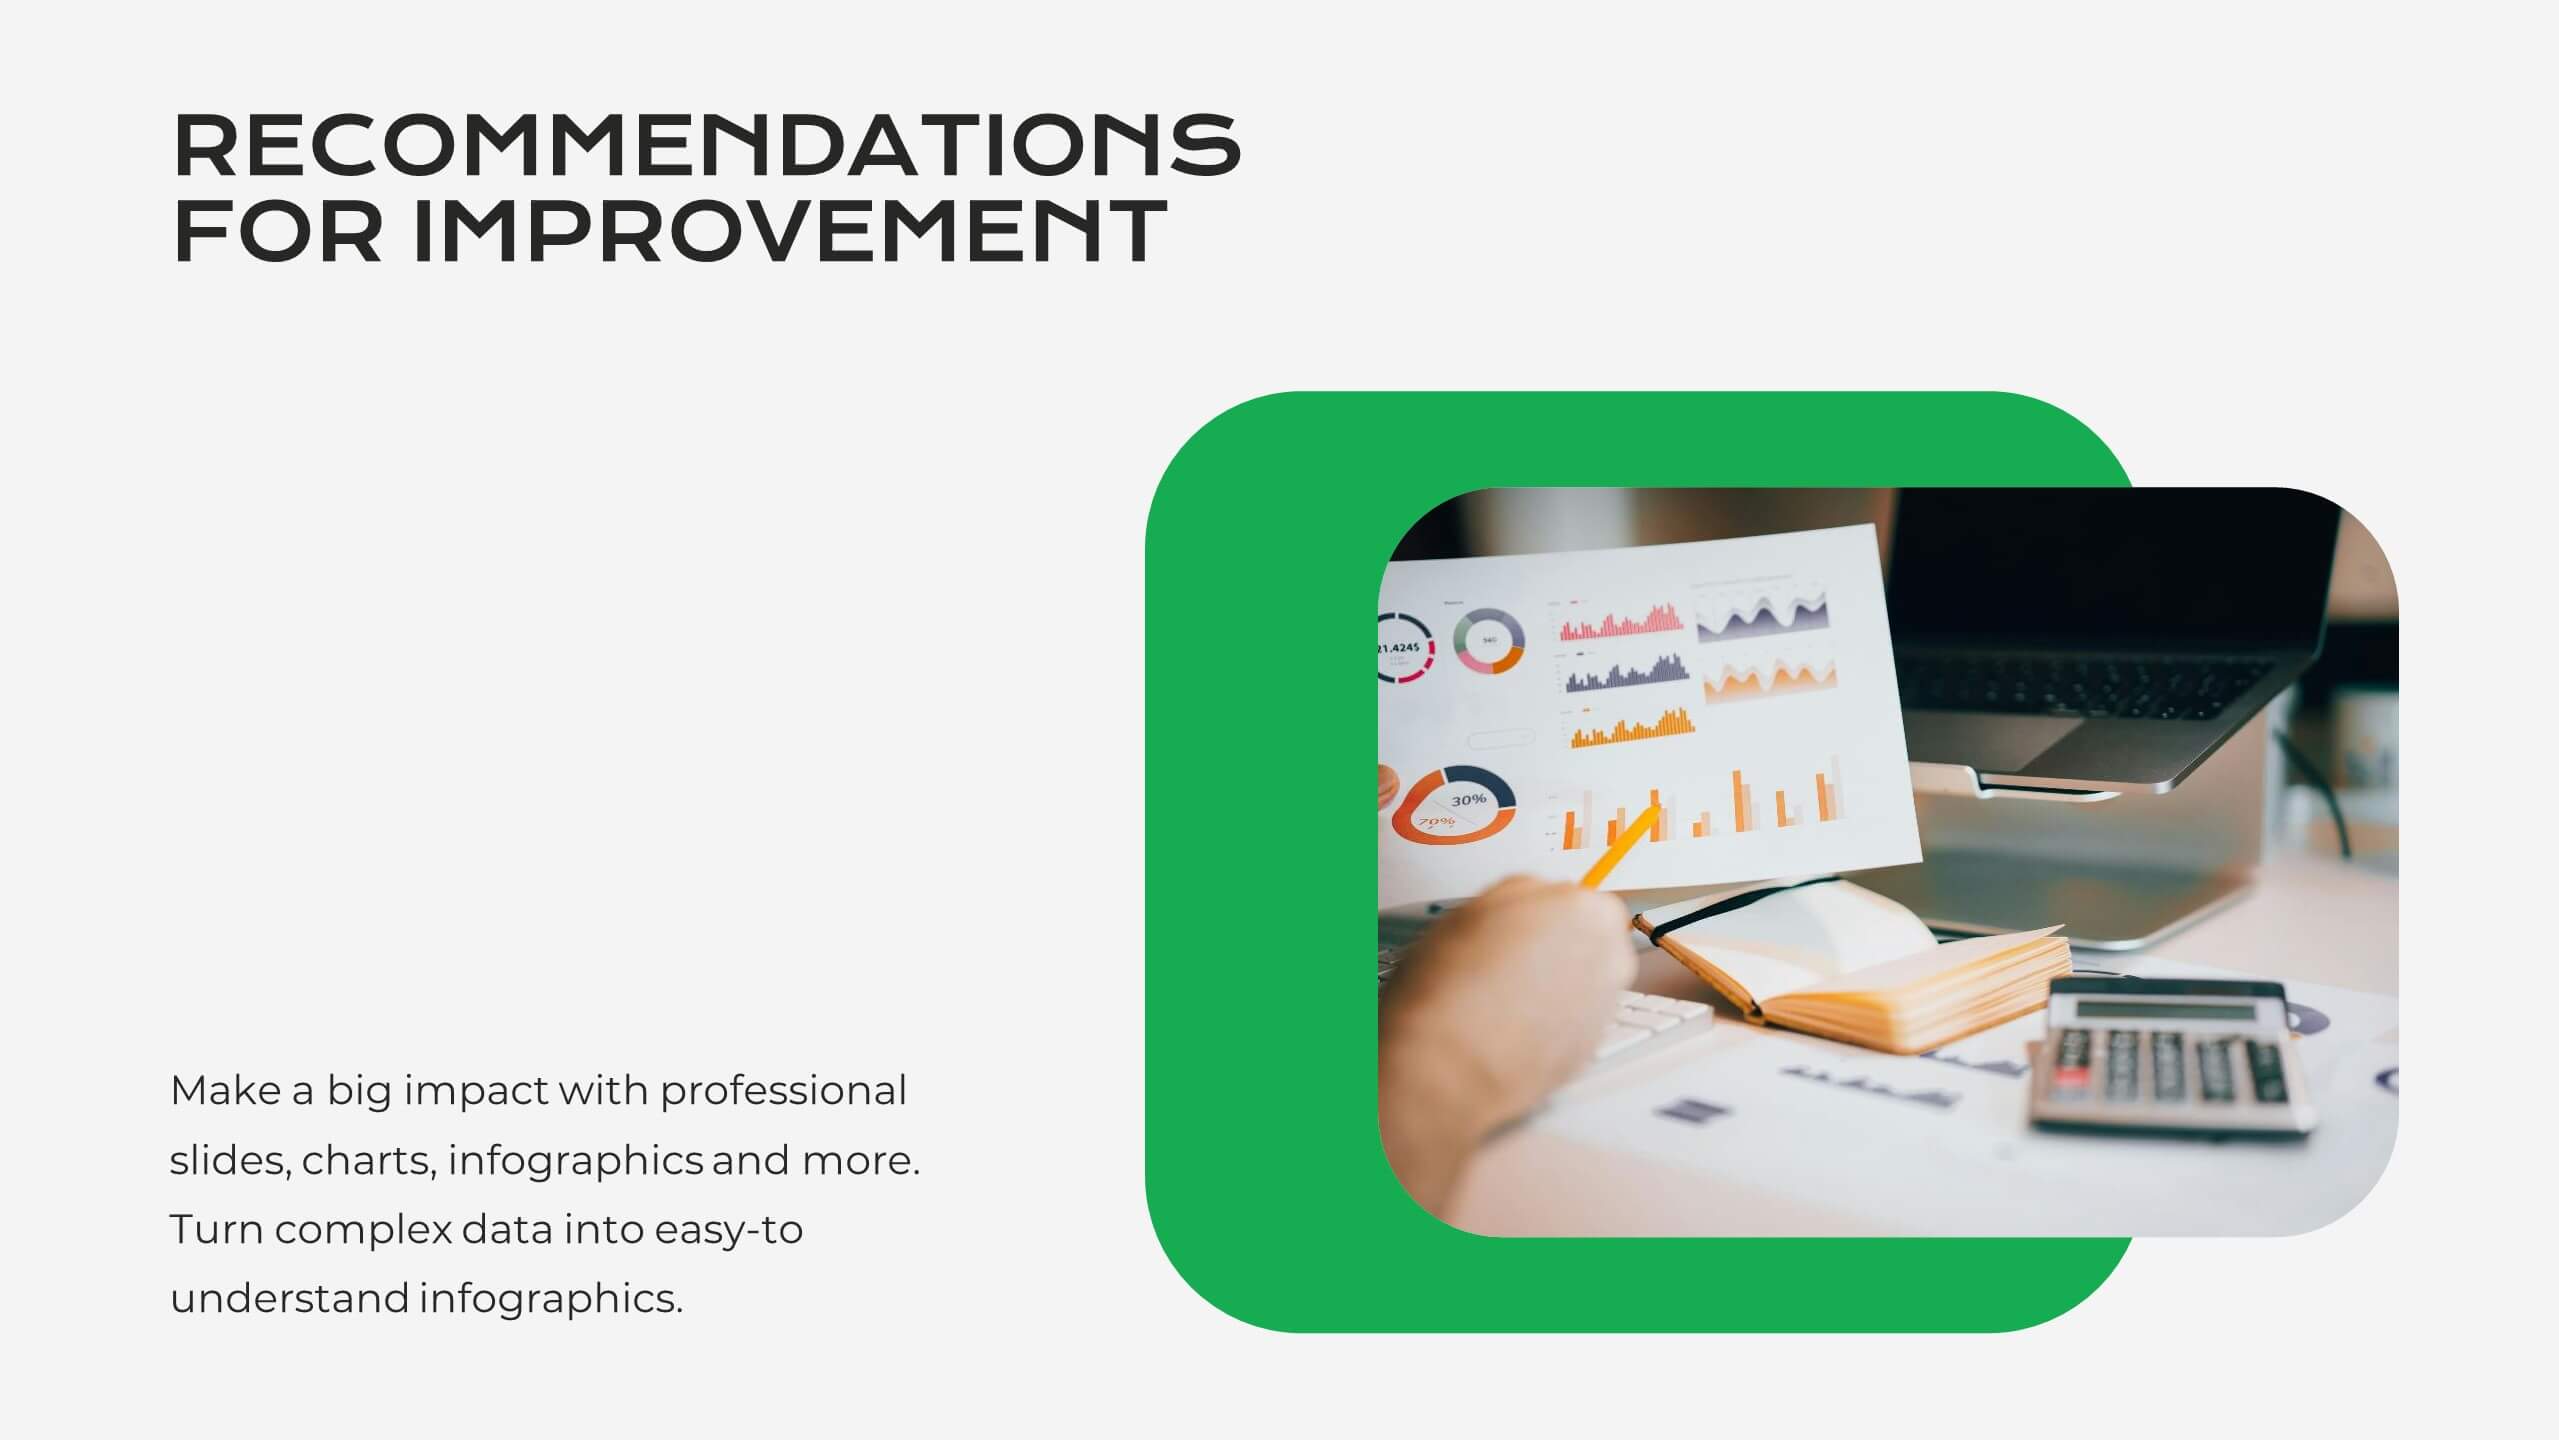
Scope Management and Planning Presentation
Ensure clear project scope definition with the Scope Management and Planning Presentation. This structured template highlights key elements of project scope, responsibilities, and deliverables using an intuitive layout. Ideal for project managers, business analysts, and teams aligning project goals. Fully editable and compatible with PowerPoint, Keynote, and Google Slides.


7 diapositivas
Big Data Analytic Infographics
Big Data are the large and complex data sets that are difficult to process and analyze using traditional data processing methods. This template will allow you to visualize key data points and insights in an appealing and easy to digest way. Your information is presented in a clear manner with a variety of graphs, to convey the fundamentals of big data analytics. Customize this infographic with your own data in the bullet points and graphics. Quickly edit text and colors for your next presentation. All the slide in this template are fully editable in Powerpoint, Keynote, and Google Slides.


7 diapositivas
Pillar Infographics Presentation Template
Our Pillar Infographic will present your information in a hierarchical format, with a main "pillar" section at the center and supporting information or sections branching out from it like pillars or columns. This template is designed to provide a simple overview of your topic, while also allowing for more in-depth exploration of specific aspects. The central pillar featured may be used to contain a brief summary or key message, while the surrounding columns or sections may provide more detailed information, data, or visualizations. Grow your audience and increase sales with this template!


6 diapositivas
Africa Population Map Infographics
Discover the flexibility of our Africa Population Map infographic template, a dynamic tool for illustrating population distribution across the African continent. This template is compatible with widely used presentation software like PowerPoint, Keynote, and Google Slides, allowing you to effortlessly customize it according to your specific requirements. The Africa Population Map infographic template provides a solid foundation for visualizing population data, highlighting densely populated areas, urban centers, and demographic trends. Whether you're an educator, researcher, or simply curious about Africa's demographics, this template offers a user-friendly platform to create engaging presentations and informative materials. Impress your audience with this SEO-optimized Africa Population Map infographic template, thoughtfully designed for clarity and ease of use. Tailor it to showcase population variations, growth patterns, and regional insights, making it a valuable asset for your projects and presentations. Start crafting your personalized infographic today!


6 diapositivas
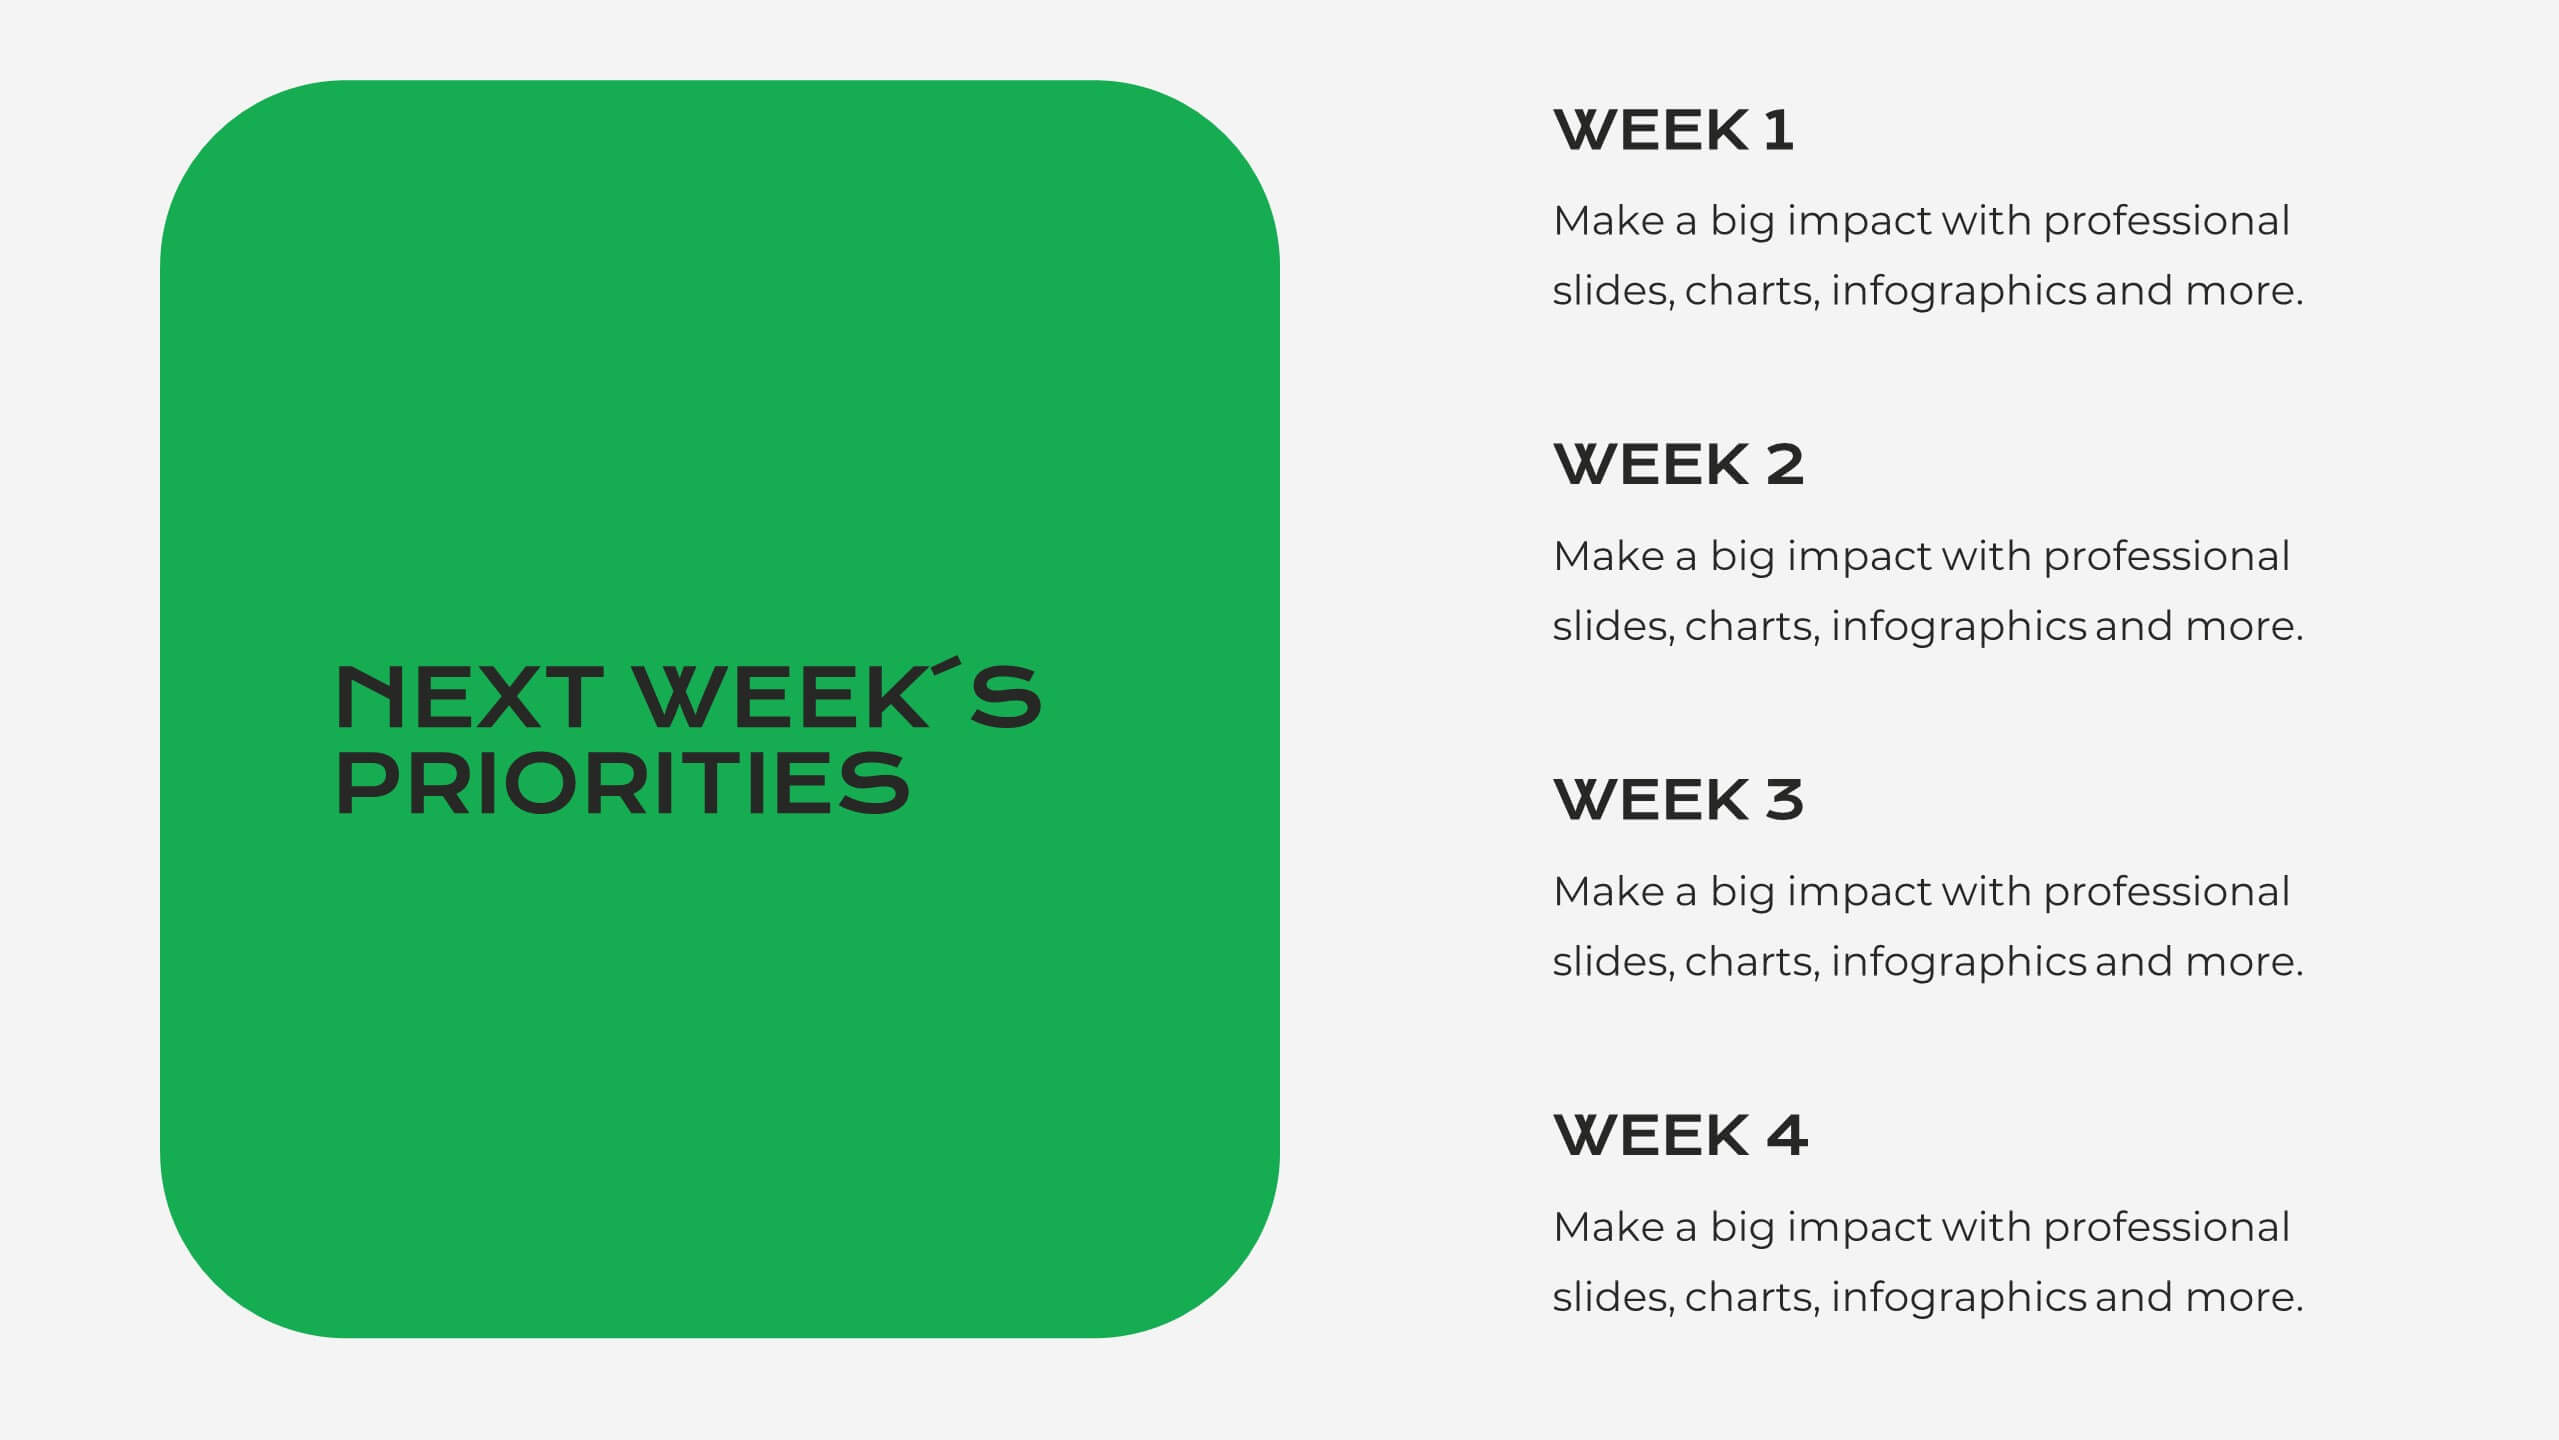
Pattern-Based Layouts Using Geometry
Present your process, timeline, or flow with clarity using the Pattern-Based Layouts Using Geometry Presentation. This clean, step-by-step format uses bold numbered icons and curved geometric blocks to guide viewers through five key stages. Ideal for sequential content, strategies, or workflows. Easily customizable in PowerPoint, Keynote, and Google Slides.


5 diapositivas
Aviation Industry Market Analysis
Break down key metrics in the aviation sector with this sleek, aircraft-themed layout. Ideal for highlighting five data points or insights, each icon aligns with a section of the airplane to reinforce structure and clarity. Perfect for presentations on industry trends, airline strategies, or market performance. Fully editable in PowerPoint, Keynote, and Google Slides.