


Características


¿Tienes alguna pregunta?
Recomendar


8 diapositivas
Investment and Risk Business Case Presentation
Assess investment risks with confidence using this dynamic business case template. Designed for clear visualization, it categorizes risk levels from high to low, helping professionals analyze financial decisions effectively. Perfect for finance, business strategy, and market evaluation, this template is fully compatible with PowerPoint, Keynote, and Google Slides.


22 diapositivas
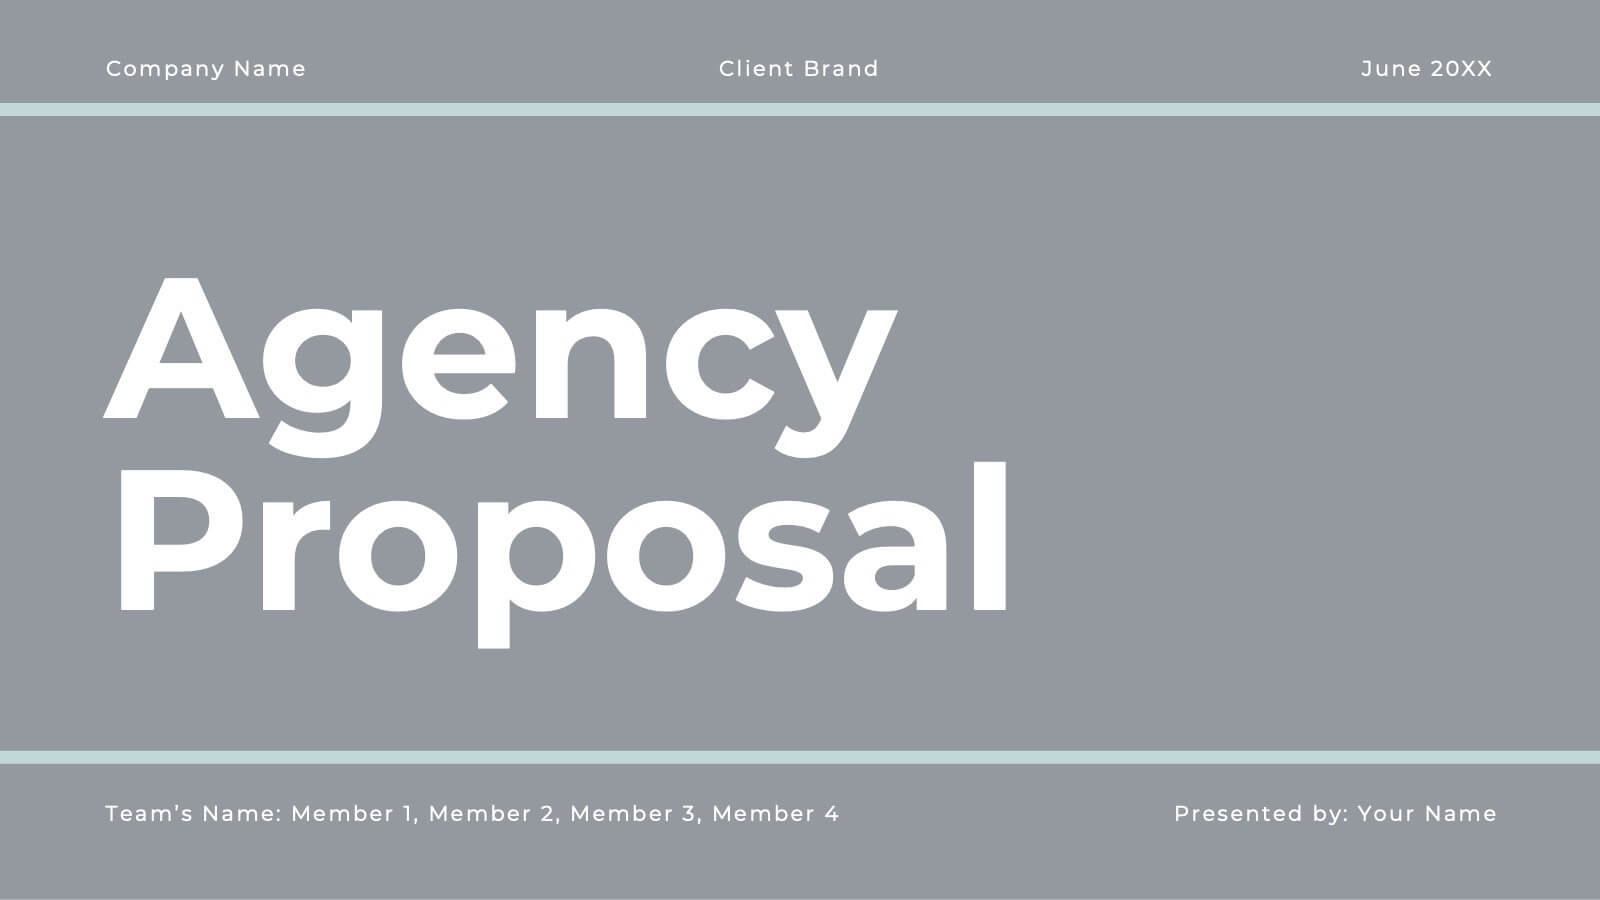
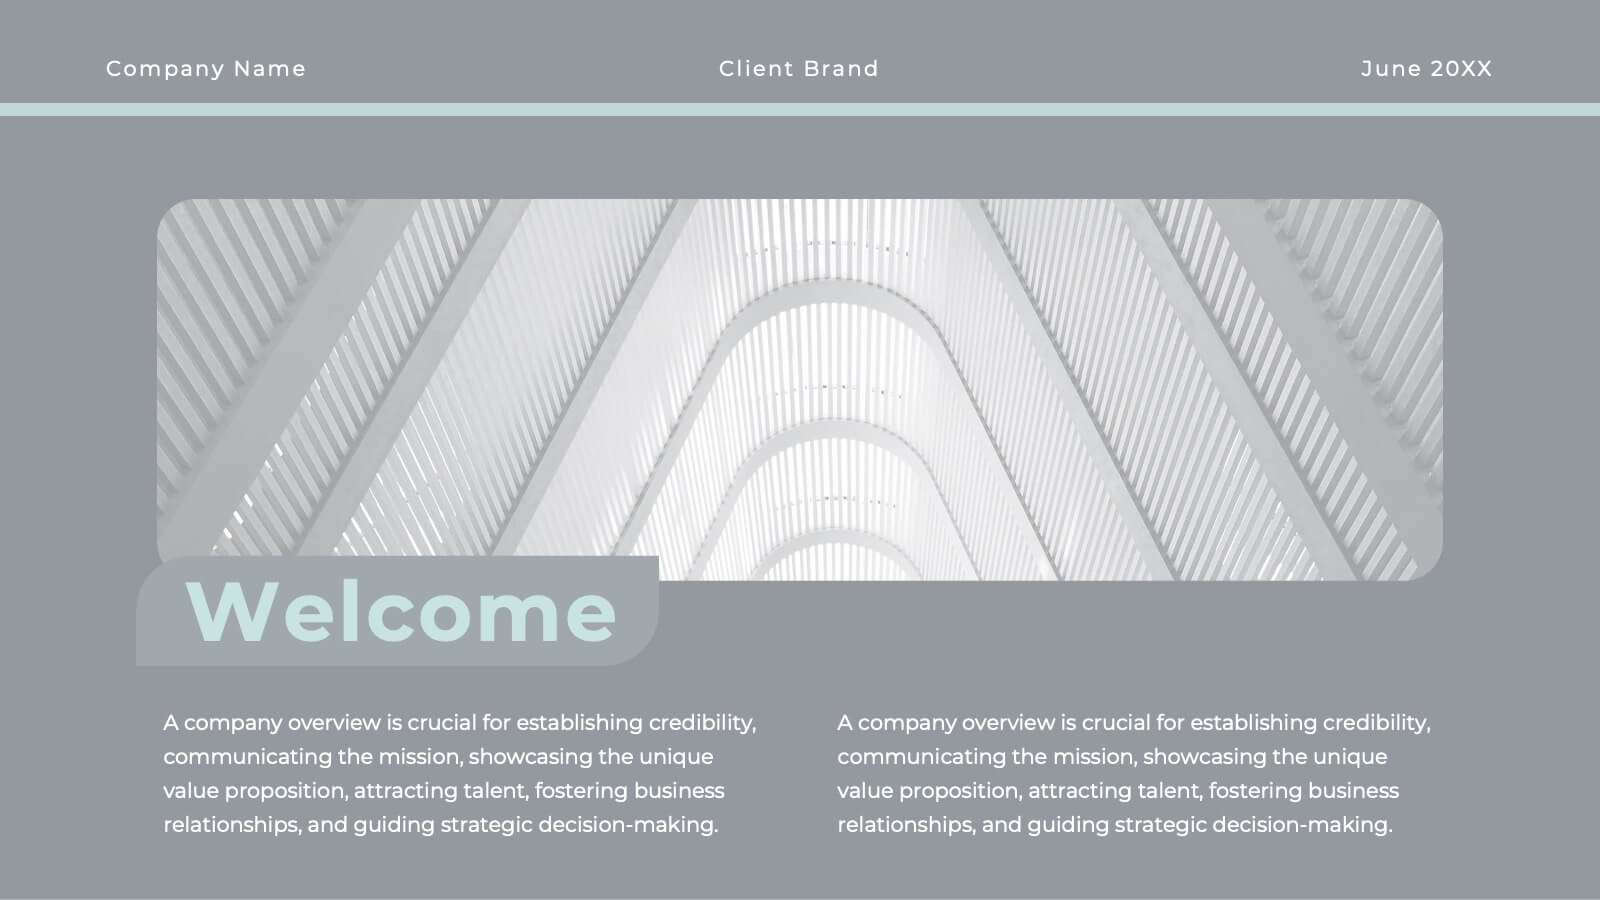
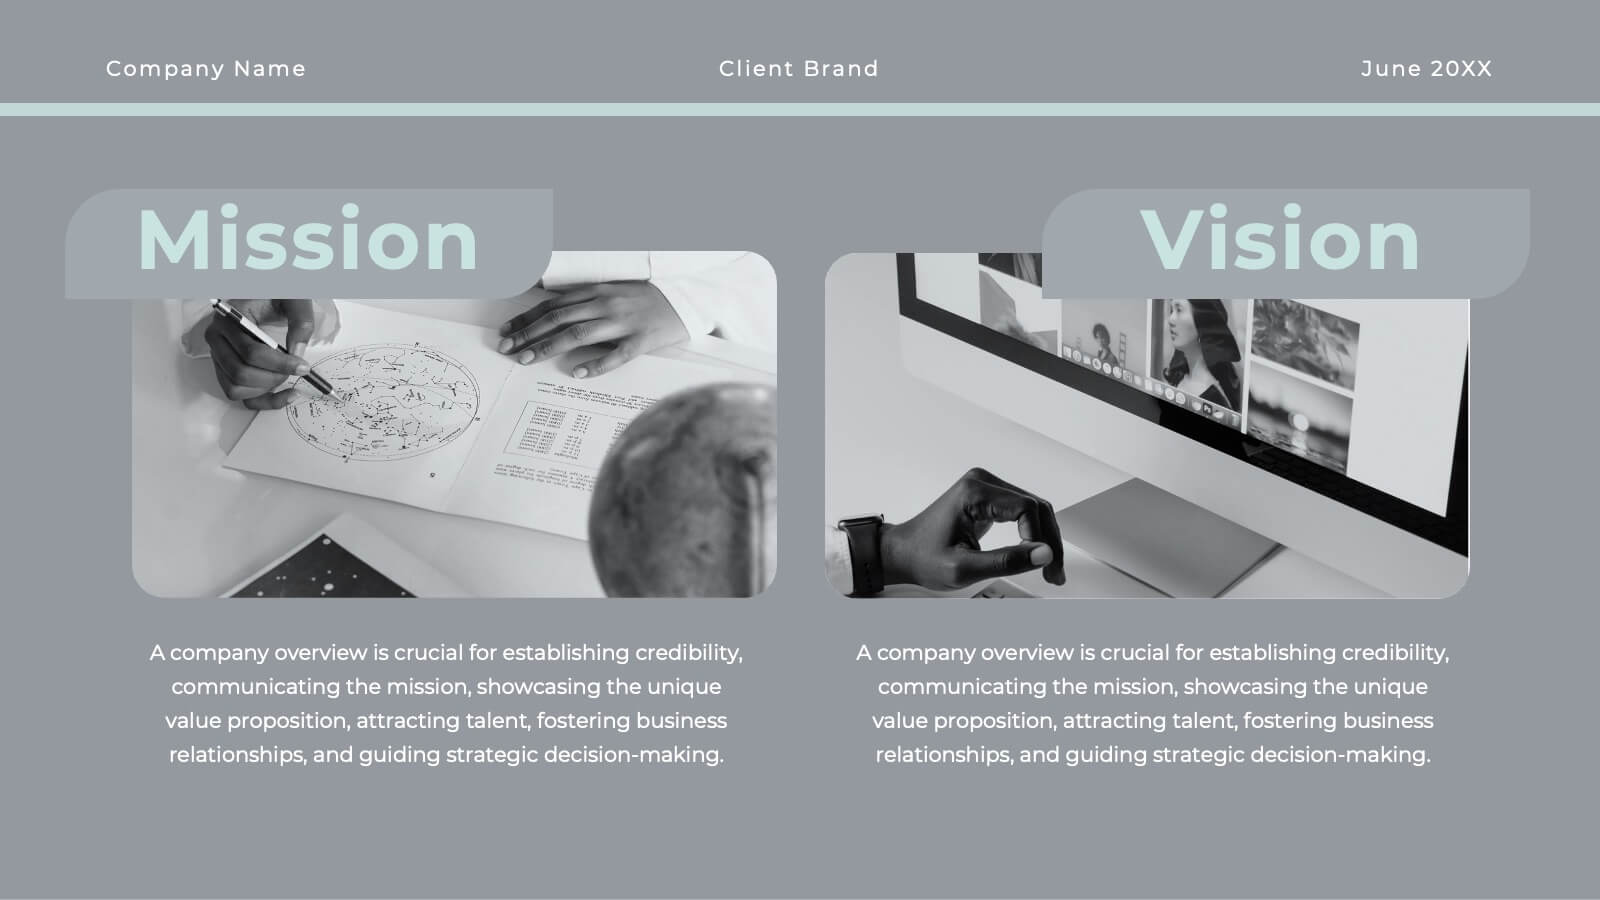
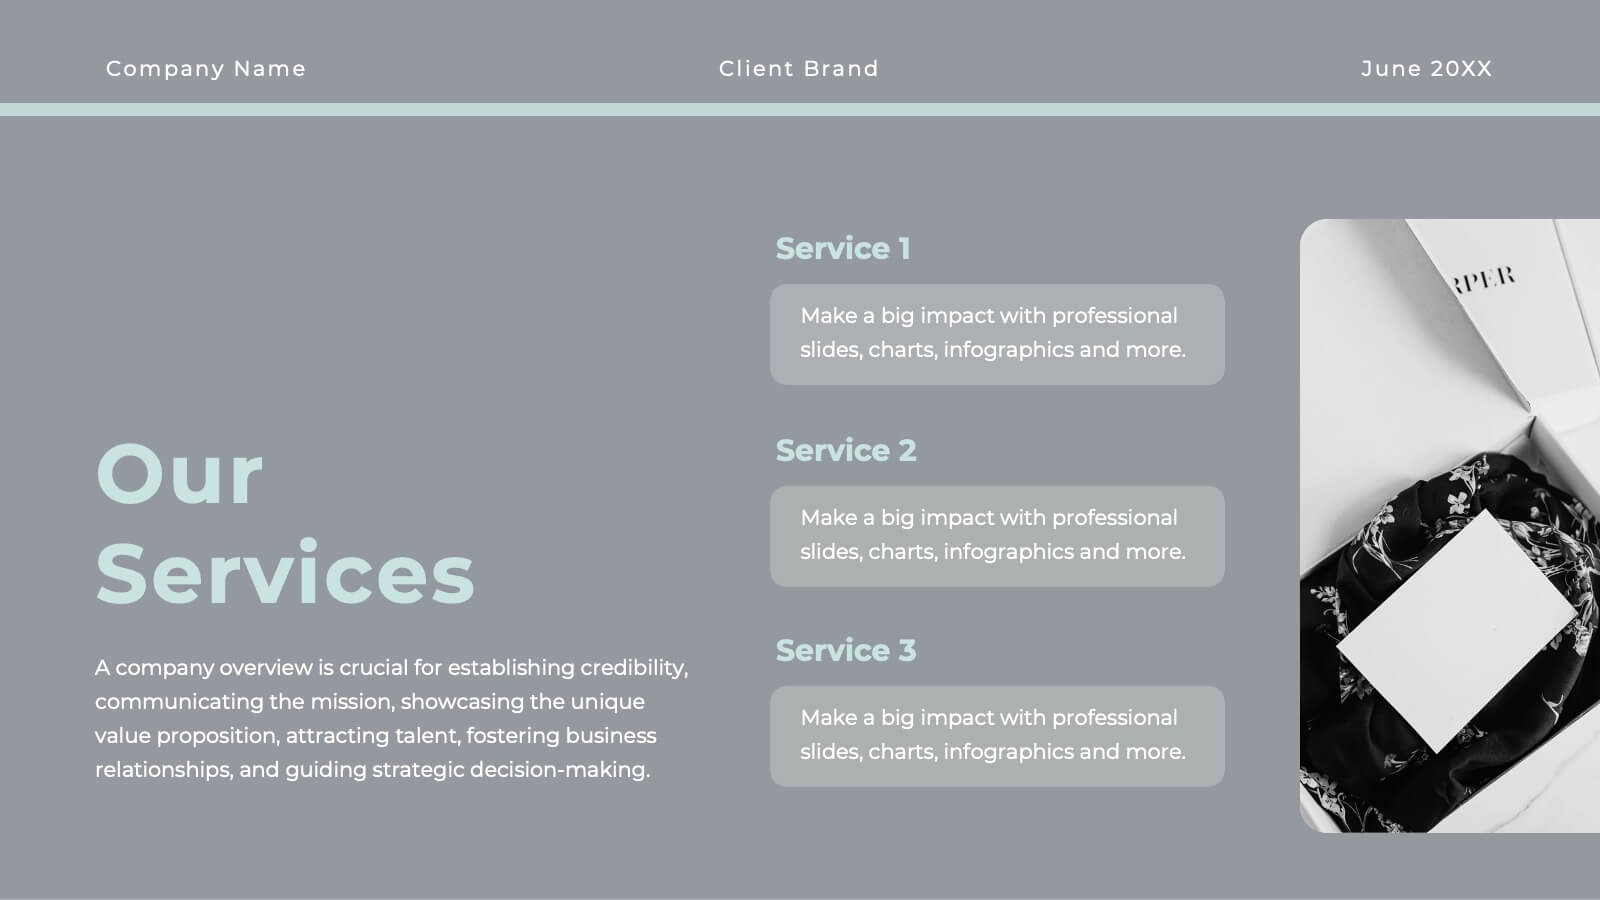
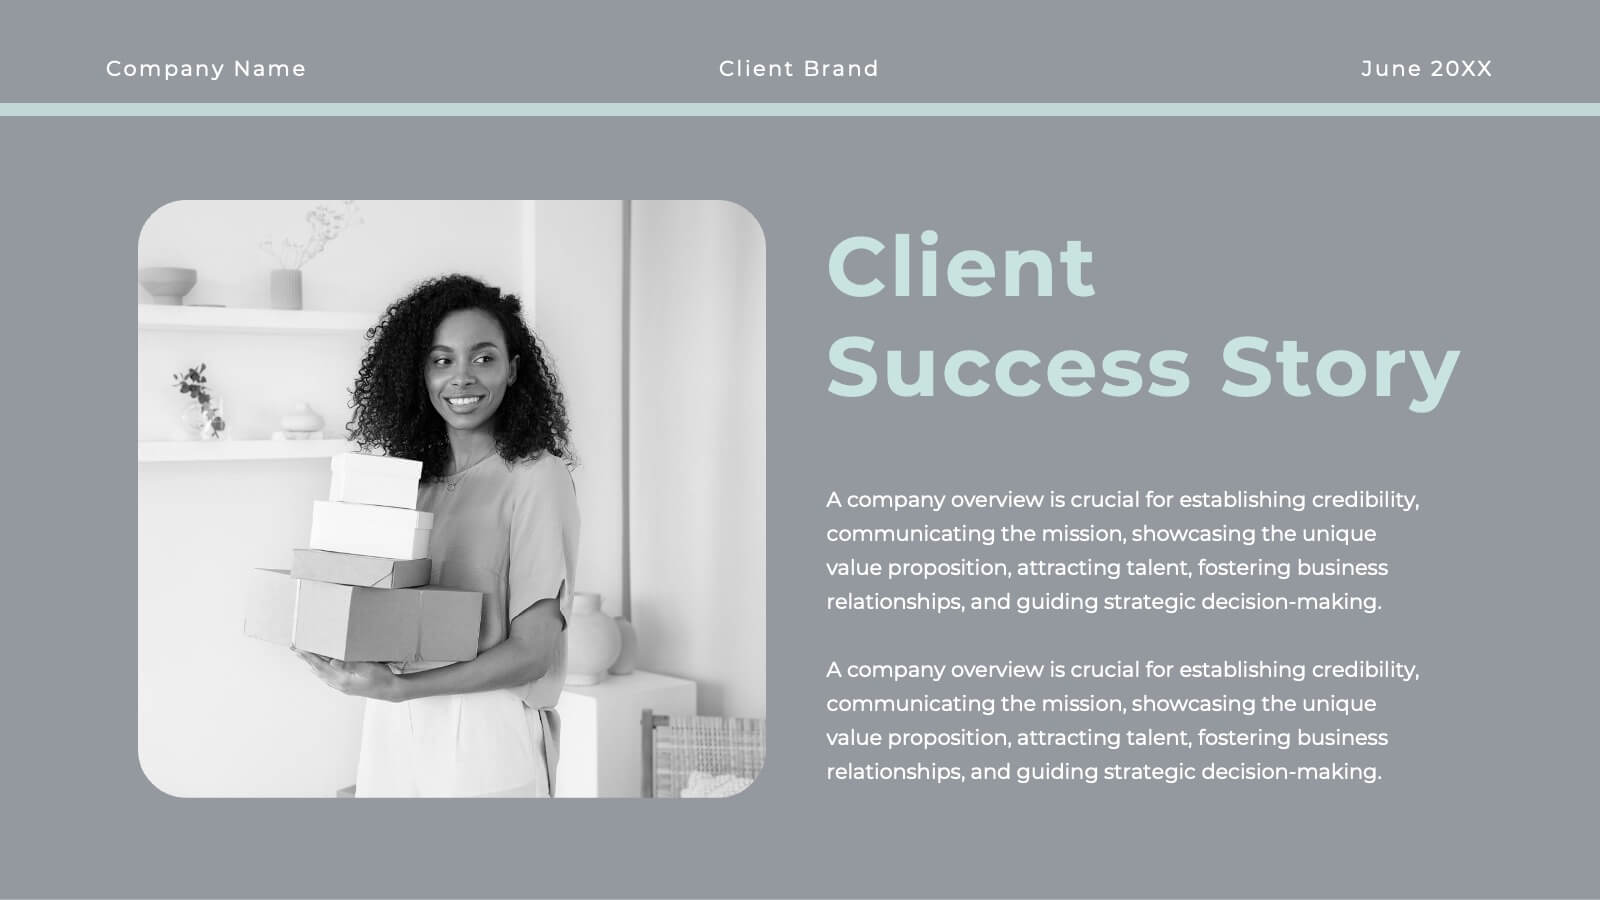
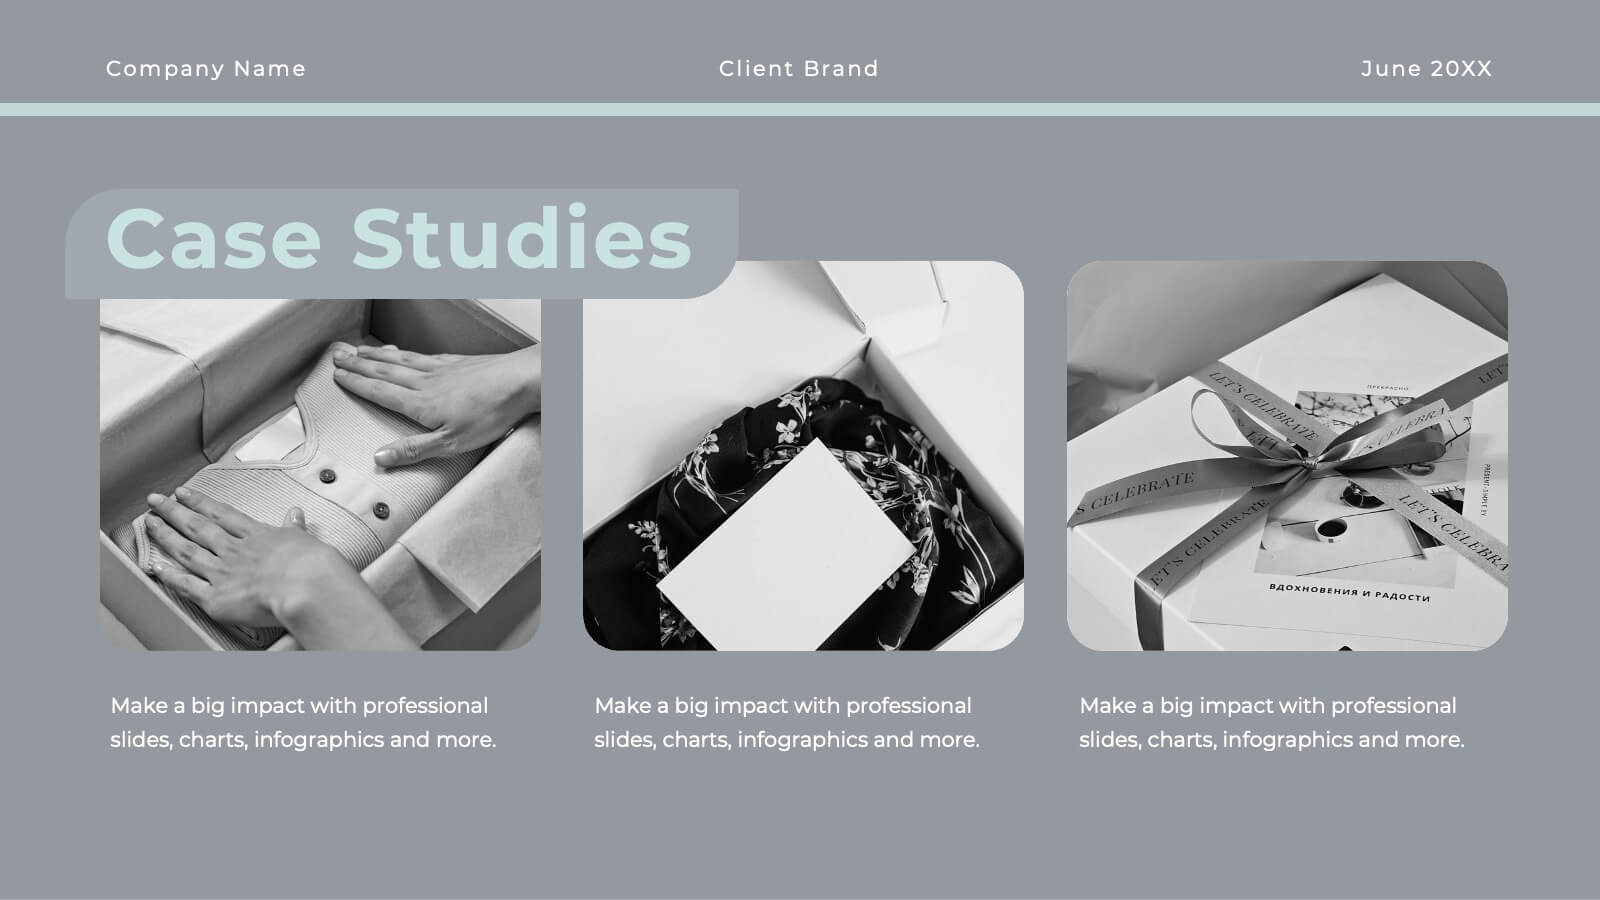
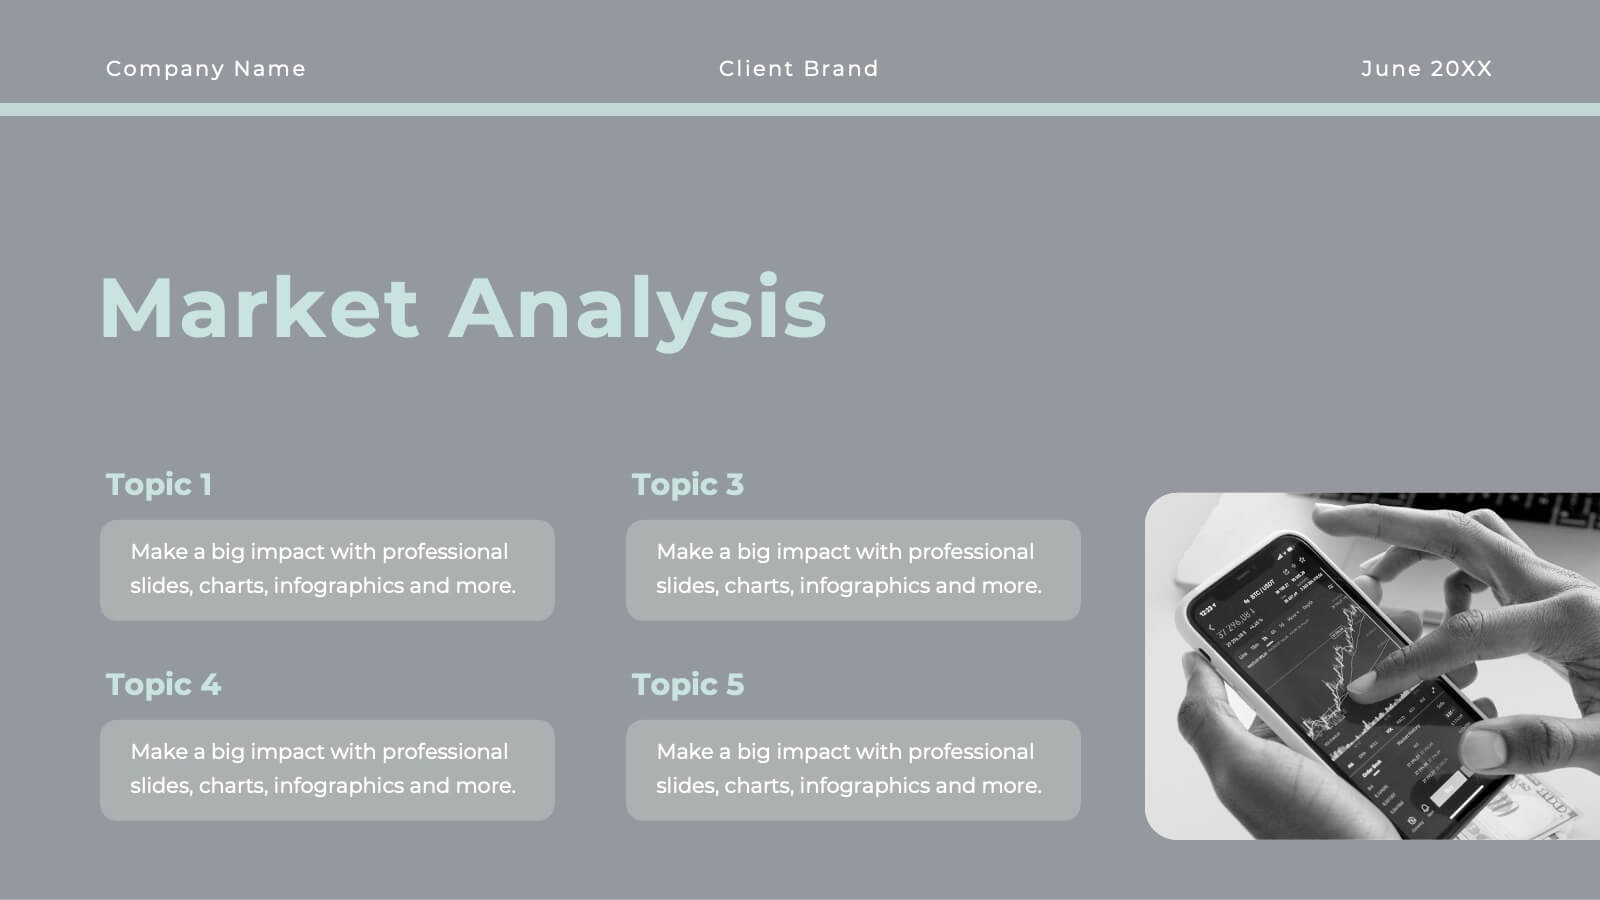
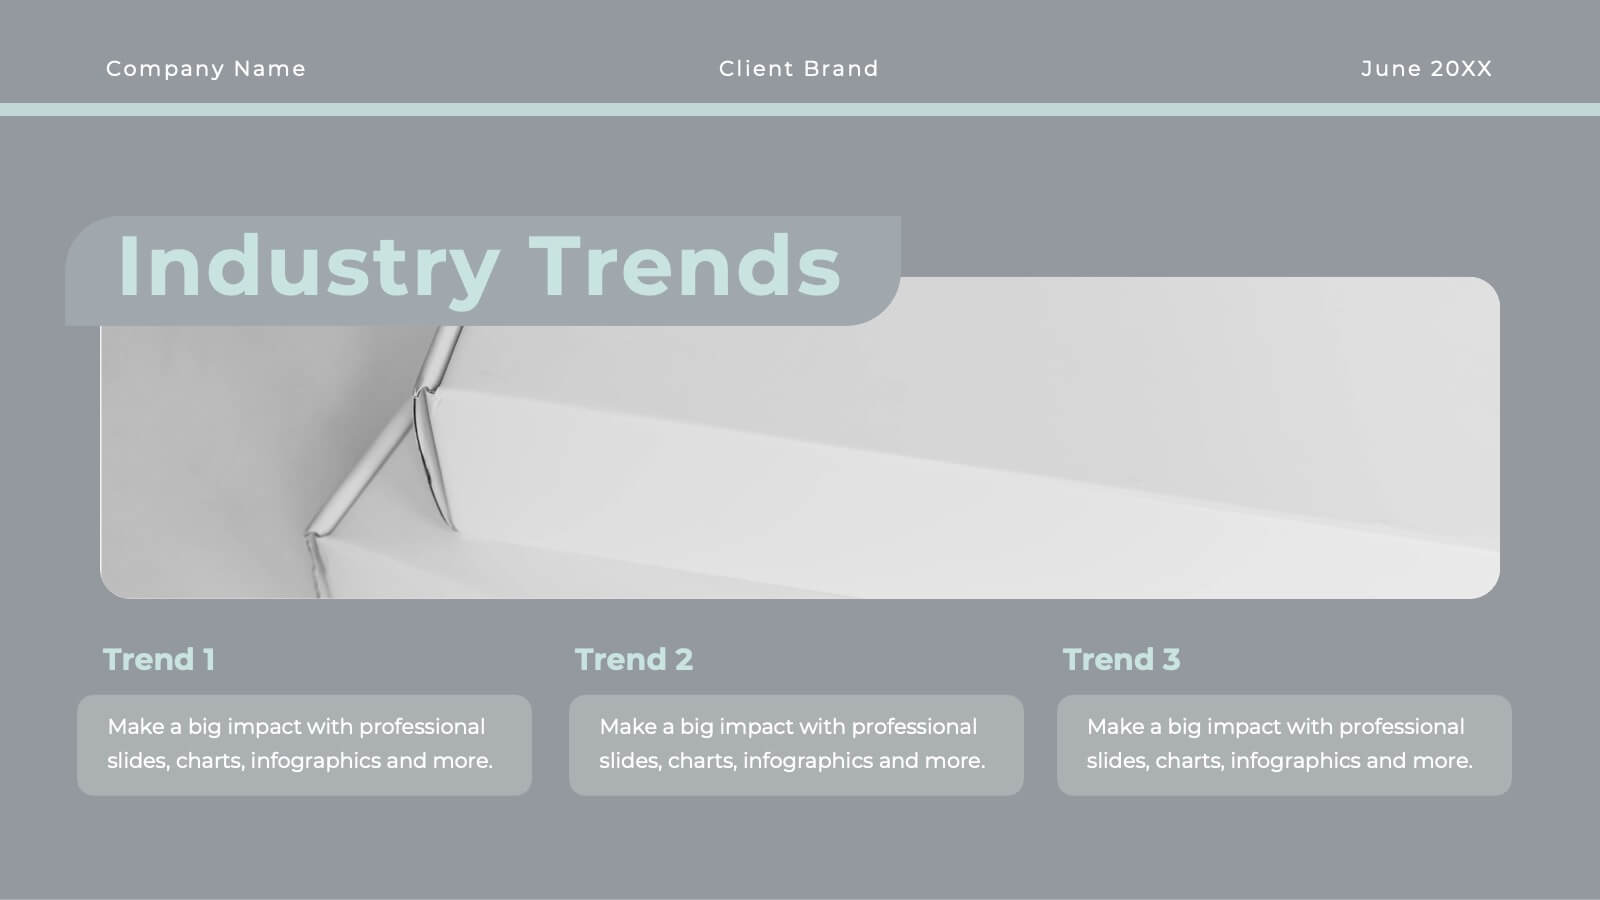
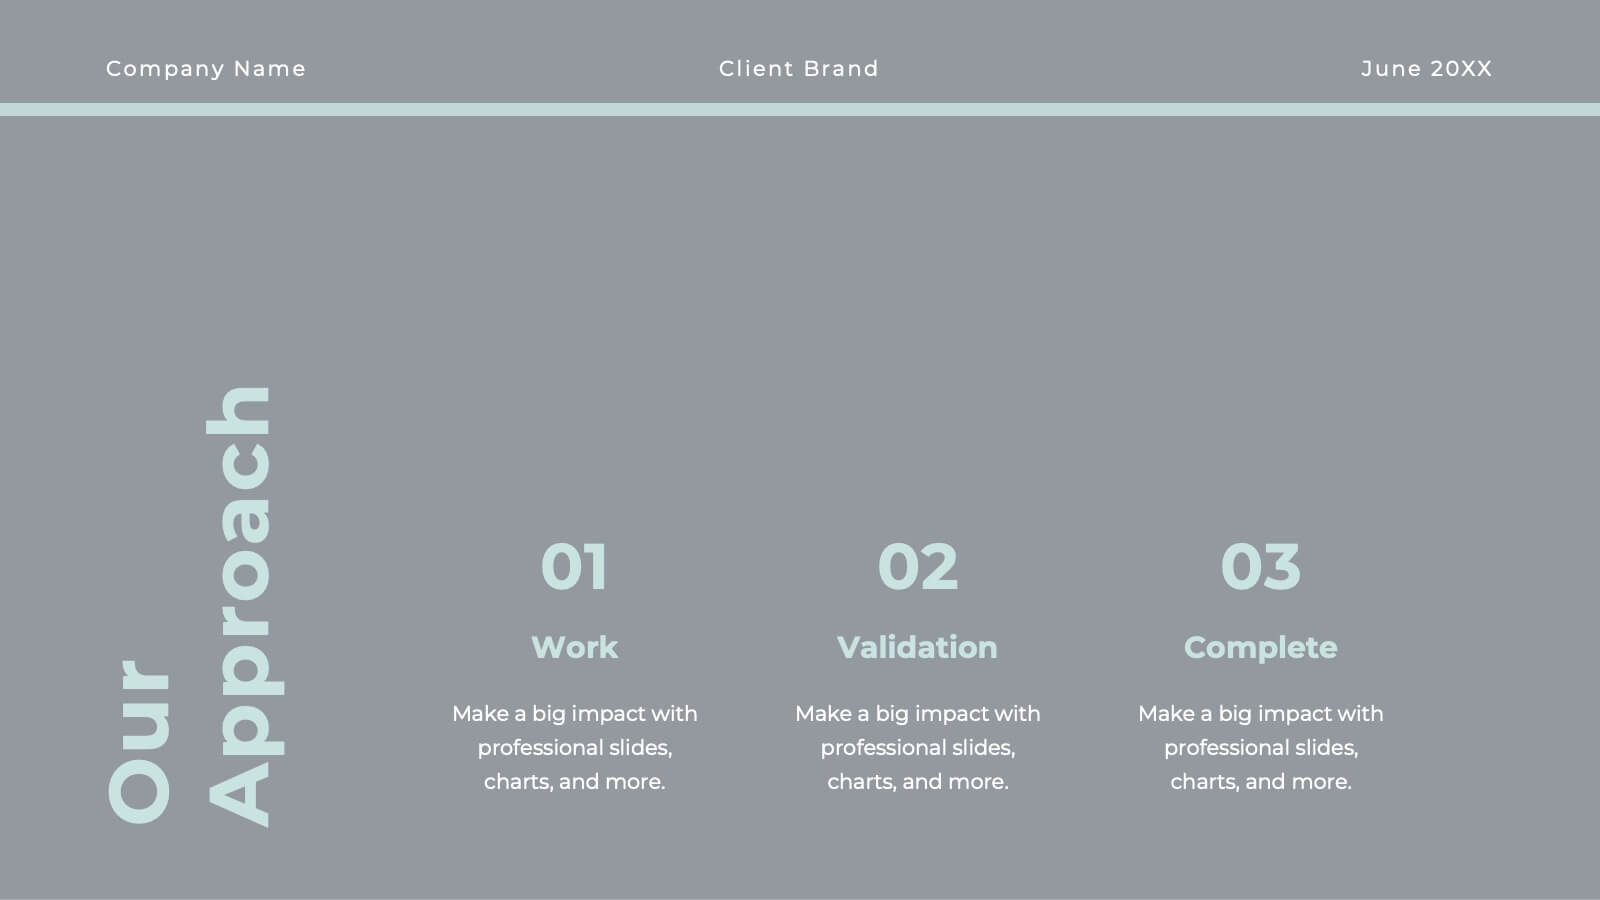
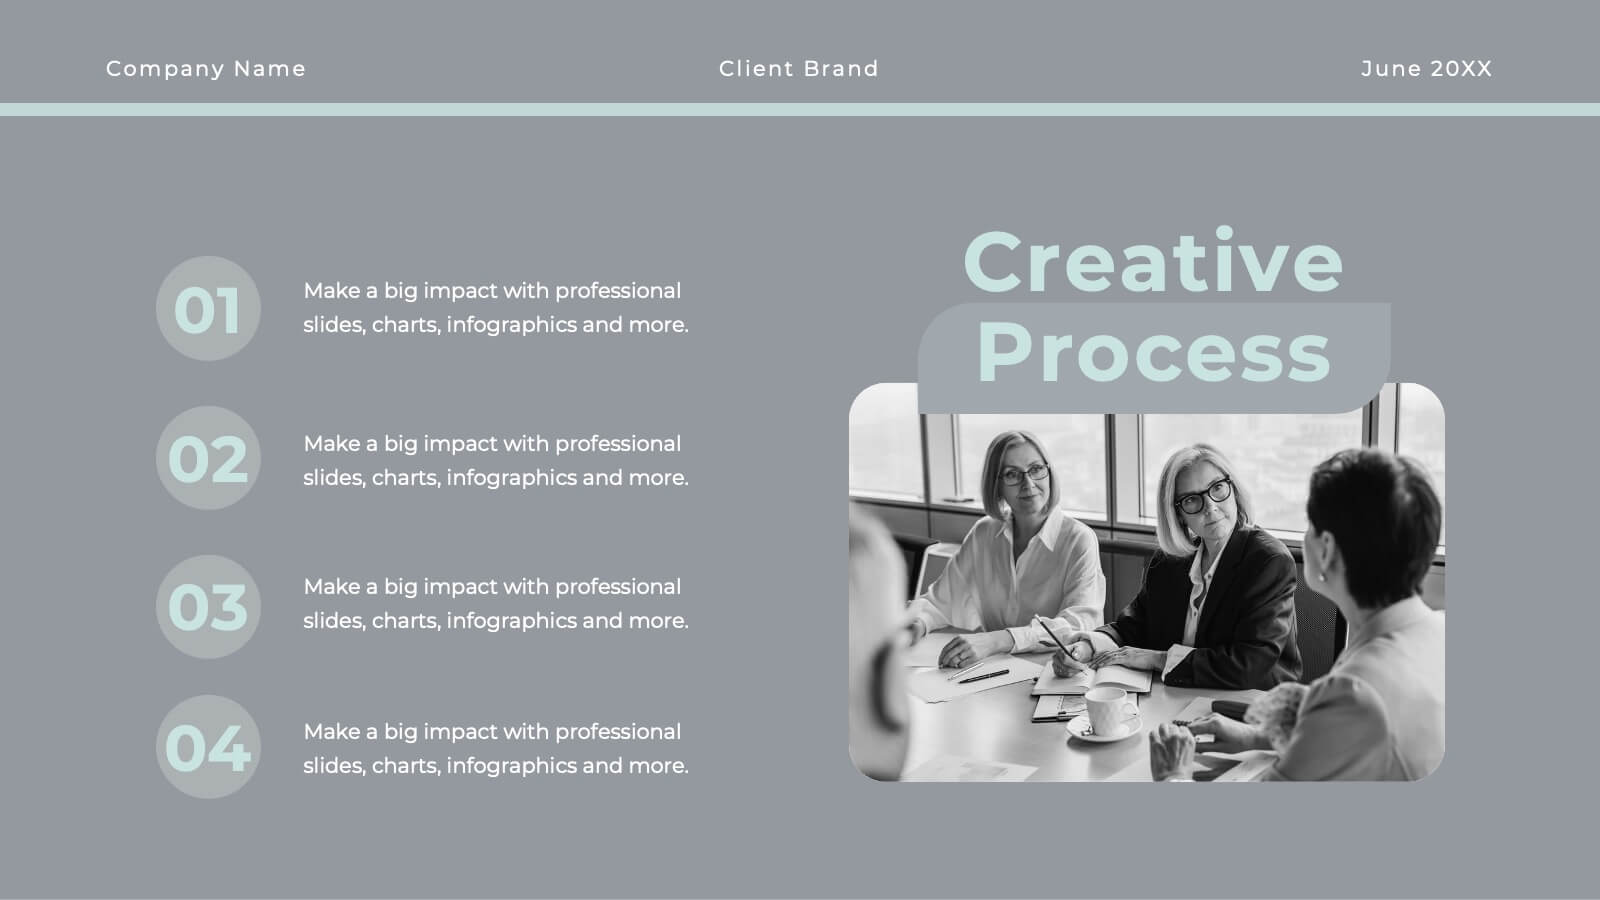
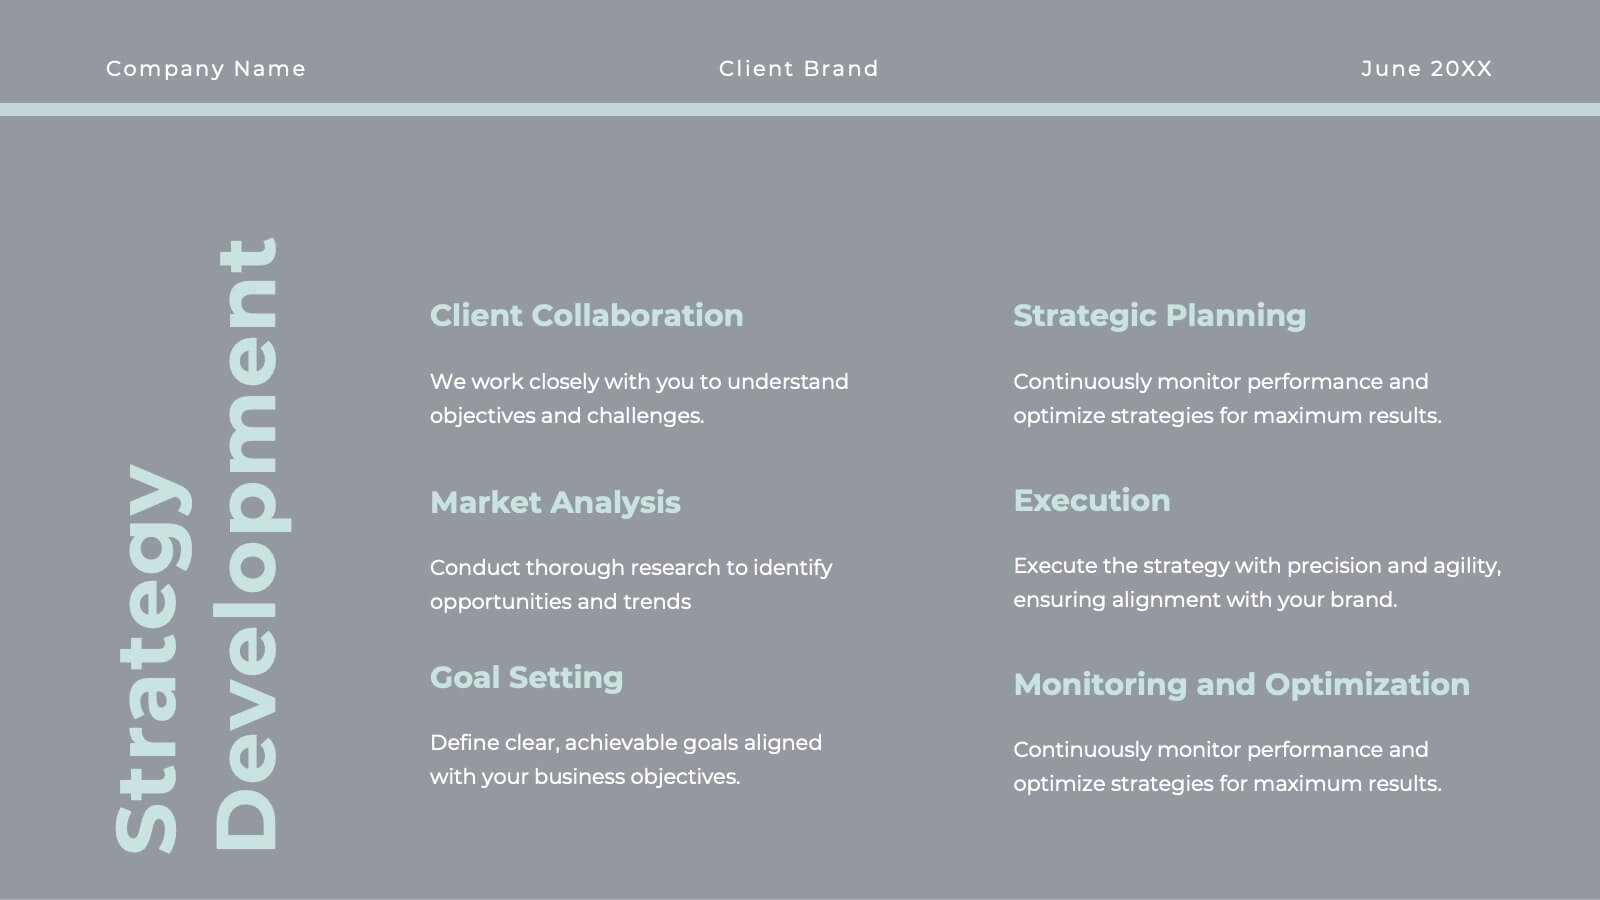
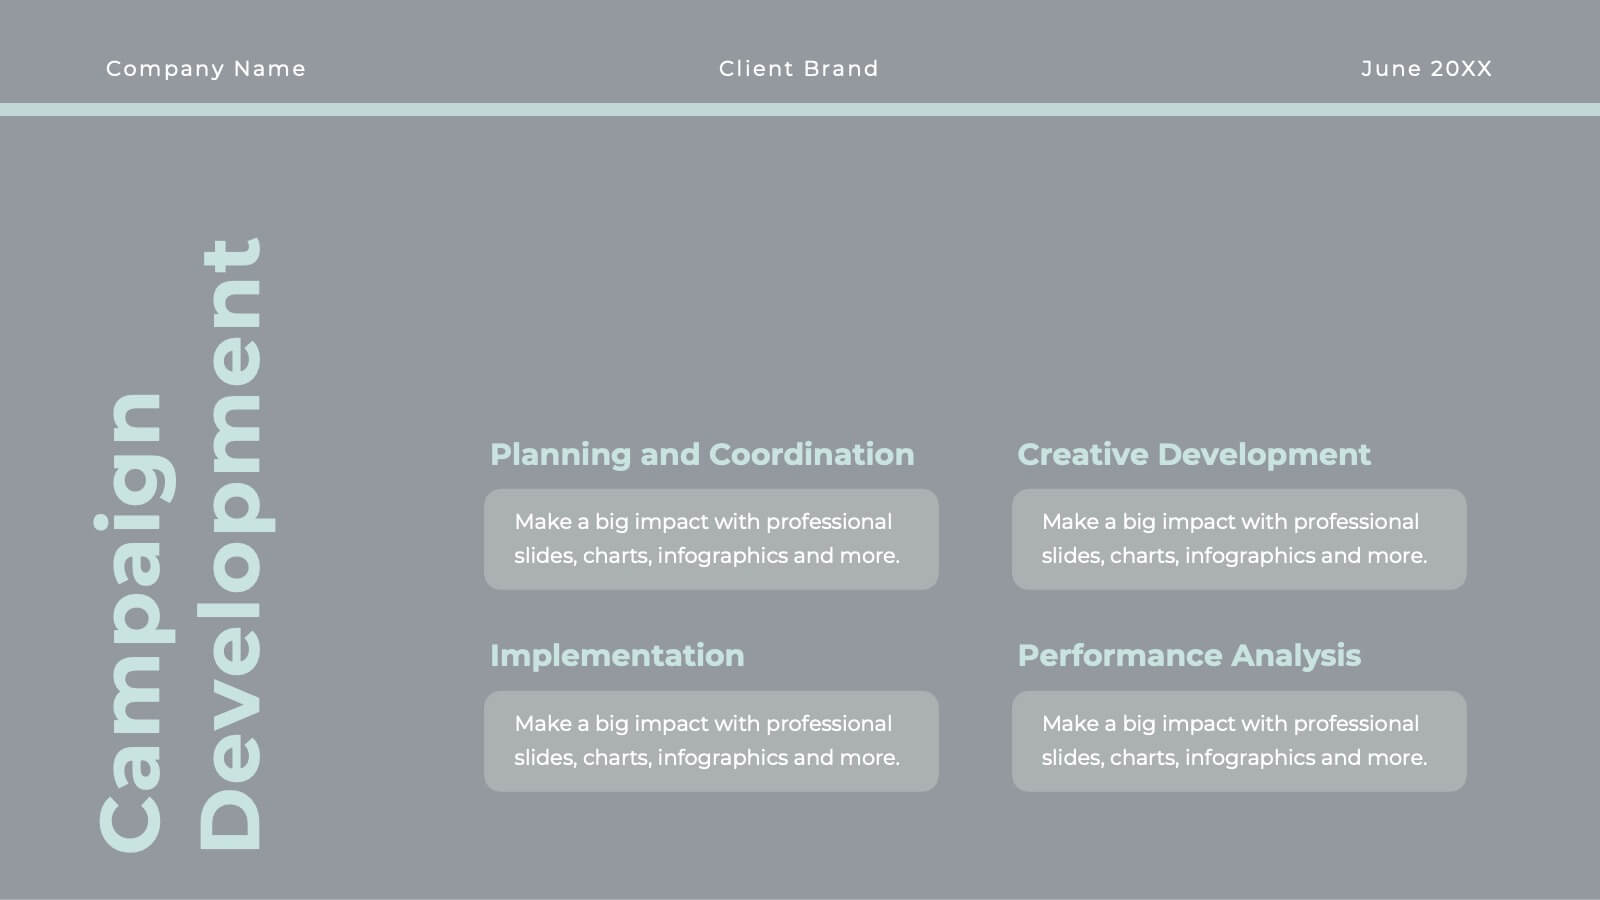
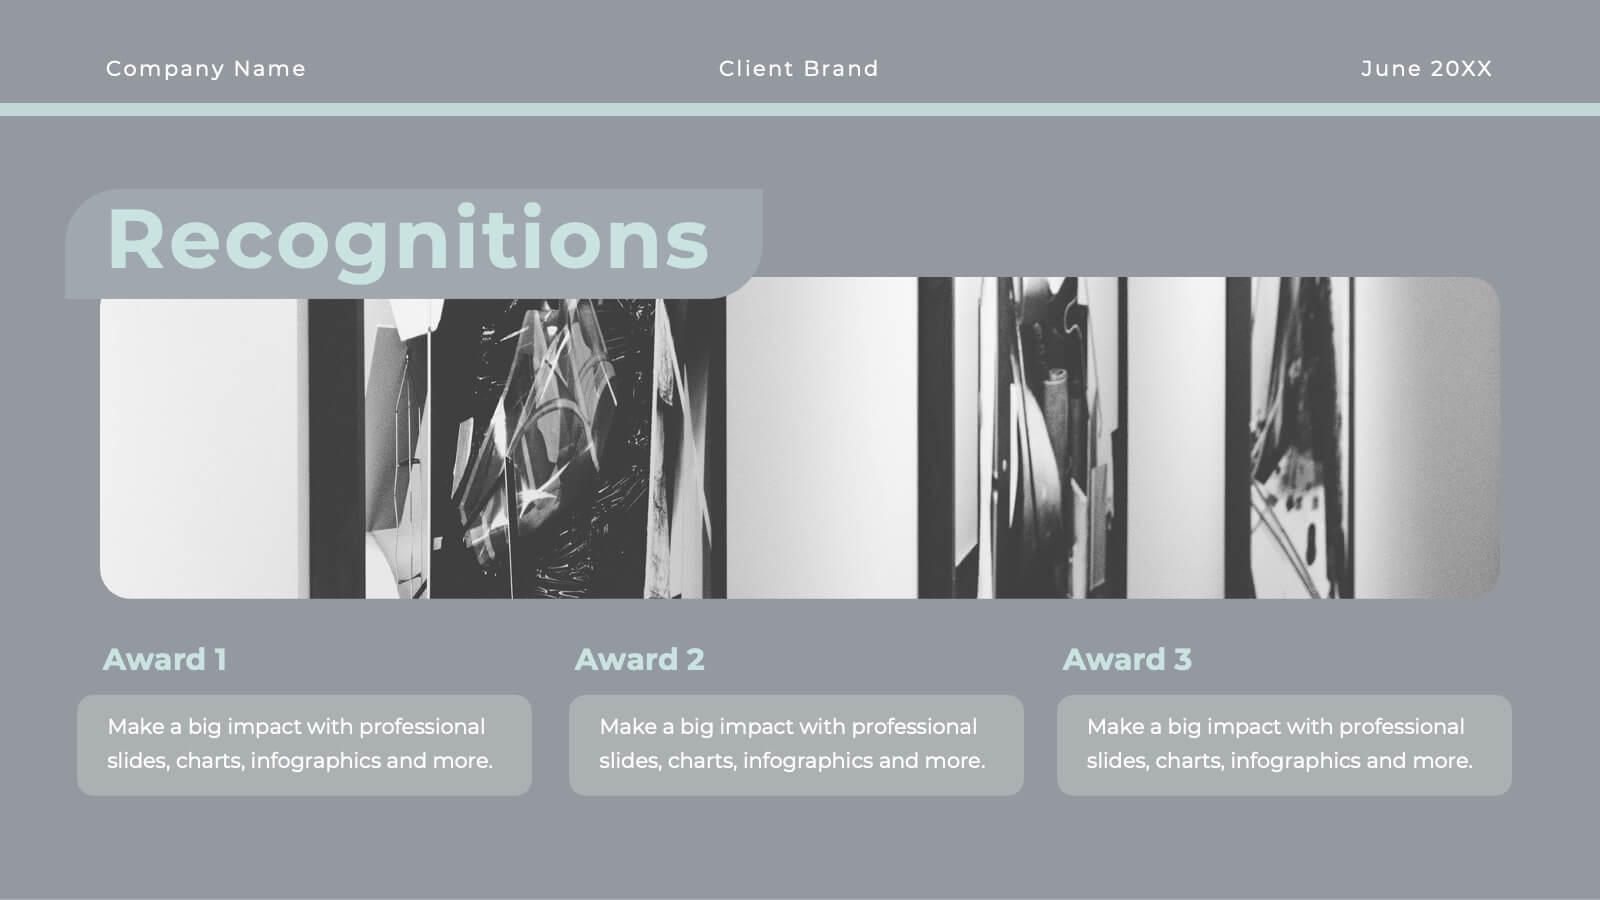
Whirlwind Advertising Agency Proposal Presentation
Get ready to elevate your agency’s game with a proposal template that’s as polished as your services! This sleek and sophisticated design is crafted to make a lasting impression on your clients and partners. From introducing your team’s expertise to showcasing successful case studies, every slide is meticulously designed to reflect professionalism and creativity. The clean, modern layout helps you present your market analysis, industry trends, and strategic approach with clarity and impact. With dedicated sections for client testimonials, campaign development, and partnership opportunities, this template ensures your agency’s value proposition is communicated with confidence and style. Perfectly adaptable to PowerPoint, Keynote, and Google Slides, this proposal template is your go-to tool for sealing deals and building lasting relationships. Your agency’s vision and mission will shine through in a presentation that’s both powerful and persuasive, making your proposals truly unforgettable!


21 diapositivas
Polaris Startup Strategy Presentation
Set your startup on a path to success with this bold and dynamic strategy presentation template. Featuring key sections like mission and vision, market analysis, business model, and growth plans, it’s perfect for entrepreneurs and teams. Fully compatible with PowerPoint, Keynote, and Google Slides for a seamless presentation experience.


6 diapositivas
Cryptocurrency Analysis Infographics
Analyze cryptocurrency effectively with our Cryptocurrency Analysis infographic template. This template is fully compatible with popular presentation software like PowerPoint, Keynote, and Google Slides, allowing you to easily customize it to illustrate and communicate various aspects of cryptocurrency analysis. The Cryptocurrency Analysis infographic template offers a visually engaging platform to explore and explain the key elements of analyzing cryptocurrencies, including market trends, technical analysis, fundamental analysis, and investment strategies. Whether you're a cryptocurrency enthusiast, trader, or investor, this template provides a user-friendly canvas to create informative presentations and educational materials. Enhance your cryptocurrency knowledge and analysis skills with this SEO-optimized Cryptocurrency Analysis infographic template, thoughtfully designed for clarity and ease of use. Customize it to showcase cryptocurrency charts, indicators, risk management techniques, and insights into the volatile world of digital assets, ensuring that your audience gains valuable insights into this evolving field. Start crafting your personalized infographic today to become a more proficient cryptocurrency analyst.


21 diapositivas
Vortexia Small Business Pitch Deck Presentation
Deliver an impressive pitch with a modern and sleek presentation template tailored for small businesses. Dive into critical aspects like team updates, current projects overview, and key achievements to showcase progress and potential. Address challenges and solutions in a structured way, while outlining departmental goals and performance metrics for transparency. The template includes slides for resource allocation, collaboration opportunities, and training and development strategies, ensuring a comprehensive narrative. Use the process improvement and feedback and suggestions sections to invite engagement and innovation. With fully editable slides, this template is compatible with PowerPoint, Google Slides, and Keynote, offering a polished and professional platform to highlight your business strengths and future plans. Perfect for entrepreneurs and small businesses ready to captivate stakeholders.


26 diapositivas
Financial Planning Essentials Presentation
Take control of your financial destiny with our Financial Planning Essentials presentation template, suitable for PowerPoint, Keynote, and Google Slides. This template is meticulously designed for financial advisors, planners, and anyone seeking to educate on the principles of sound financial management. Our Financial Planning Essentials template is a rich resource that provides an extensive range of slides to explain the basics of financial planning, investment strategies, and wealth management. It allows you to break down financial concepts into easy-to-understand elements, making it perfect for client presentations, financial workshops, and educational seminars. Featuring customizable diagrams, charts, and financial models, the template enables a personalized approach to presenting financial data and strategies. Whether you're outlining budgeting techniques, investment plans, or retirement strategies, this template helps you communicate complex information in a clear and professional manner. Optimize your financial planning presentations with our SEO-friendly template to become a trusted resource in financial education and planning. Lead your audience toward financial freedom with a comprehensive and engaging presentation that simplifies the path to financial success.


4 diapositivas
Soft Watercolor Background Slides Presentation
Add a soft, elegant touch to your presentation with this Soft Watercolor Background Slides Presentation. Designed with gentle gray brushstroke textures and clean, modern layout, it's perfect for conveying ideas clearly while maintaining visual appeal. Ideal for creative, wellness, or professional topics. Fully editable in PowerPoint, Google Slides, and Canva.


5 diapositivas
Visual Decision-Making with Harvey Balls Presentation
Simplify complex evaluations with this Harvey Ball comparison chart. Ideal for product comparisons, feature assessments, or decision-making matrices, this slide presents up to 6 items and 4 features with intuitive visual cues. Fully editable in PowerPoint, Keynote, or Google Slides, it’s perfect for business, marketing, and strategy teams seeking clear and compelling insights.


26 diapositivas
Company Profile Simple Duotone Presentation
Introducing our premier company profile presentation template, designed to beautifully encapsulate the essence of your business. Set against a backdrop that transitions from the serene blue sky to a deeper, more intense blue, this template evokes feelings of limitless possibilities and profound depth. This dual-tone theme, with its varying shades of blue, not only emphasizes trust, professionalism, and reliability but also creates an atmosphere of calm and stability, essential attributes for showcasing your company's strengths and accomplishments. Modern in its layout, our template facilitates a structured presentation of your company's history, mission, achievements, and future aspirations. The design intricately merges the visuals of the expansive sky with the profound depth of the darker hue, creating a narrative that speaks of a firm foundation with an eye on soaring to new heights. Perfectly compatible with both PowerPoint and Google Slides, this template offers ease of customization. Whether it's adjusting the content to fit your corporate story or tweaking the design elements, this template offers flexibility and user-friendliness. Dive deep into your company's journey and aspirations with this exquisite blue-themed template. It's not just a presentation; it's a reflection of your company's ethos and vision. Utilize this template to give stakeholders, partners, and employees a p....


5 diapositivas
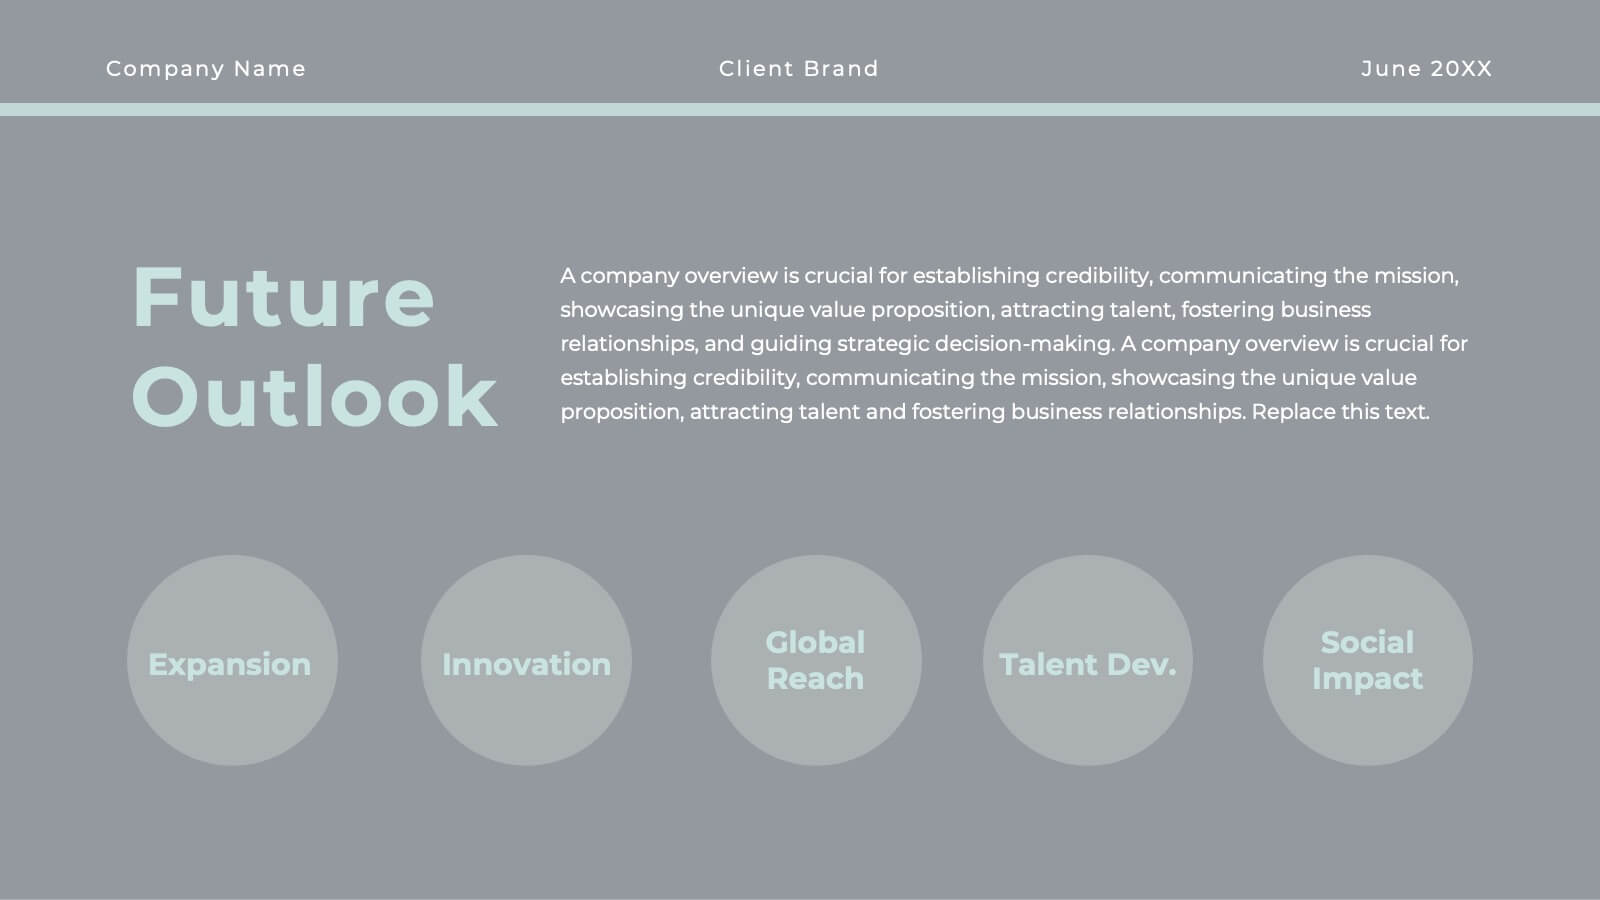
Long-Term Strategy Slide Presentation
Ignite big ideas with a bold, forward-moving layout that makes long-range goals feel inspiring and achievable. This presentation helps you outline future plans, key milestones, and strategic priorities with clarity and visual impact. Easy to edit and fully compatible with PowerPoint, Keynote, and Google Slides.


5 diapositivas
Business Growths Strategy Presentation
Grow your ideas with a dynamic visual layout that makes every milestone feel achievable and clear. This presentation helps you explain key stages, strategic actions, and long-term growth goals with confidence and simplicity. Fully customizable and compatible with PowerPoint, Keynote, and Google Slides.


6 diapositivas
5-Stage Circular Cycle Presentation
Energize your workflow with a clean, circular layout that turns five interconnected steps into a clear, engaging story. This presentation helps you explain any repeating process or continuous cycle with simplicity and flow, making complex ideas easier to follow. Compatible with PowerPoint, Keynote, and Google Slides.


5 diapositivas
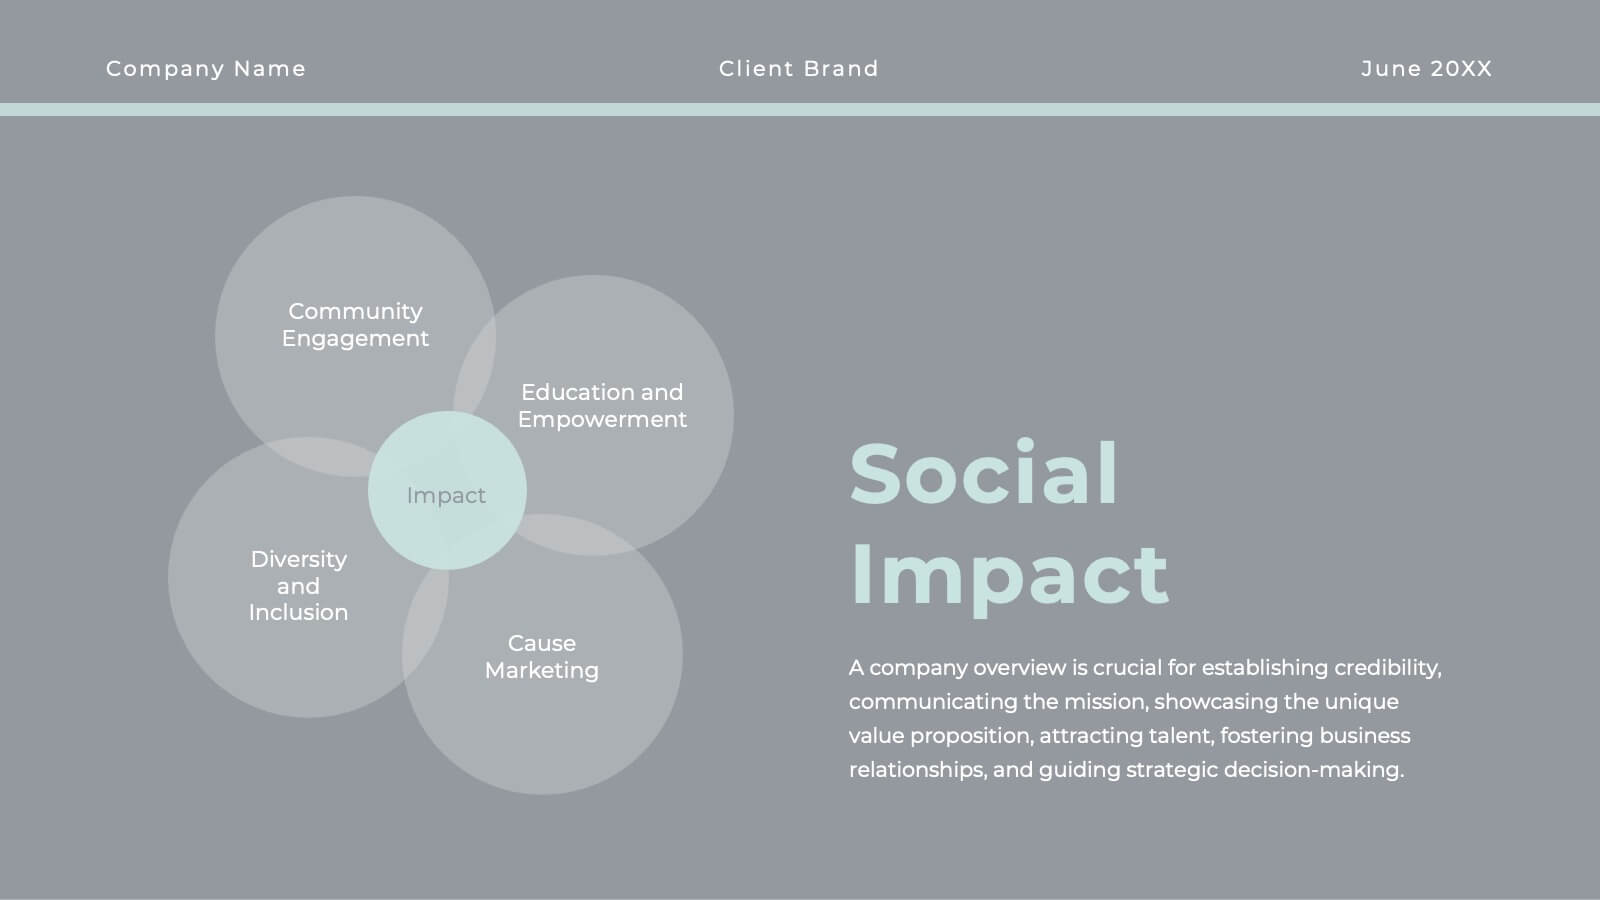
Social Media Strategy Infographic
Social Media refers to digital platforms and websites that allow users to create and share content, engage with others, and participate in online communities. This presentation template is a powerful tool to help you create a comprehensive social media strategy. It provides a visually appealing and easy-to-understand overview of the key elements of a successful social media strategy. Use this template to plan and communicate your social media strategy effectively, ensuring that you make the most of your social media presence and engage your target audience efficiently. This template is compatible with Powerpoint, Keynote, and Google Slides.


5 diapositivas
Strategic Planning with Concentric Circles Presentation
Visualize Your Strategy with Clarity using this Strategic Planning with Concentric Circles Presentation template. Designed to illustrate layered processes, decision-making frameworks, and business growth strategies, this concentric model helps communicate core ideas with structured, expanding details. Fully customizable and compatible with PowerPoint, Keynote, and Google Slides, this template is perfect for business leaders, strategists, and consultants aiming for clear and impactful presentations.


5 diapositivas
Editable World Map Infographic Presentation
Bring your global insights to life with this clean, modern presentation designed to explain international data in a clear, engaging way. Visual markers and simple layouts help you highlight key regions, trends, and comparisons with ease. Fully compatible with PowerPoint, Keynote, and Google Slides.


20 diapositivas
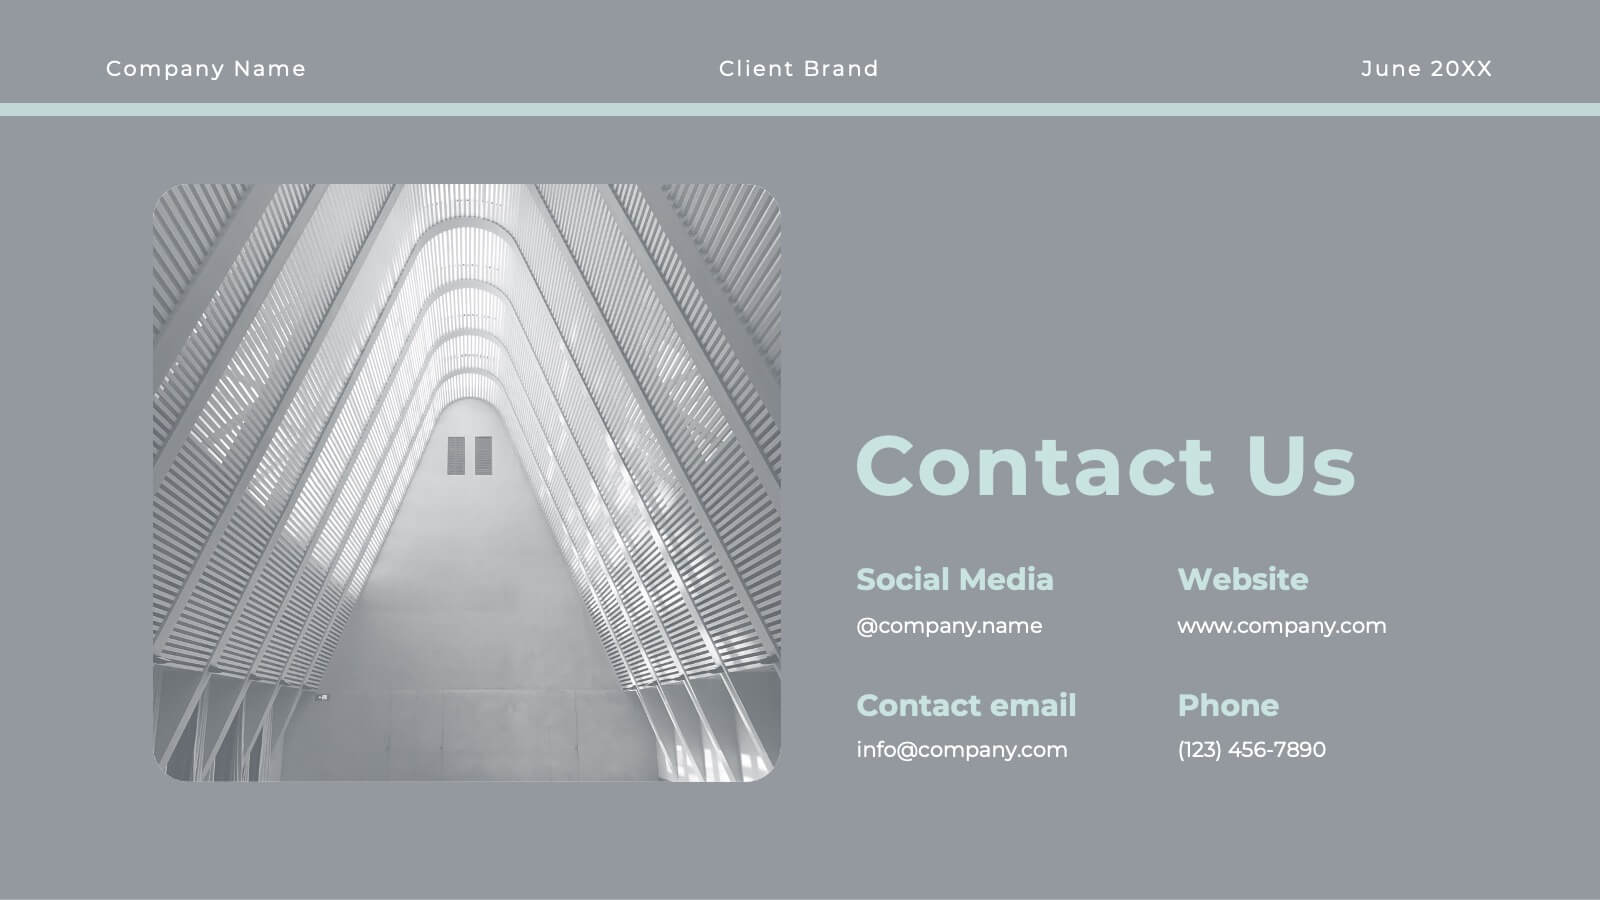
Wyrmwood Design Proposal Presentation
The Startup Funding Proposal Presentation Template includes 20 sleek and professional slides covering problem statements, solutions, pricing structures, and team expertise. With its modern black-and-white aesthetic, it ensures clarity and impact. Fully editable and compatible with PowerPoint, Keynote, and Google Slides, it's perfect for startups seeking investment opportunities and partnerships.


6 diapositivas
Business Risk Identification and Management Presentation
Identify, analyze, and mitigate business risks with ease. This Business Risk Identification and Management template helps teams visualize potential risks, assess their impact, and implement mitigation strategies. Perfect for corporate leaders, project managers, and financial analysts. Fully customizable and compatible with PowerPoint, Keynote, and Google Slides for seamless presentation use.