


Características


¿Tienes alguna pregunta?
Recomendar


20 diapositivas
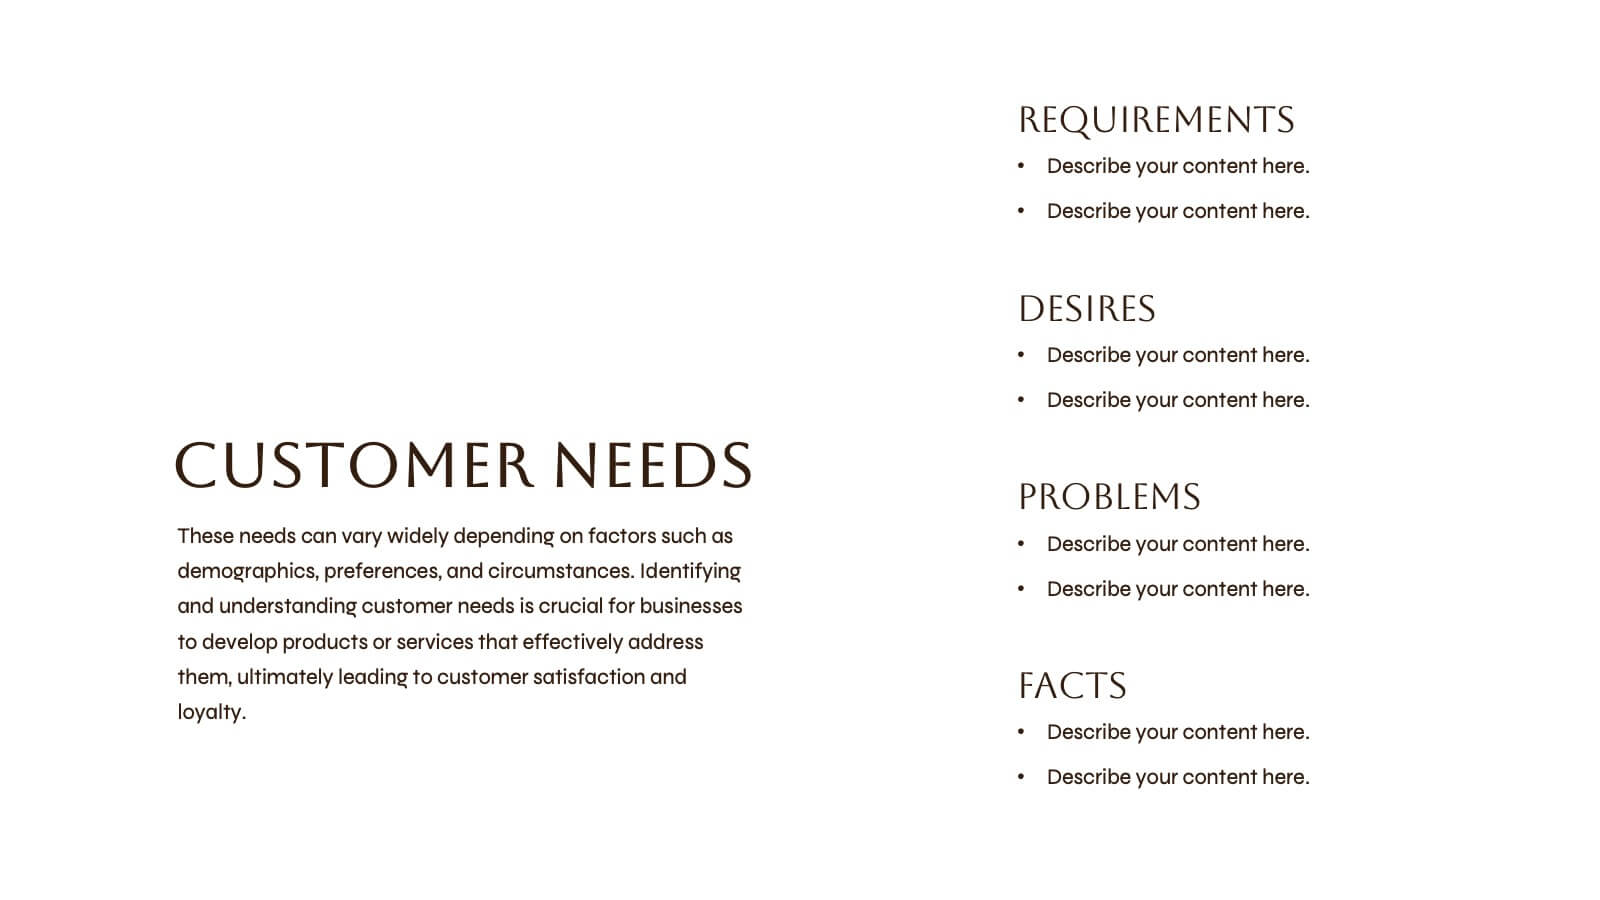
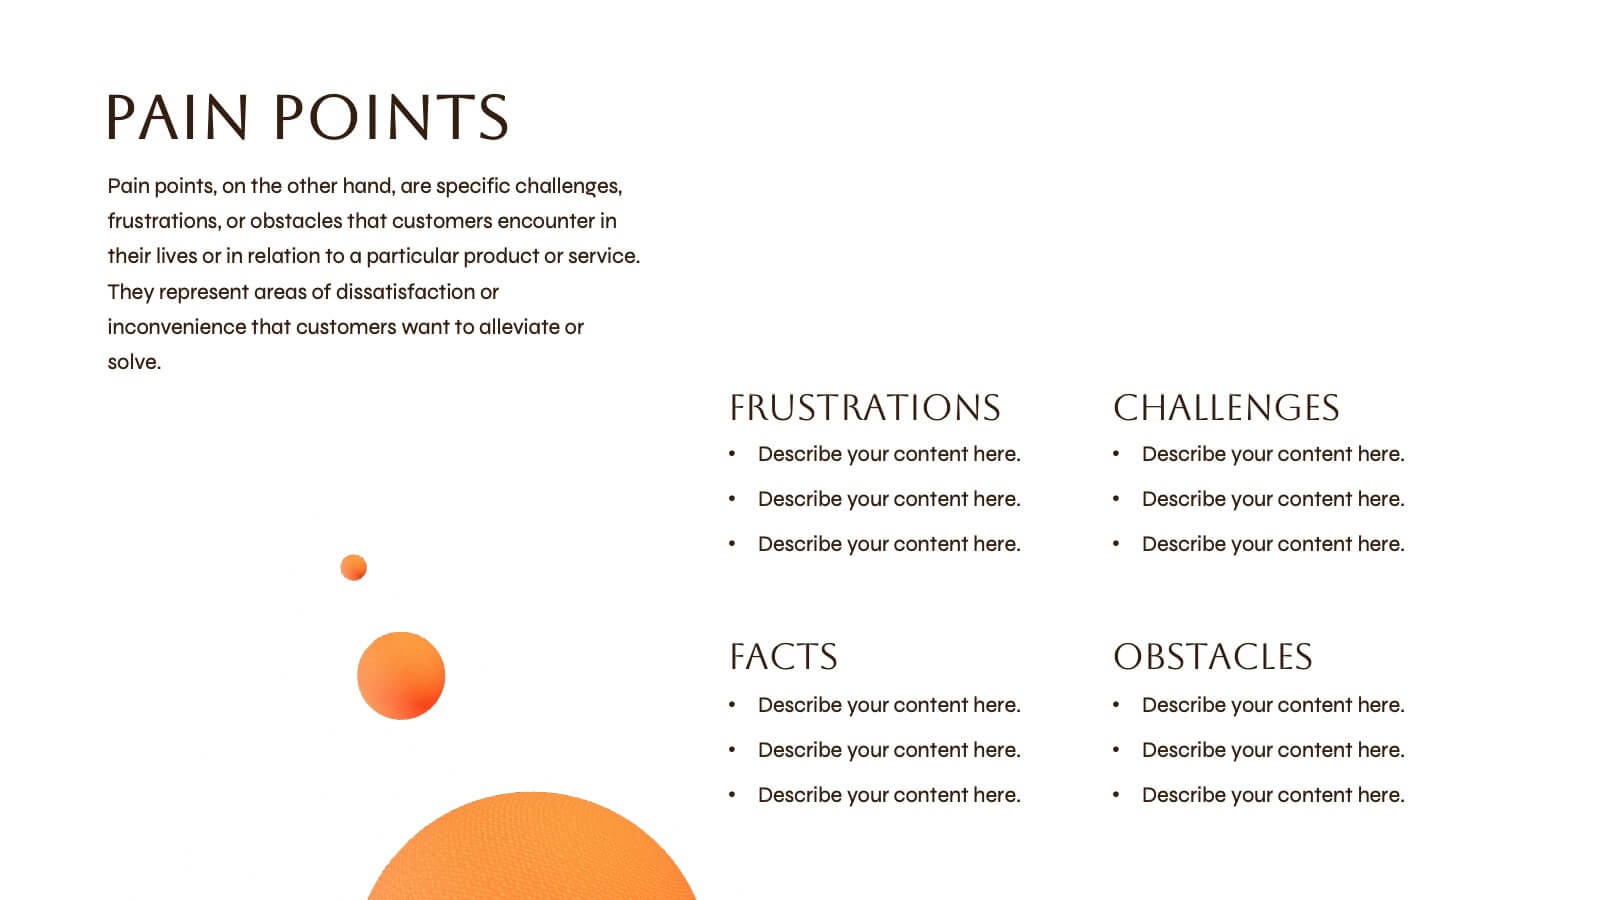
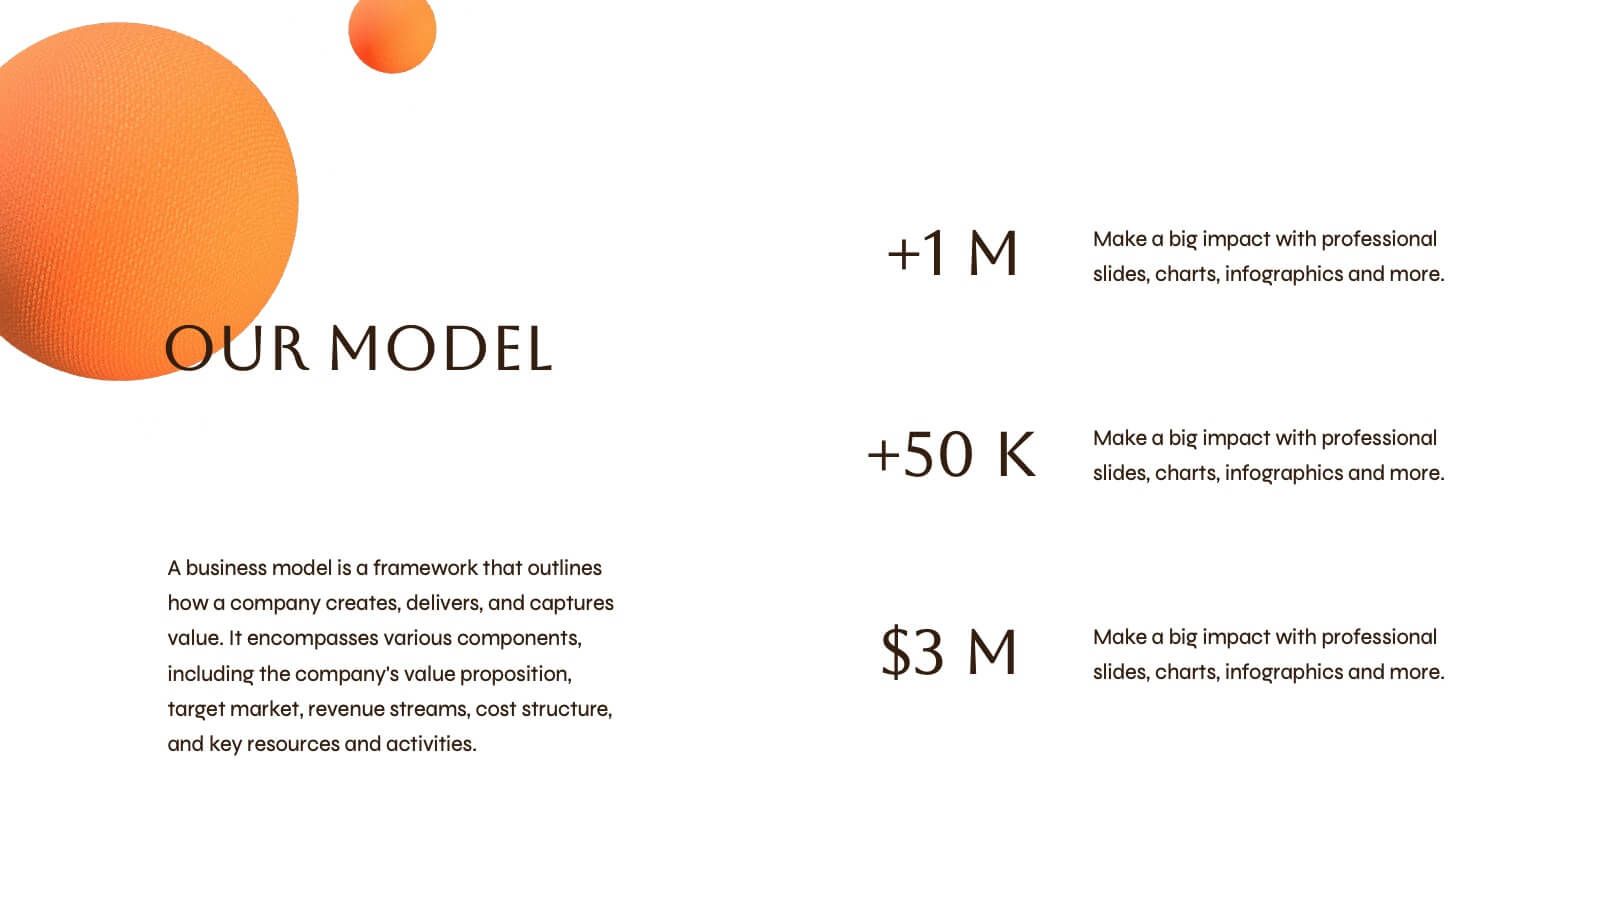
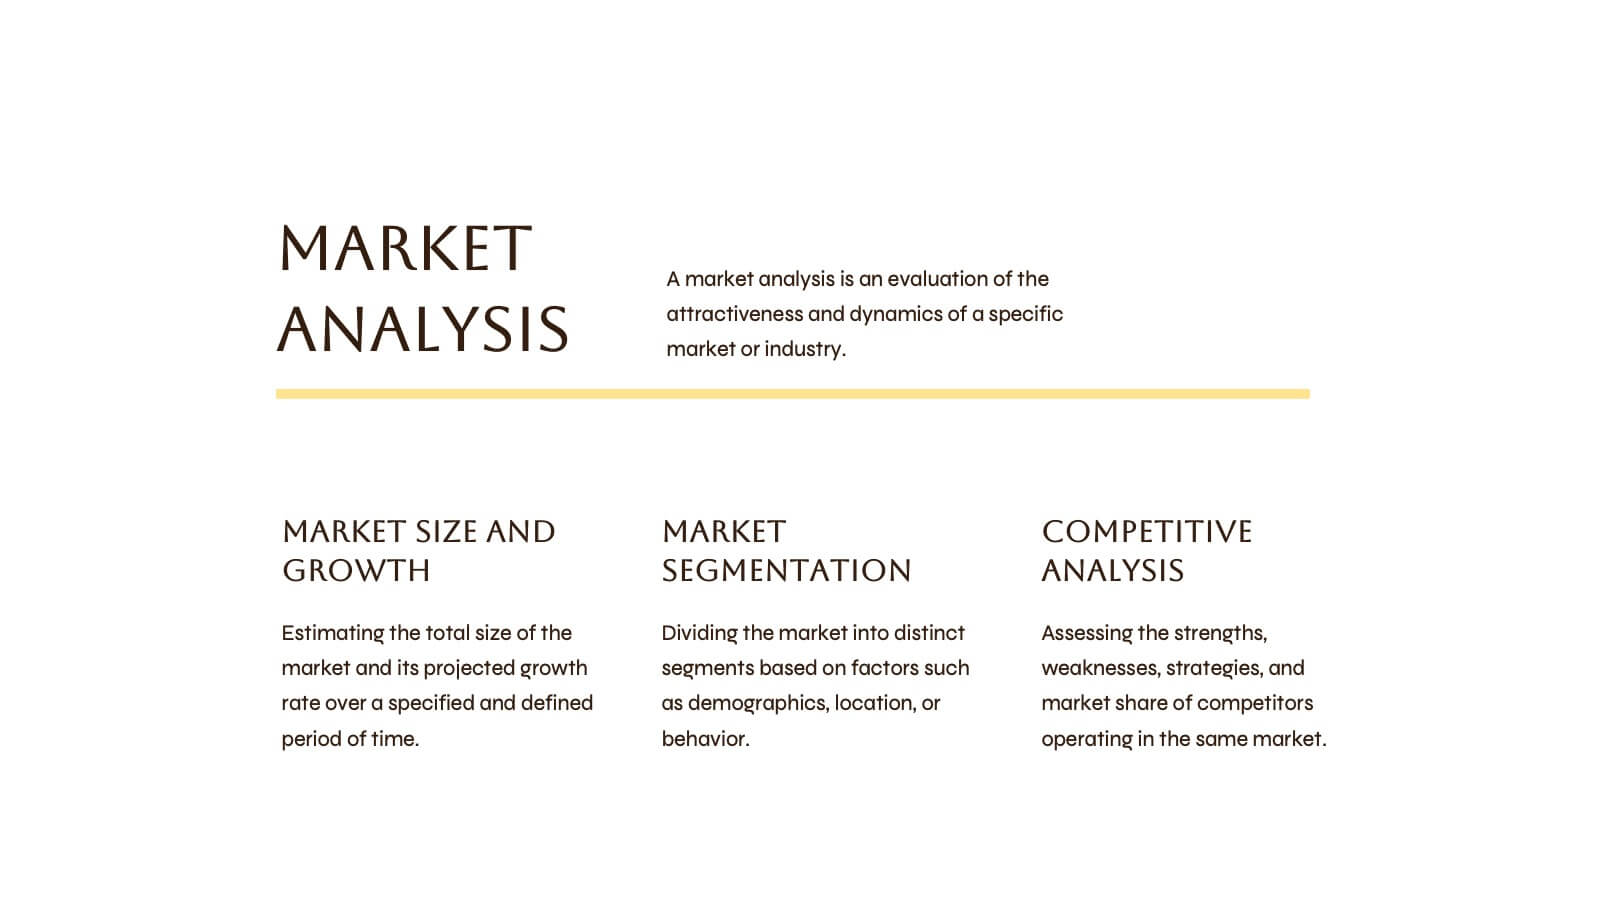
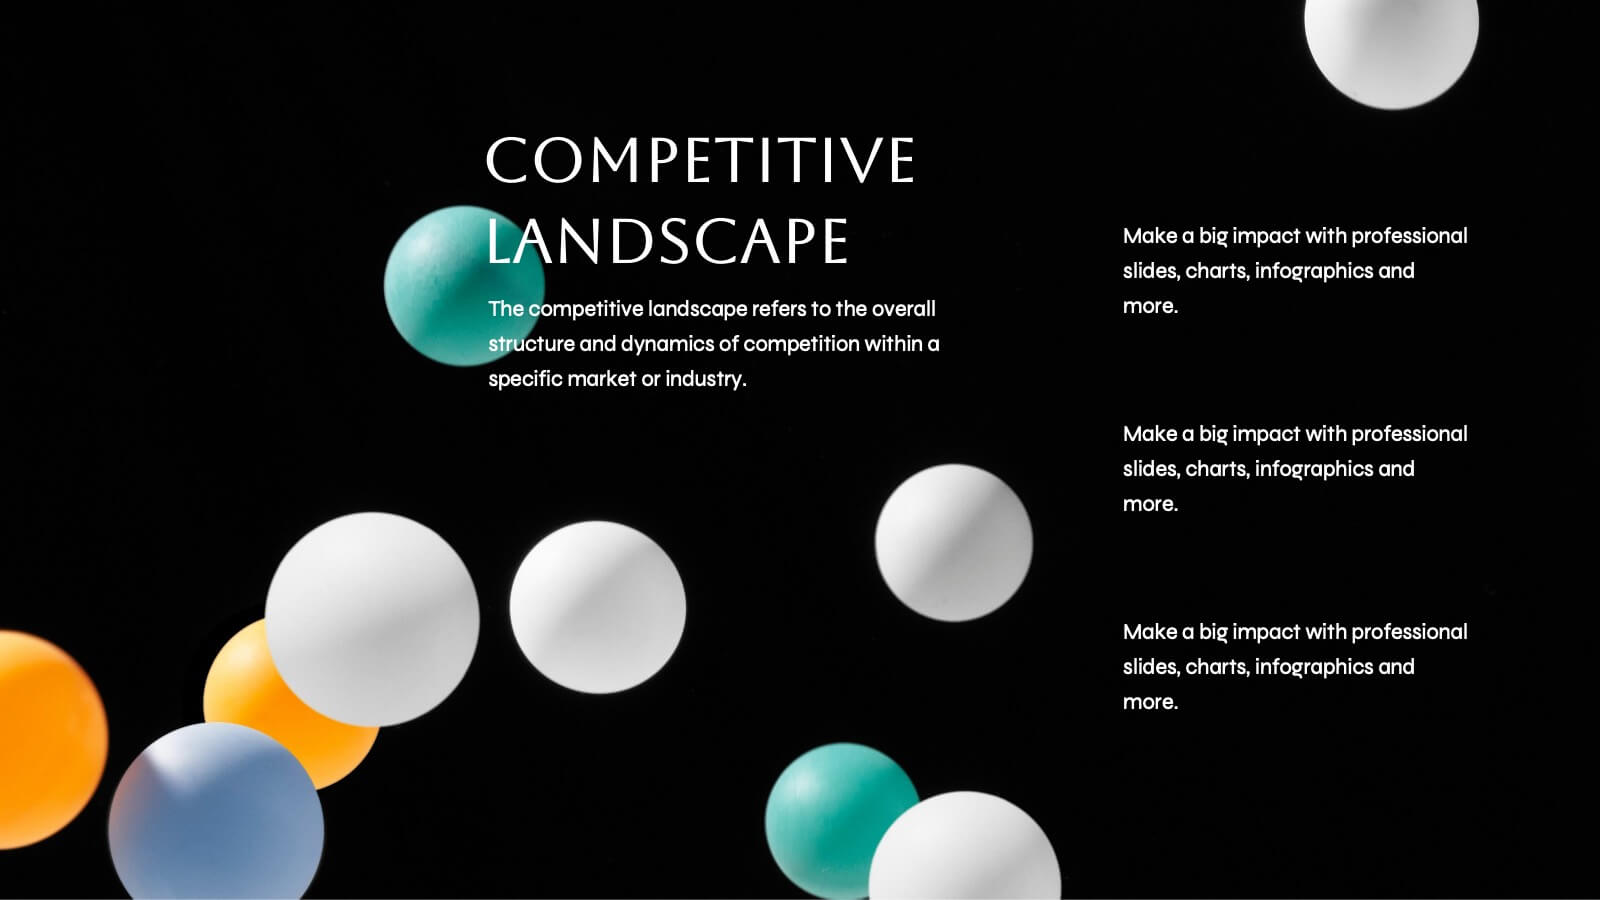
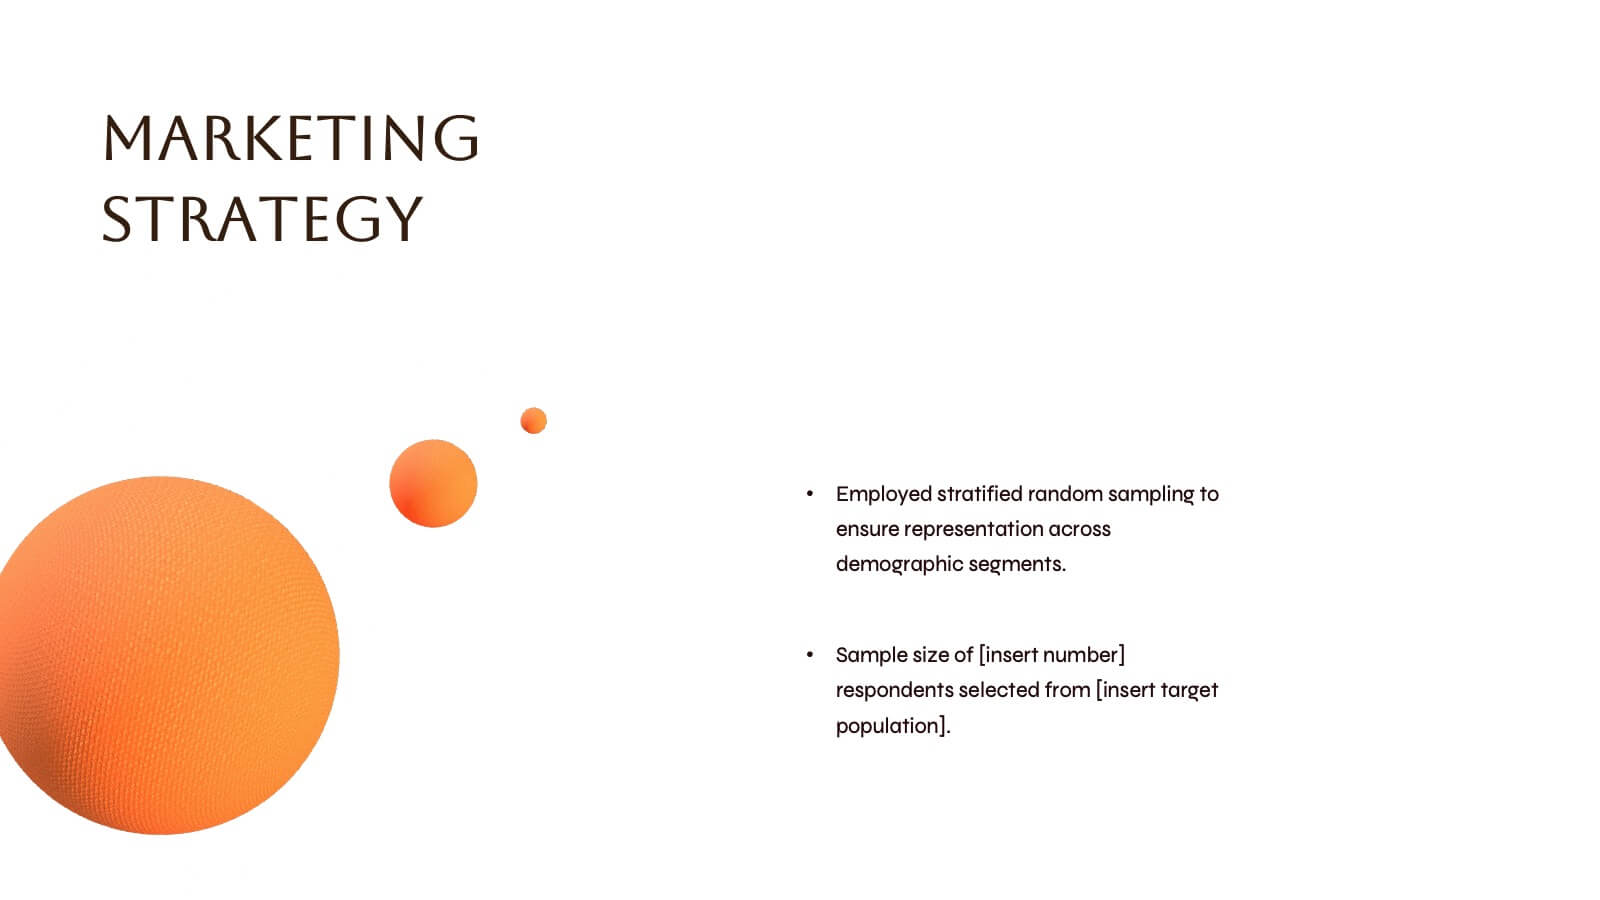
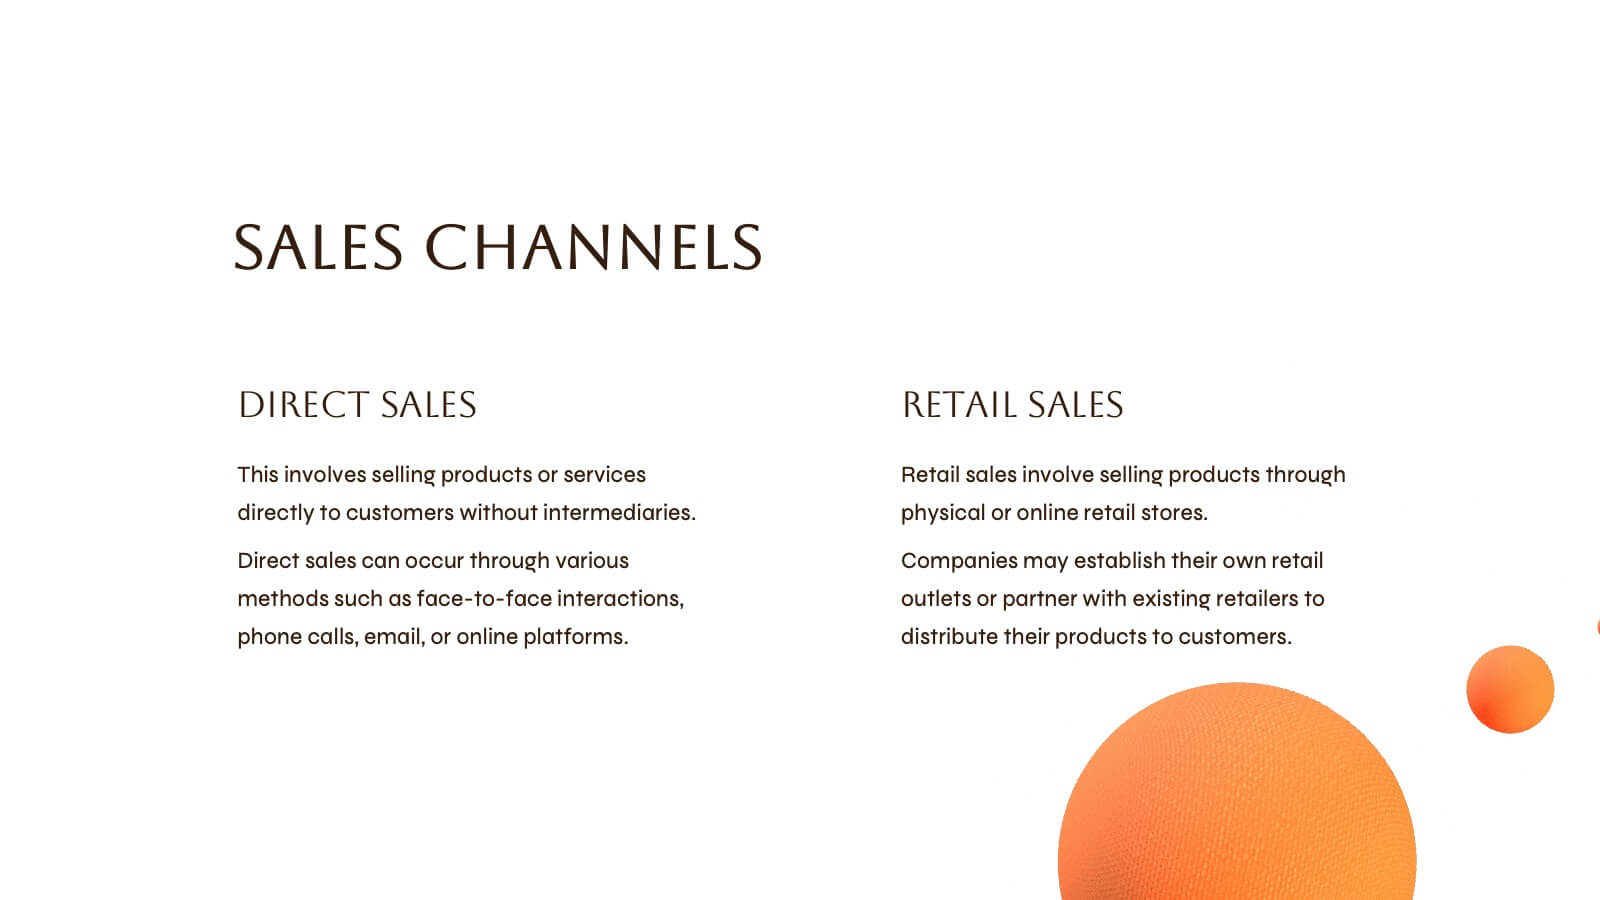
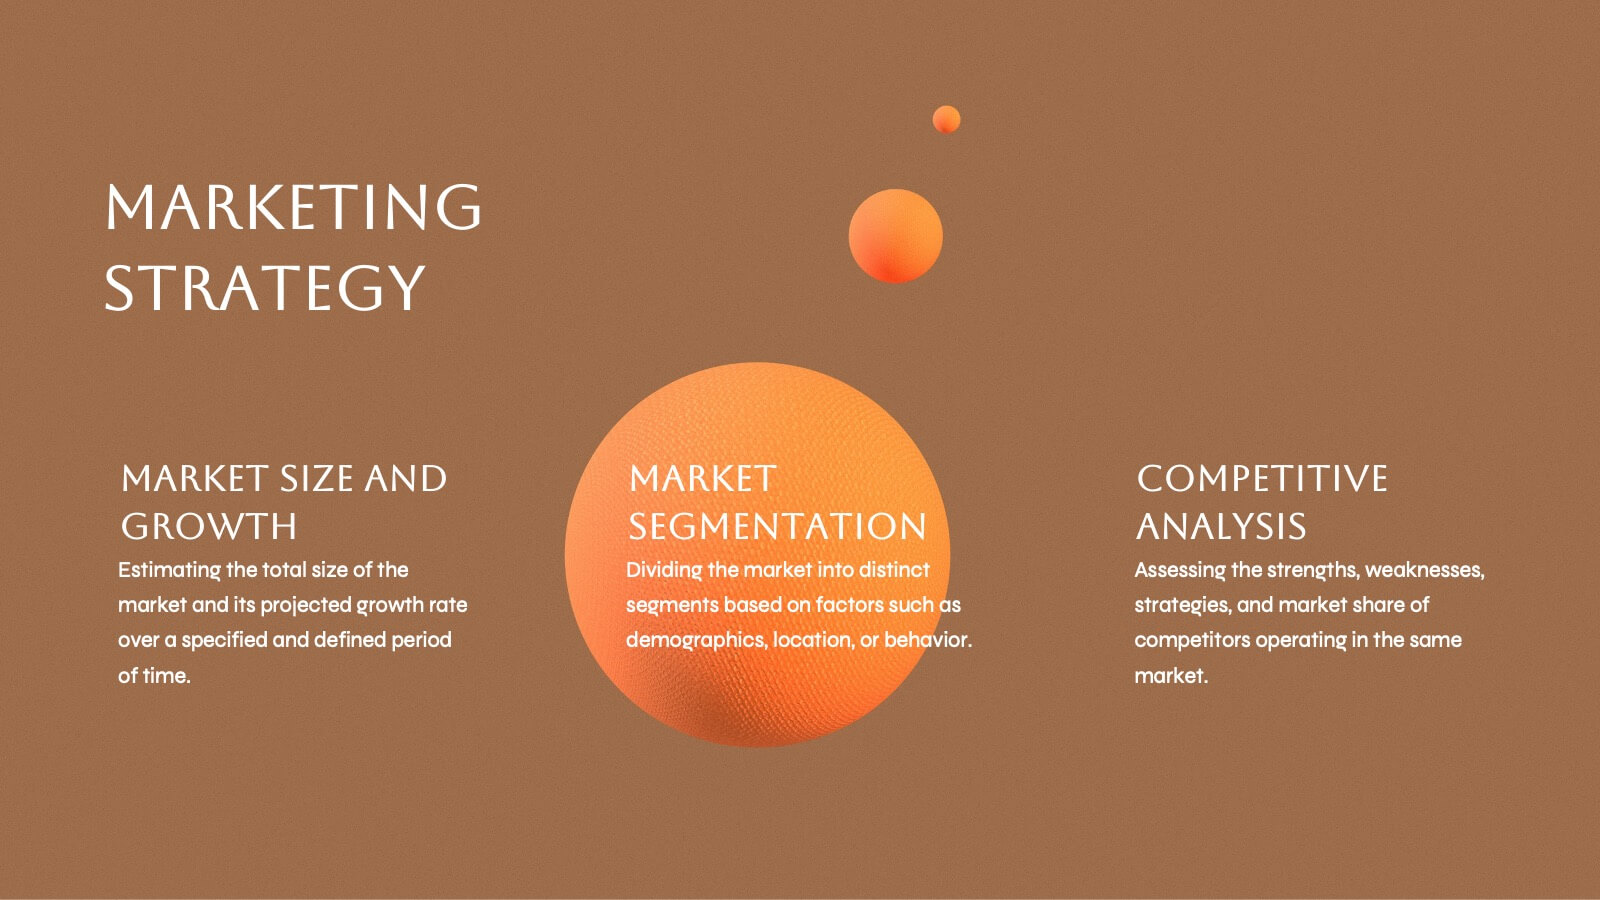
Fire Spin Startup Pitch Deck Presentation
Ignite your pitch with this bold, fire-inspired presentation template, perfect for showcasing your startup’s potential! This deck helps you present key business elements like market research, revenue models, and growth strategies in a dynamic, visually engaging format. Stand out from the competition. Compatible with PowerPoint, Keynote, and Google Slides.


2 diapositivas
Small Business Success Illustrations
Get your business on the right track with our small business success illustrations pack! These illustrations will help you with your next business presentation and make it more engaging and catchy. Fully compatible with Powerpoint, Keynote, and Google Slides. You can use these in your website, blog or social media posts. Turn your vision into a reality—download the small business success illustrations pack today!


21 diapositivas
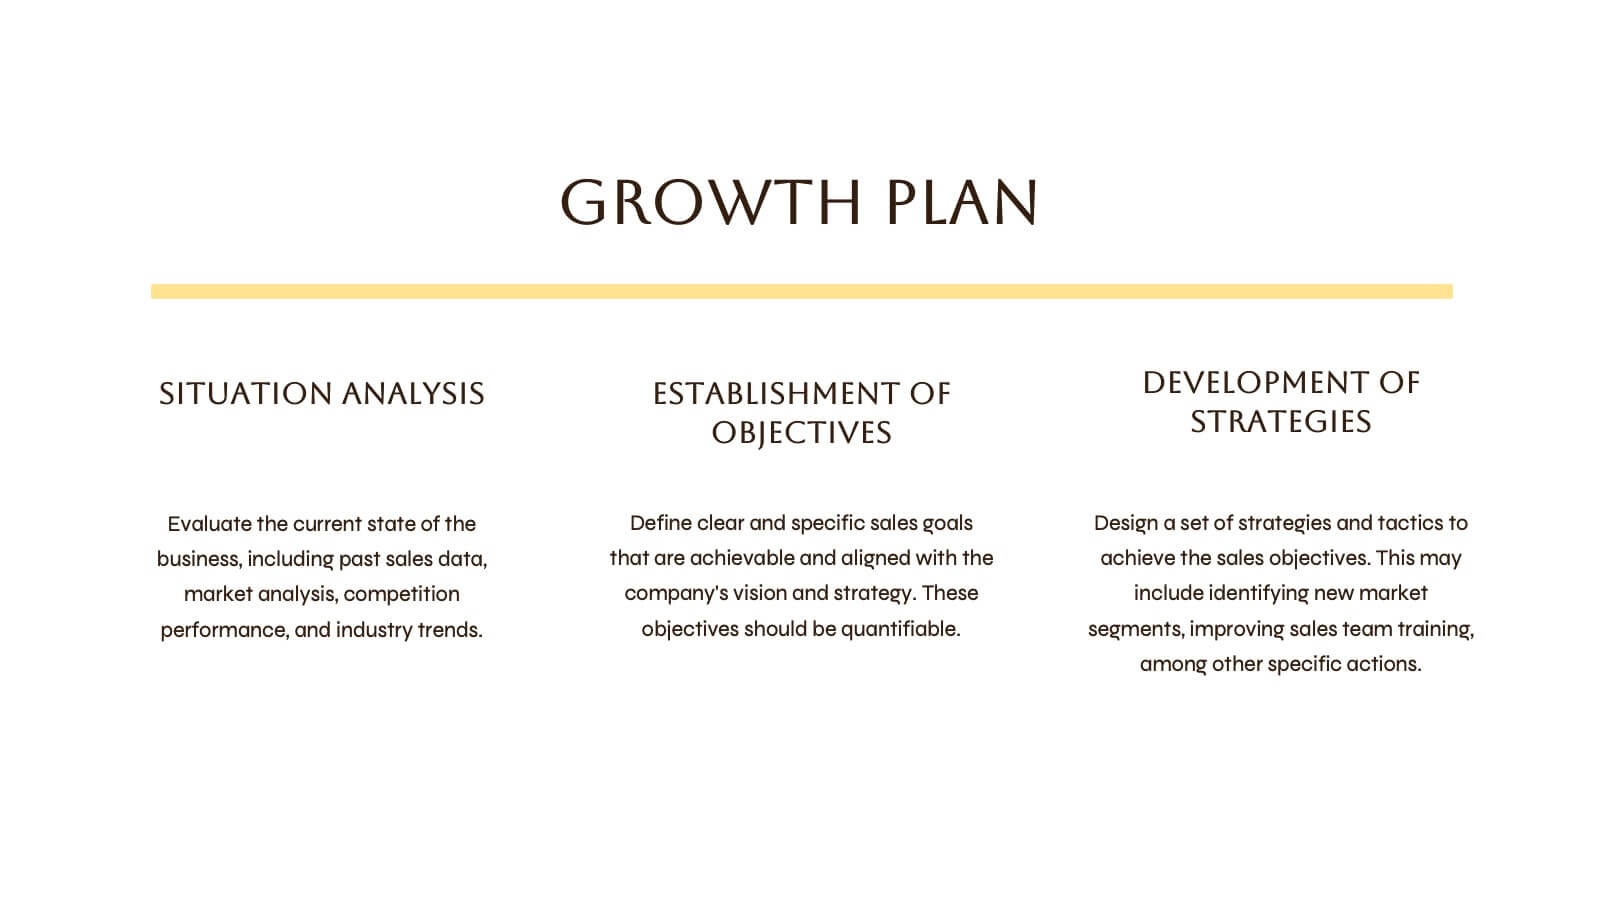
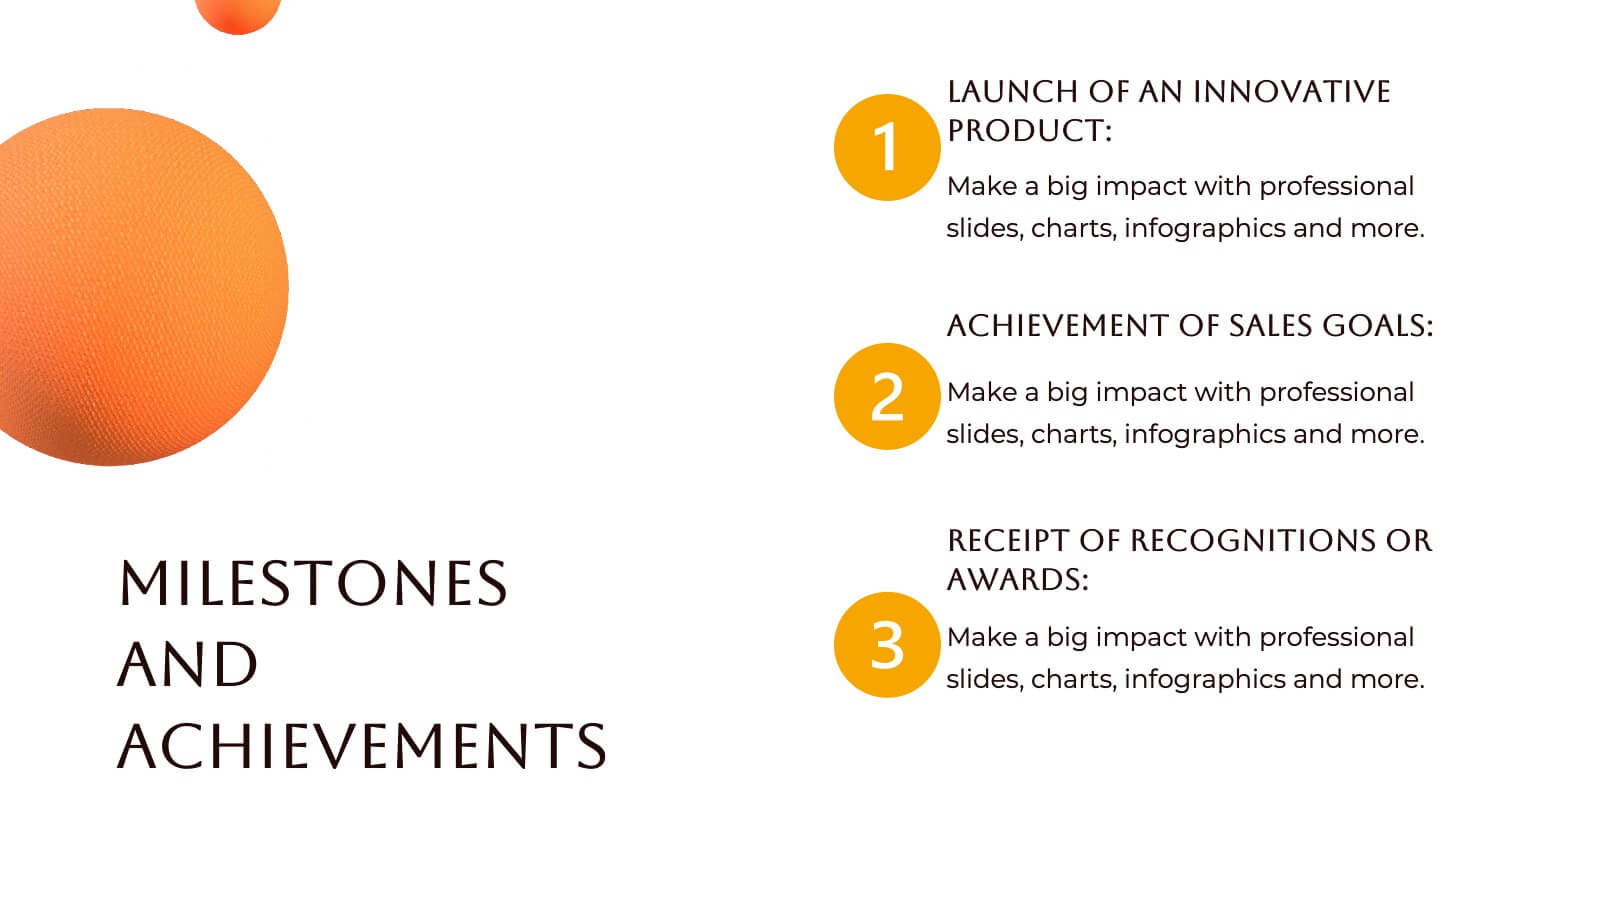
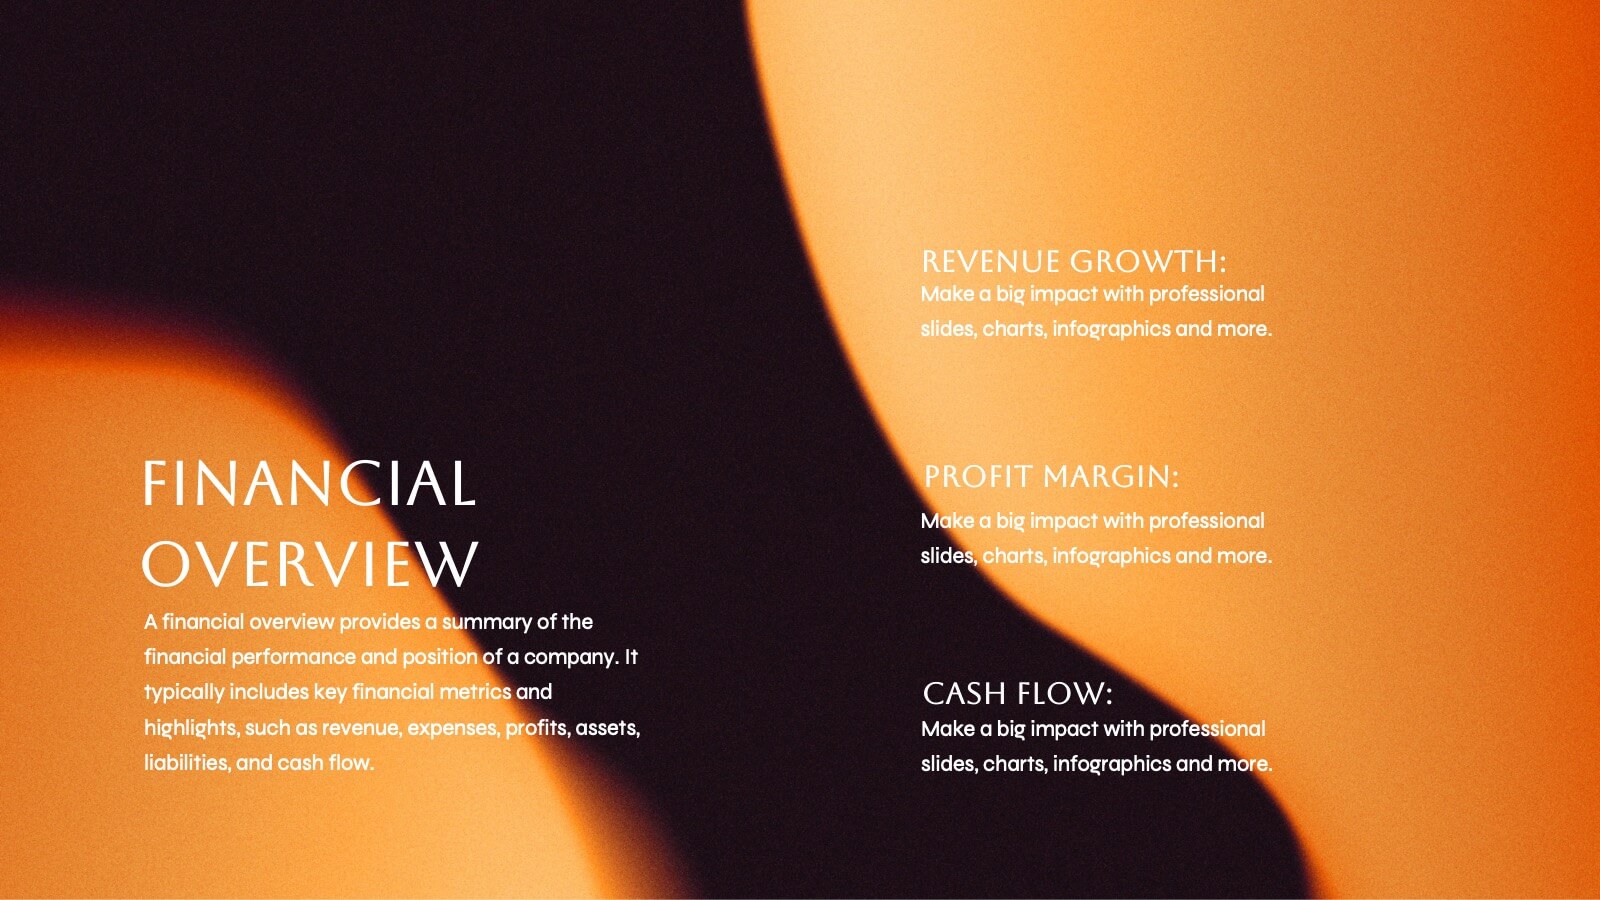
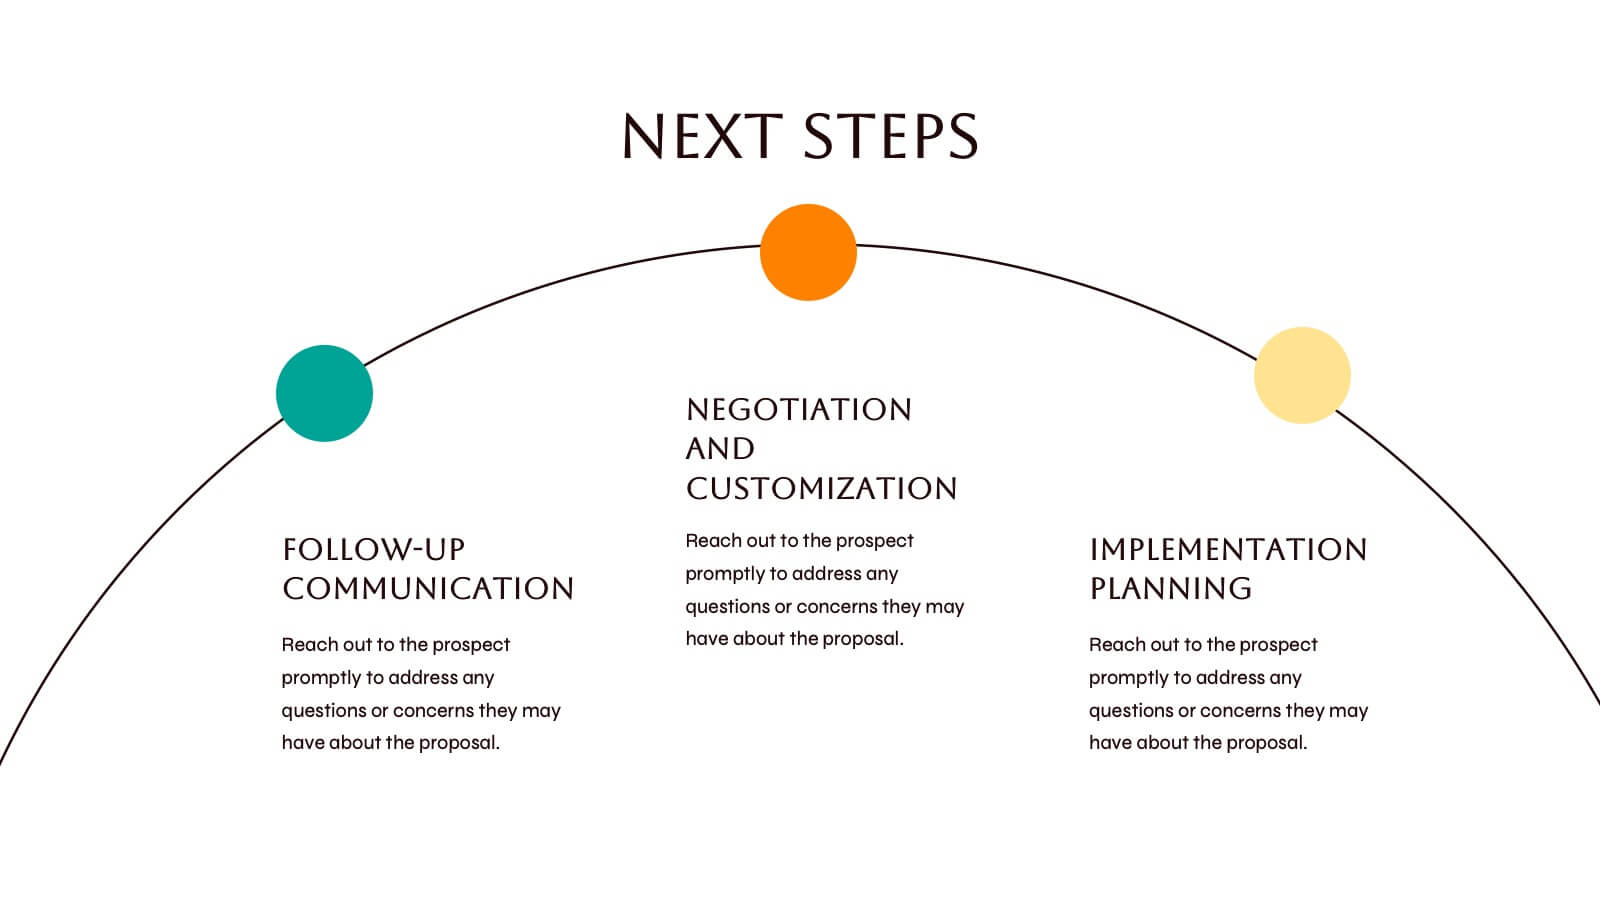
Ionforge Startup Pitch Deck Presentation
Impress investors and showcase your startup's potential with this structured pitch deck! It covers key areas like market analysis, business model, value proposition, and financial overview, ensuring a complete story of your growth plan. Perfect for startup presentations and funding pitches, this template is fully compatible with PowerPoint, Keynote, and Google Slides.


8 diapositivas
Airline Business Strategy Presentation
Leverage key insights into the aviation sector with the "Aviation Industry Market Analysis" presentation template. This design allows professionals in the aviation industry to effectively communicate market trends and forecasts. Its compatibility with PowerPoint, Keynote, and Google Slides ensures a versatile use across different platforms, making it ideal for industry analyses, investor meetings, or internal strategy discussions.


6 diapositivas
Sports Equipment Infographics
The "Sports Equipment" infographic template is a dynamic and engaging tool, perfectly crafted for PowerPoint, Keynote, and Google Slides. This template is an excellent choice for sports retailers, equipment manufacturers, and fitness enthusiasts who wish to showcase a range of sports gear and its features. The template vividly displays various types of sports equipment, detailing their use, benefits, and technical specifications. It's designed to highlight product features, usage tips, and maintenance advice, making it highly useful for product demonstrations, sales presentations, and customer education. With a vibrant and energetic design, the color scheme of the template is tailored to capture the spirit of sports and fitness. This not only makes the presentation visually striking but also aligns with the themes of activity, energy, and health. Whether used in a retail setting, a trade show, or a fitness workshop, this template ensures that the diverse range of sports equipment is presented in a visually appealing, organized, and informative manner.


5 diapositivas
Employee and Team Performance Analysis Presentation
Visualize individual and team contributions with this clear and structured performance analysis template. Showcase key metrics, employee growth, and team achievements using easy-to-read layouts and progress indicators. Ideal for HR reports, performance reviews, and team evaluations. Fully editable in PowerPoint, Keynote, and Google Slides.
5 diapositivas
Feedback Rating Smile Icons Presentation
Light up your presentation with a playful visual that turns audience feedback into clear, colorful insights. This slide helps you compare ratings, highlight sentiment patterns, and present review data in a friendly, memorable way. Perfect for surveys, reports, and performance reviews. Fully compatible with PowerPoint, Keynote, and Google Slides.


6 diapositivas
Governance Tools Infographics
Enhance your understanding of Governance Tools with our customizable infographic template. This template is fully compatible with popular presentation software like PowerPoint, Keynote, and Google Slides, allowing you to easily customize it to illustrate and communicate various governance tools and practices. The Governance Tools infographic template offers a visually engaging platform to explore and explain the tools, frameworks, and strategies used to facilitate effective governance within organizations. Whether you're a governance professional, business leader, or interested in corporate governance, this template provides a user-friendly canvas to create informative presentations and educational materials. Deepen your knowledge of Governance Tools with this SEO-optimized infographic template, thoughtfully designed for clarity and ease of use. Customize it to showcase governance frameworks, compliance mechanisms, risk management tools, and best practices, ensuring that your audience gains valuable insights into this critical field. Start crafting your personalized infographic today to delve into the world of Governance Tools.


5 diapositivas
Market Segmentation by Demographics Presentation
The "Market Segmentation by Demographics" presentation template showcases a circular infographic that effectively visualizes market segments as distinct demographic groups. Each colored section of the circle corresponds to a different demographic characteristic, such as age, income, or location, and is accompanied by key insights or data points in adjacent text placeholders. This format allows for an intuitive comparison of how each segment contributes to the market, facilitating a clear understanding of the audience composition. This visual arrangement is especially useful for presentations that need to highlight demographic data succinctly to support market analysis or strategic marketing decisions.


5 diapositivas
Workflow Management Diagram Presentation
Simplify your process visuals with a clean, modern layout designed to clarify every step. This presentation helps you map workflows, define responsibilities, and streamline communication across teams. Perfect for project planning and operations, it’s fully compatible with PowerPoint, Keynote, and Google Slides for effortless customization and professional presentation delivery.


5 diapositivas
Brainstorming Session Diagram Presentation
Spark creativity and structure your next idea session with the Brainstorming Session Diagram Presentation. Featuring a central brain icon and four labeled input areas, this layout makes it easy to visualize and organize group contributions. Fully editable in PowerPoint, Canva, and Google Slides for seamless collaboration and customization.


5 diapositivas
Strategic Matrix Grid Analysis Presentation
Clarify your strategic insights with the Strategic Matrix Grid Analysis Presentation. This layout uses a 2x2 quadrant design to showcase four key categories or scenarios—ideal for SWOT, risk vs. reward, product positioning, or capability mapping. Clean labels, icons, and text areas help break down each quadrant’s significance. Fully editable in PowerPoint, Google Slides, Keynote, and Canva.


4 diapositivas
Startup Business Plan Executive Overview Presentation
Present your startup vision with this bold, rocket-themed executive overview template. Perfect for outlining growth strategies, milestones, and launch plans, it combines vibrant visuals with a clean layout. Fully editable in Canva, PowerPoint, and Google Slides, it’s ideal for inspiring investors and stakeholders with a clear, professional business roadmap.


7 diapositivas
Europe Map Infographic Presentation Template
Europe is a continent located in the northern part of the globe and surrounded by water on three sides. It is bordered by the Atlantic Ocean to the west, the Arctic Ocean to the north, and the Mediterranean Sea to the south. Europe is divided into roughly forty four countries and dependent territories, each one with its own unique identity, cuisine and culture. This European map template is a vector map of an outline of Europe, with color-coded and labeled countries and a legend. This map template can be used for presentations, reports and blogs about tourism it's a simple and clean style map.


6 diapositivas
Relationship Compatibility Infographic
Relationship compatibility refers to the degree to which two individuals are well-suited for each other in a relationship. This infographic can be a fun and informative way to explore the compatibility between individuals in a relationship. This template is designed to help individuals gain a better understanding of their relationships and make informed decisions about their interactions with others. Compatible with Powerpoint, Keynote, and Google Slides. The combination of visual elements and informative content can make this topic engaging and accessible. Making it easy for readers to navigate and understand the content.


5 diapositivas
Eco-Friendly Practices Implementation Presentation
Brighten your message with a clean, circular design that maps out every green initiative step-by-step. This visual template illustrates key eco-conscious actions, helping you present sustainable practices with ease. Perfect for environmental reports, team strategies, or policy pitches. Fully compatible with PowerPoint, Keynote, and Google Slides for flexible editing.


4 diapositivas
Cyber Security Measures Overview Presentation
Protect your digital world with this bold and professional template designed to visualize data protection, network security, and online safety strategies. Perfect for IT teams, tech presentations, or training materials. Fully customizable and compatible with PowerPoint, Keynote, and Google Slides for a seamless and secure presentation experience.