


Características


¿Tienes alguna pregunta?
Recomendar


7 diapositivas
Brain Structure Infographic
Unlock the marvels of the human mind with our brain structure infographic. Resting on a pristine white canvas and enriched by the calming green, profound blue, and enlightening yellow, this template meticulously dissects the intricacies of brain anatomy. Adorned with detailed infographics, illustrative icons, and specific image placeholders, it dives deep into the regions and functions of the brain. Impeccably tailored for Powerpoint, Keynote, or Google Slides. An indispensable resource for neuroscientists, educators, medical students, or anyone with an intrigue for cerebral wonders. Venture with insight; let each slide be your guide through the labyrinth of the human brain.


20 diapositivas
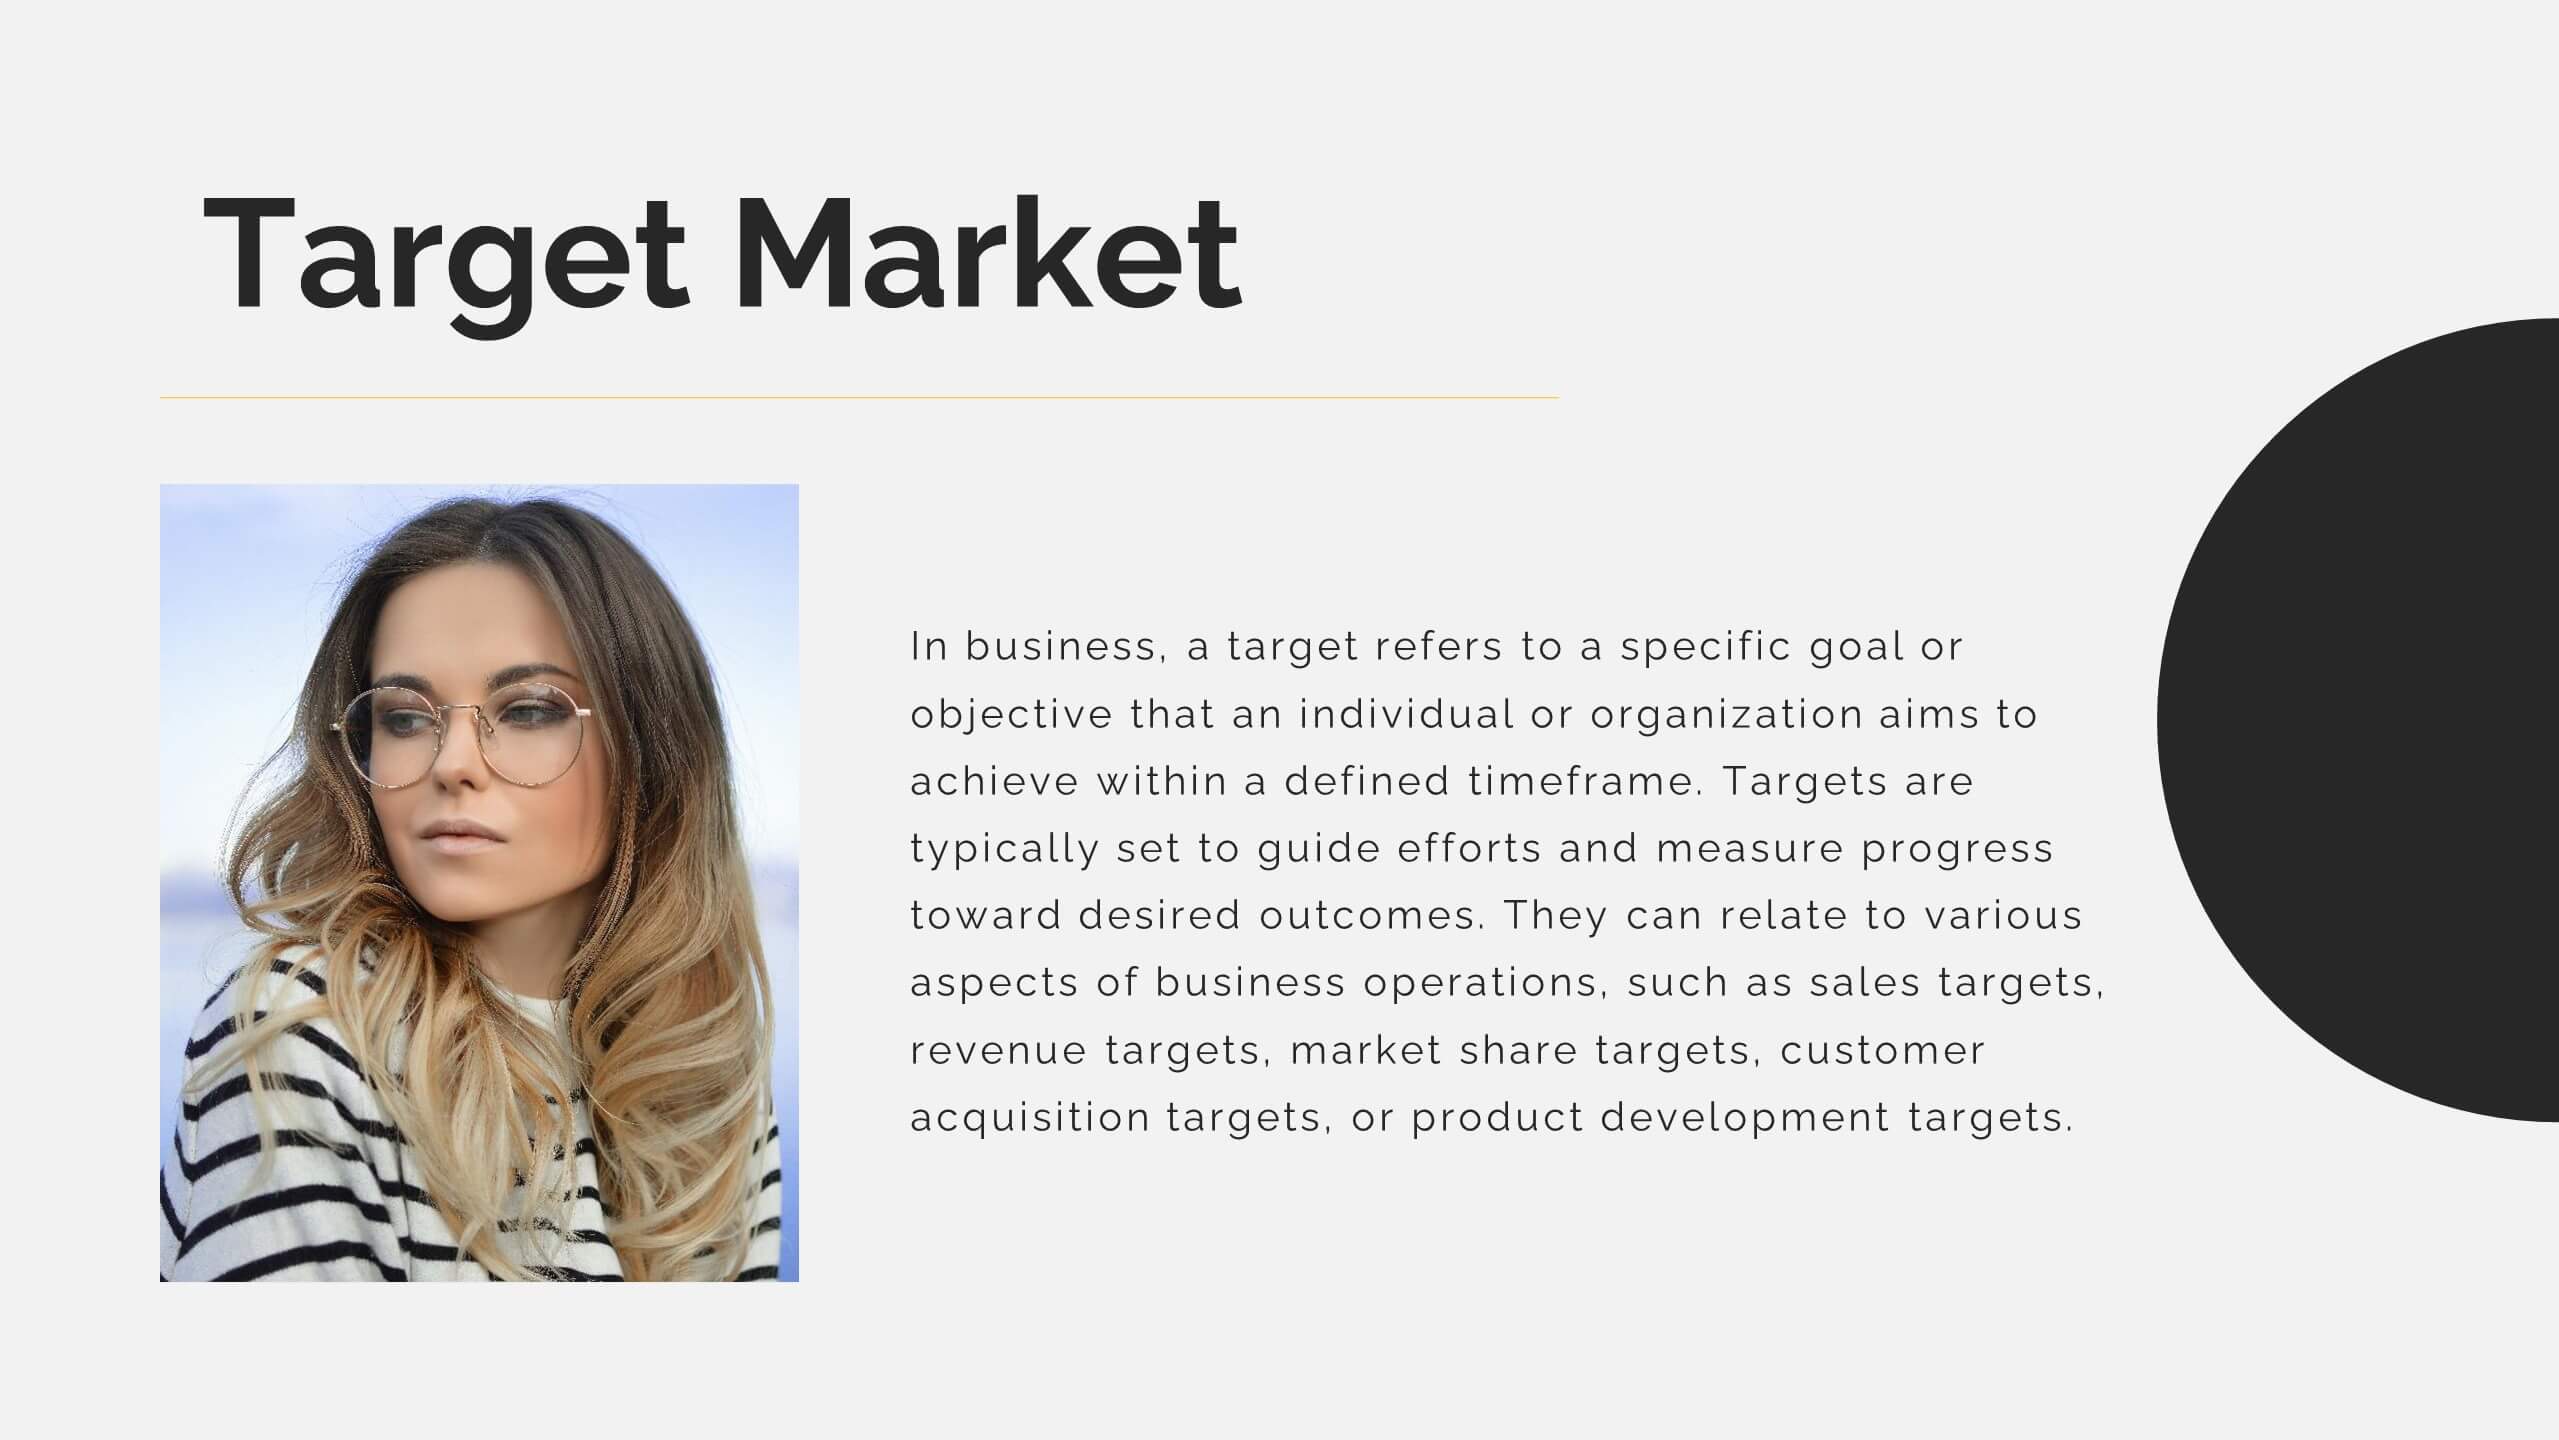
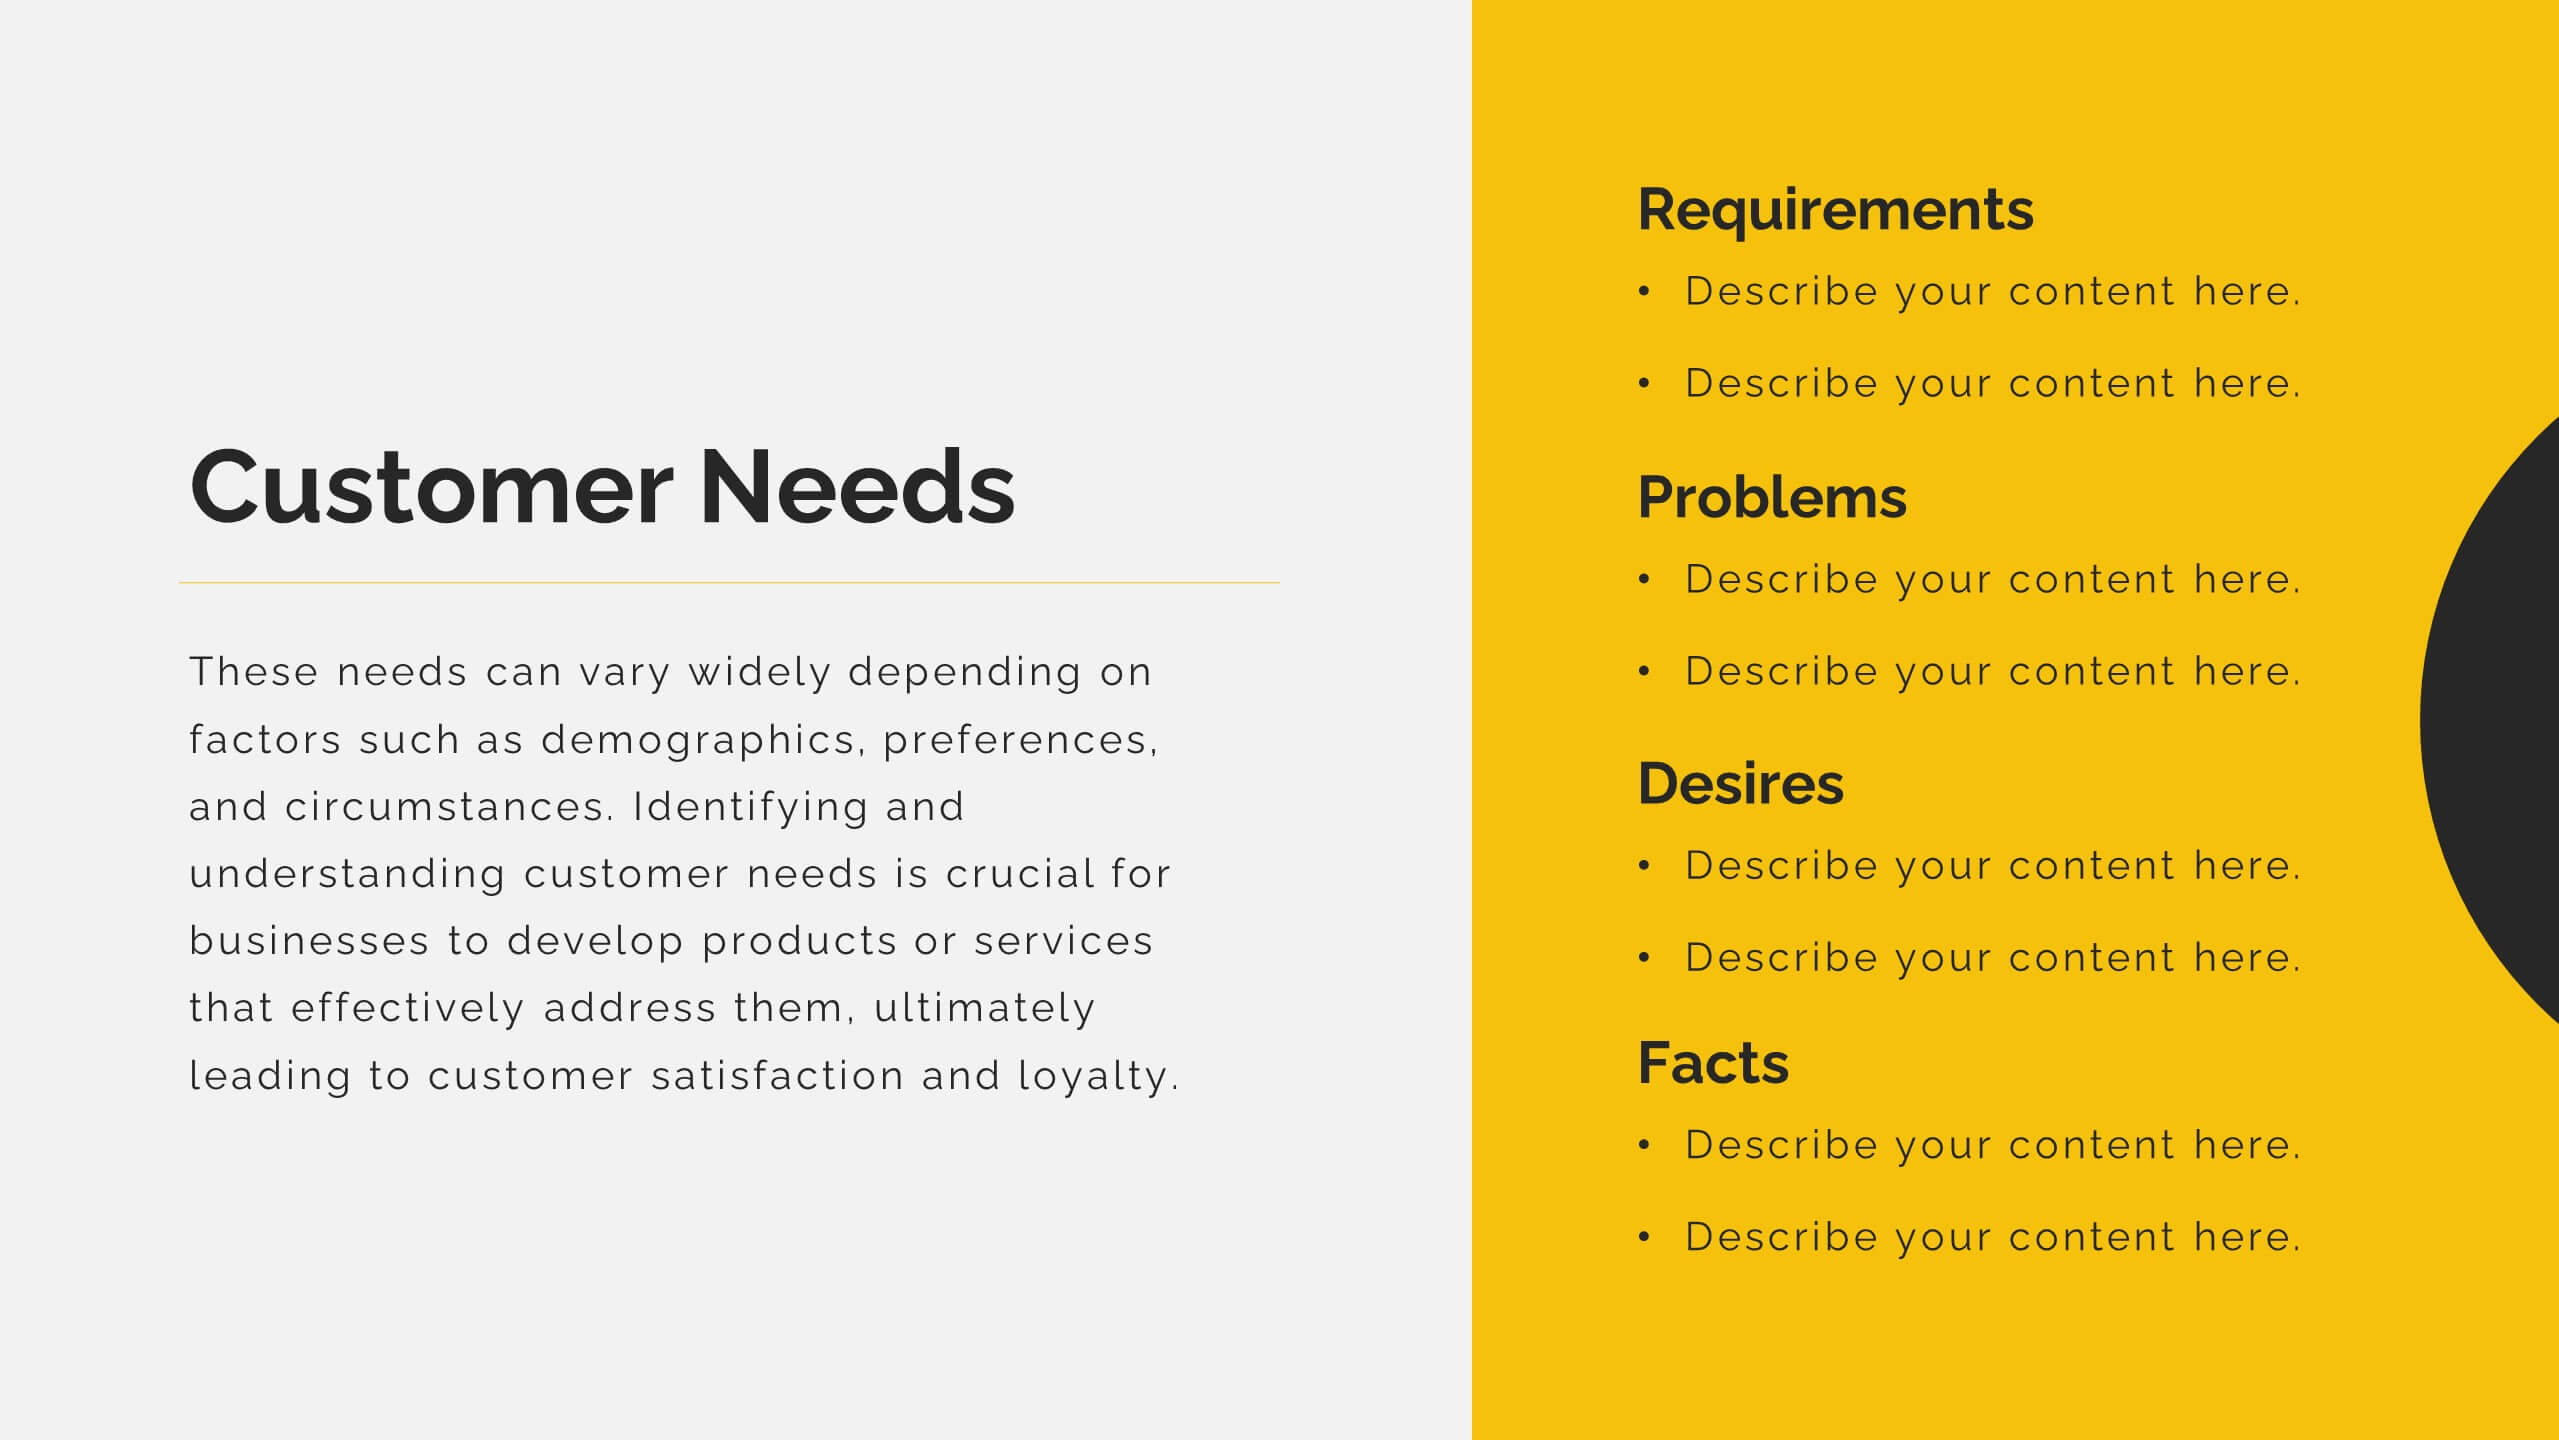
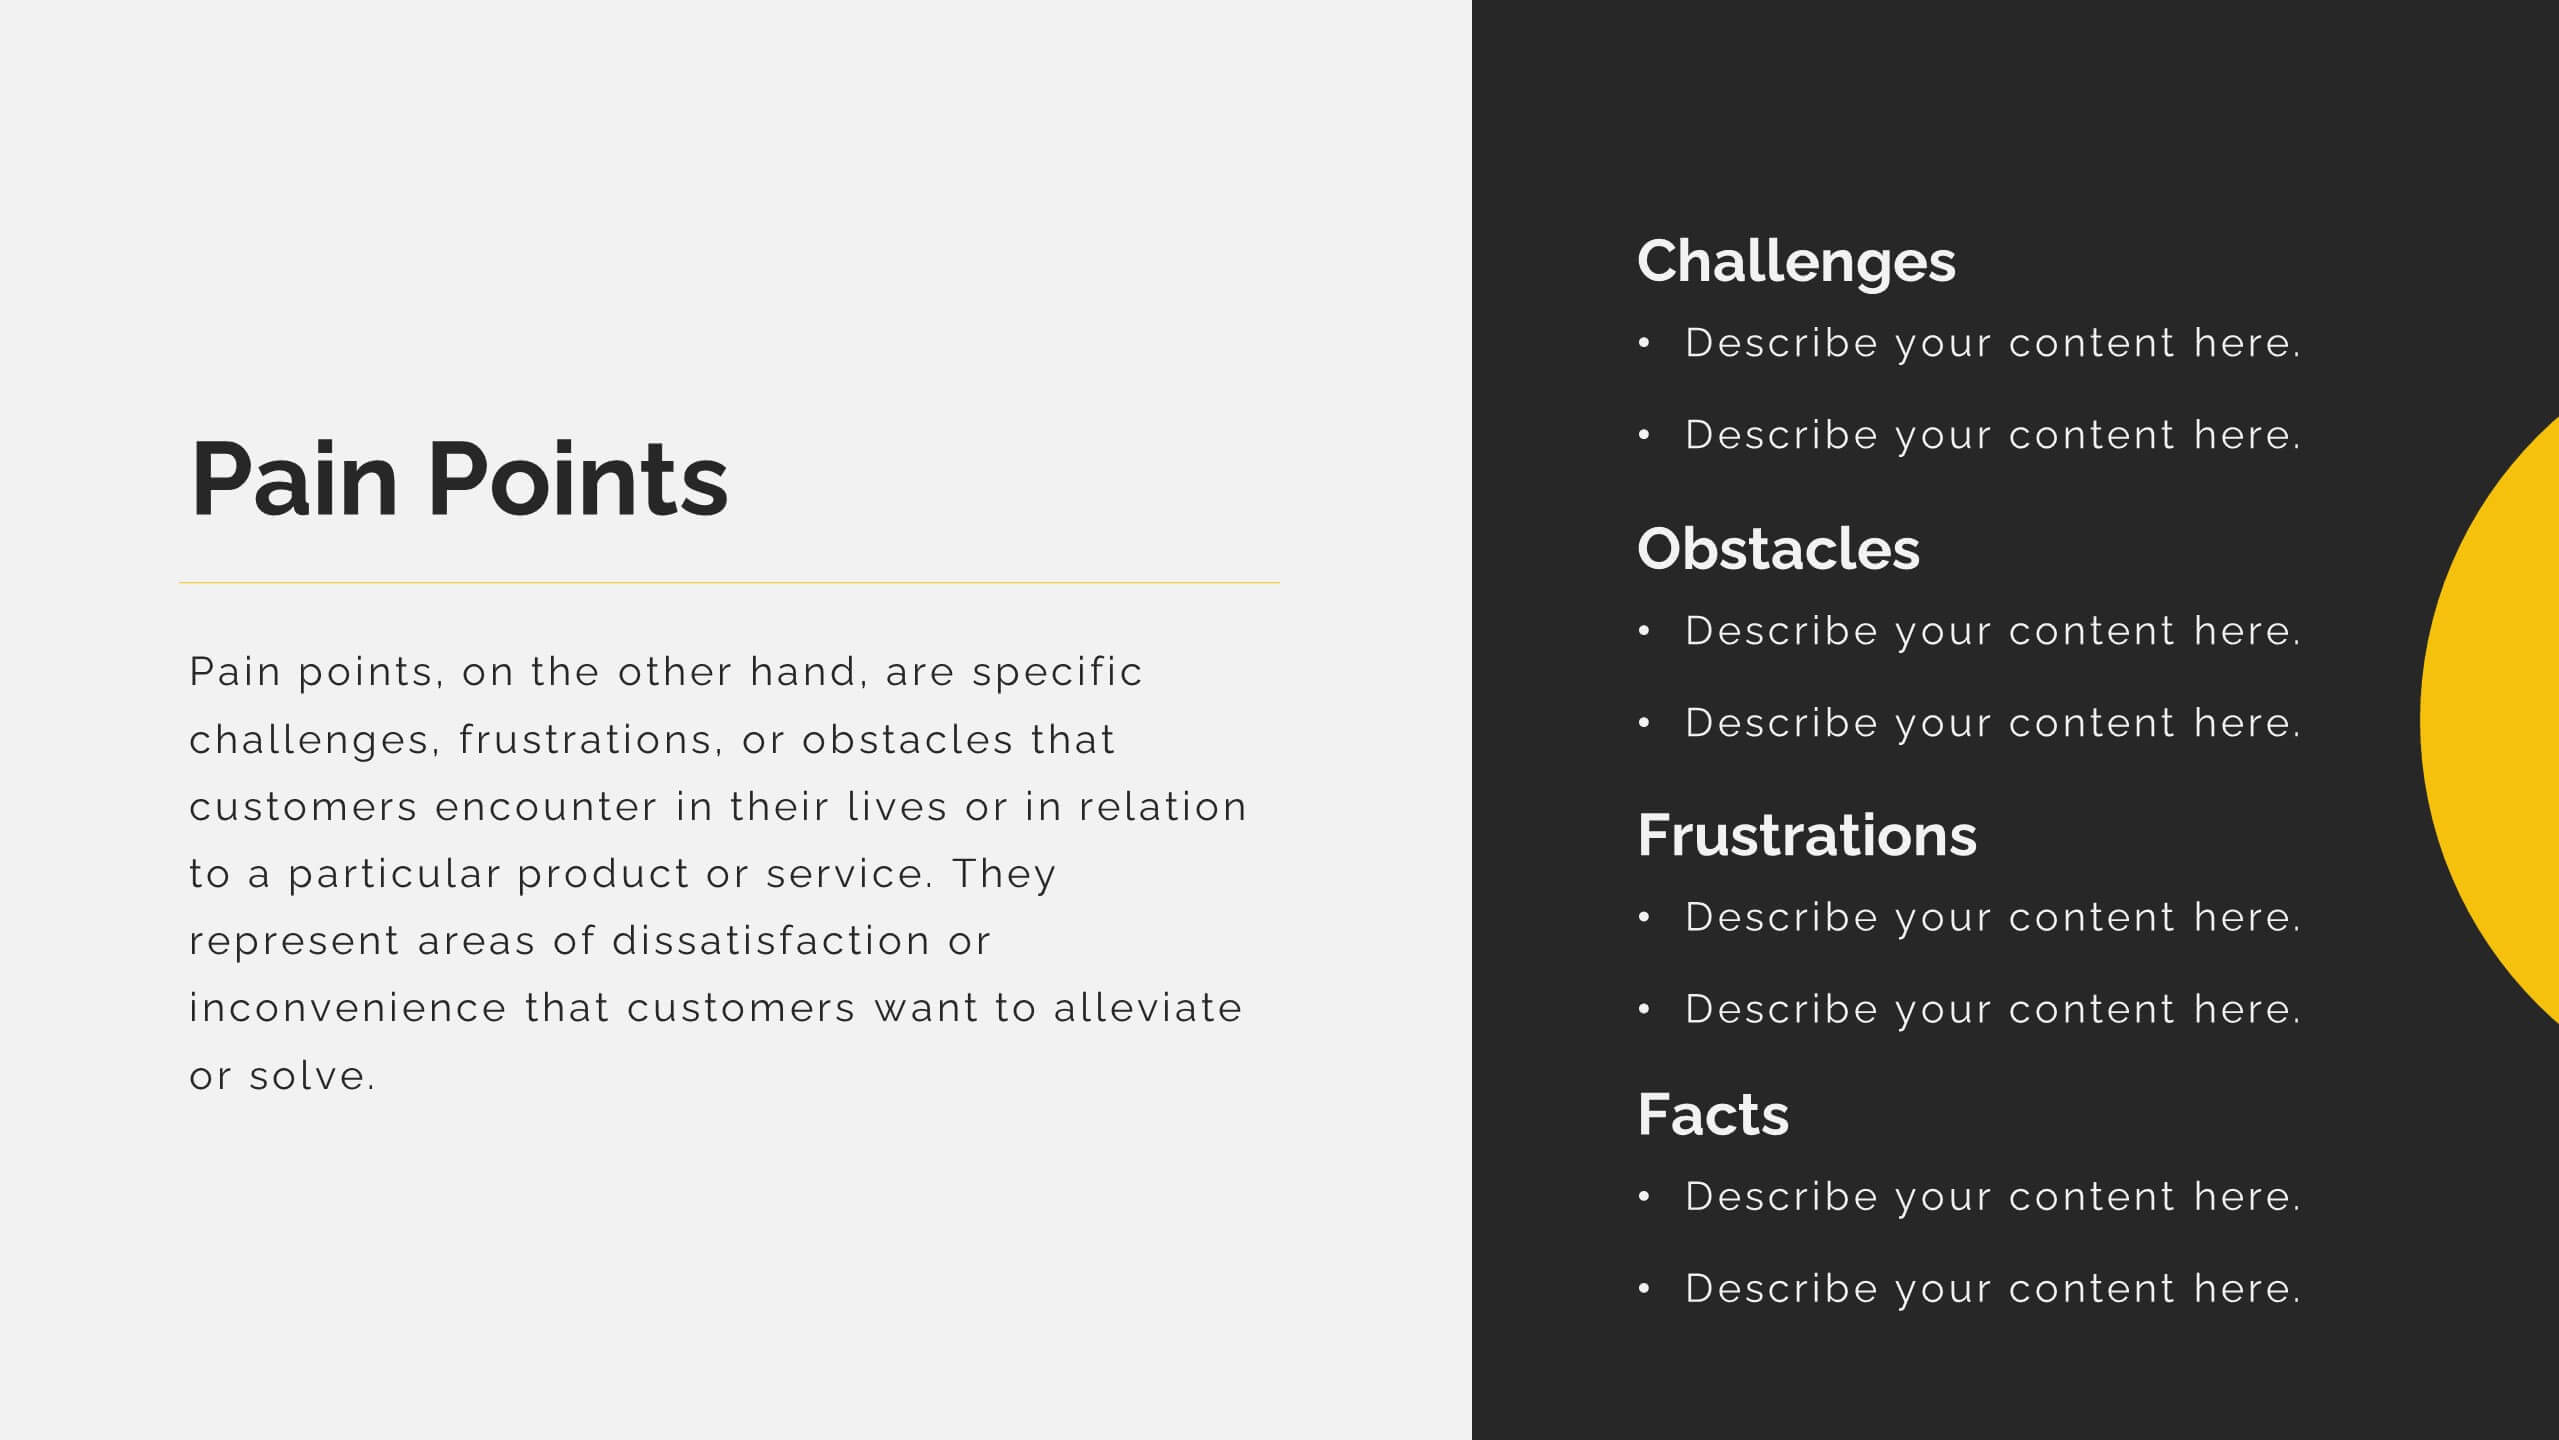
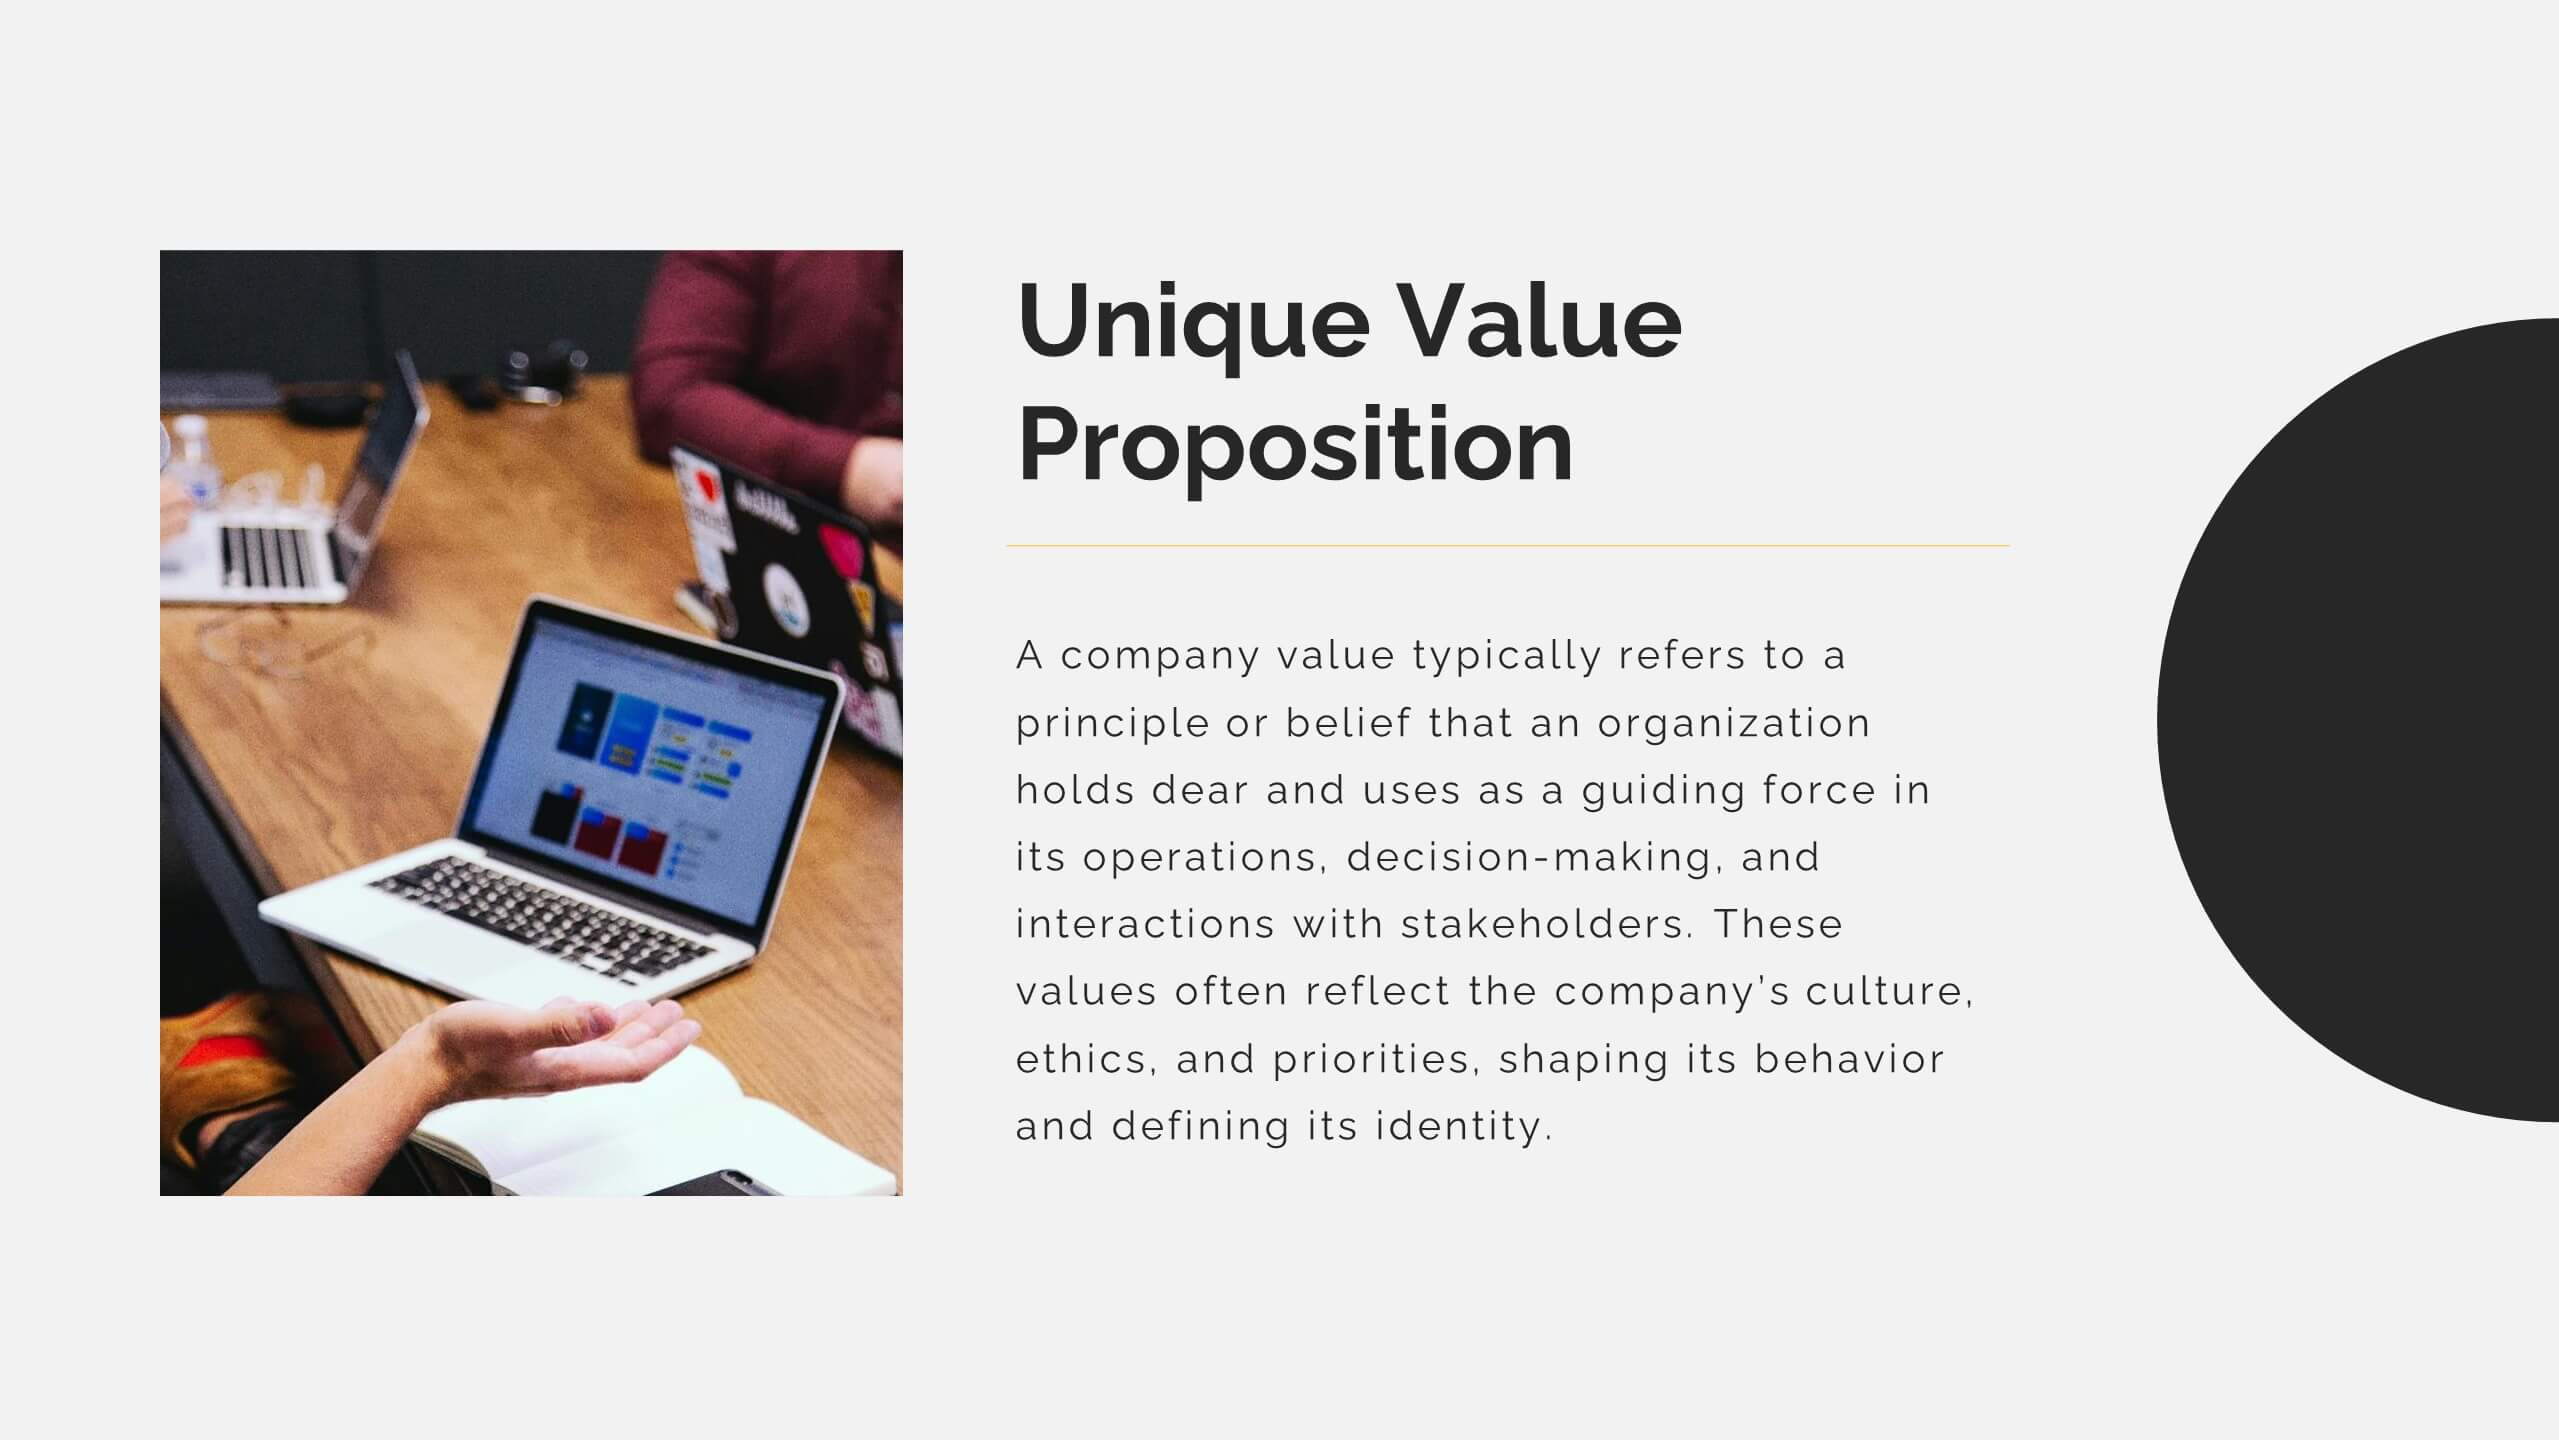
Solstice Product Launch Presentation
Introducing our product launch template! Highlight your product’s features, target audience, and unique selling proposition with a sleek, modern design. Showcase marketing strategies, distribution channels, and competitive landscape effortlessly. Ideal for sales teams and marketers. Compatible with PowerPoint, Keynote, and Google Slides.


5 diapositivas
Digital Marketing Strategy Infographics
A digital marketing strategy refers to a plan of action that businesses or organizations develop to achieve their marketing goals using digital channels and technologies. These vertical infographics outline the key elements of a successful digital marketing strategy. They are designed for marketers, business owners, and individuals seeking to understand and implement effective digital marketing practices. Guide your audience through the process of defining specific objectives, such as increasing website traffic, improving lead generation, or enhancing brand awareness. These can cover strategies and leverage social media analytics.


4 diapositivas
Logistics Chain and Delivery Map Presentation
Navigate global supply chains with ease using this dynamic shipping and delivery slide. Designed around a cargo ship visual, this infographic helps teams outline each stage of their logistics journey—from origin to destination. Ideal for supply chain updates, shipping plans, or logistics strategy meetings. Fully compatible with PowerPoint, Keynote, and Google Slides.


6 diapositivas
Capability Gap Analysis Infographic
Gap analysis is a strategic management tool used to compare an organization's current performance or situation with its desired or target state. This infographic template is a visual representation of the process of conducting a capability gap analysis, which is a strategic assessment used to identify the gaps between their current capabilities and the capabilities required to achieve their goals or meet specific objectives. The infographic aims to provide a clear and concise overview of the capability gap analysis process and its key components. Compatible with Powerpoint, Keynote, and Google Slides.


24 diapositivas
Veritas UX Research Report Presentation
This UX research report template is designed for clarity and modern style, using a sleek color palette and structured layouts to showcase insights. It includes sections for project overview, user research, personas, wireframes, prototyping, and user testing results. Compatible with PowerPoint, Keynote, and Google Slides, it’s ideal for presenting findings effectively.


4 diapositivas
AIDA Marketing Model Presentation
Optimize your marketing strategy with this AIDA Marketing Model Presentation template. Featuring a visually appealing funnel diagram, this template clearly outlines the Attention, Interest, Desire, and Action stages of customer engagement. Ideal for marketers, sales professionals, and business analysts. Fully customizable and compatible with PowerPoint, Keynote, and Google Slides.


5 diapositivas
Tiered Strategy Framework Pyramid Presentation
Break down your plan into clear, actionable steps with this Tiered Strategy Framework Pyramid presentation. Each arrow-shaped tier helps visualize hierarchical strategies, workflows, or growth levels. Use this layout to communicate priorities, initiatives, or milestones in a sleek and modern format. Fully editable in Canva, PowerPoint, or Google Slides.


23 diapositivas
Volt Business Plan Presentation
The Business Plan Presentation Template offers 23 refined slides to convey goals, strategies, achievements, and action plans. Perfect for team updates, resource allocation, and collaboration opportunities. Designed for PowerPoint, Keynote, and Google Slides, its warm, professional layout ensures clarity while fostering effective communication for corporate or project presentations. Fully customizable.


22 diapositivas
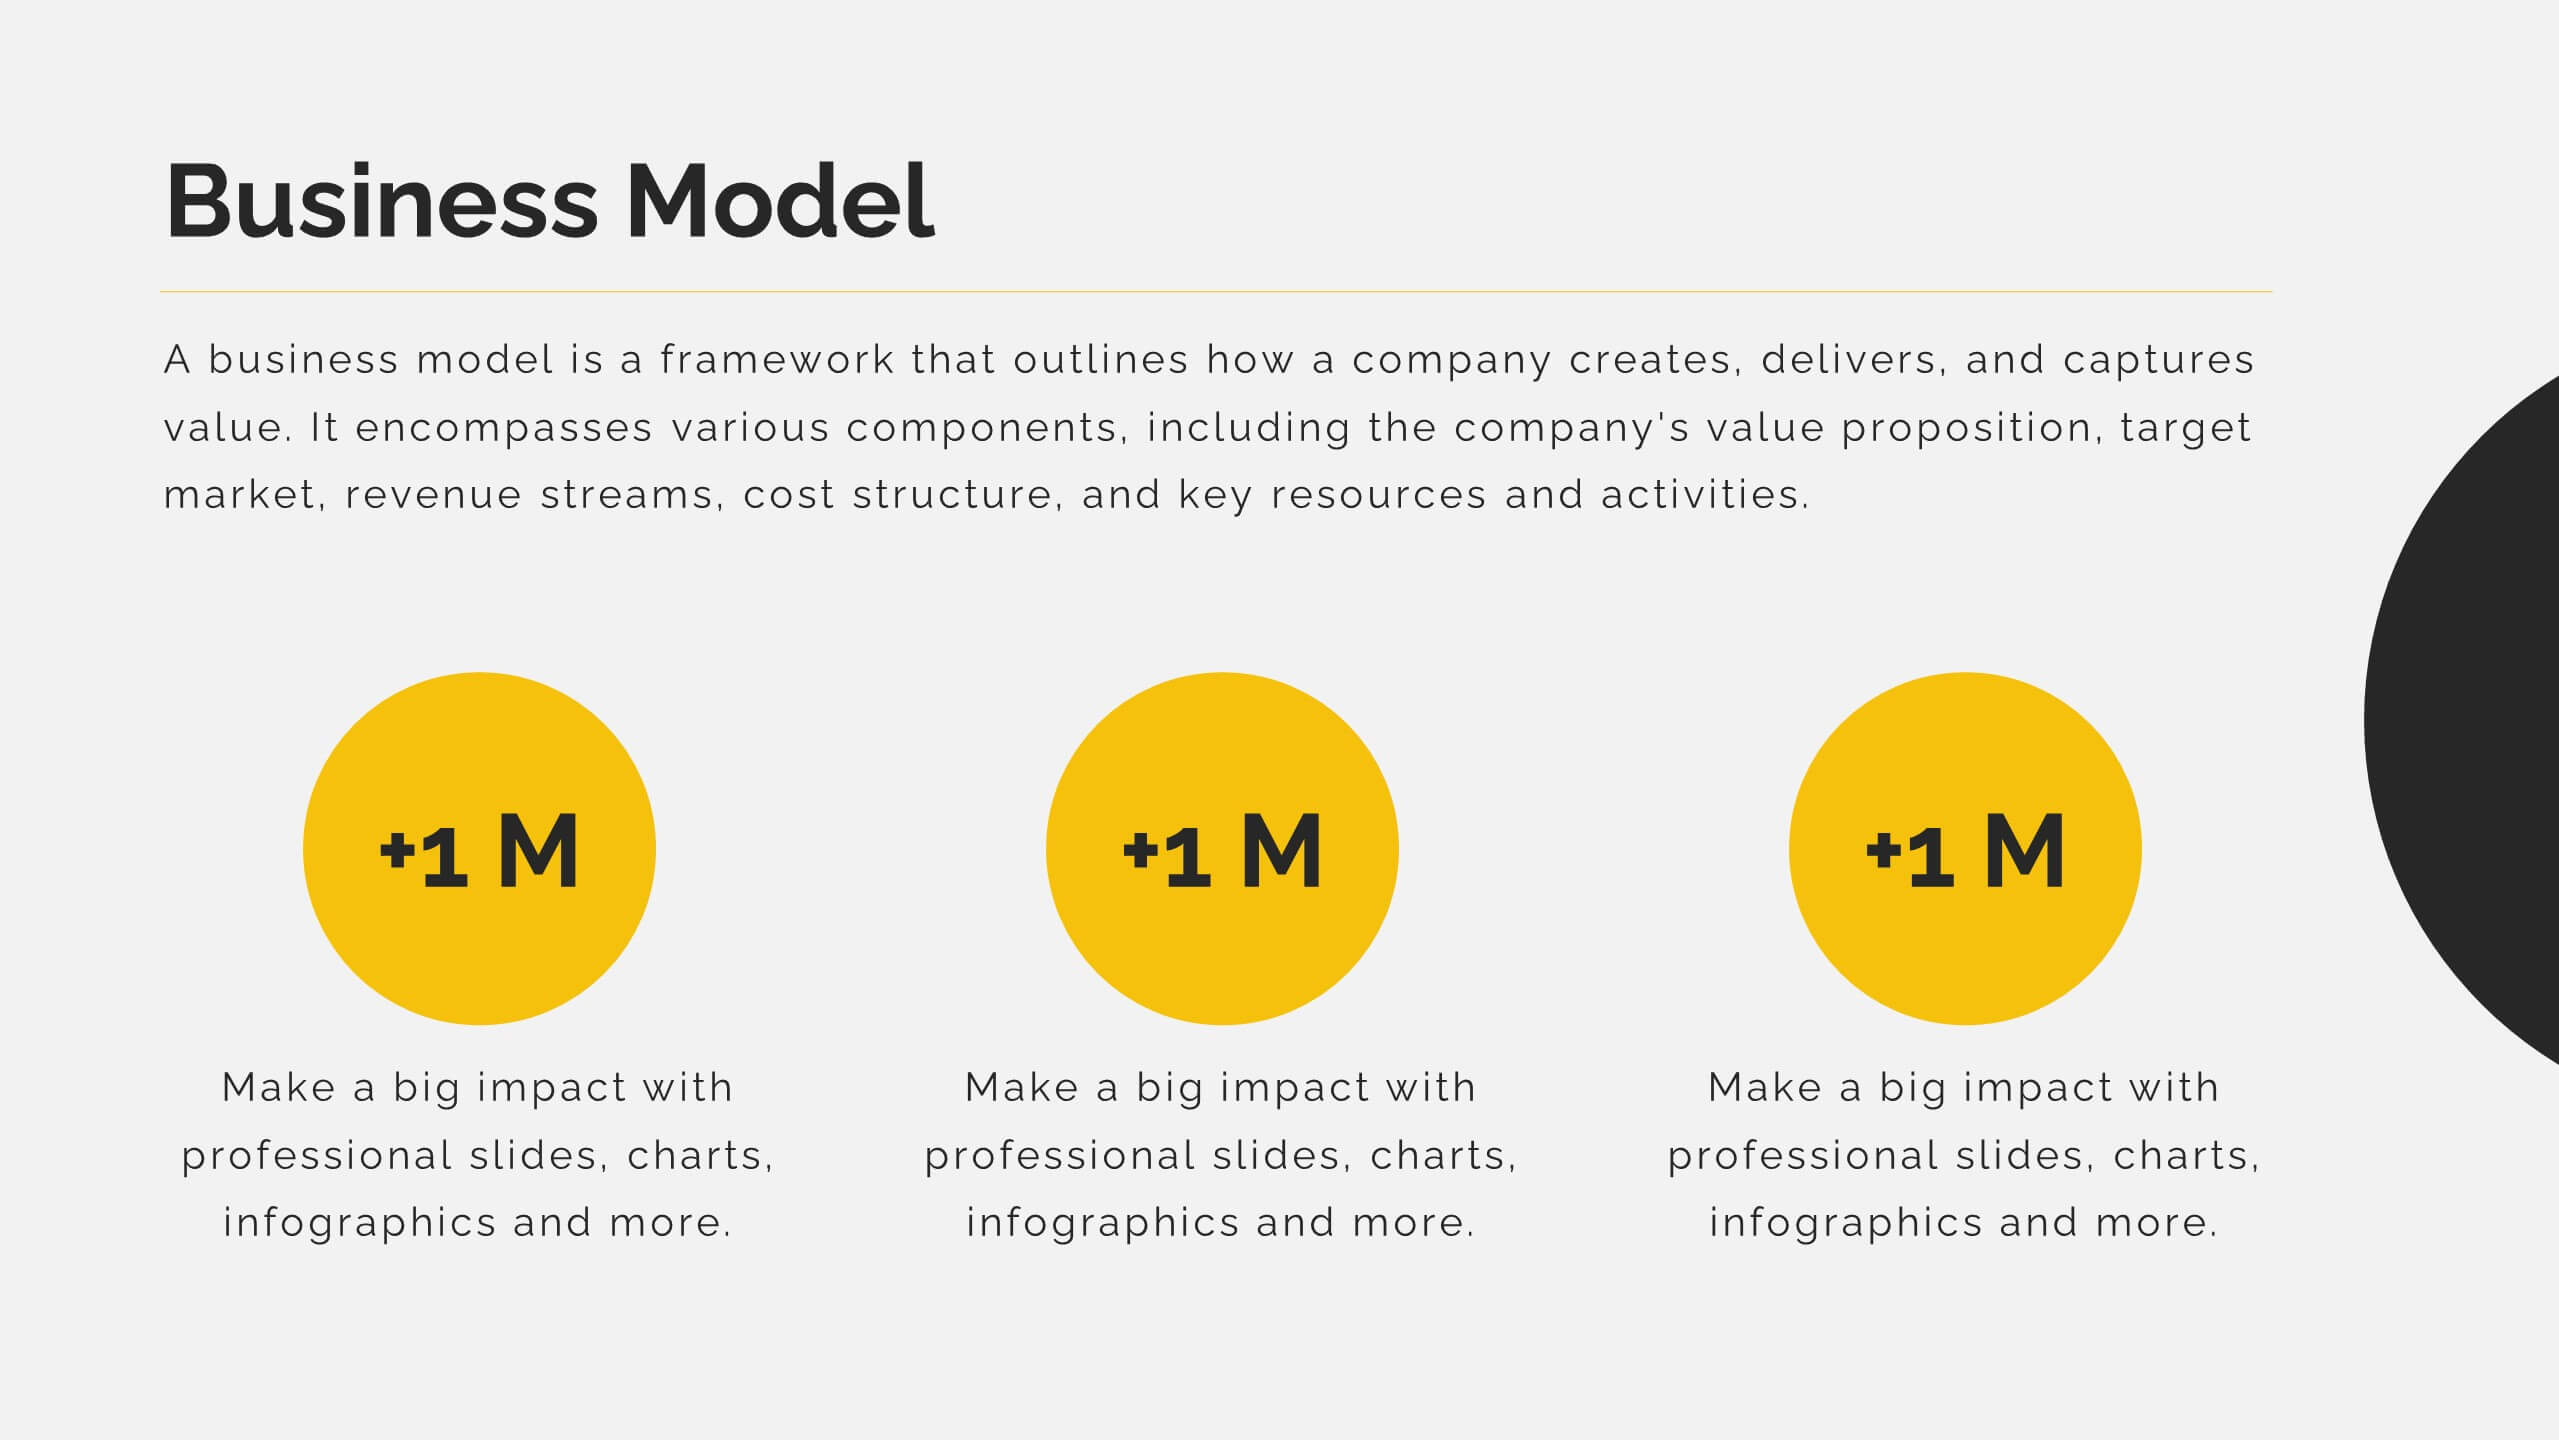
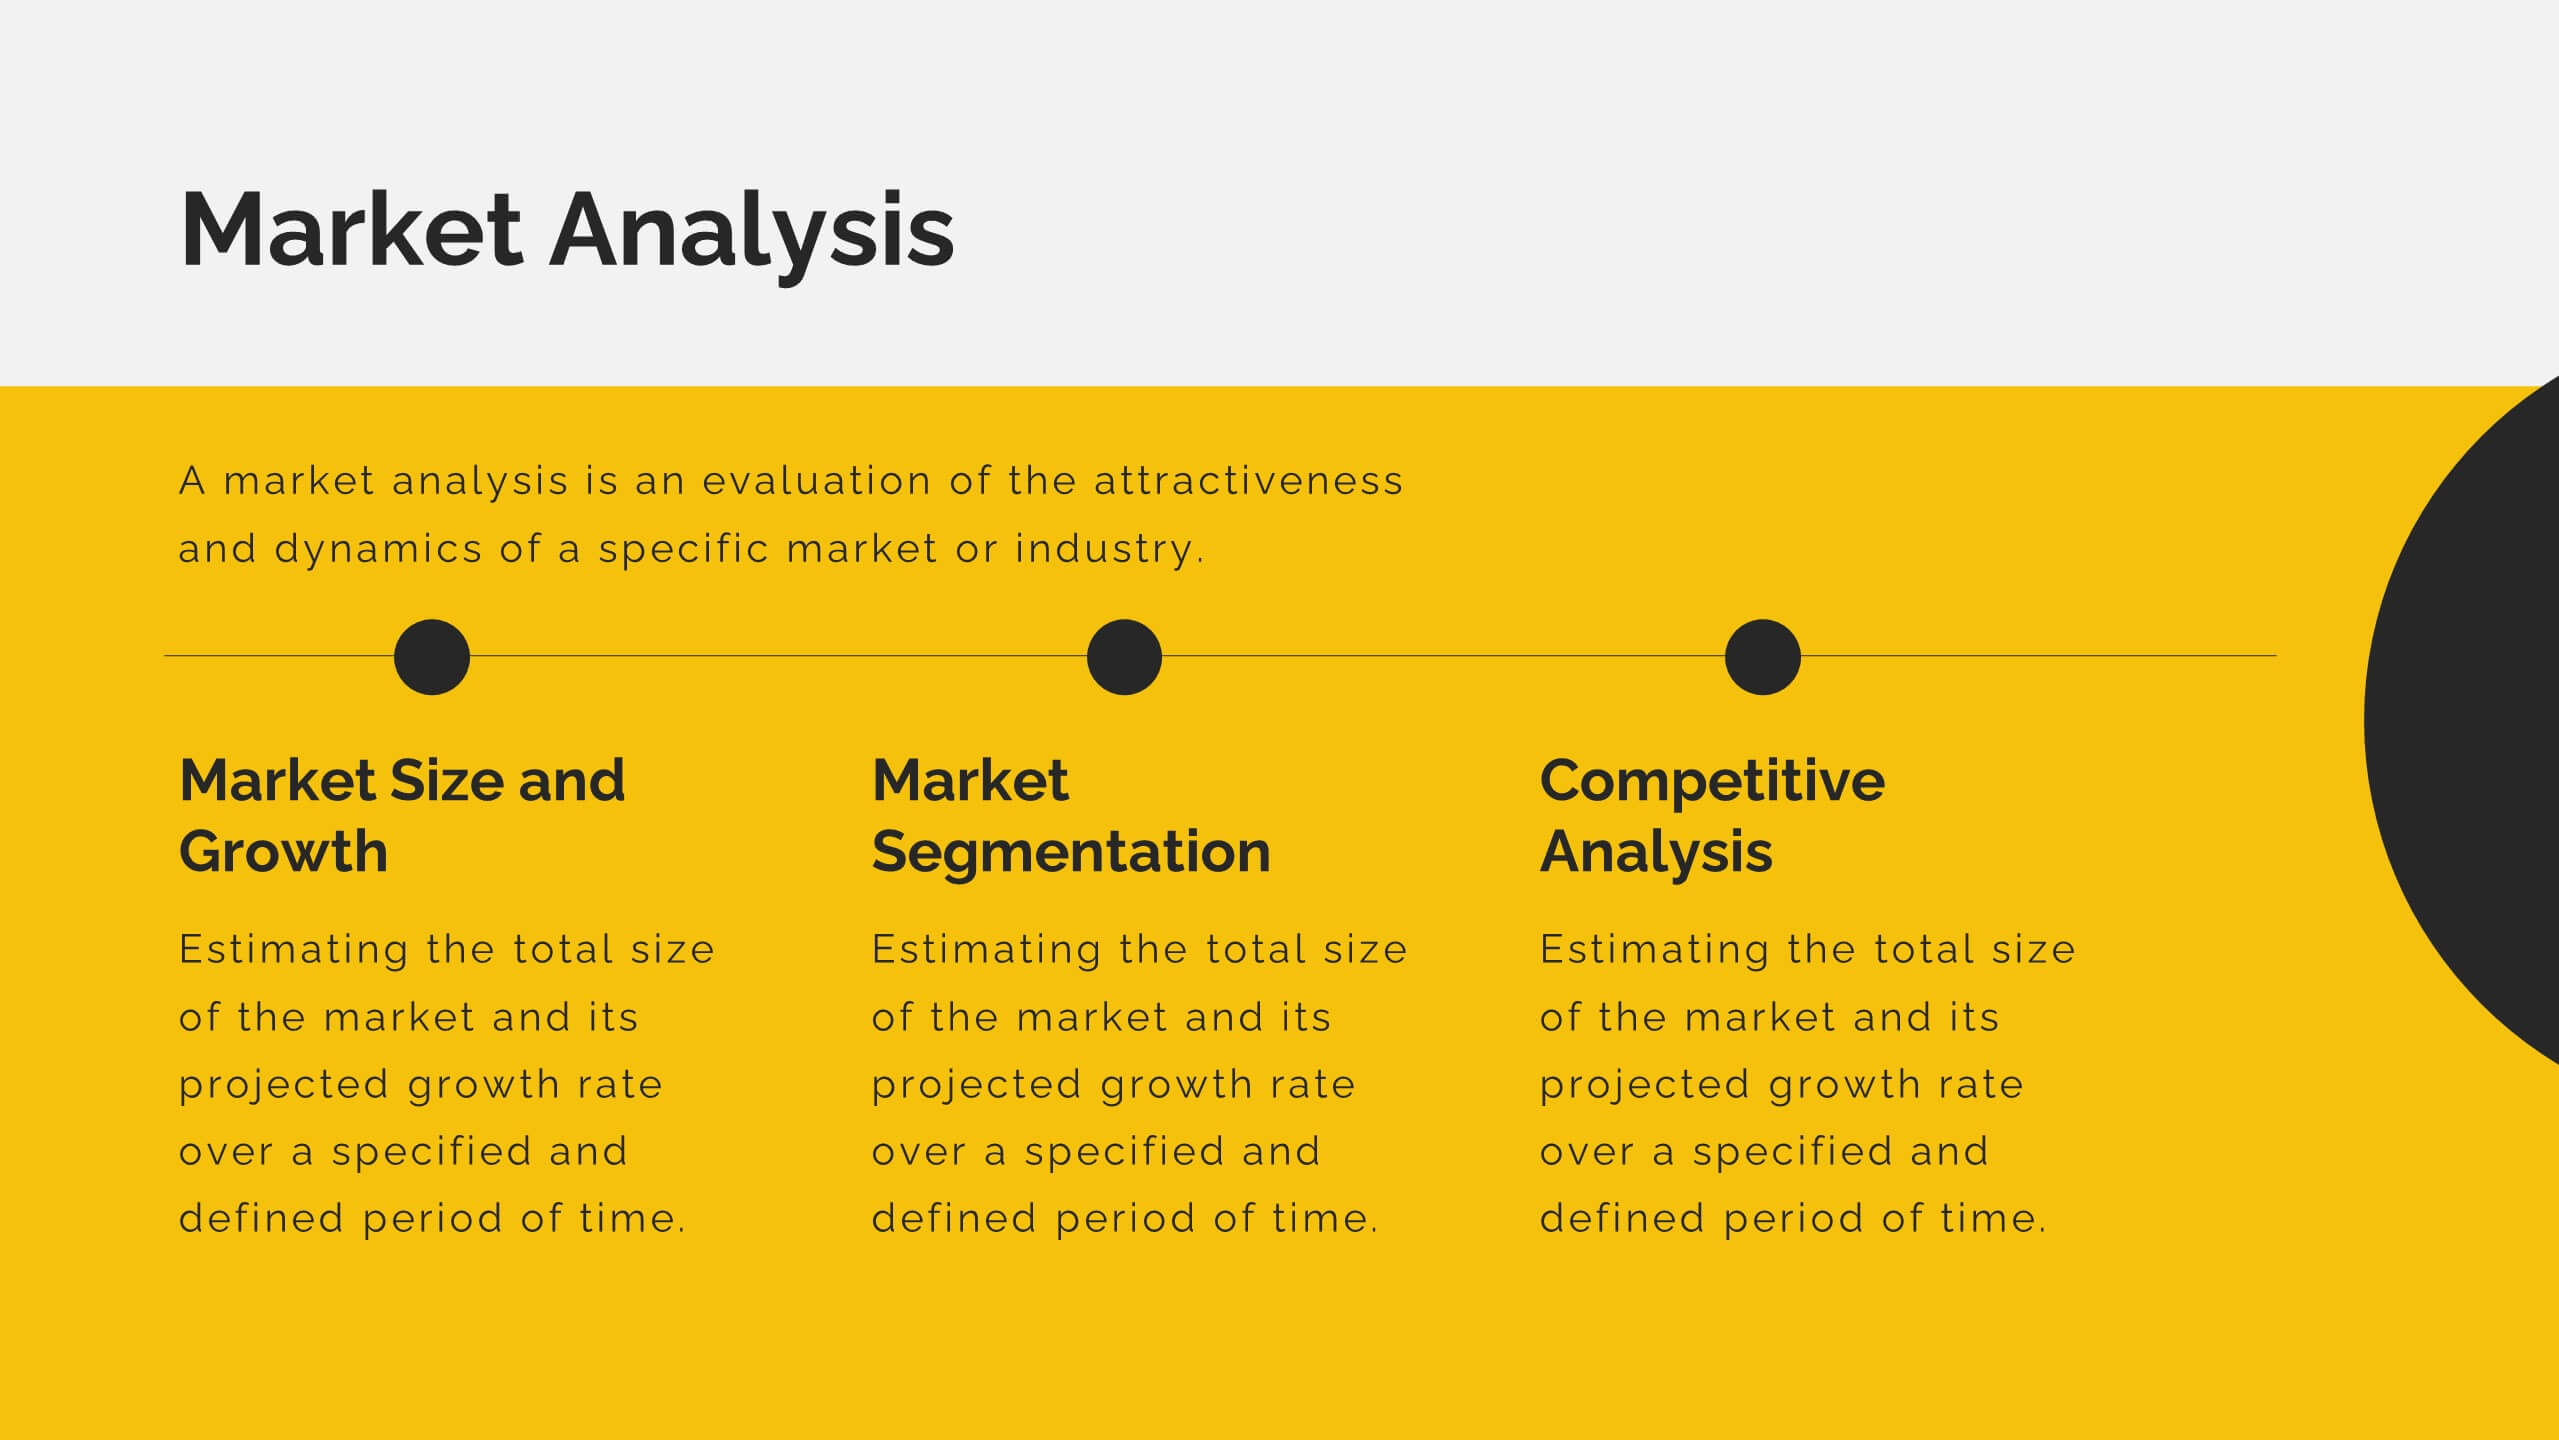
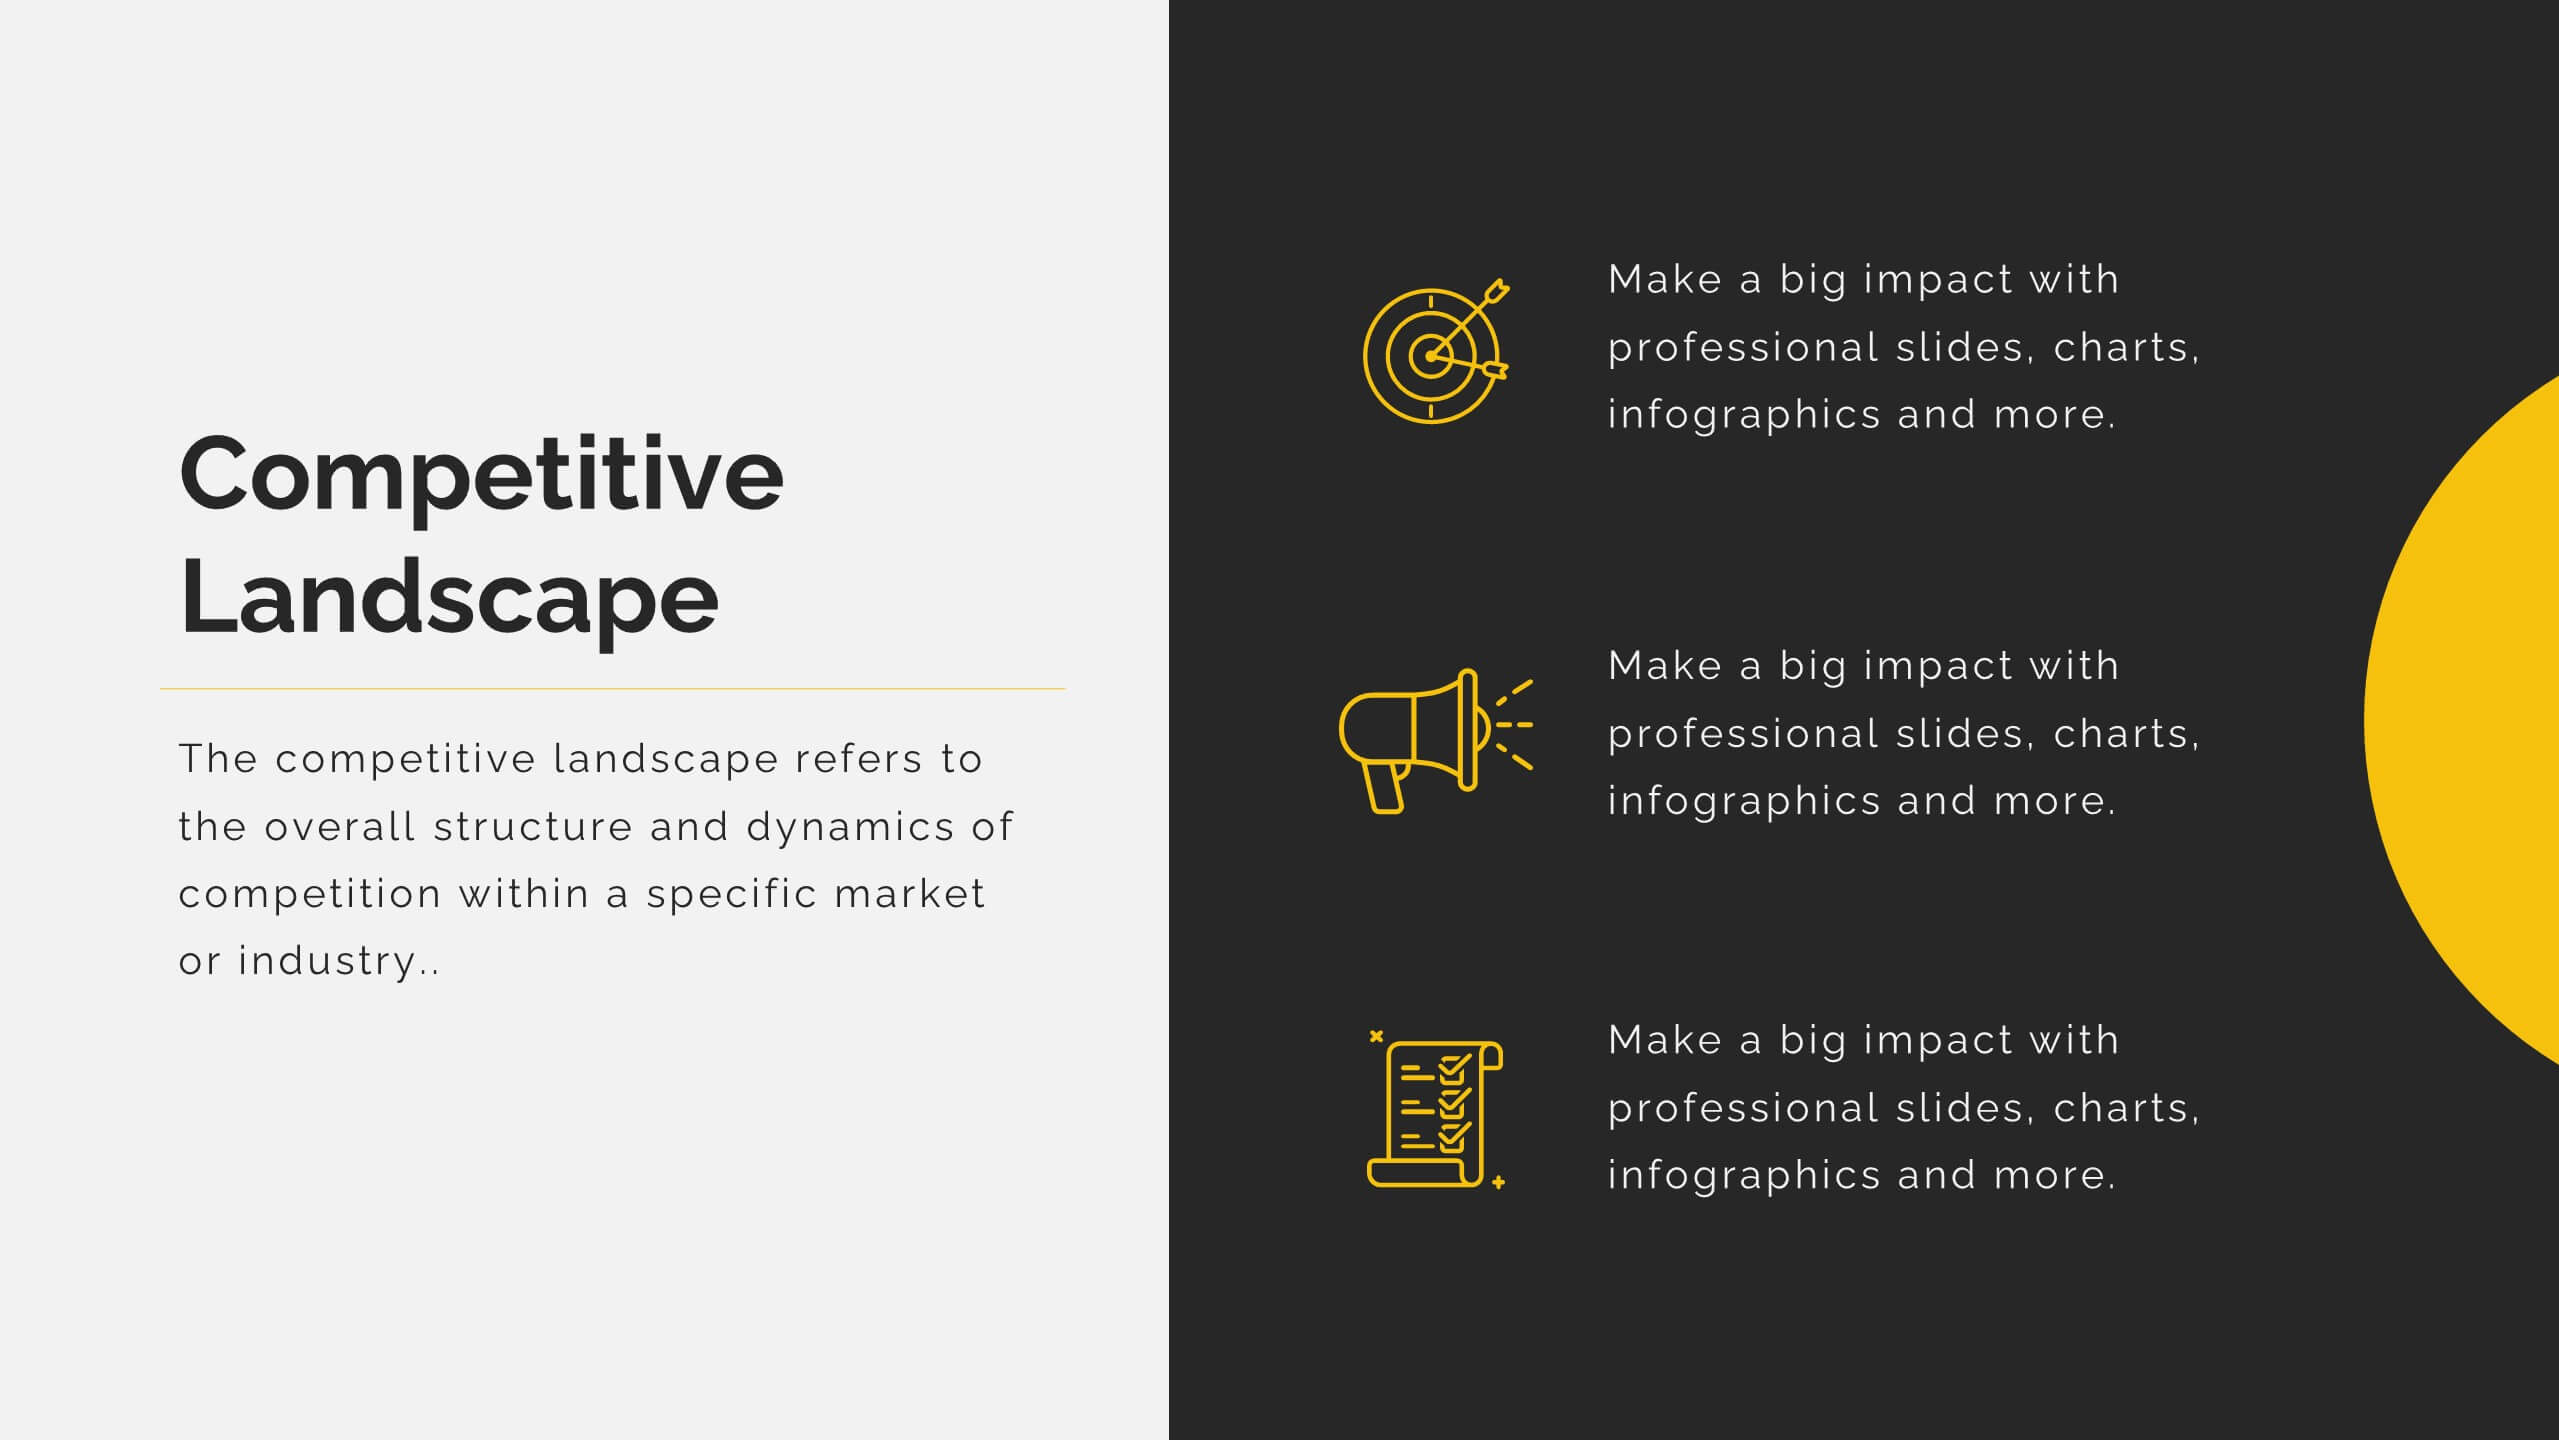
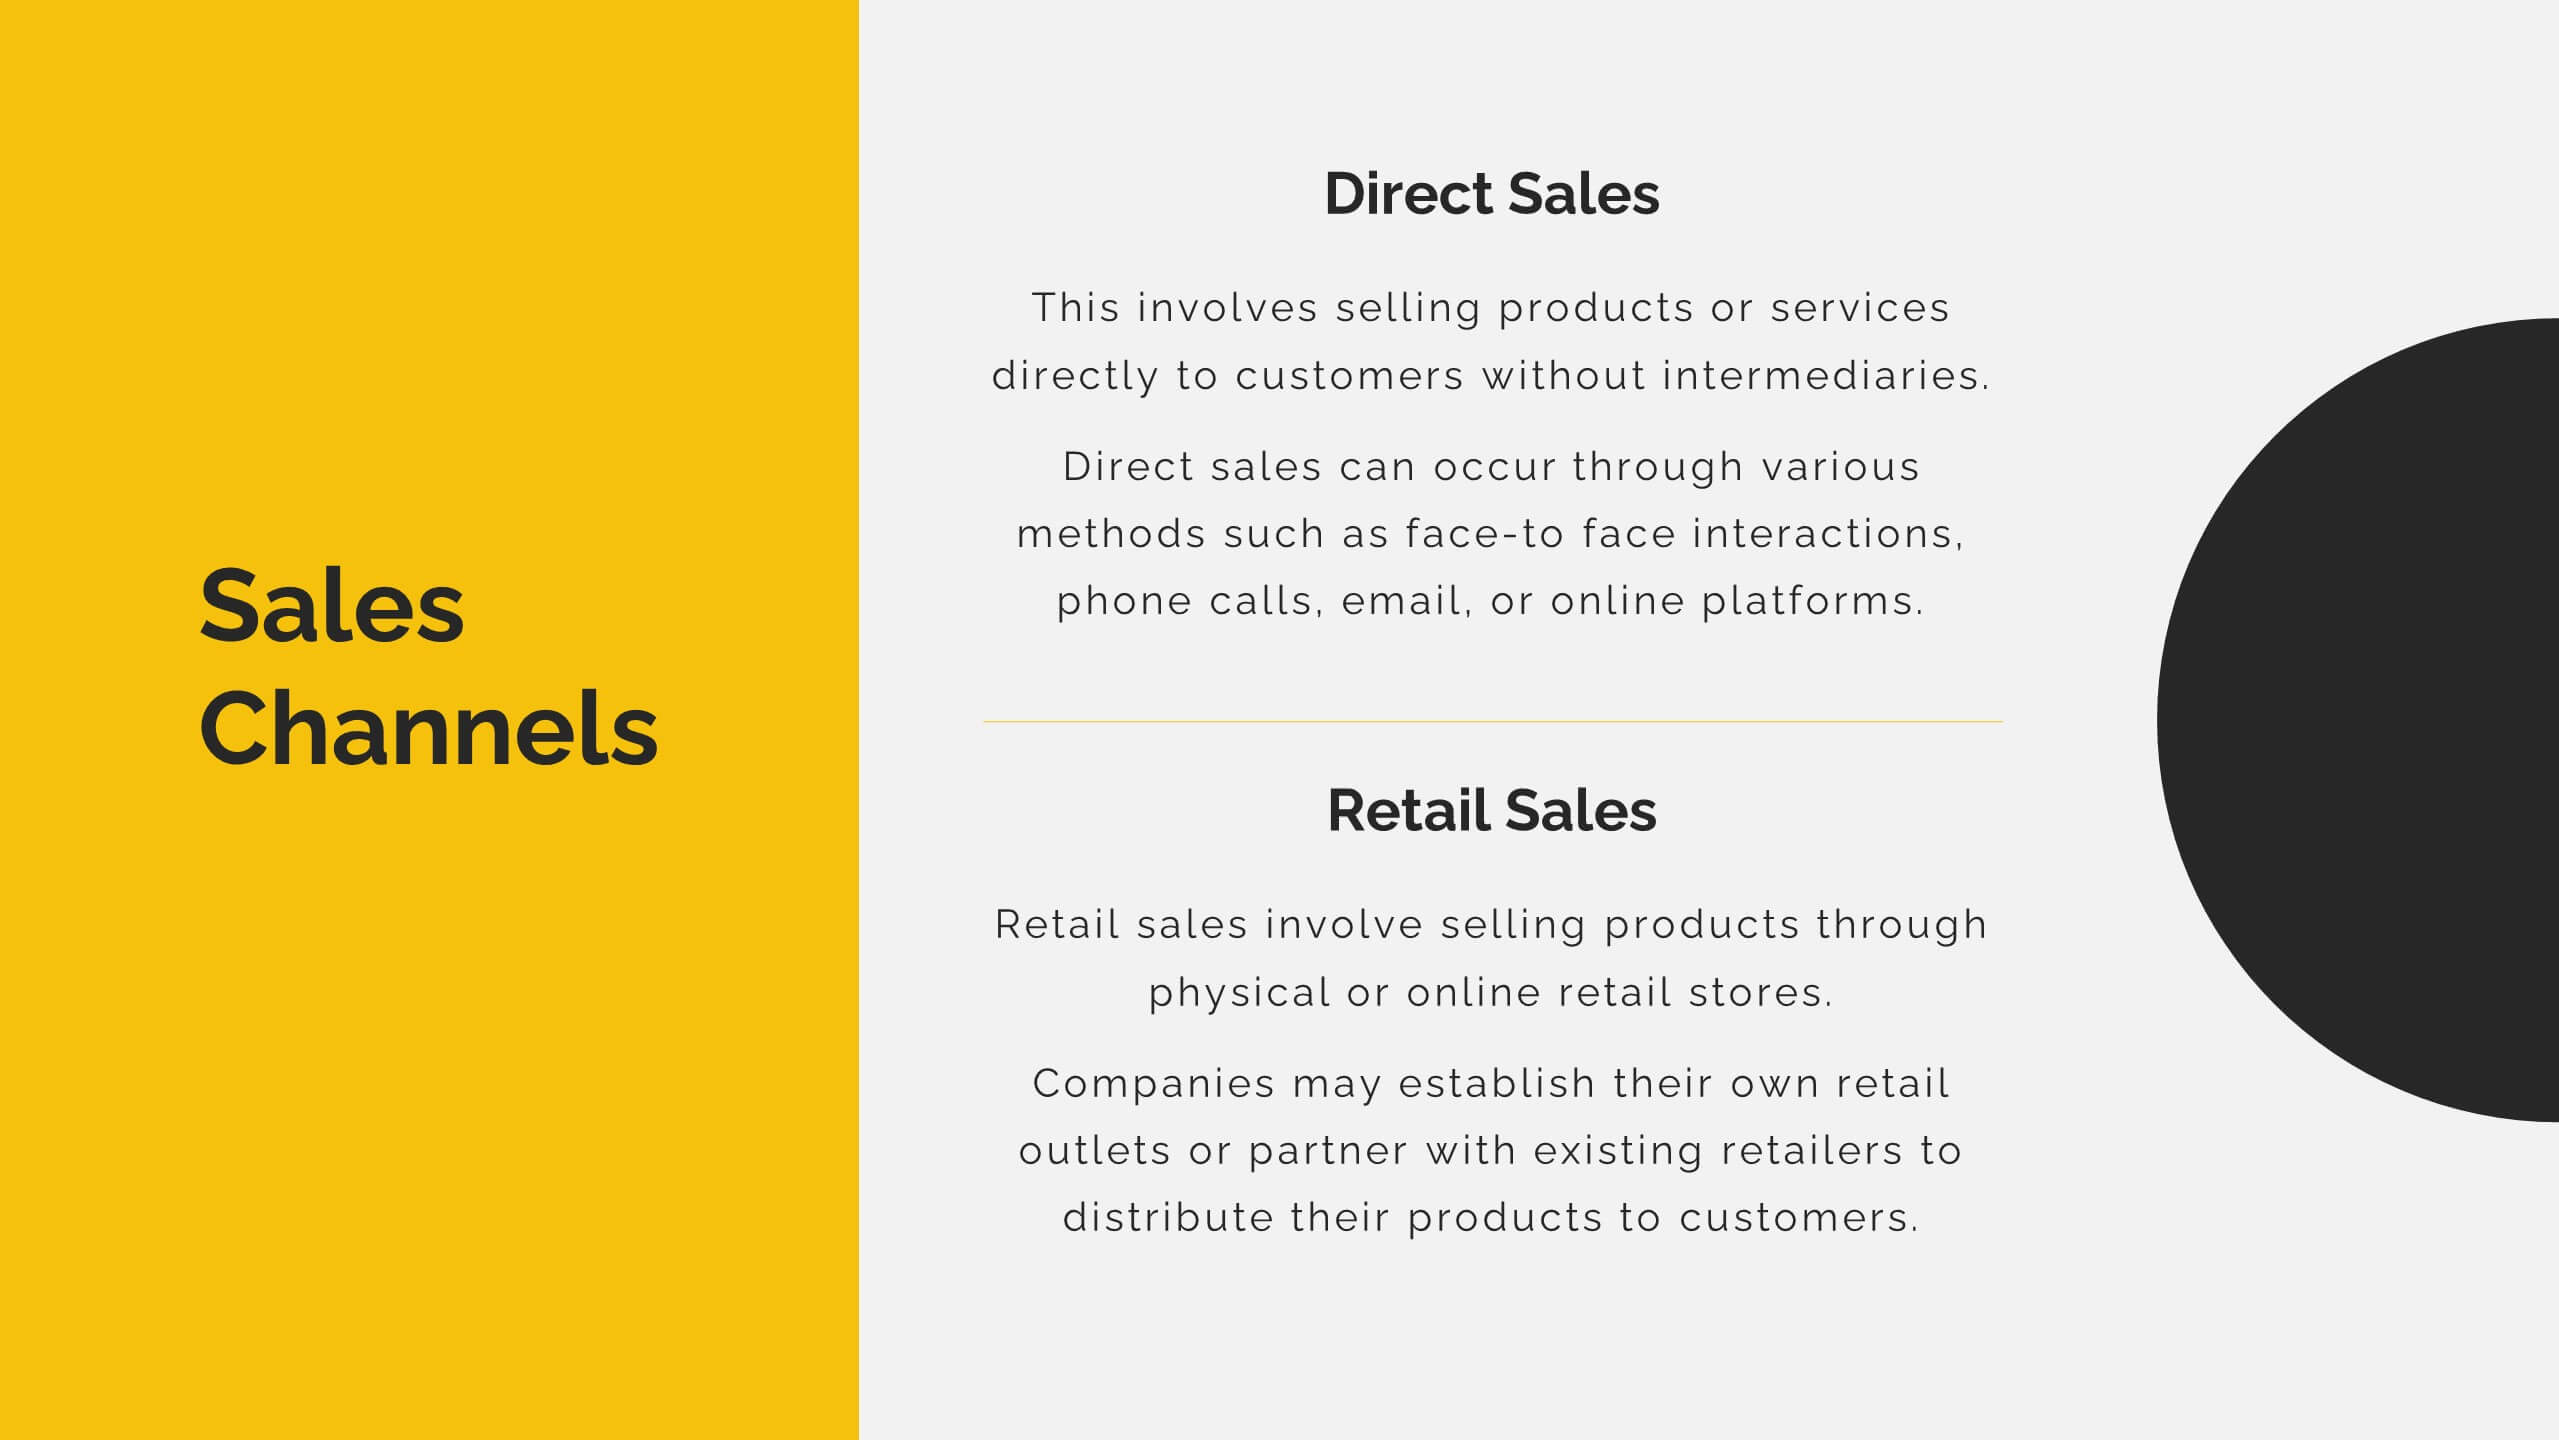
Mirage Startup Funding Proposal Presentation
Secure funding with this dynamic startup proposal template! Perfect for presenting your mission, vision, business model, and market analysis. Ideal for entrepreneurs aiming to impress investors and stakeholders. Compatible with PowerPoint, Keynote, and Google Slides, this template ensures your proposal is clear, professional, and compelling. Achieve your startup goals today!


5 diapositivas
Agile Workflow and Role Breakdown Presentation
Visualize Agile processes with this streamlined workflow and role breakdown diagram. Perfect for Scrum teams and project leads, this layout maps out five stages using arrows, icons, and a circular feedback loop. Easily editable in PowerPoint, Keynote, and Google Slides to fit any development cycle or team structure.


21 diapositivas
Flare Project Management Plan Presentation
Unleash the full potential of your projects with a dynamic plan template that makes every detail shine! This vibrant and clear design is built to guide your team and stakeholders through every phase of your project with confidence and clarity. Starting with a compelling introduction and project overview, this template captures attention and sets the stage for success. Dive deep into problem statements, objectives, and the scope of work, all presented in a visually appealing and easy-to-digest format. With sections dedicated to timelines, milestones, budget breakdowns, and resource allocation, this template ensures every aspect of your project is meticulously planned and communicated. The inclusion of stakeholder analysis, risk management, and quality assurance plans showcases your thorough approach to project management. Perfectly compatible with PowerPoint, Keynote, and Google Slides, this template is your go-to tool for creating project plans that are both inspiring and effective. Get ready to impress and lead your projects to success!


6 diapositivas
Problem-Solving with Design Thinking
Communicate your innovation process with clarity using the Problem-Solving with Design Thinking Presentation. This slide visualizes the six key phases of the design thinking methodology (e.g., Empathize, Define, Ideate, Prototype, Test, Implement) arranged in a dynamic hexagonal loop. Each section is color-coded and icon-labeled for easy navigation, with editable titles and space for explanatory text. Ideal for creative workshops, team brainstorming, innovation strategy, and agile process presentations. Fully editable in PowerPoint, Keynote, and Google Slides.


4 diapositivas
Internal Meeting Agenda and Notes Presentation
Stay organized and aligned with the Internal Meeting Agenda and Notes presentation template. Designed for clarity and productivity, this layout includes dedicated sections for meeting topics, notes, action items (to-do list), brainstorming, and extra comments. Ideal for team check-ins, project syncs, and internal reviews. Fully editable and compatible with PowerPoint, Keynote, and Google Slides.


20 diapositivas
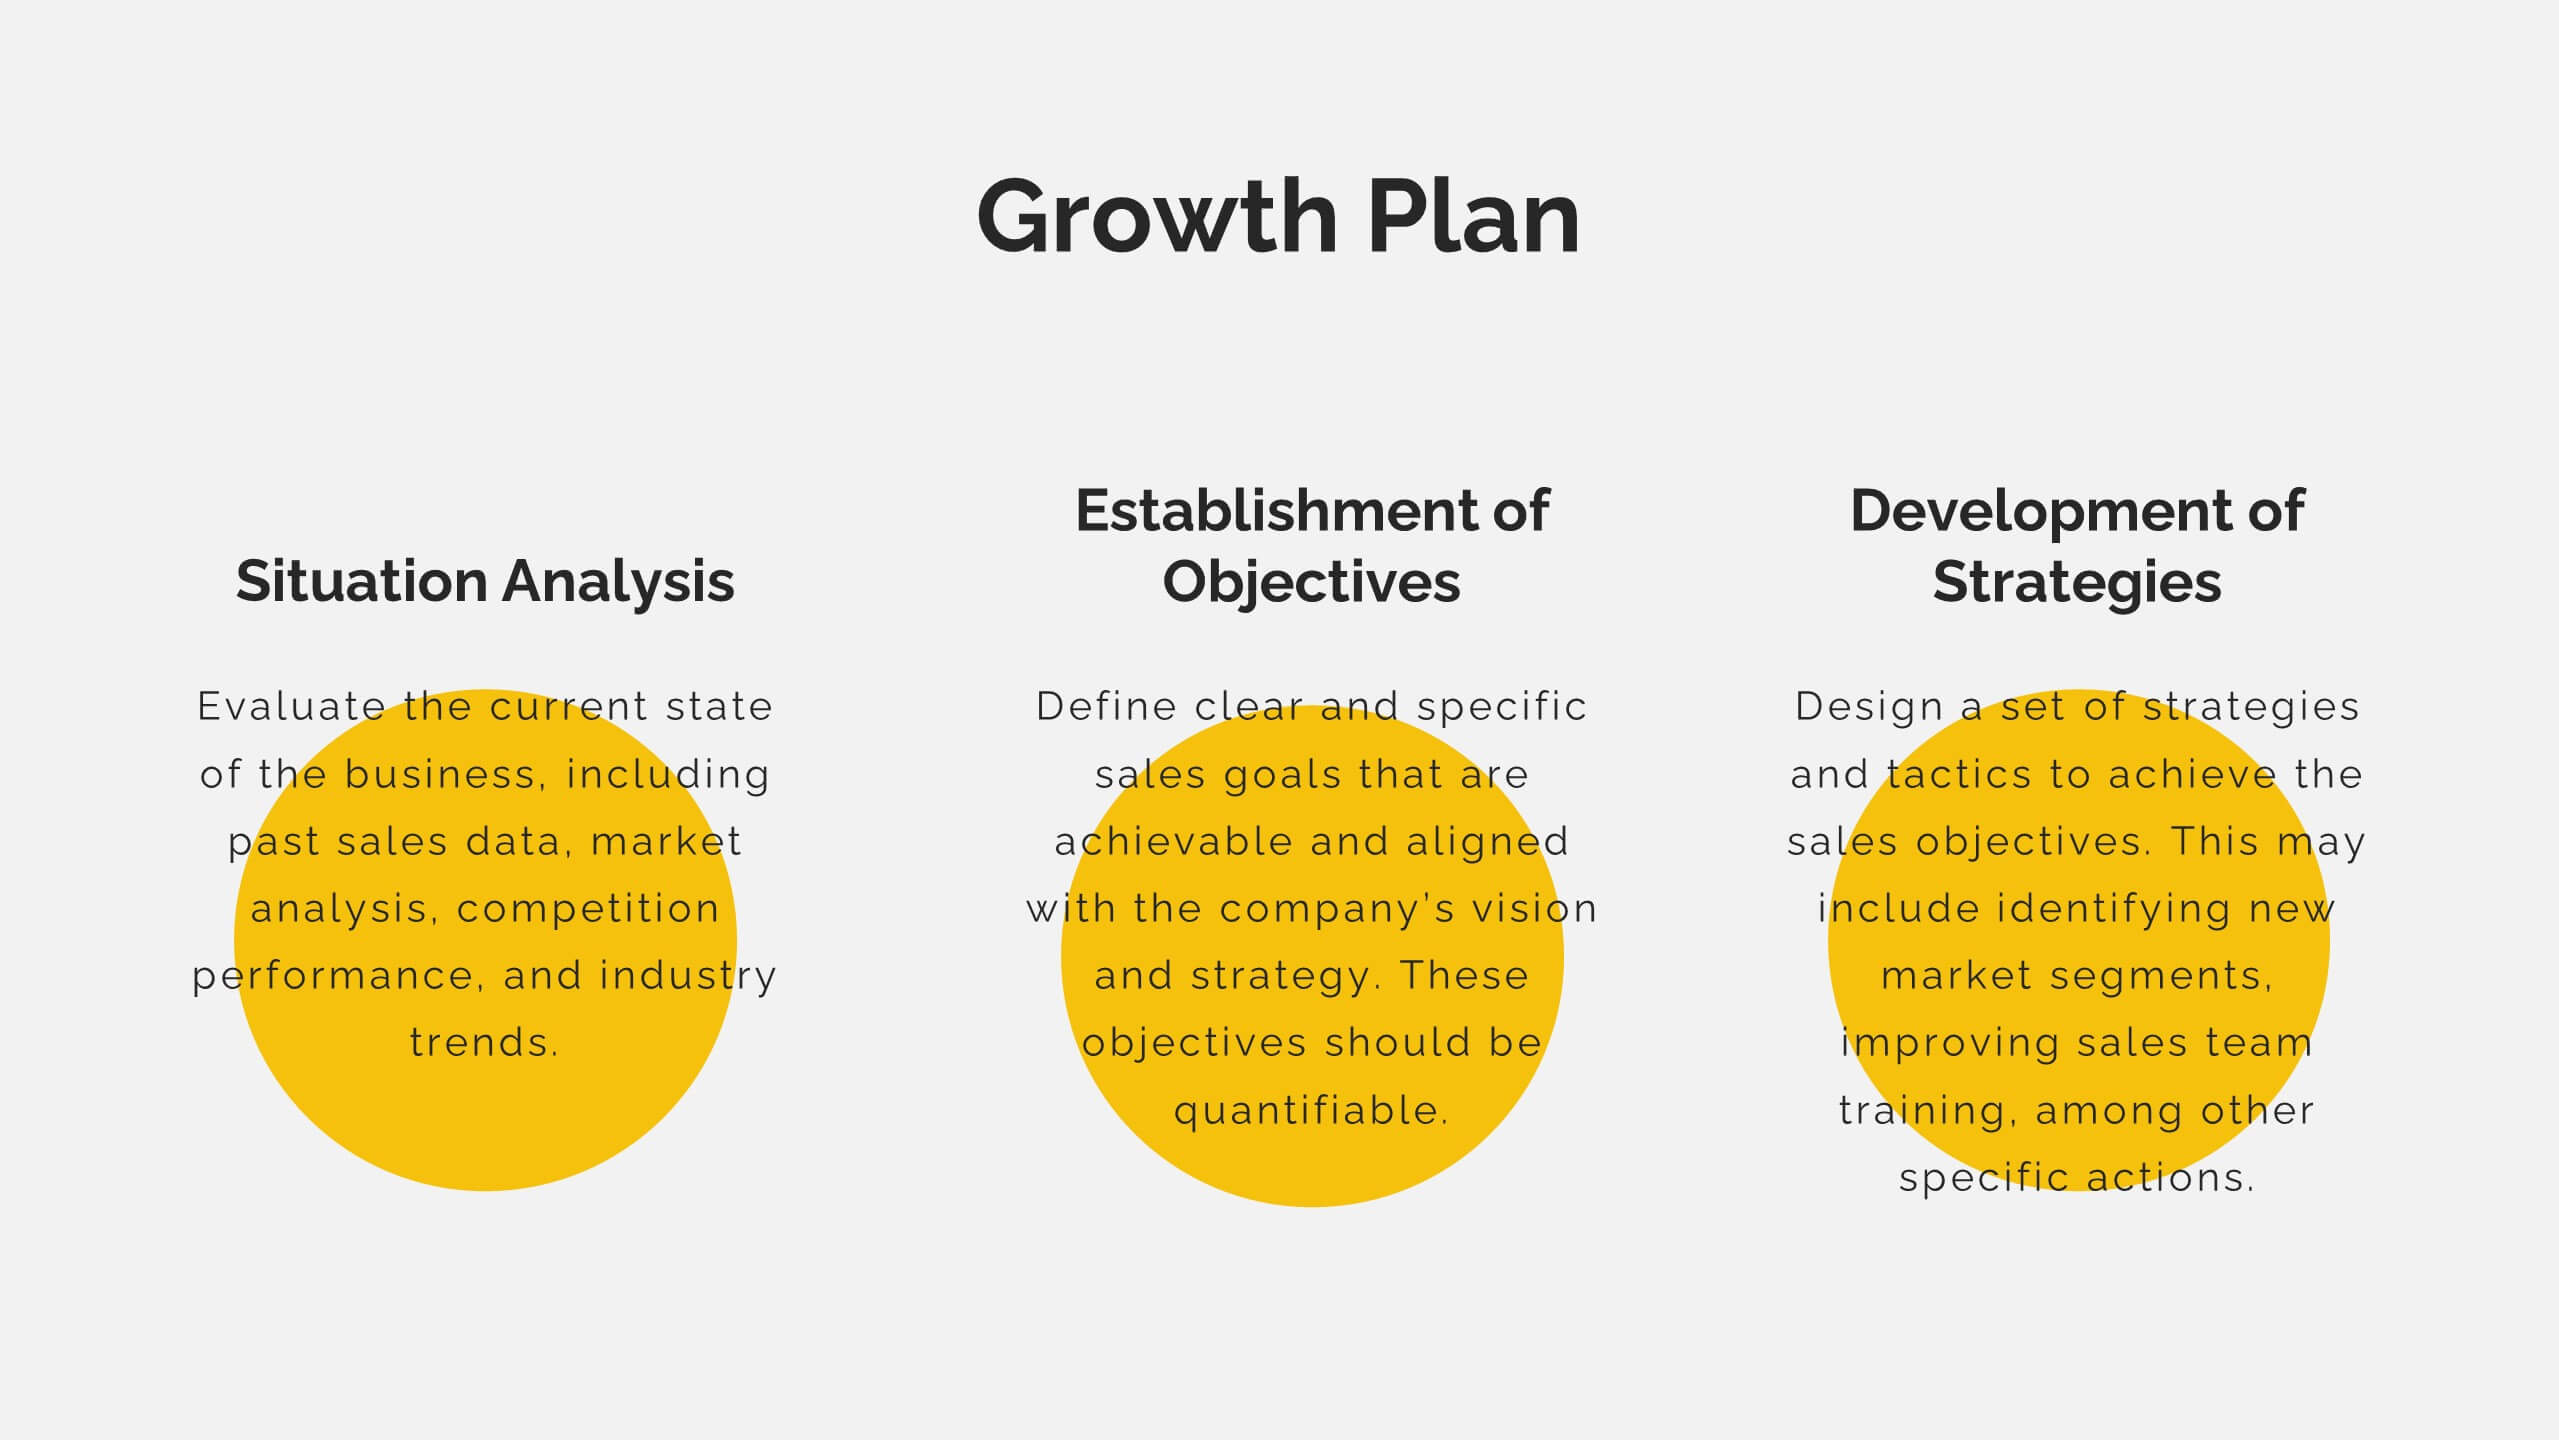
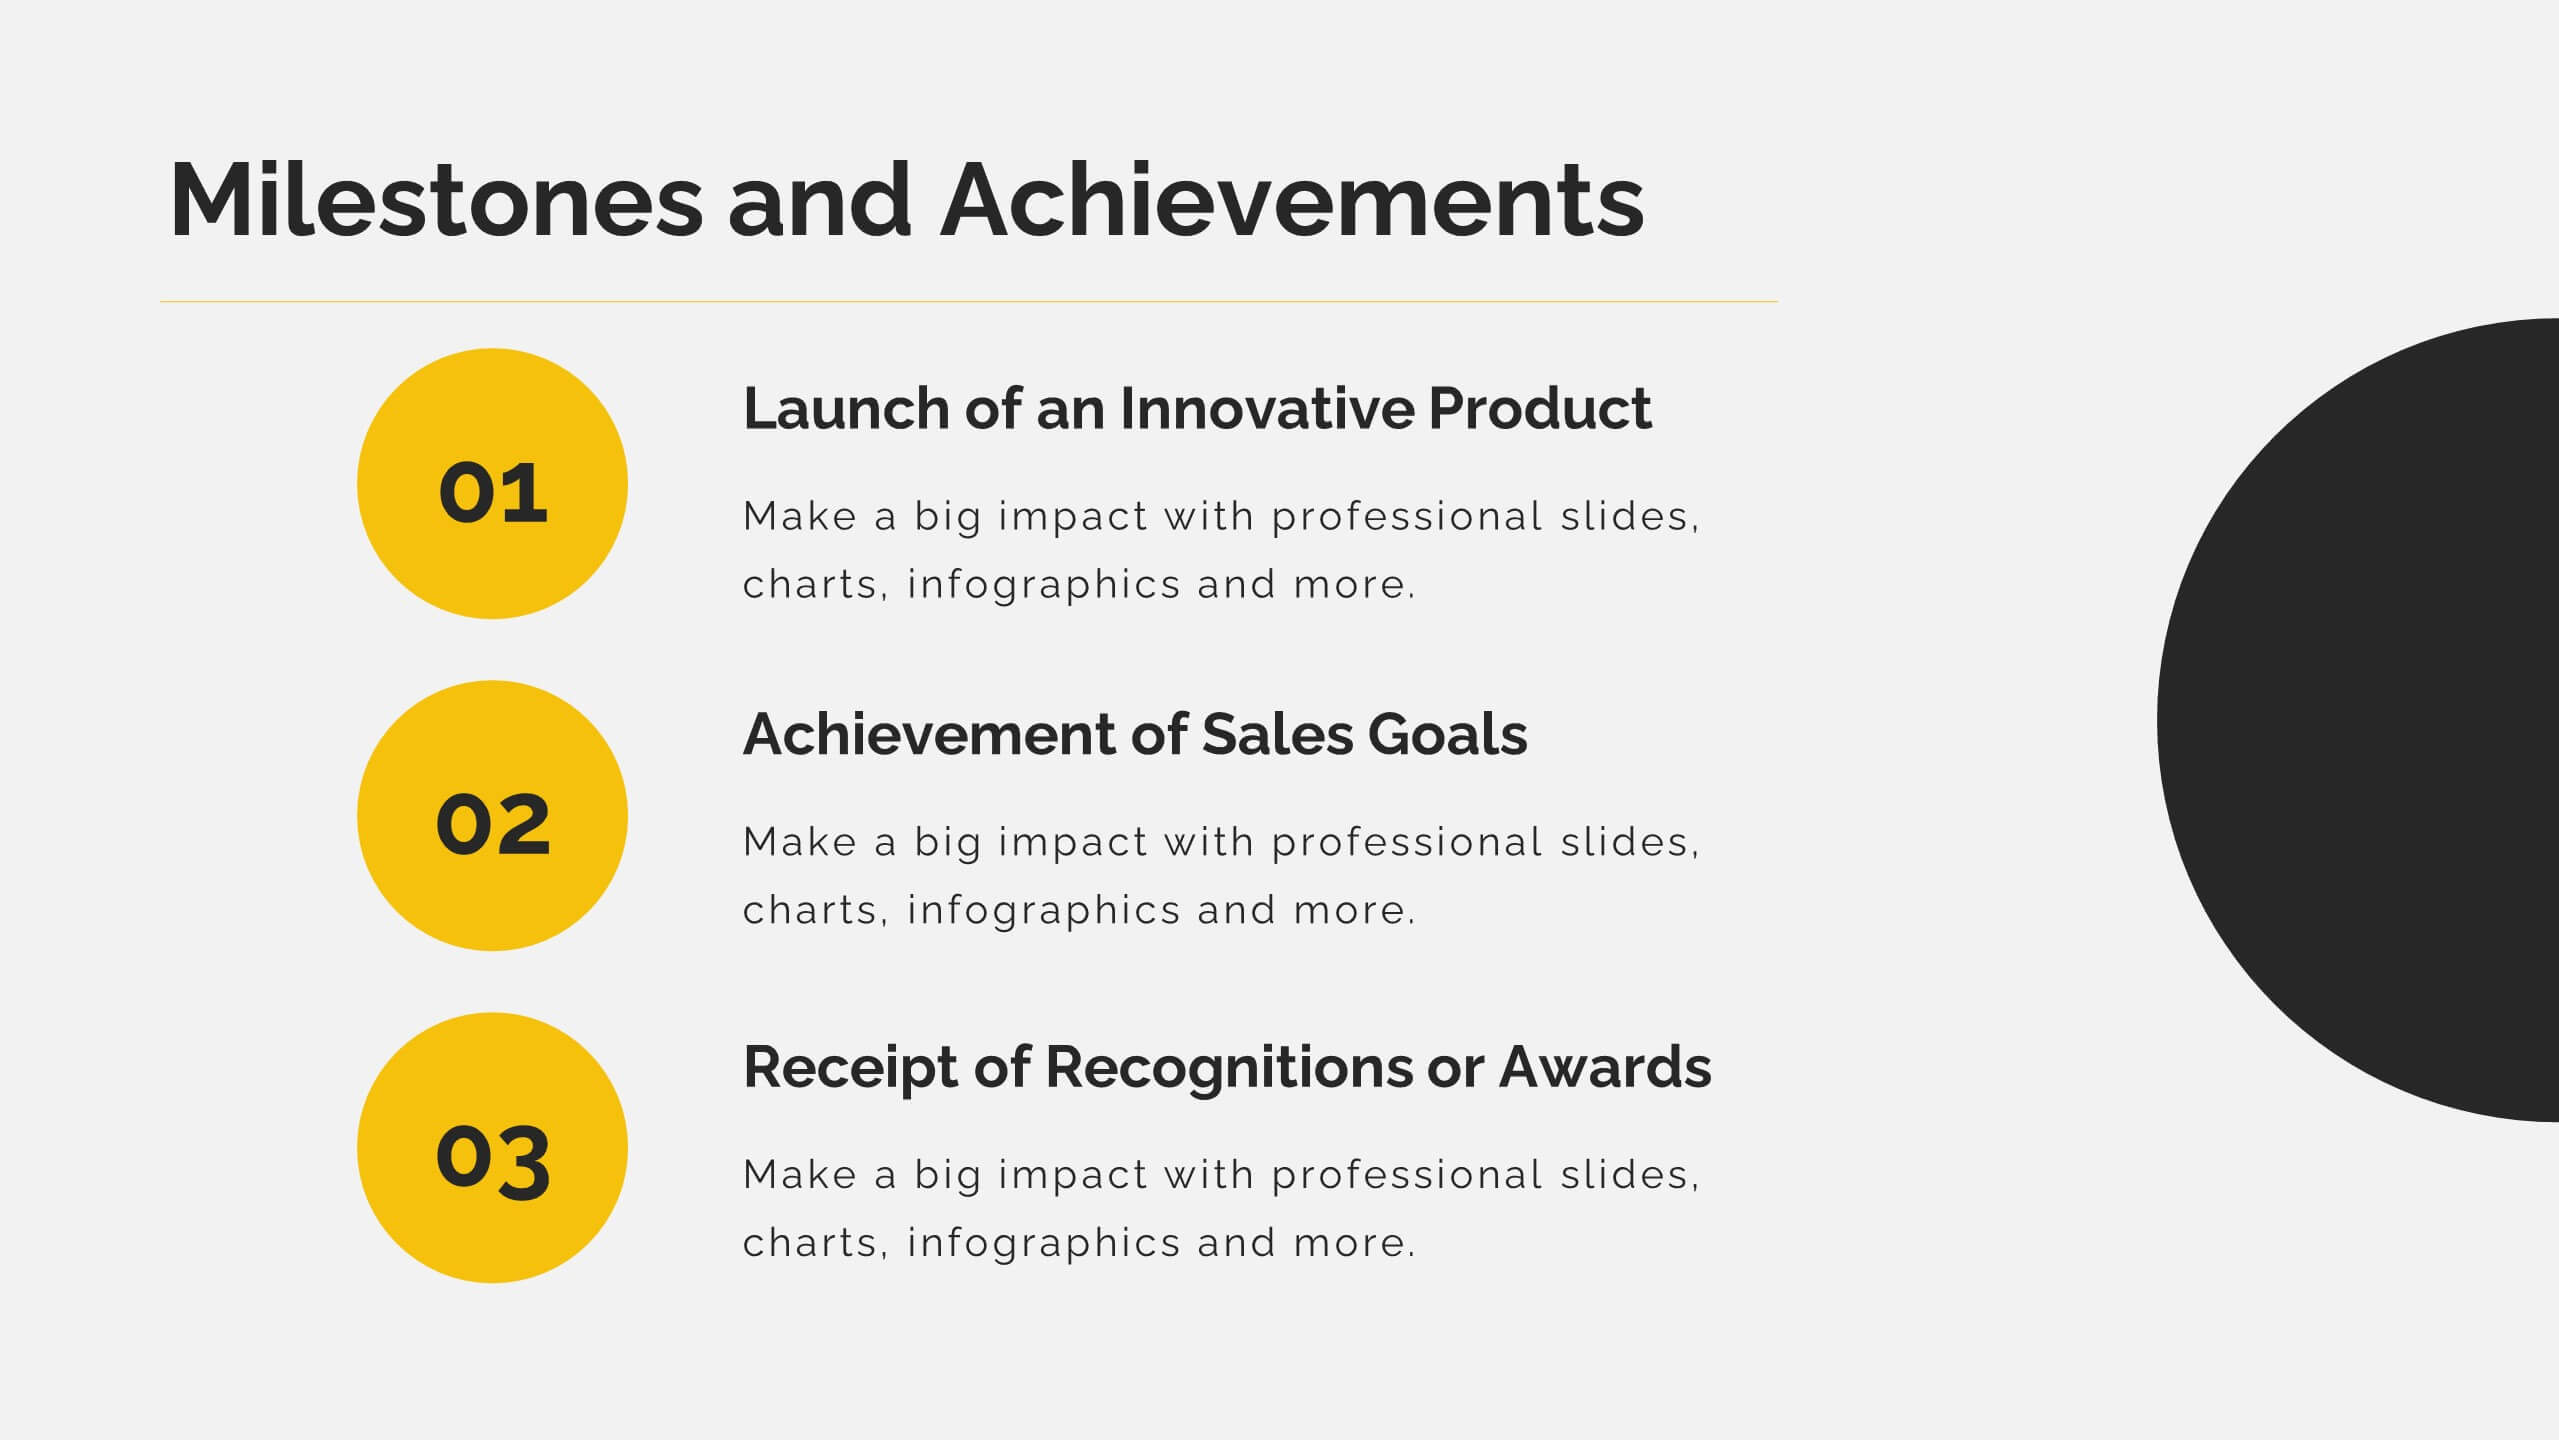
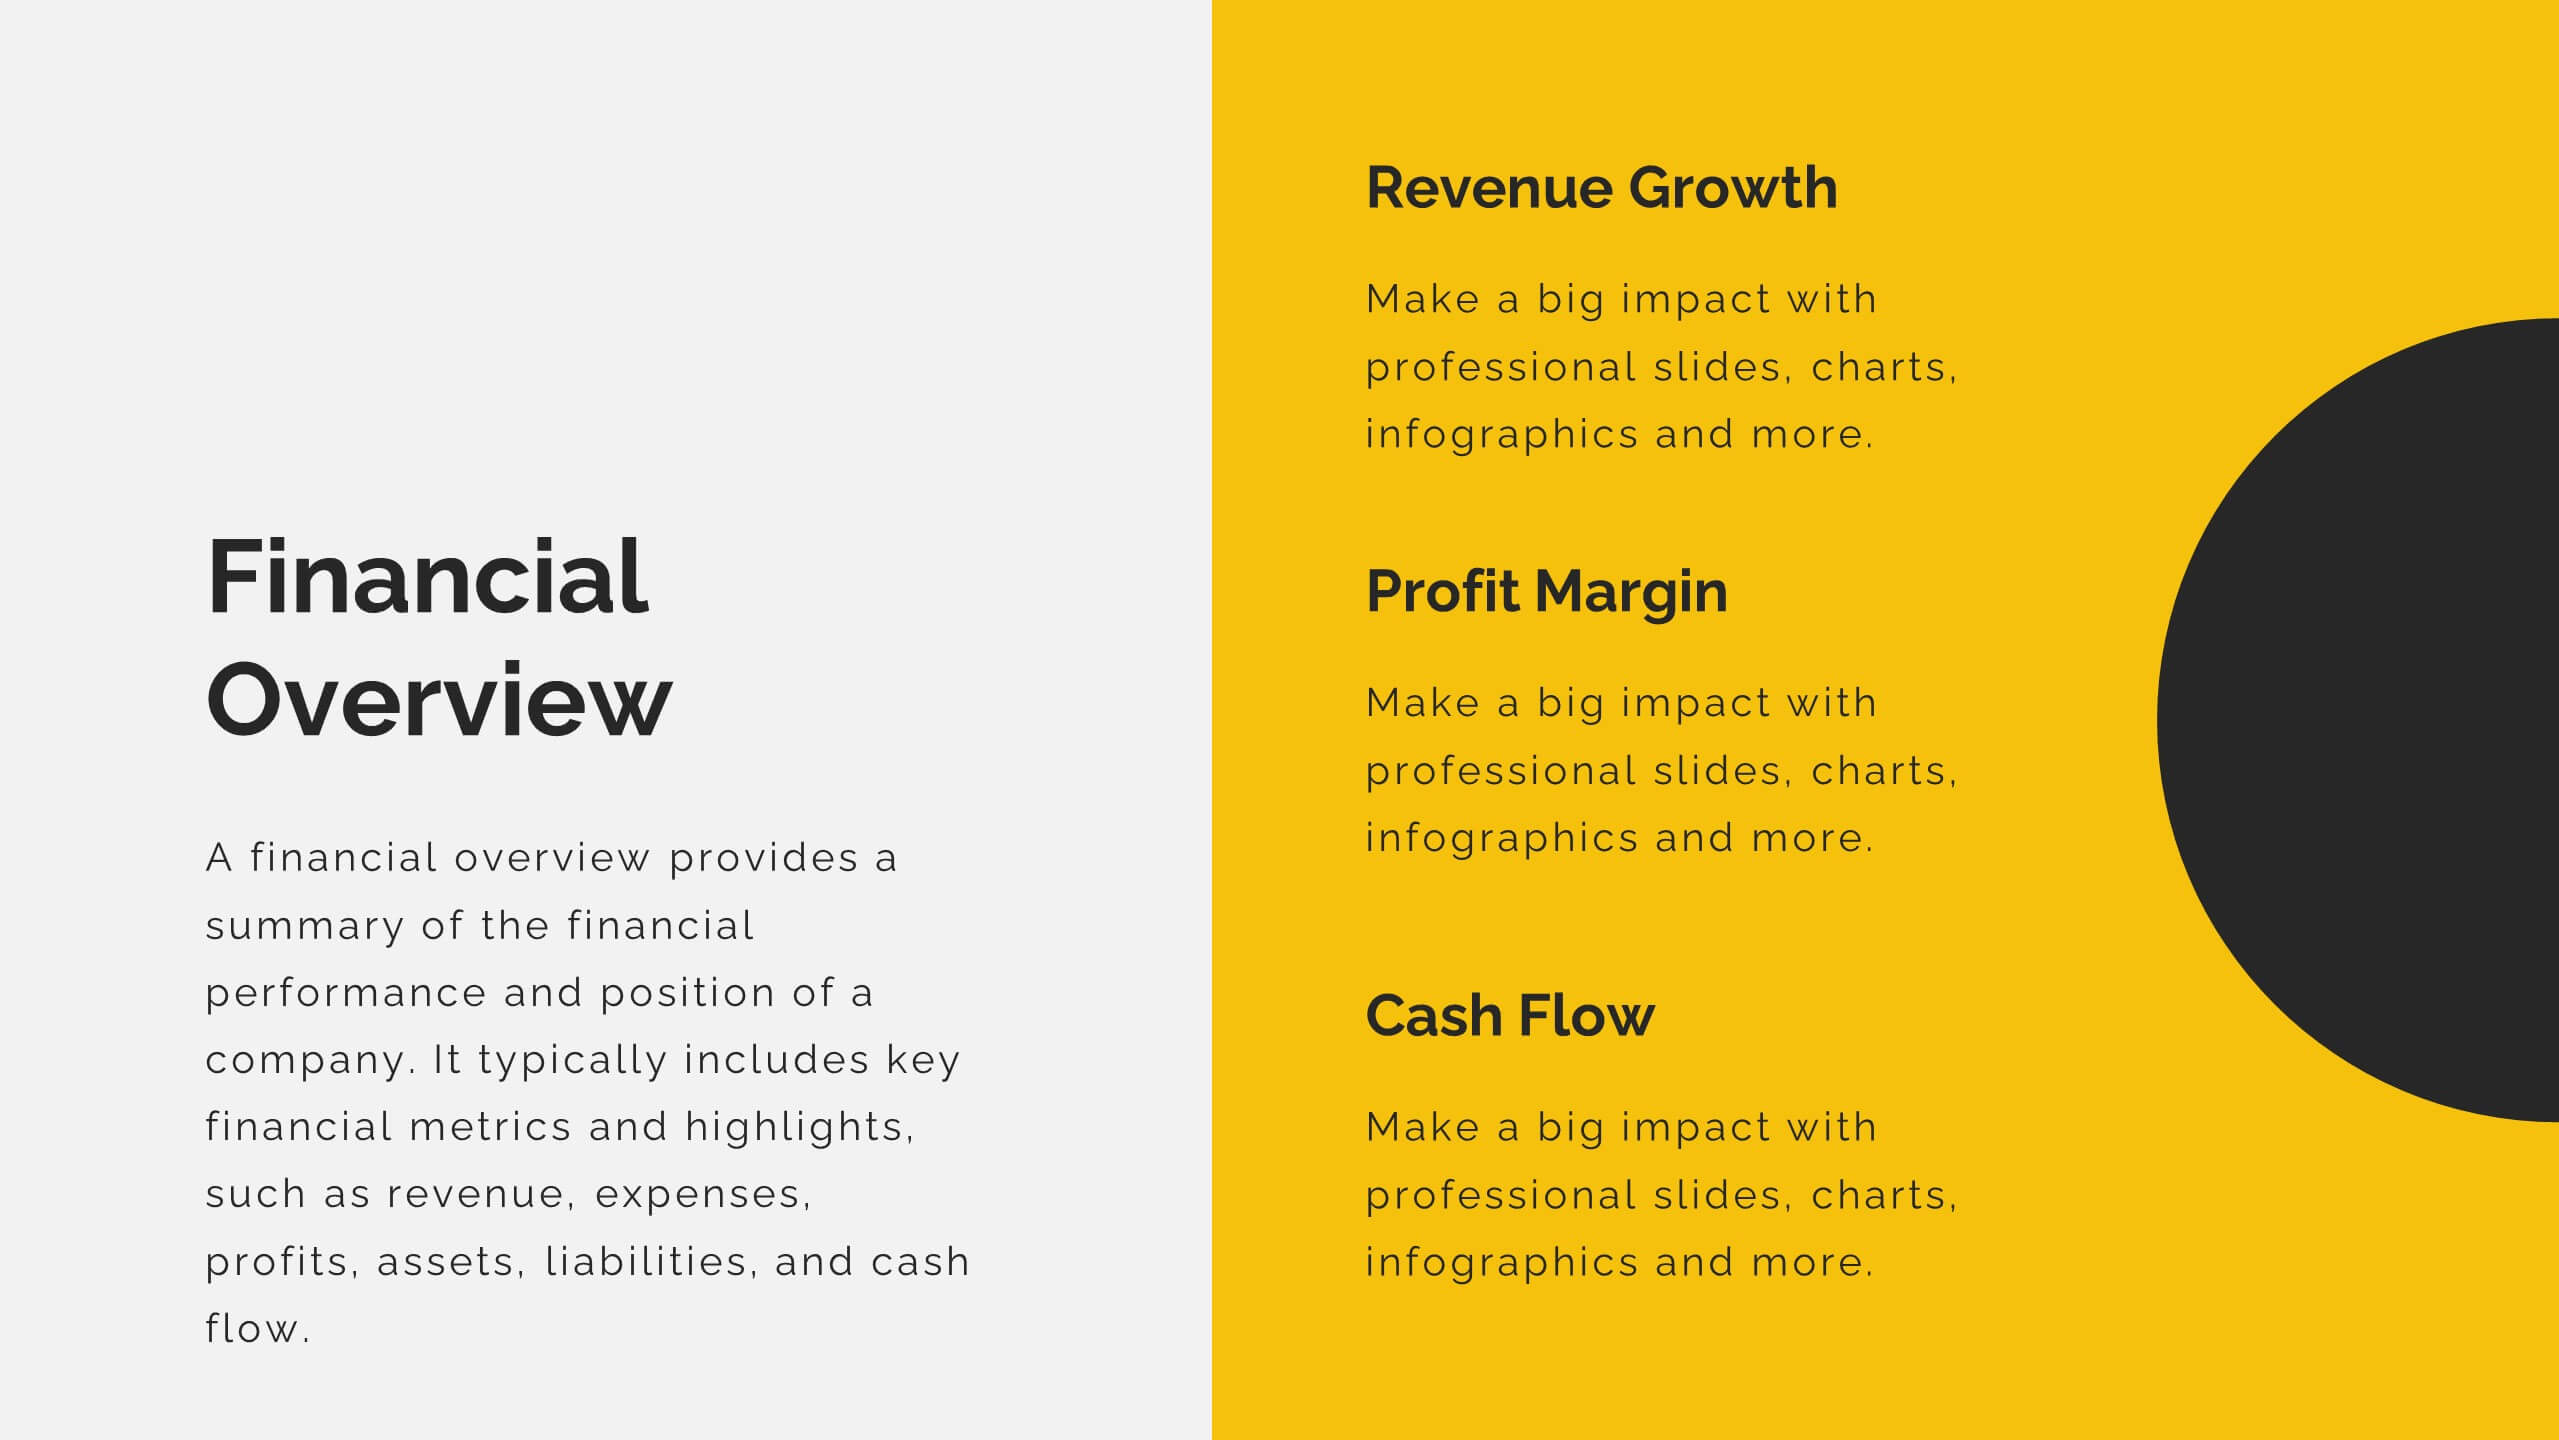
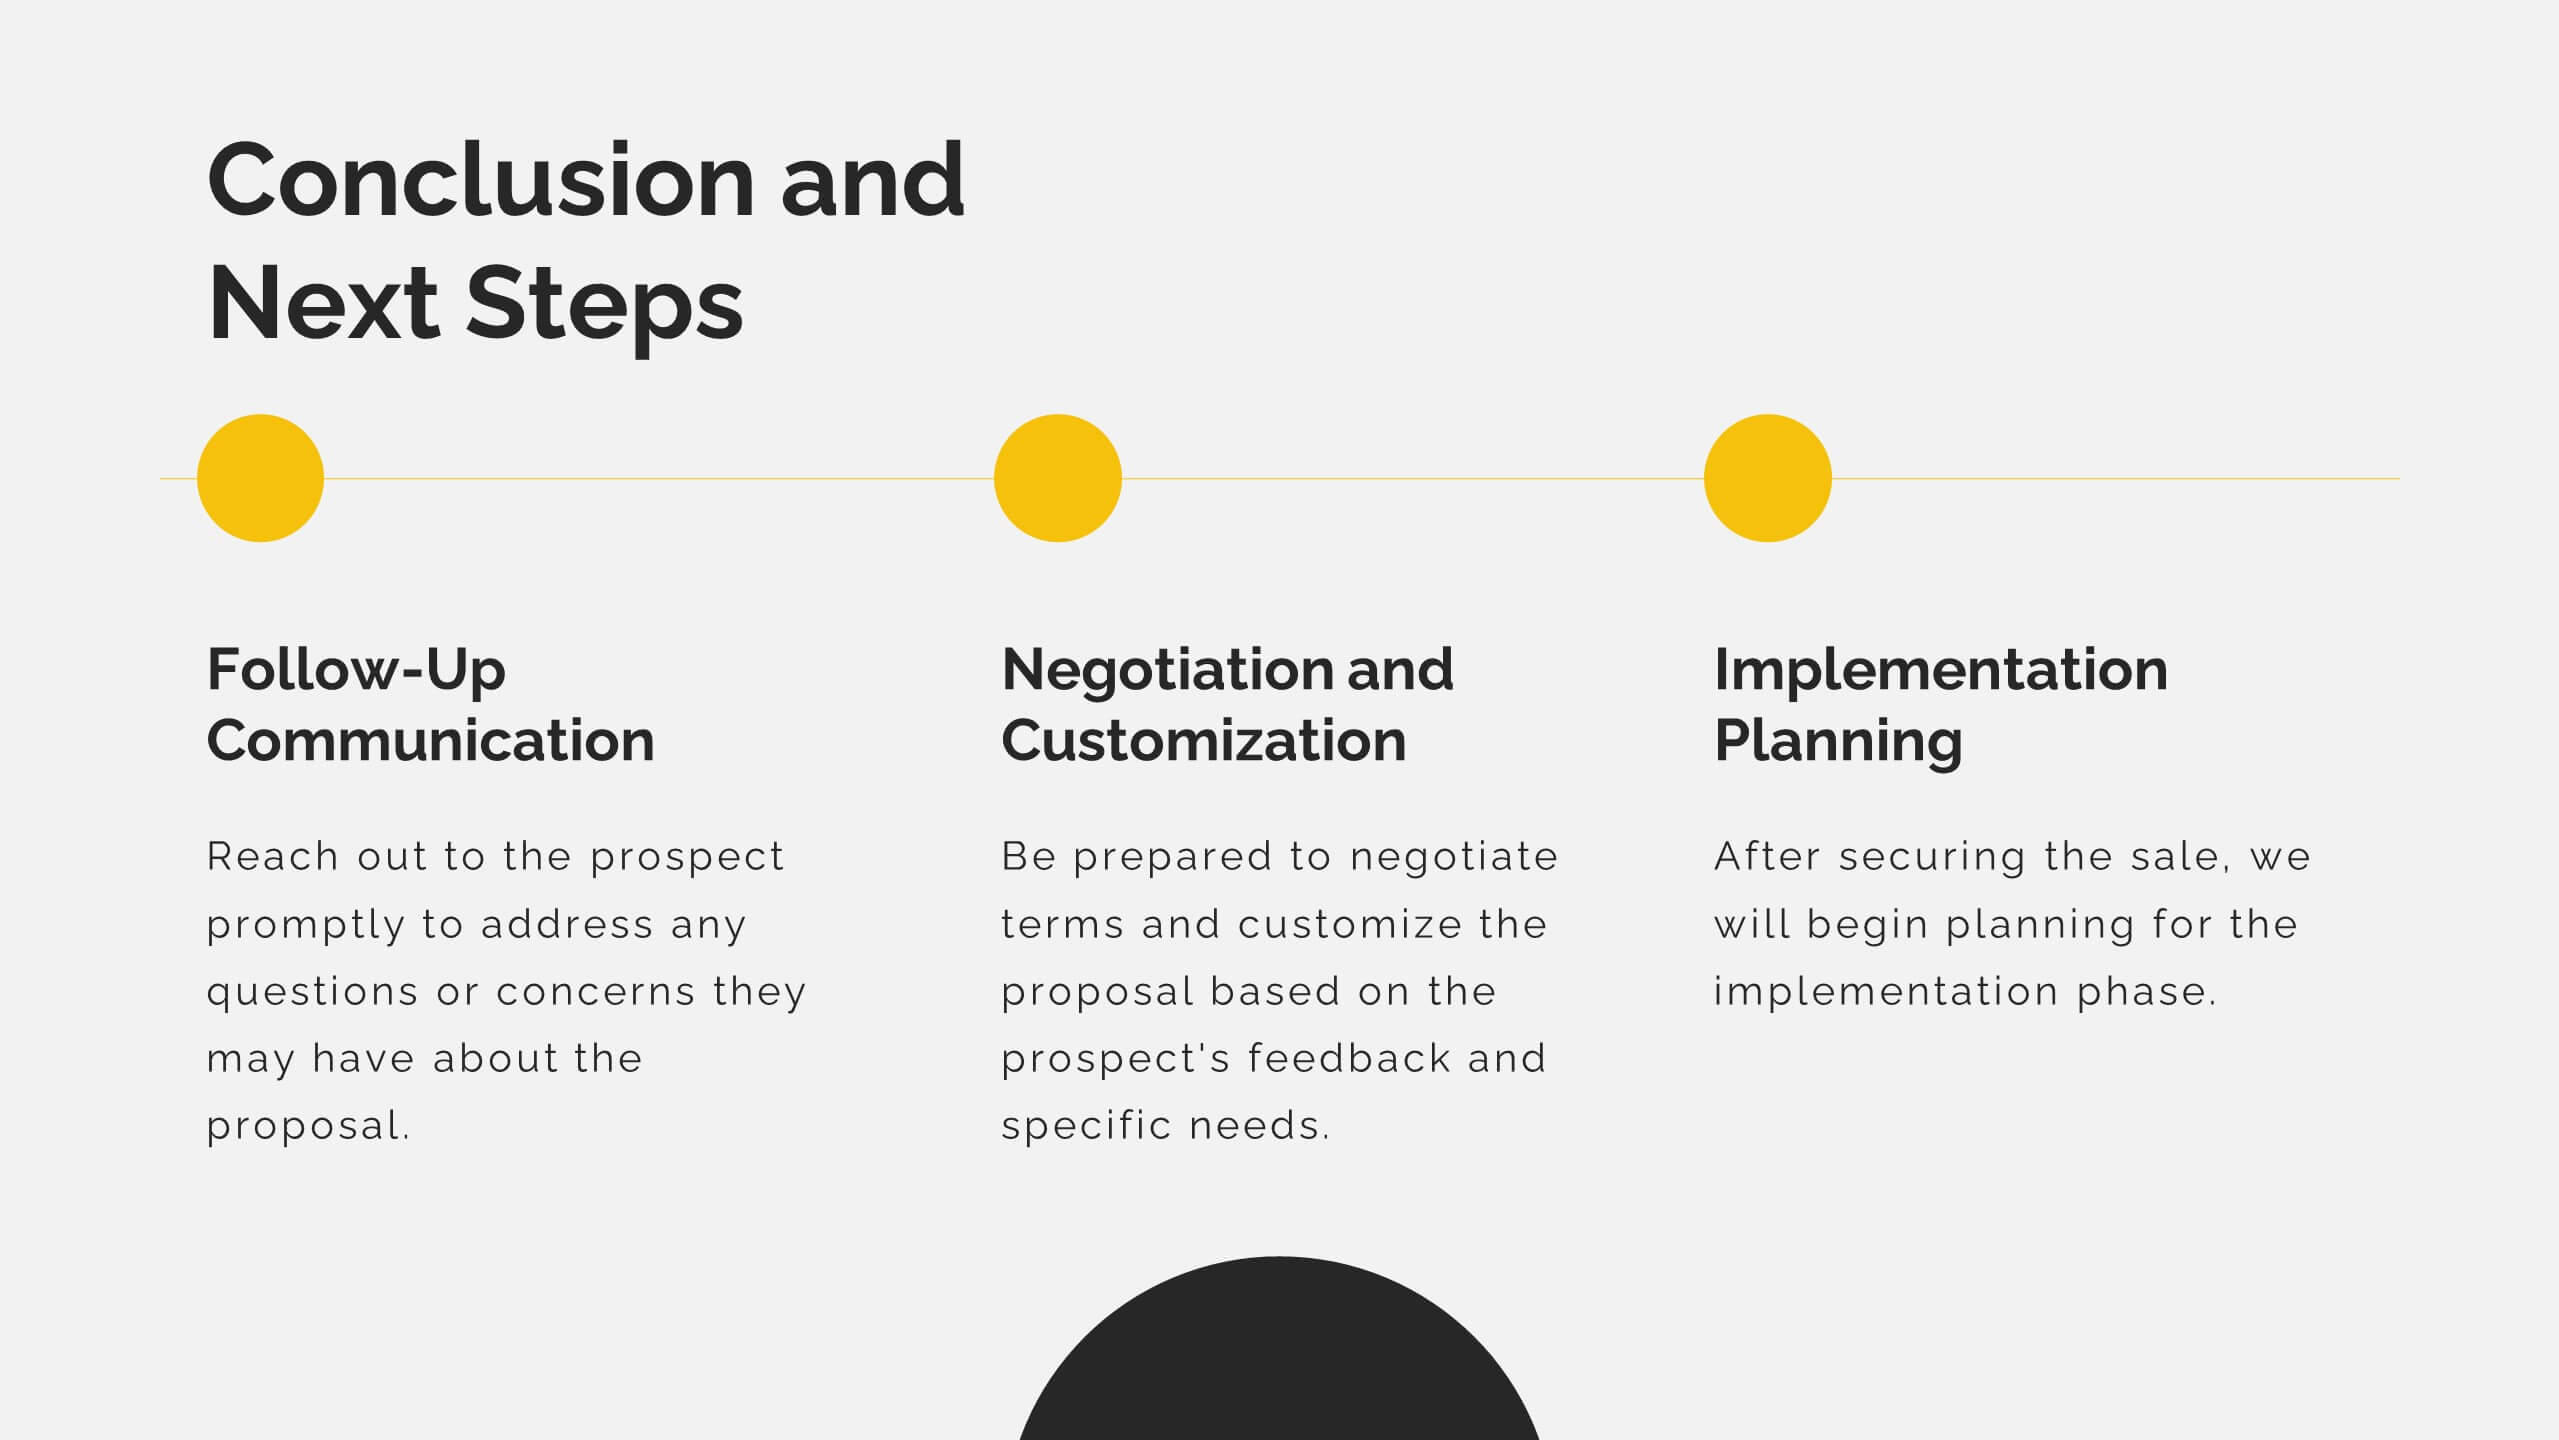
Astralisque Sales Proposal Presentation
This Sales Proposal Presentation is designed to help businesses outline their sales strategies with a bold and dynamic style. Covering key elements such as competitive analysis, objectives, pricing strategy, and sales performance metrics, it ensures a professional look. Fully customizable and compatible with PowerPoint, Keynote, and Google Slides.


23 diapositivas
Orbit Marketing Strategy Plan Presentation
Elevate your marketing strategy presentations with this vibrant and dynamic template! Perfect for analyzing market trends, identifying target audiences, and outlining strategic objectives. Ideal for marketing professionals aiming to captivate their audience and drive results. Compatible with PowerPoint, Keynote, and Google Slides, this template ensures your strategy is clear, compelling, and effective.


6 diapositivas
Strategic Wheel Diagram Presentation
Capture attention instantly with this bold and modern visual design built for strategic presentations. Ideal for mapping key processes, illustrating interconnected goals, or showcasing business strategies, it organizes ideas in a circular, easy-to-follow layout. Fully customizable and compatible with PowerPoint, Keynote, and Google Slides for seamless editing and presentation.