


Características


¿Tienes alguna pregunta?
Recomendar


15 diapositivas
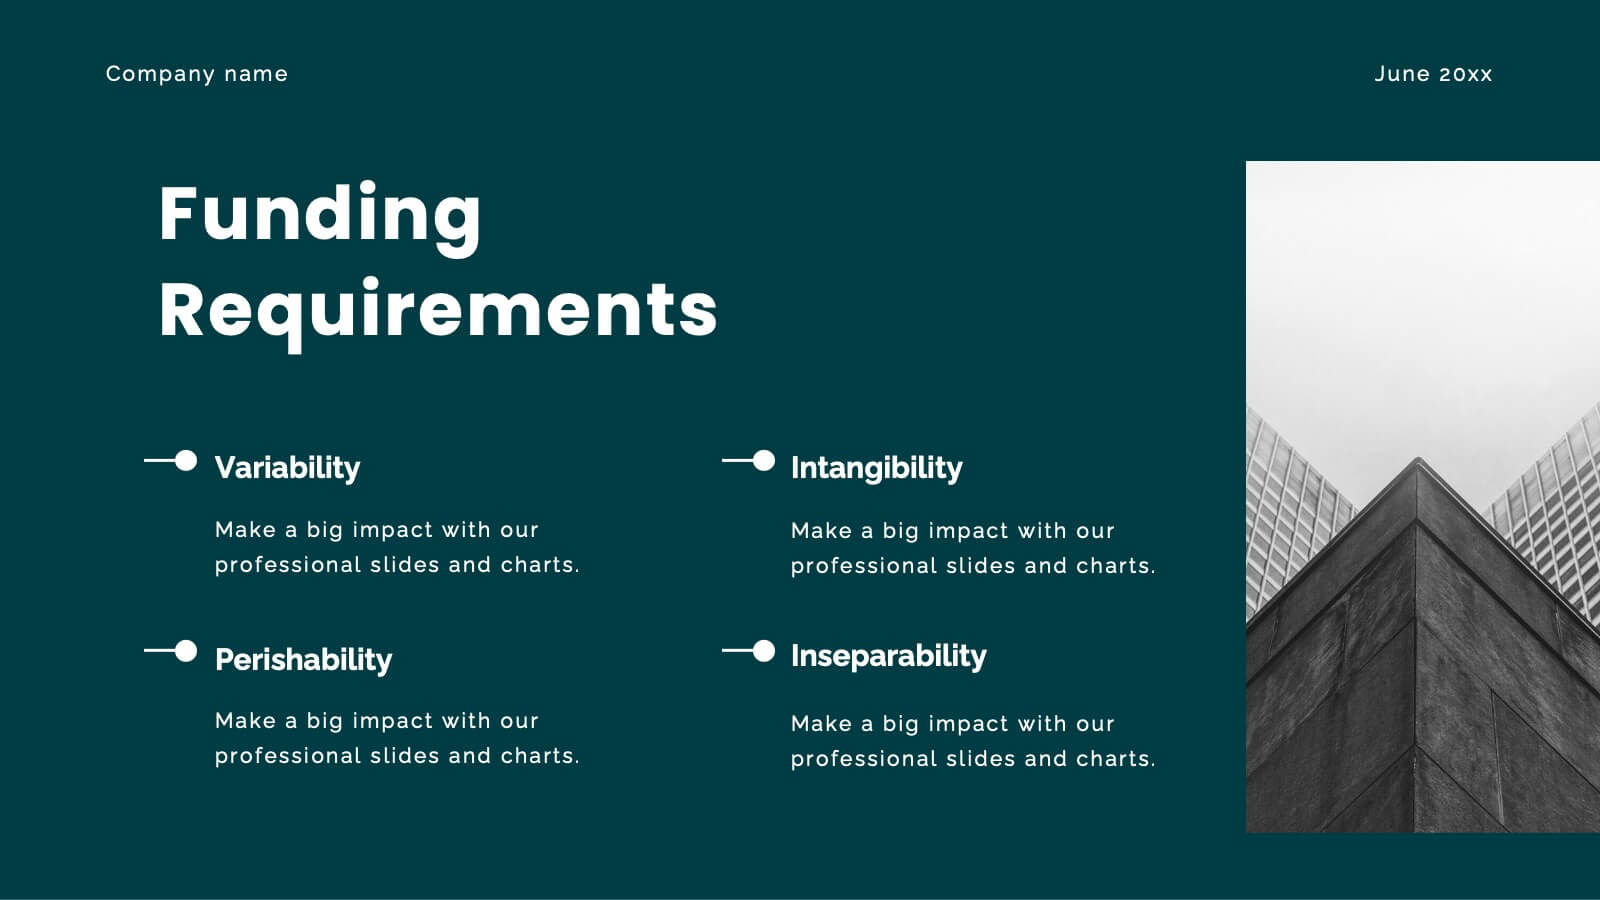
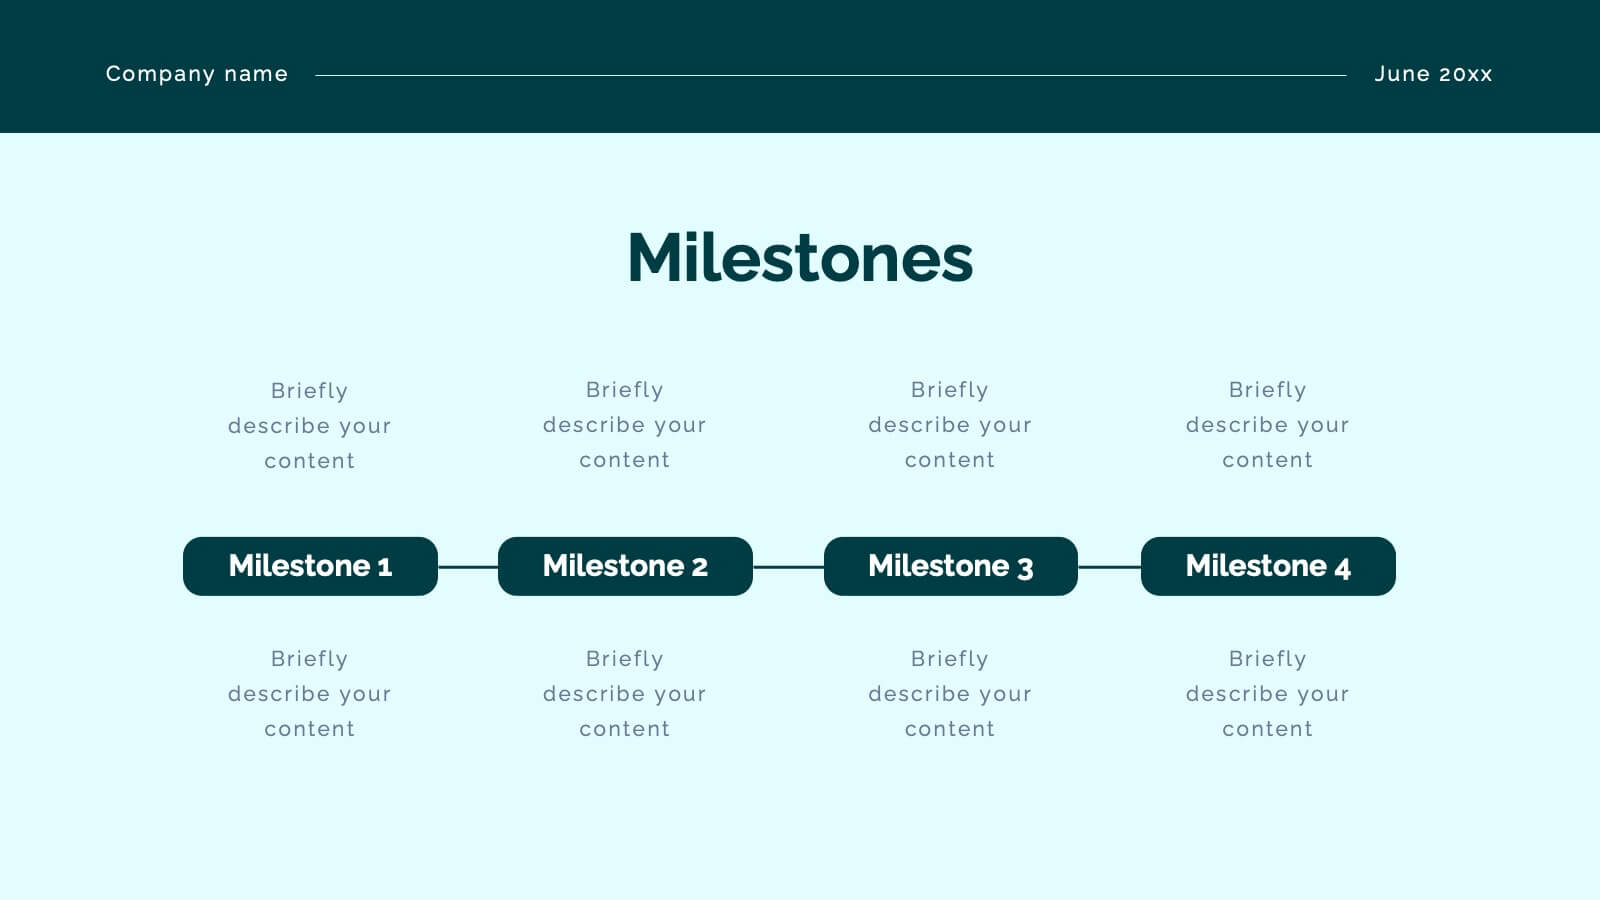
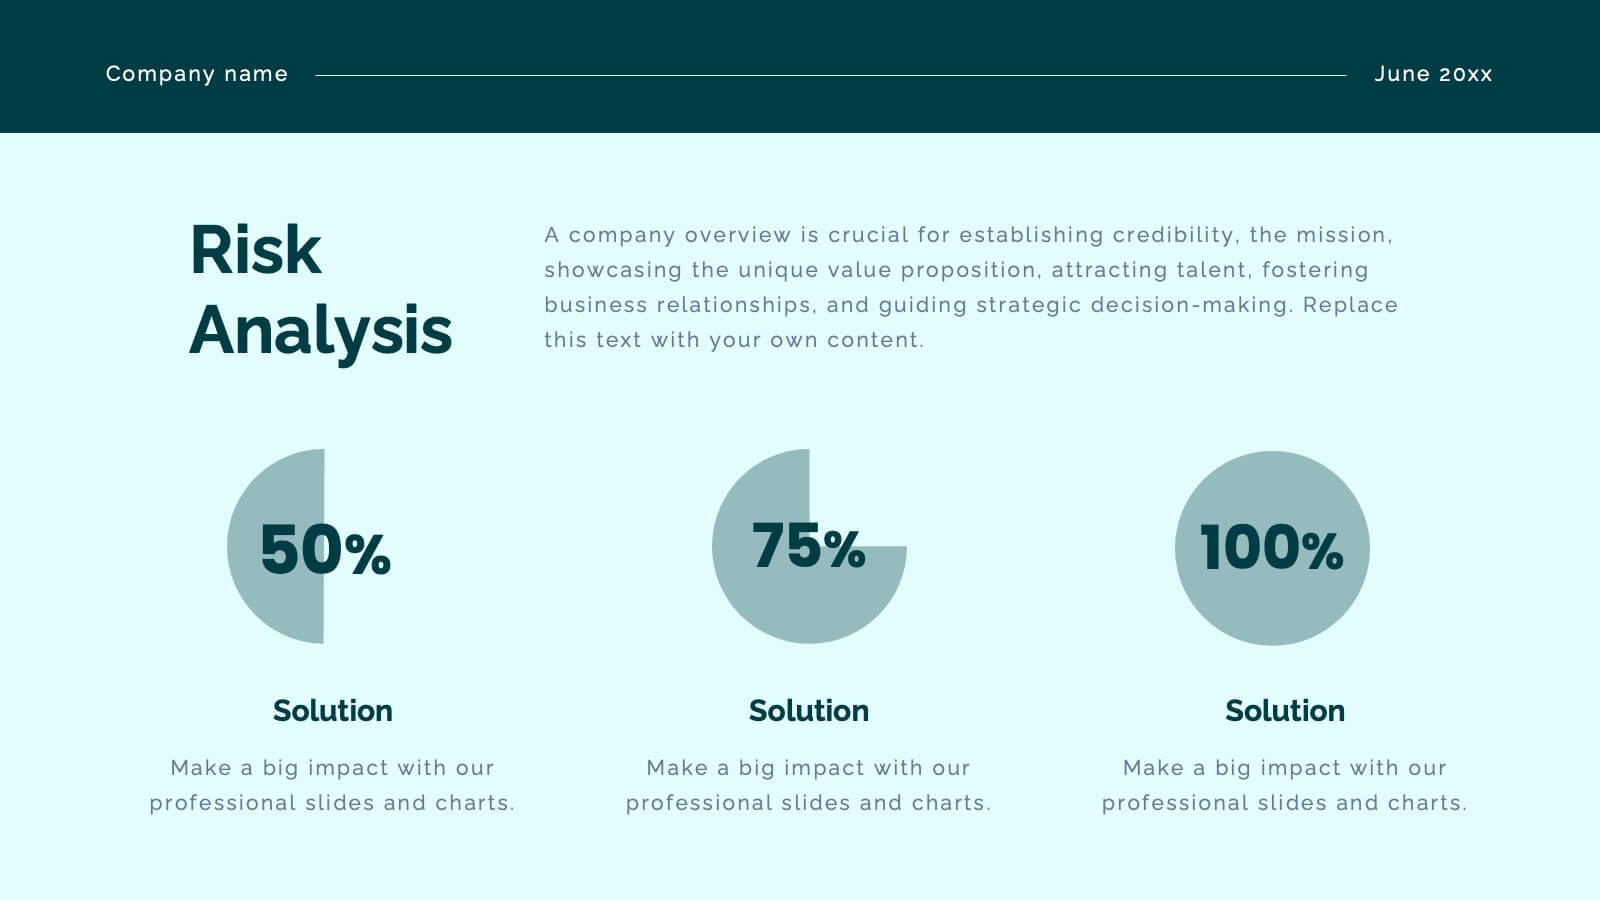
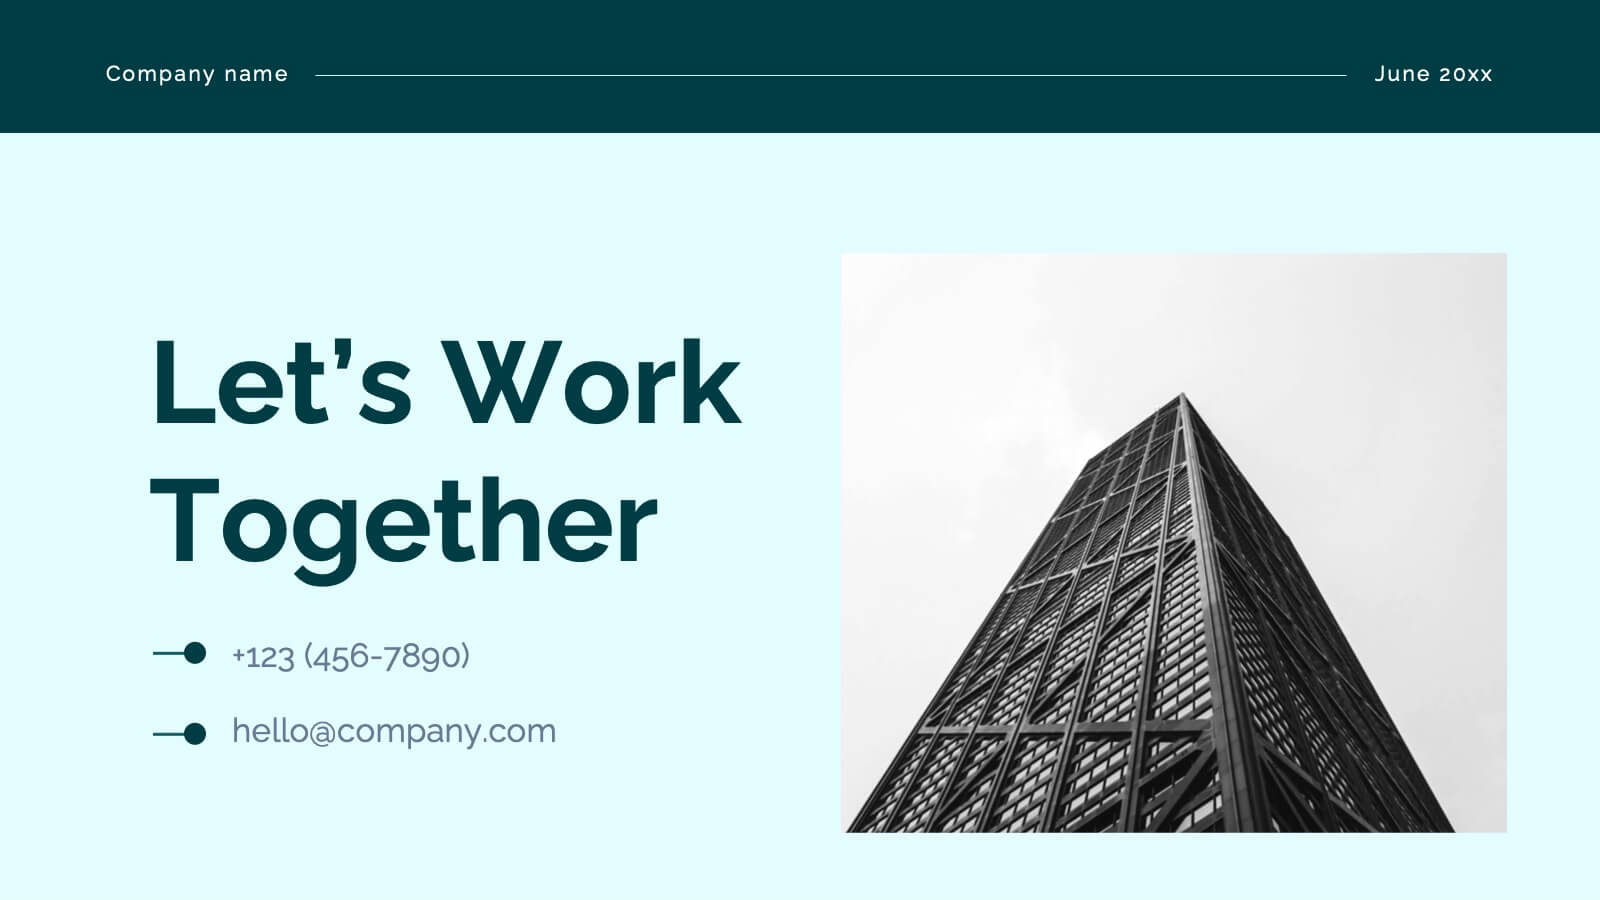
Business Roadmap Infographic
A business roadmap is a strategic plan that outlines the goals, milestones, and key initiatives a company intends to achieve over a specific period. This infographic template is designed to showcase the strategic journey and future goals of a business or organization. This infographic presents a clear and concise overview of the business's roadmap, highlighting key milestones, objectives, and action plans for achieving success. The infographic features a horizontal timeline that represents the business's journey from its inception to the envisioned future milestones. Each milestone is accompanied by a brief description or icon to provide context.


4 diapositivas
Customer Buyer Persona Profile Presentation
Bring your audience into the mind of your ideal customer with a clean, story-driven layout that highlights demographics, motivations, and everyday habits. This presentation helps you communicate who you’re targeting and why it matters, creating clarity for marketing and product teams. Fully compatible with PowerPoint, Keynote, and Google Slides.


5 diapositivas
Concise Company Overview Executive Summary Presentation
Present your business snapshot with clarity using this Concise Company Overview Executive Summary Presentation. Featuring a colorful puzzle-style diagram with six customizable titles, this slide is ideal for outlining key departments, initiatives, or functions. Fully editable in PowerPoint, Keynote, Google Slides, and Canva for maximum flexibility.


6 diapositivas
Professional Meeting Agenda Presentation
Plan your meetings with clarity and structure using the Professional Meeting Agenda Presentation. This clean, 5-step layout visually organizes agenda items alongside bold numbers and relevant icons to guide discussion. Perfect for team syncs, business reviews, or project briefings. Fully customizable in PowerPoint, Keynote, and Google Slides.


5 diapositivas
Project Task Allocation Chart Presentation
Track project progress with this clear Task Allocation Chart. Assign team members, visualize task completion, and streamline planning in one editable slide. Perfect for managing responsibilities across departments or sprints, this layout keeps teams aligned. Fully customizable in PowerPoint, Keynote, and Google Slides for professional and agile teams.


6 diapositivas
Efficient Scheduling and Time Management Presentation
Stay on time and on target with the Efficient Scheduling and Time Management presentation slide. Designed with smartwatch graphics showing time progression, this layout visually emphasizes planning, deadlines, and time-based tasks. Ideal for outlining agendas, productivity methods, or resource allocation strategies. Each time block includes editable text fields for key milestones or steps. Compatible with PowerPoint, Keynote, and Google Slides.


6 diapositivas
Process Direction Flow Mapping
Showcase linear progress with clarity using the Process Direction Flow Mapping Presentation. This layout features a clean, step-by-step directional flow with five stages, ideal for outlining project phases, business workflows, or timeline milestones. Each stage is color-coded with editable text areas, making it easy to customize and adapt for PowerPoint, Keynote, or Google Slides.


7 diapositivas
Scope Management and Planning Presentation
Ensure clear project scope definition with the Scope Management and Planning Presentation. This structured template highlights key elements of project scope, responsibilities, and deliverables using an intuitive layout. Ideal for project managers, business analysts, and teams aligning project goals. Fully editable and compatible with PowerPoint, Keynote, and Google Slides.


6 diapositivas
Pathway and Options Framework Analysis Presentation
Navigate your business strategy with clarity using the Pathway and Options Framework Analysis Presentation. This slide features a horizontal hexagon progression that visually maps out five distinct stages or decision points. Ideal for illustrating phased development, strategic alternatives, or milestone-based planning. Each segment includes an icon and customizable title area for key data points. Use this clean, modern layout to engage stakeholders or clarify complex processes. Fully editable in PowerPoint, Keynote, and Google Slides.


6 diapositivas
Effective Leadership Decision-Making Presentation
Enhance decision-making clarity with this Effective Leadership Decision-Making template. Designed for managers, executives, and strategists, this slide visually represents decision paths, prioritization, and leadership impact. Featuring color-coded options and engaging graphics, it helps illustrate the influence of choices on business outcomes. Fully compatible with PowerPoint, Keynote, and Google Slides, making it a seamless addition to your presentations.


6 diapositivas
Effective Team Structure Guide Presentation
Visualize your team's structure with clarity using this team guide presentation. Designed for highlighting roles, connections, and reporting lines, each slide helps communicate responsibilities and hierarchy efficiently. Ideal for HR, managers, and team leads. Fully editable in PowerPoint, Keynote, and Google Slides—customize colors, names, and positions with ease.


4 diapositivas
Simple RACI Matrix Overview Presentation
Bring instant clarity to every role with a clean, puzzle-style layout designed to map responsibilities without confusion. This presentation helps teams outline who leads, supports, approves, and stays informed in any project, turning tasks into a simple visual grid. Fully editable and compatible with PowerPoint, Keynote, and Google Slides.

23 diapositivas
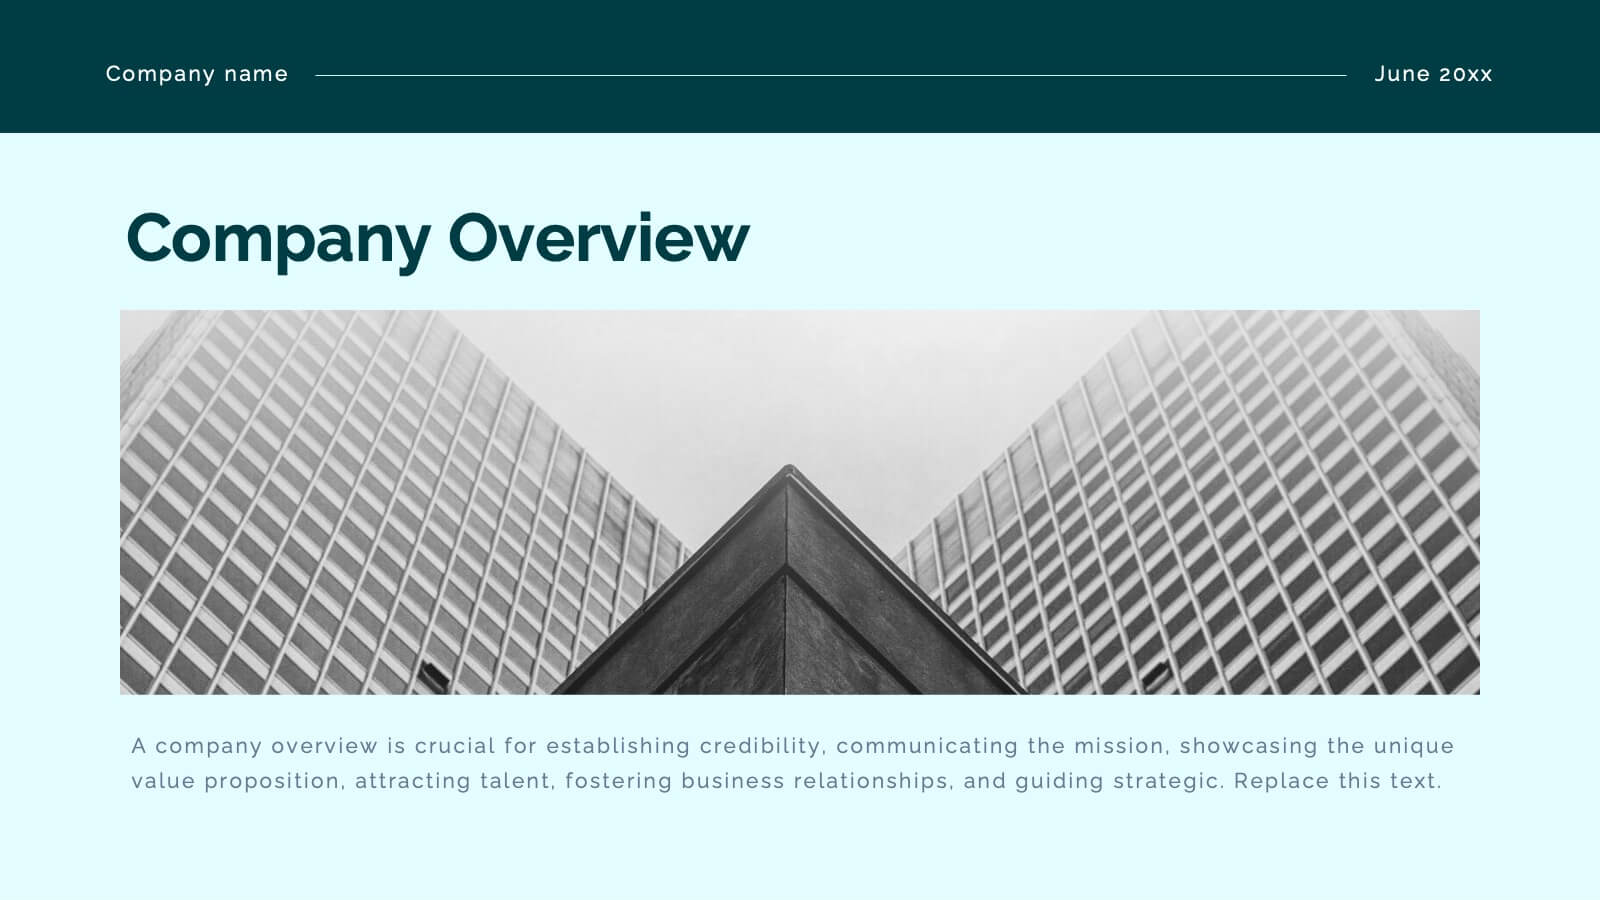
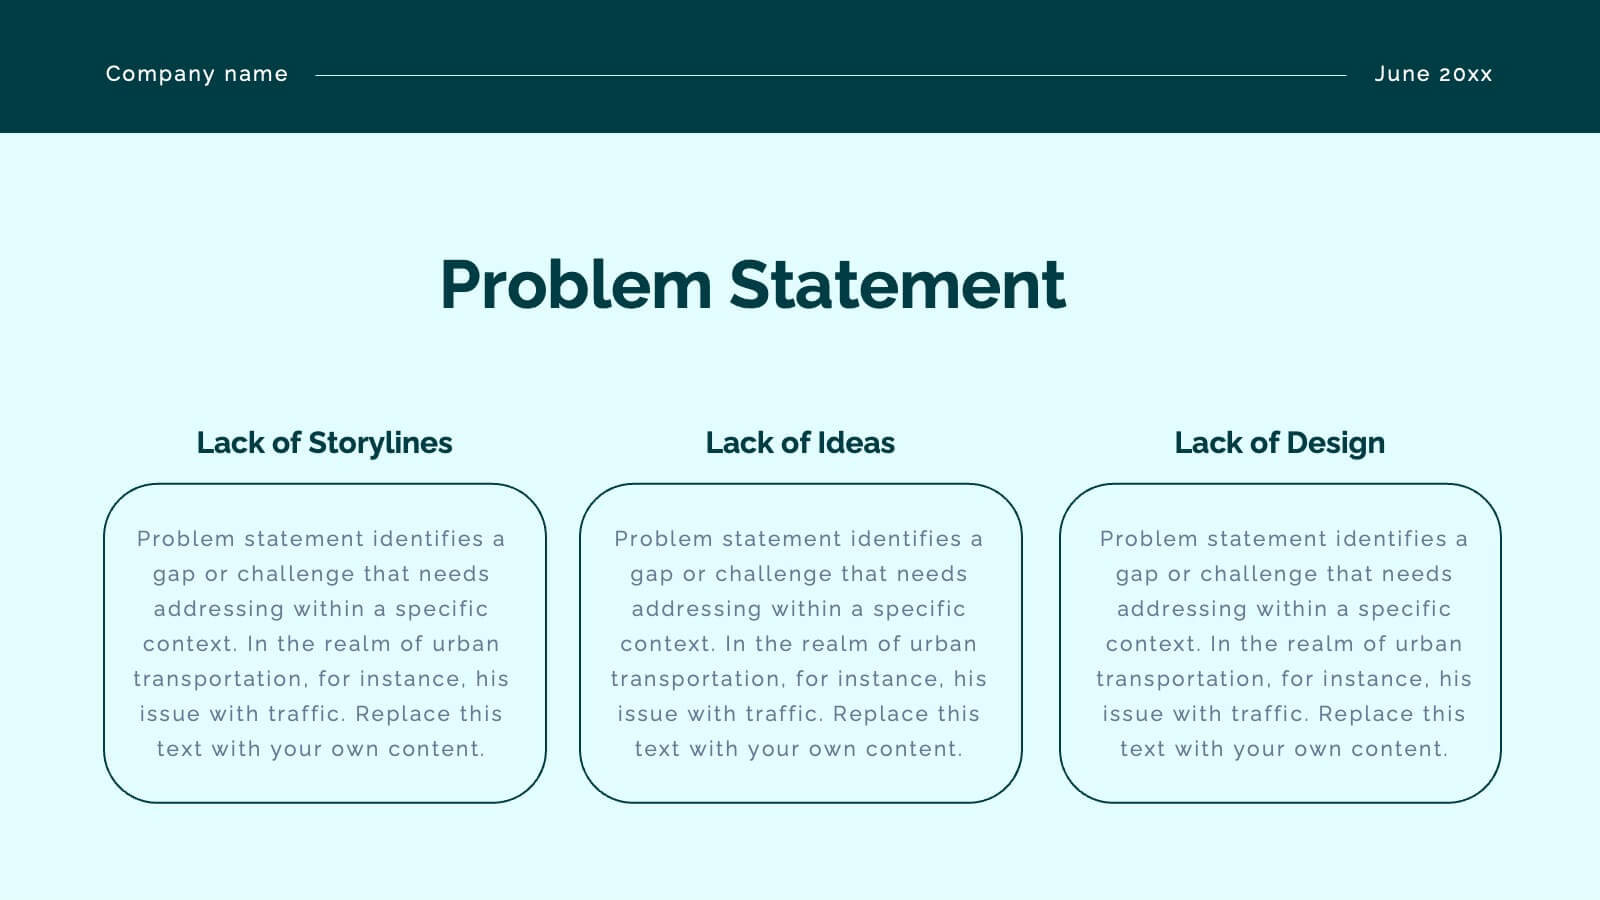
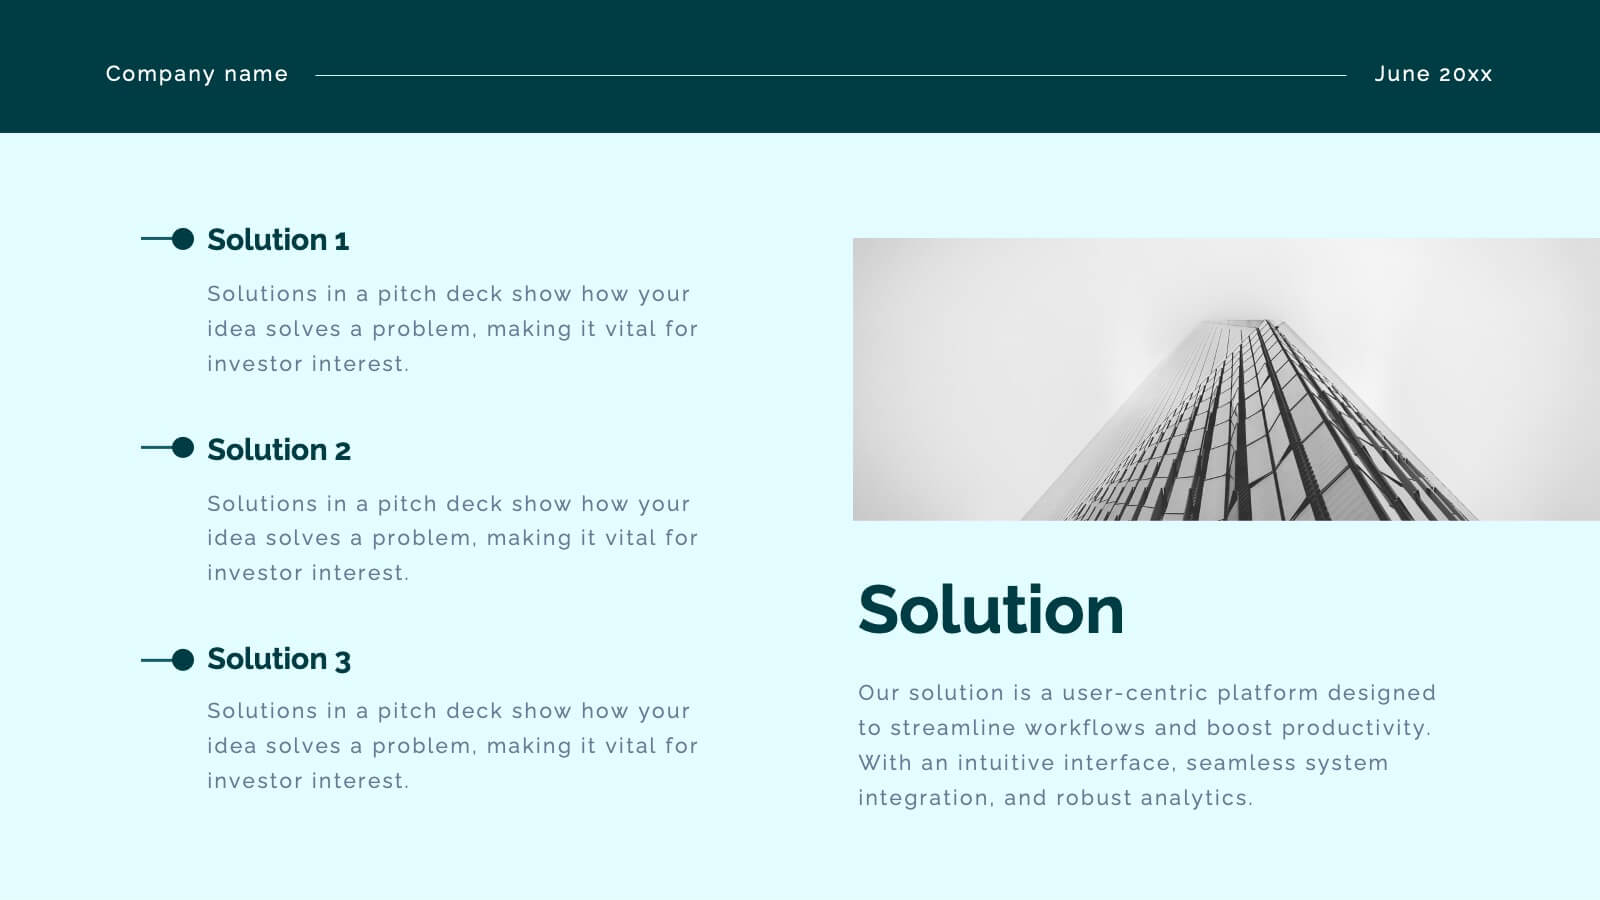
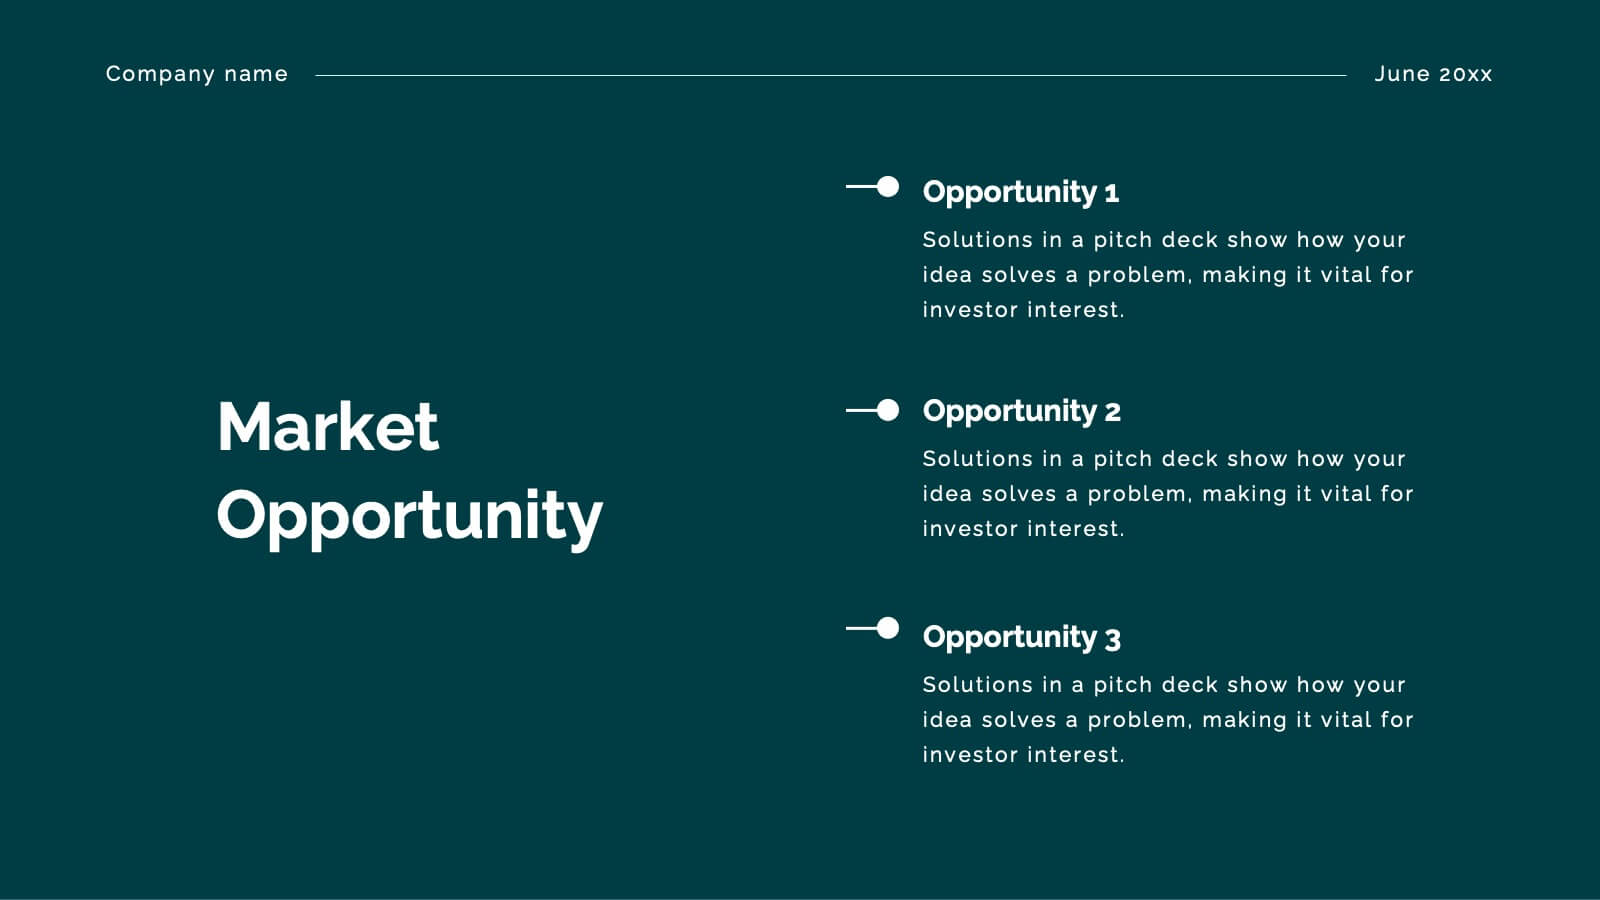
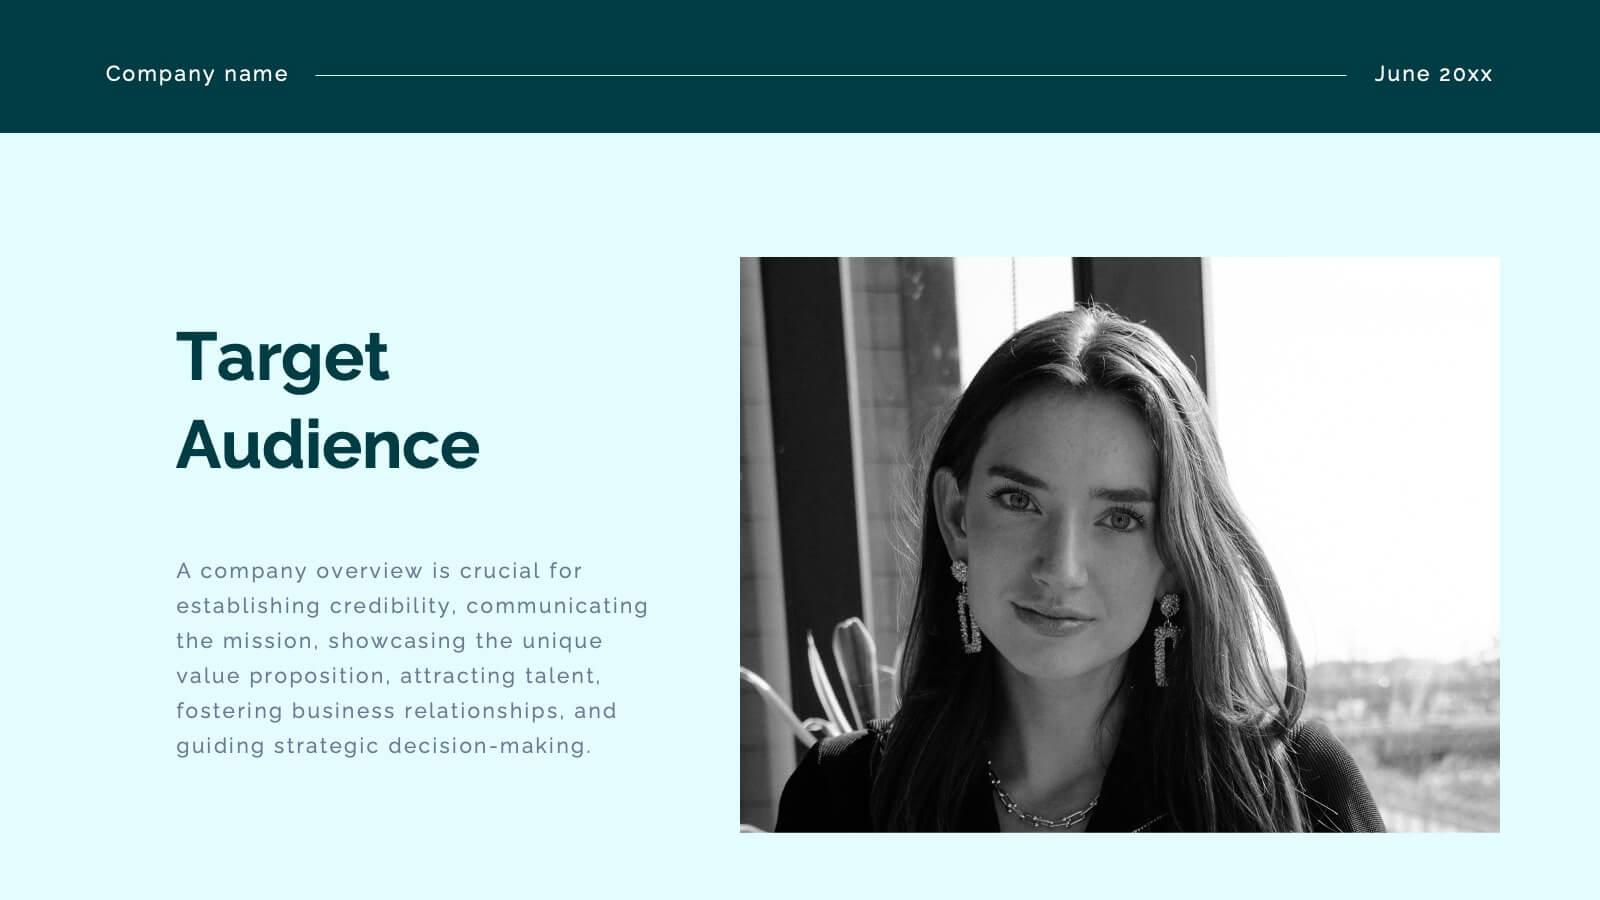
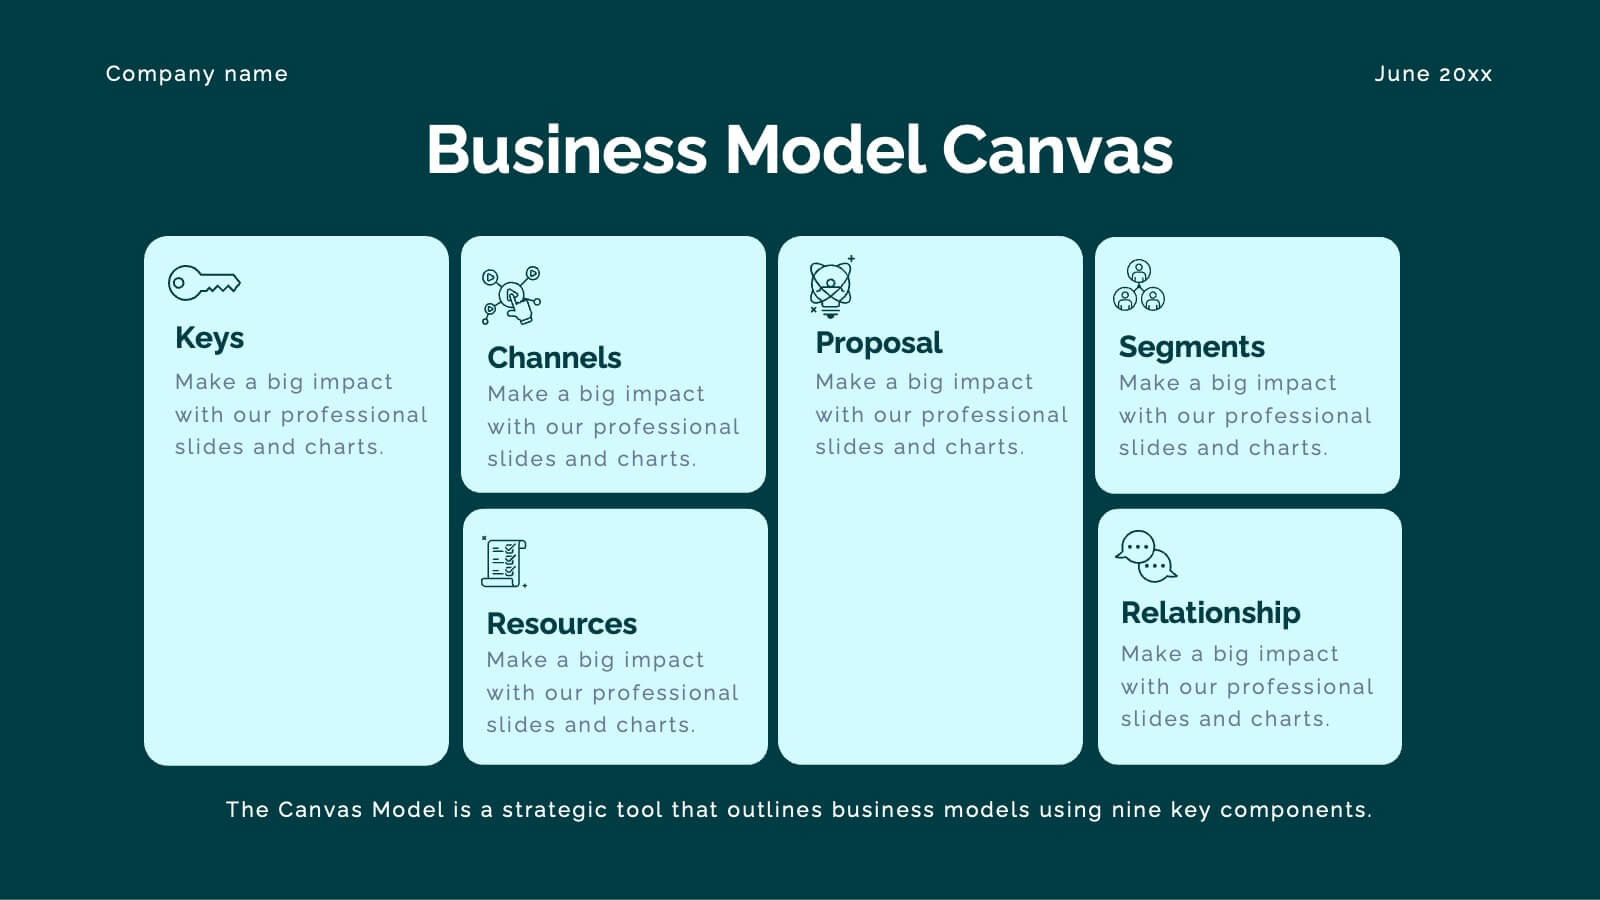
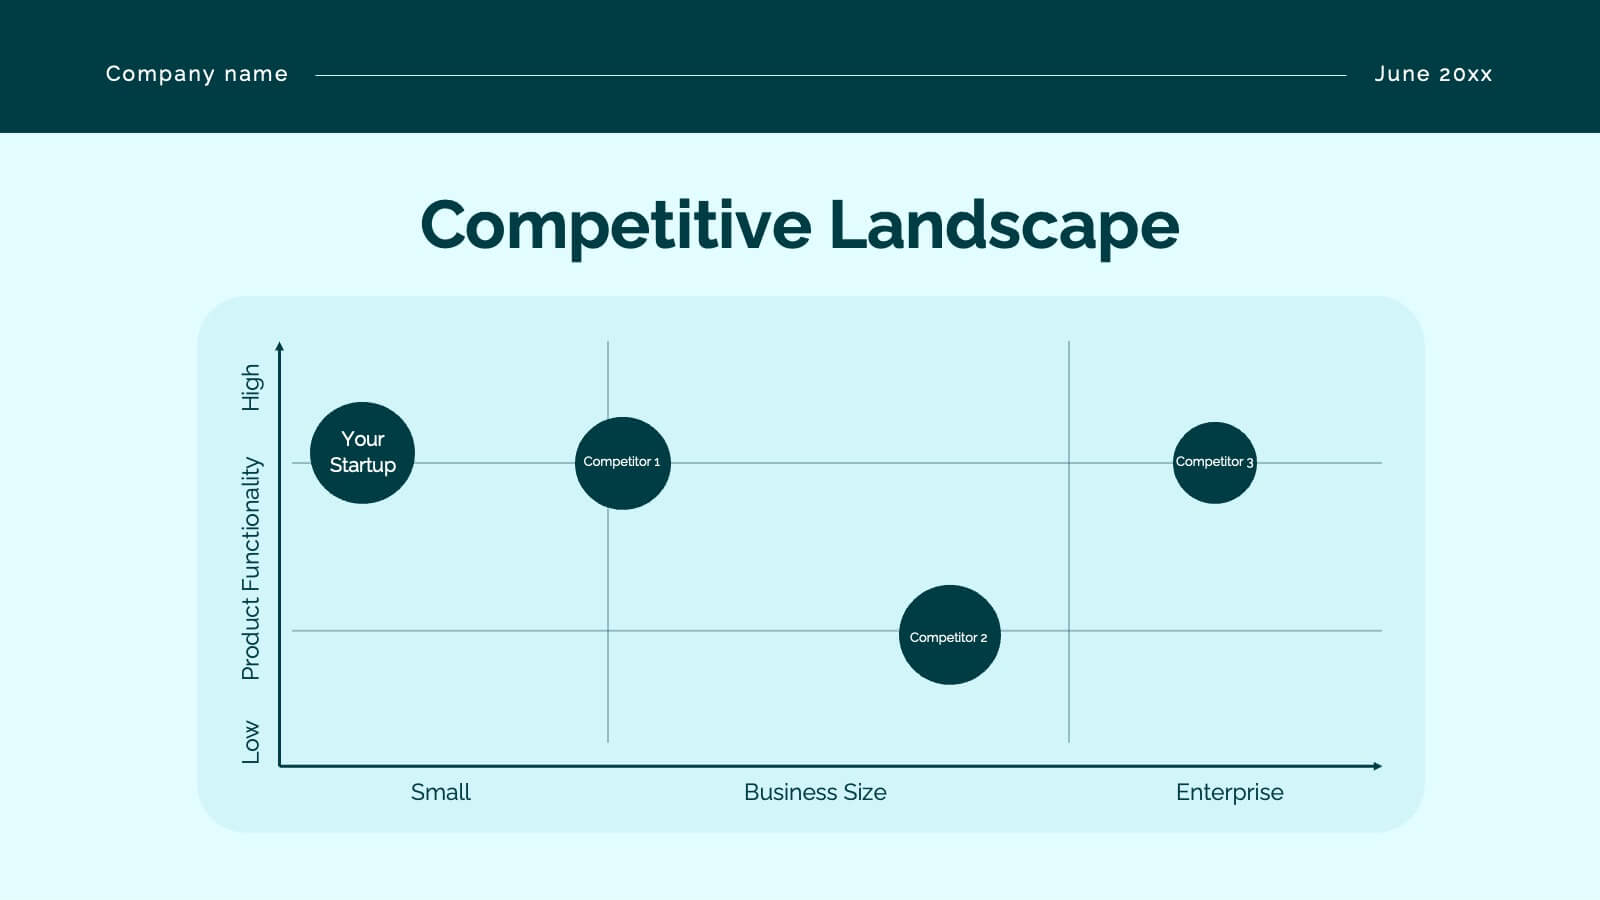
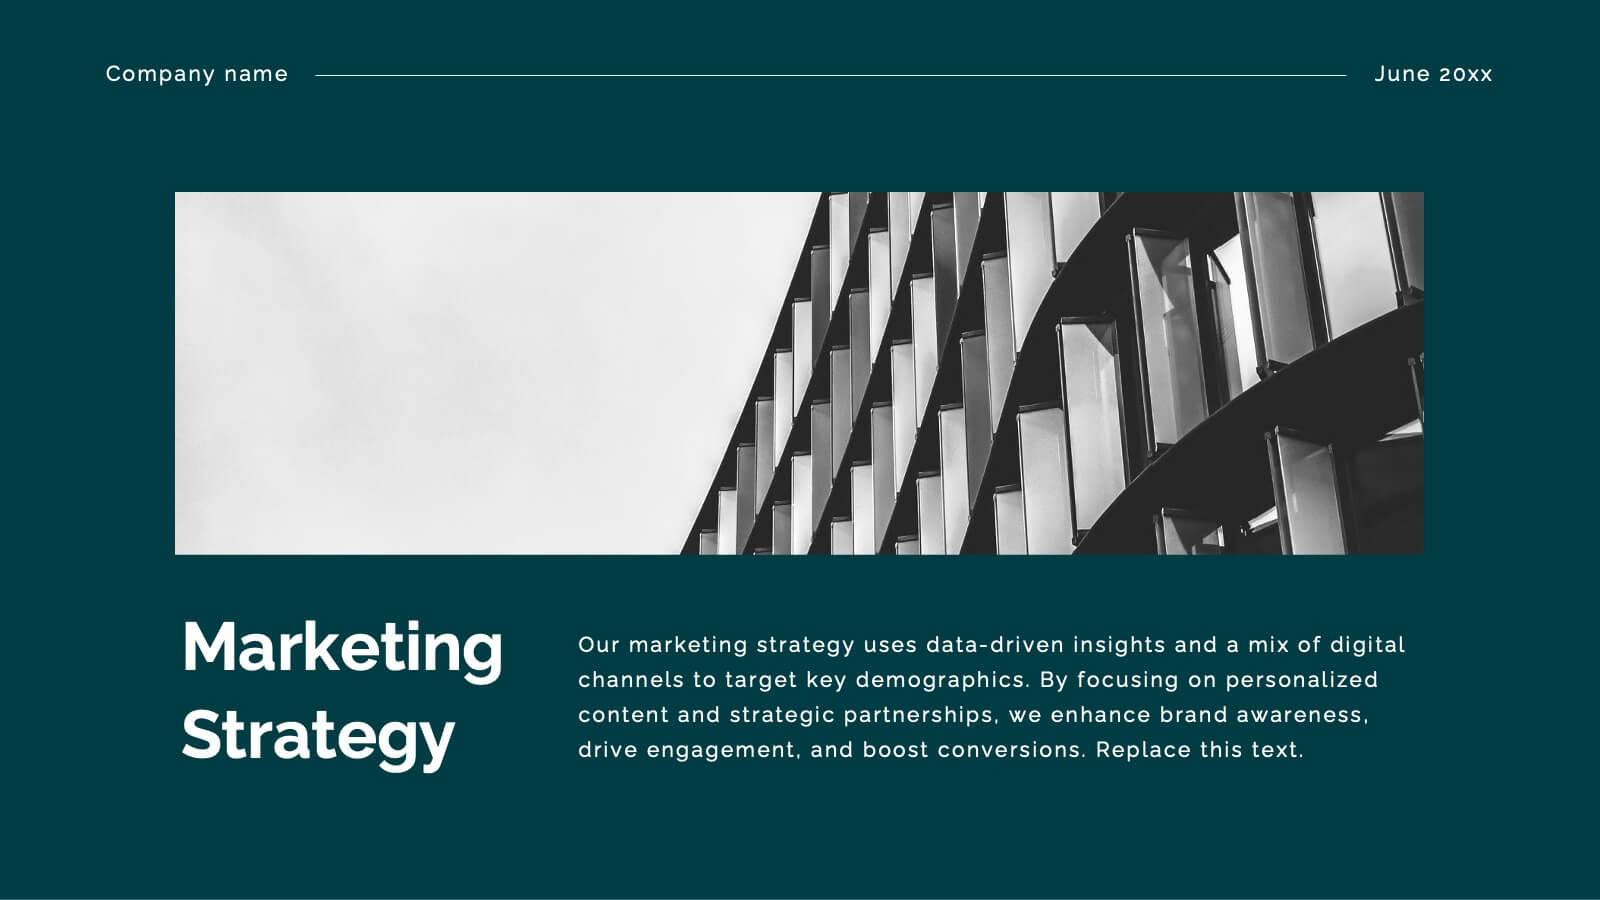
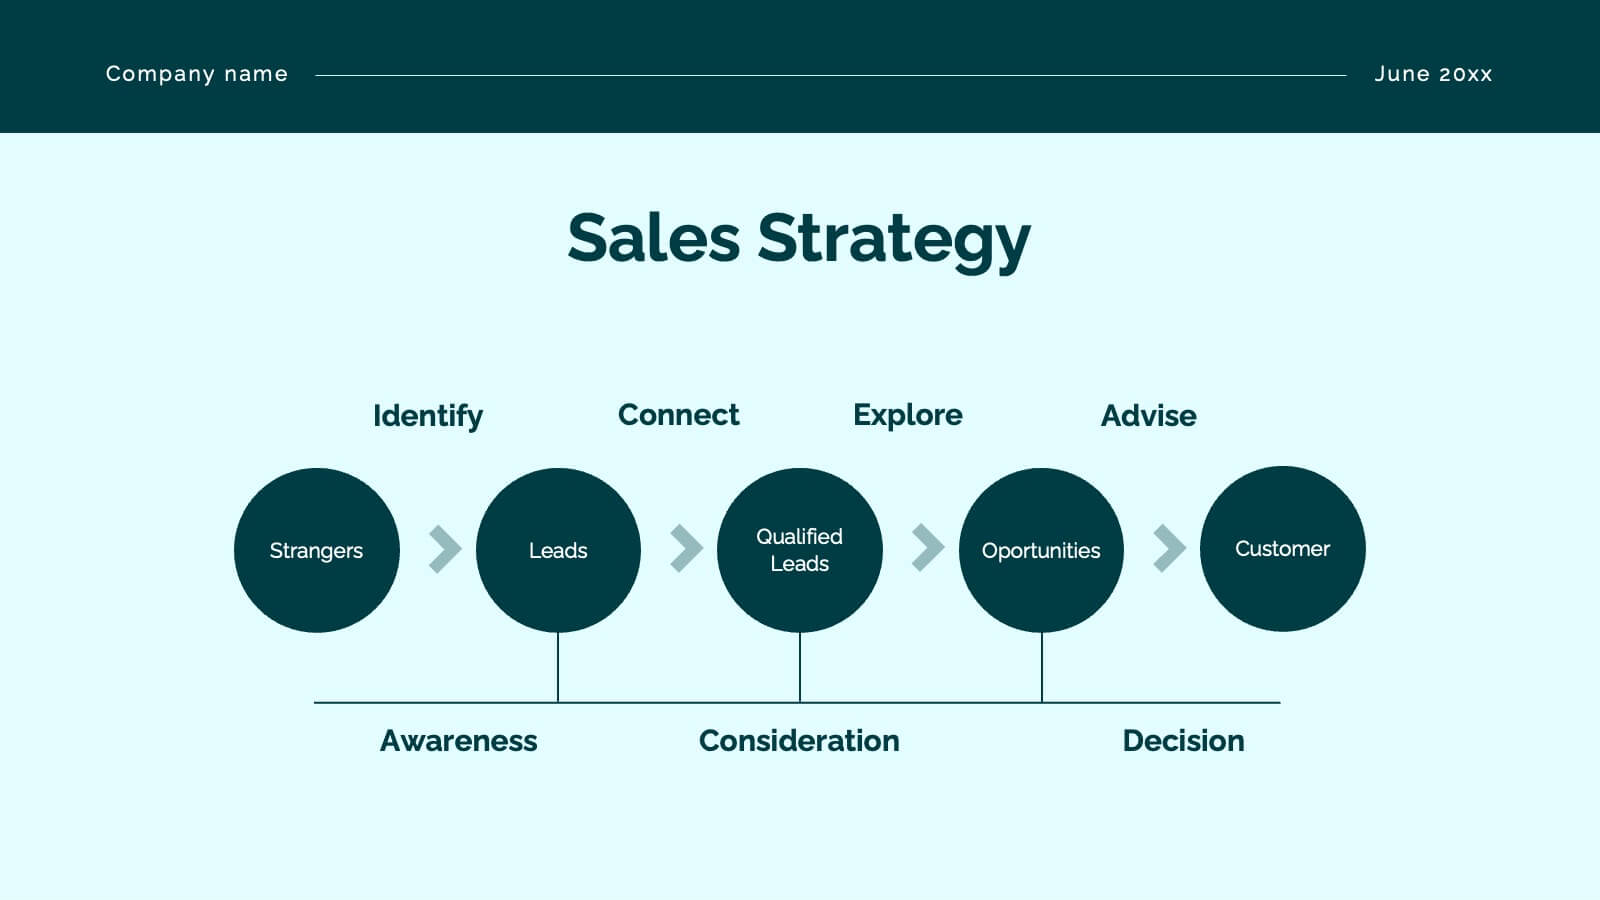
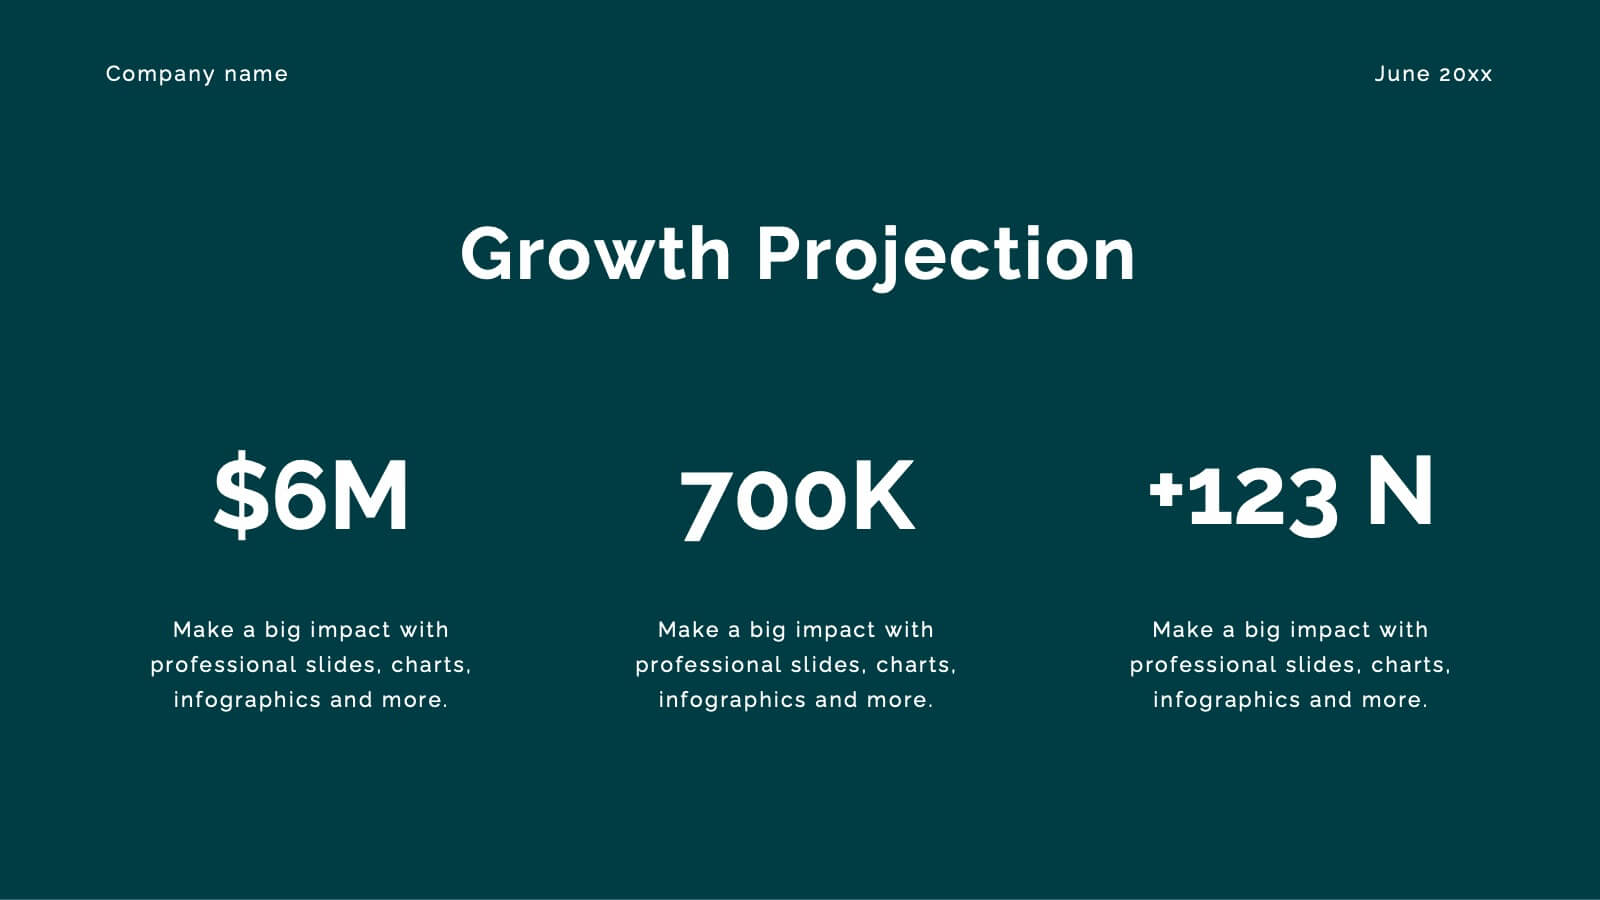
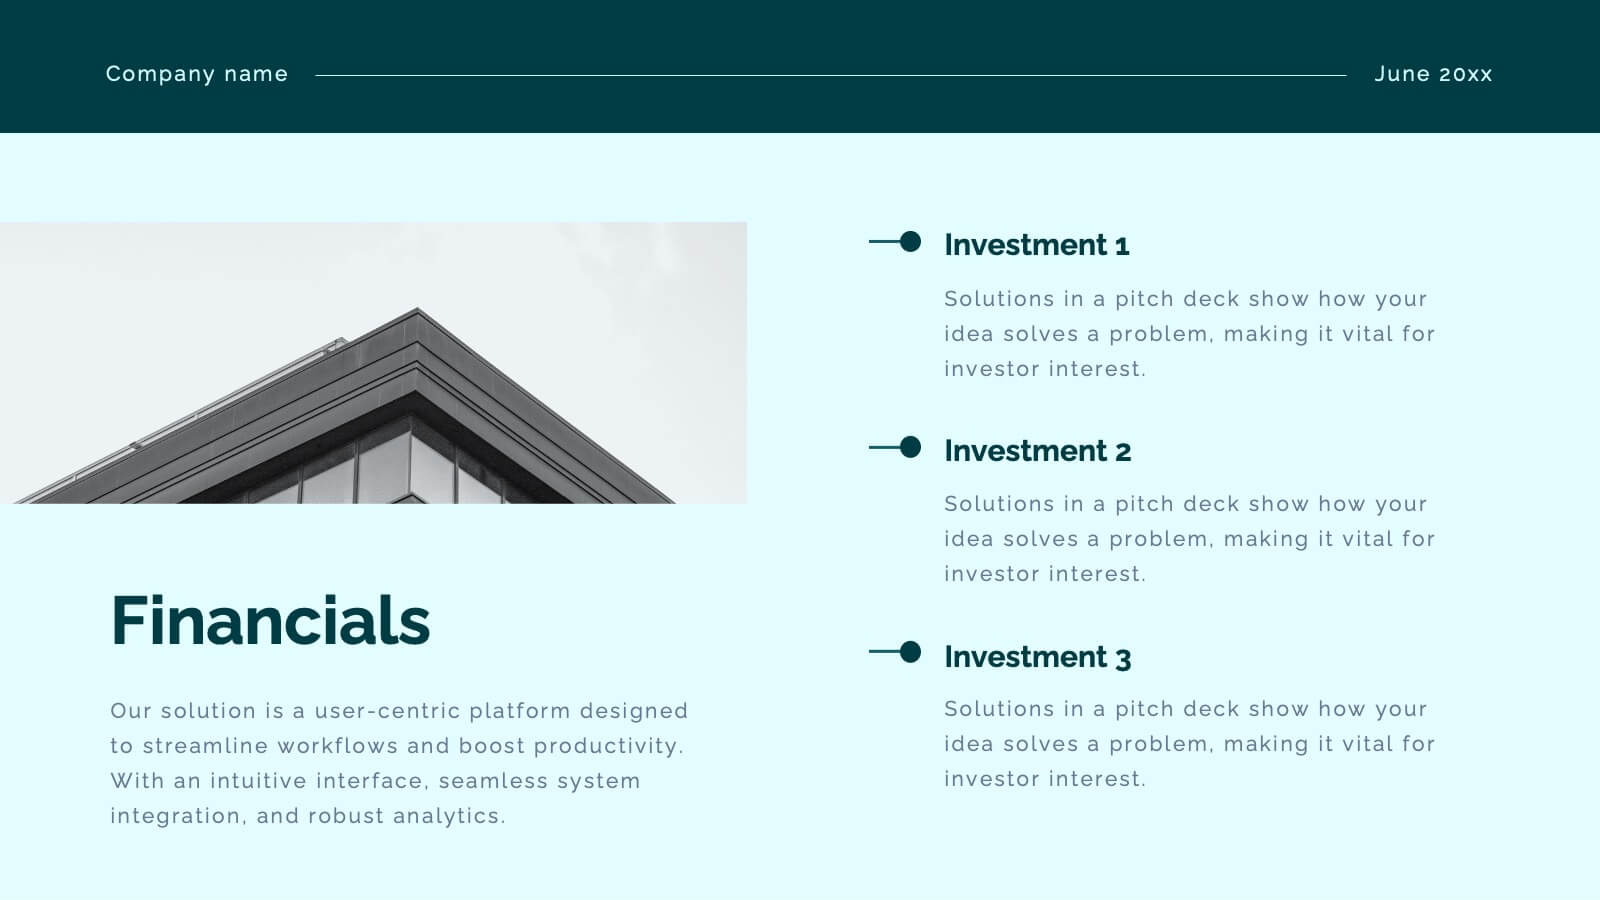
Crest Investor Pitch Presentation Presentation
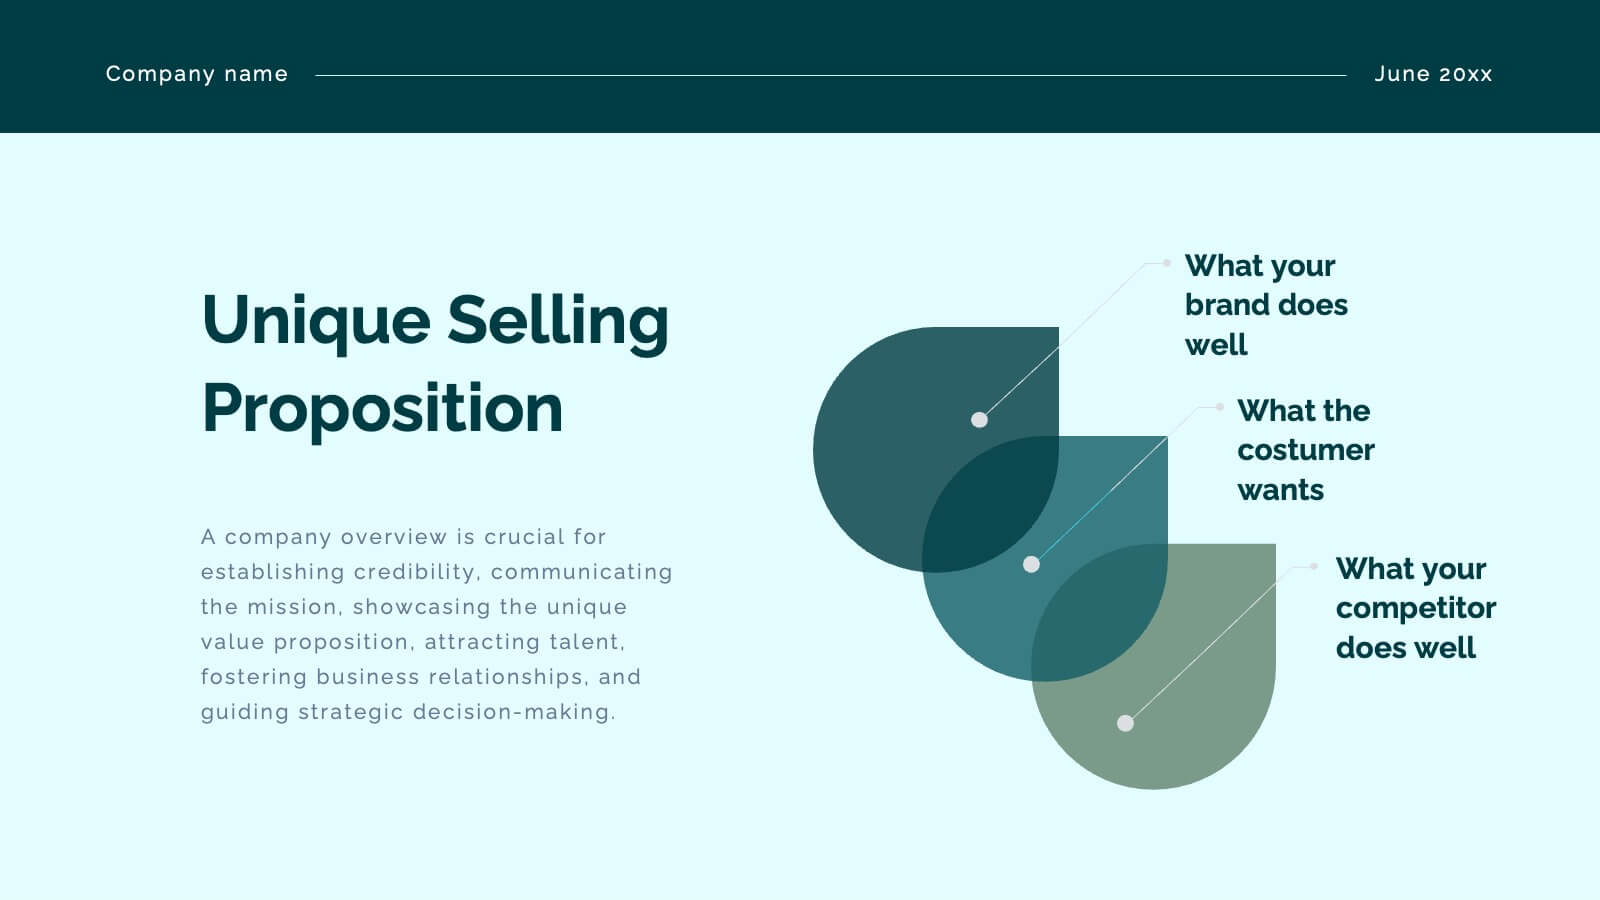
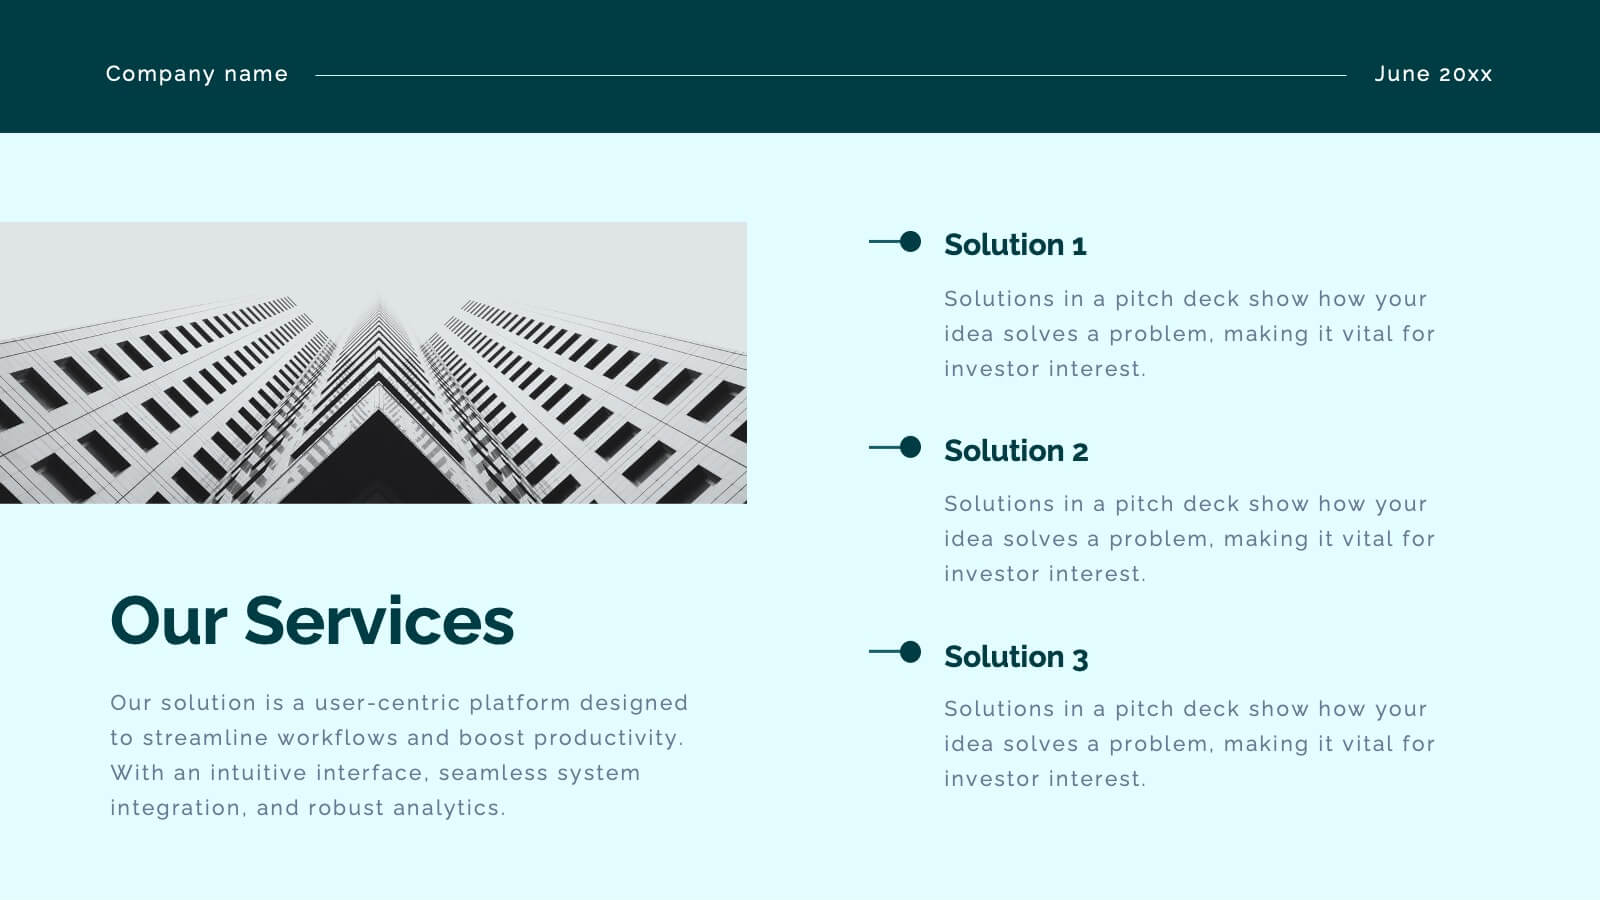
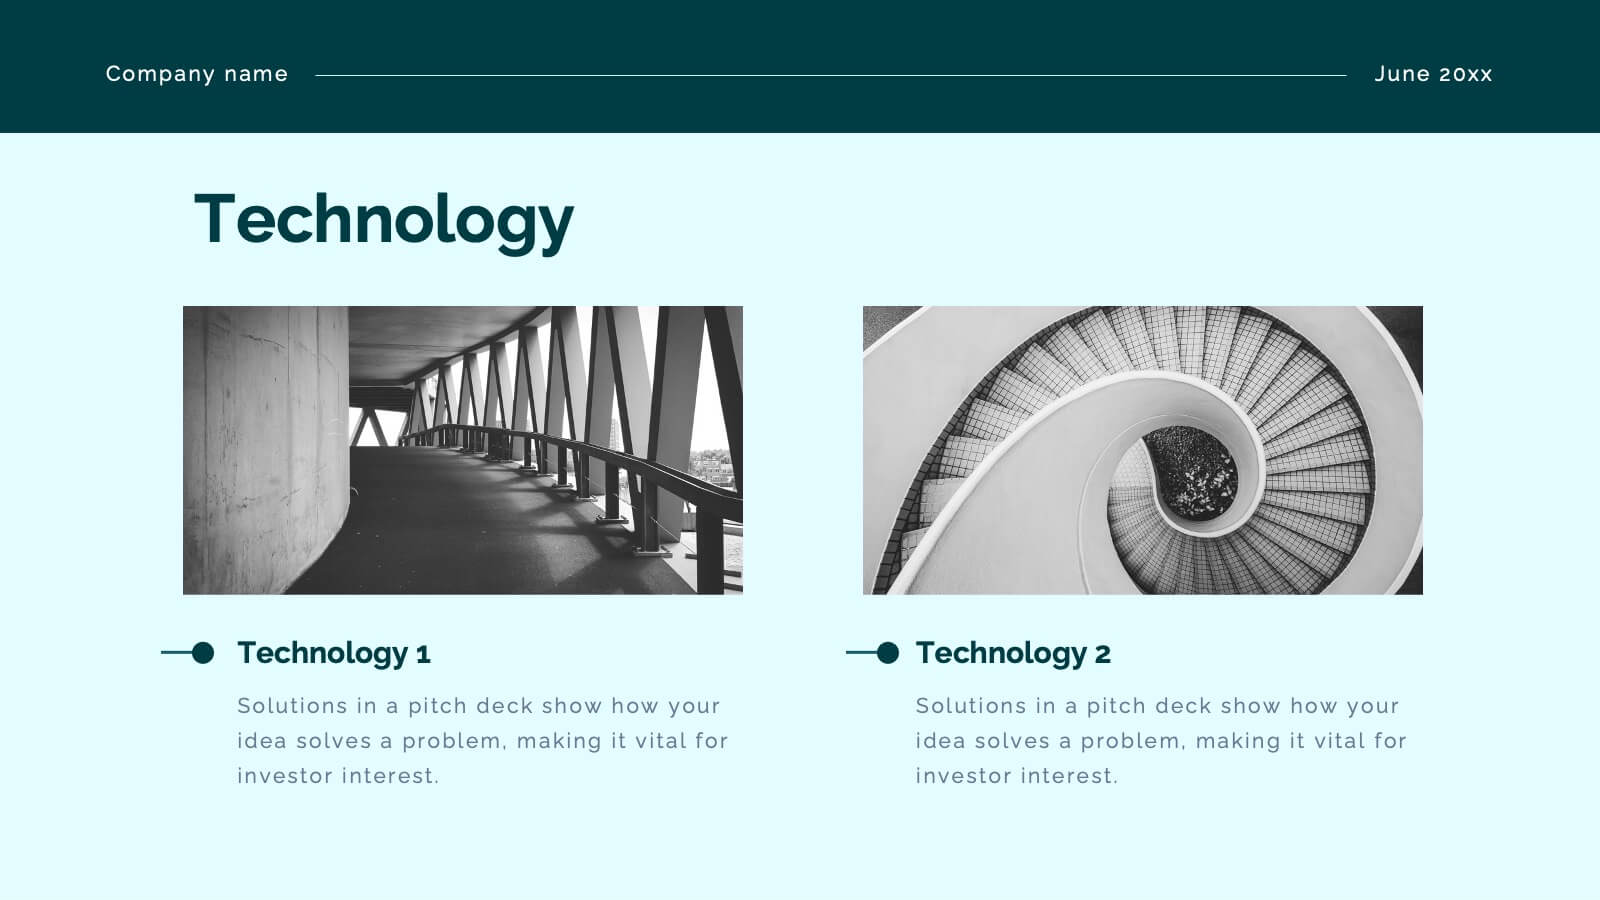
Unleash your potential with this powerful pitch deck template! Tailored for presenting innovative business ideas, it features slides for company overview, market opportunity, competitive landscape, and financial projections. Clearly communicate your value proposition and impress investors with professional design and concise content. Compatible with PowerPoint, Keynote, and Google Slides for seamless presentations on any platform.


6 diapositivas
Brain Development Infographic
Brain Development refers to the growth, maturation, and organization of the brain throughout an individual's life, starting from early prenatal stages and continuing into adulthood. This infographic template serves as a valuable educational resource for educators, parents, healthcare professionals, and anyone interested in understanding the fascinating process of brain development. This infographic highlights the stages and factors that shape brain growth, to help promote awareness and emphasize the importance of creating supportive environments for brain development. Compatible with Powerpoint, Keynote, and Google Slides.


6 diapositivas
6-Step Business Process Presentation
Clearly map out workflows with this 6-step business process presentation. Ideal for project managers and strategists, this horizontal timeline helps break complex tasks into digestible phases. With editable icons, color highlights, and step-by-step layout, it's easy to customize in PowerPoint, Keynote, or Google Slides for any professional setting.


7 diapositivas
Comparison Infographic Presentation Template
A comparison Infographic is a visual representation that compares two or more things. It's used to show the similarities and differences between items, ideas, or concepts. It can be used to compare different products, services, options, or even facts and figures. This template works with Powerpoint, Keynote and Google Slides, so you can use it on any computer. This template includes fun pictures and allows you to add your own. This template also has many different charts, graphs and boxes so you can enter your own information. Use this comparison template to compare anything you need.


21 diapositivas
Veridia Academic Research Report Presentation
Present your academic research findings with confidence using this sleek and modern presentation template. Covering essential sections such as research objectives, data analysis, key findings, and recommendations, it provides a structured approach to showcasing your study. Perfect for students and professionals. Compatible with PowerPoint, Keynote, and Google Slides for seamless customization.