


Características


¿Tienes alguna pregunta?
Recomendar


5 diapositivas
Pet Clinic Business Strategy Presentation
Enhance your pet clinic's approach with our Pet Clinic Business Strategy presentation template. This layout is expertly designed to outline your clinic’s key strategies and enhance your operational excellence, making it perfect for meetings, stakeholder presentations, and strategic workshops.


5 diapositivas
Fashion Design Infographics
Fashion Design is the art of creating clothing and accessories, incorporating elements of style, aesthetics, and functionality. These infographic templates offer a visually captivating and informative way to present key concepts, trends, and insights in the world of fashion design. This template is ideal for fashion designers, students, industry professionals, or anyone interested in sharing knowledge about fashion design principles, fashion history, or emerging trends. Featuring a stylish design that reflects the creative and dynamic nature of the fashion industry. This allows for easy customization and seamless integration of your fashion-related content.


26 diapositivas
Financial Planning Essentials Presentation
Take control of your financial destiny with our Financial Planning Essentials presentation template, suitable for PowerPoint, Keynote, and Google Slides. This template is meticulously designed for financial advisors, planners, and anyone seeking to educate on the principles of sound financial management. Our Financial Planning Essentials template is a rich resource that provides an extensive range of slides to explain the basics of financial planning, investment strategies, and wealth management. It allows you to break down financial concepts into easy-to-understand elements, making it perfect for client presentations, financial workshops, and educational seminars. Featuring customizable diagrams, charts, and financial models, the template enables a personalized approach to presenting financial data and strategies. Whether you're outlining budgeting techniques, investment plans, or retirement strategies, this template helps you communicate complex information in a clear and professional manner. Optimize your financial planning presentations with our SEO-friendly template to become a trusted resource in financial education and planning. Lead your audience toward financial freedom with a comprehensive and engaging presentation that simplifies the path to financial success.


6 diapositivas
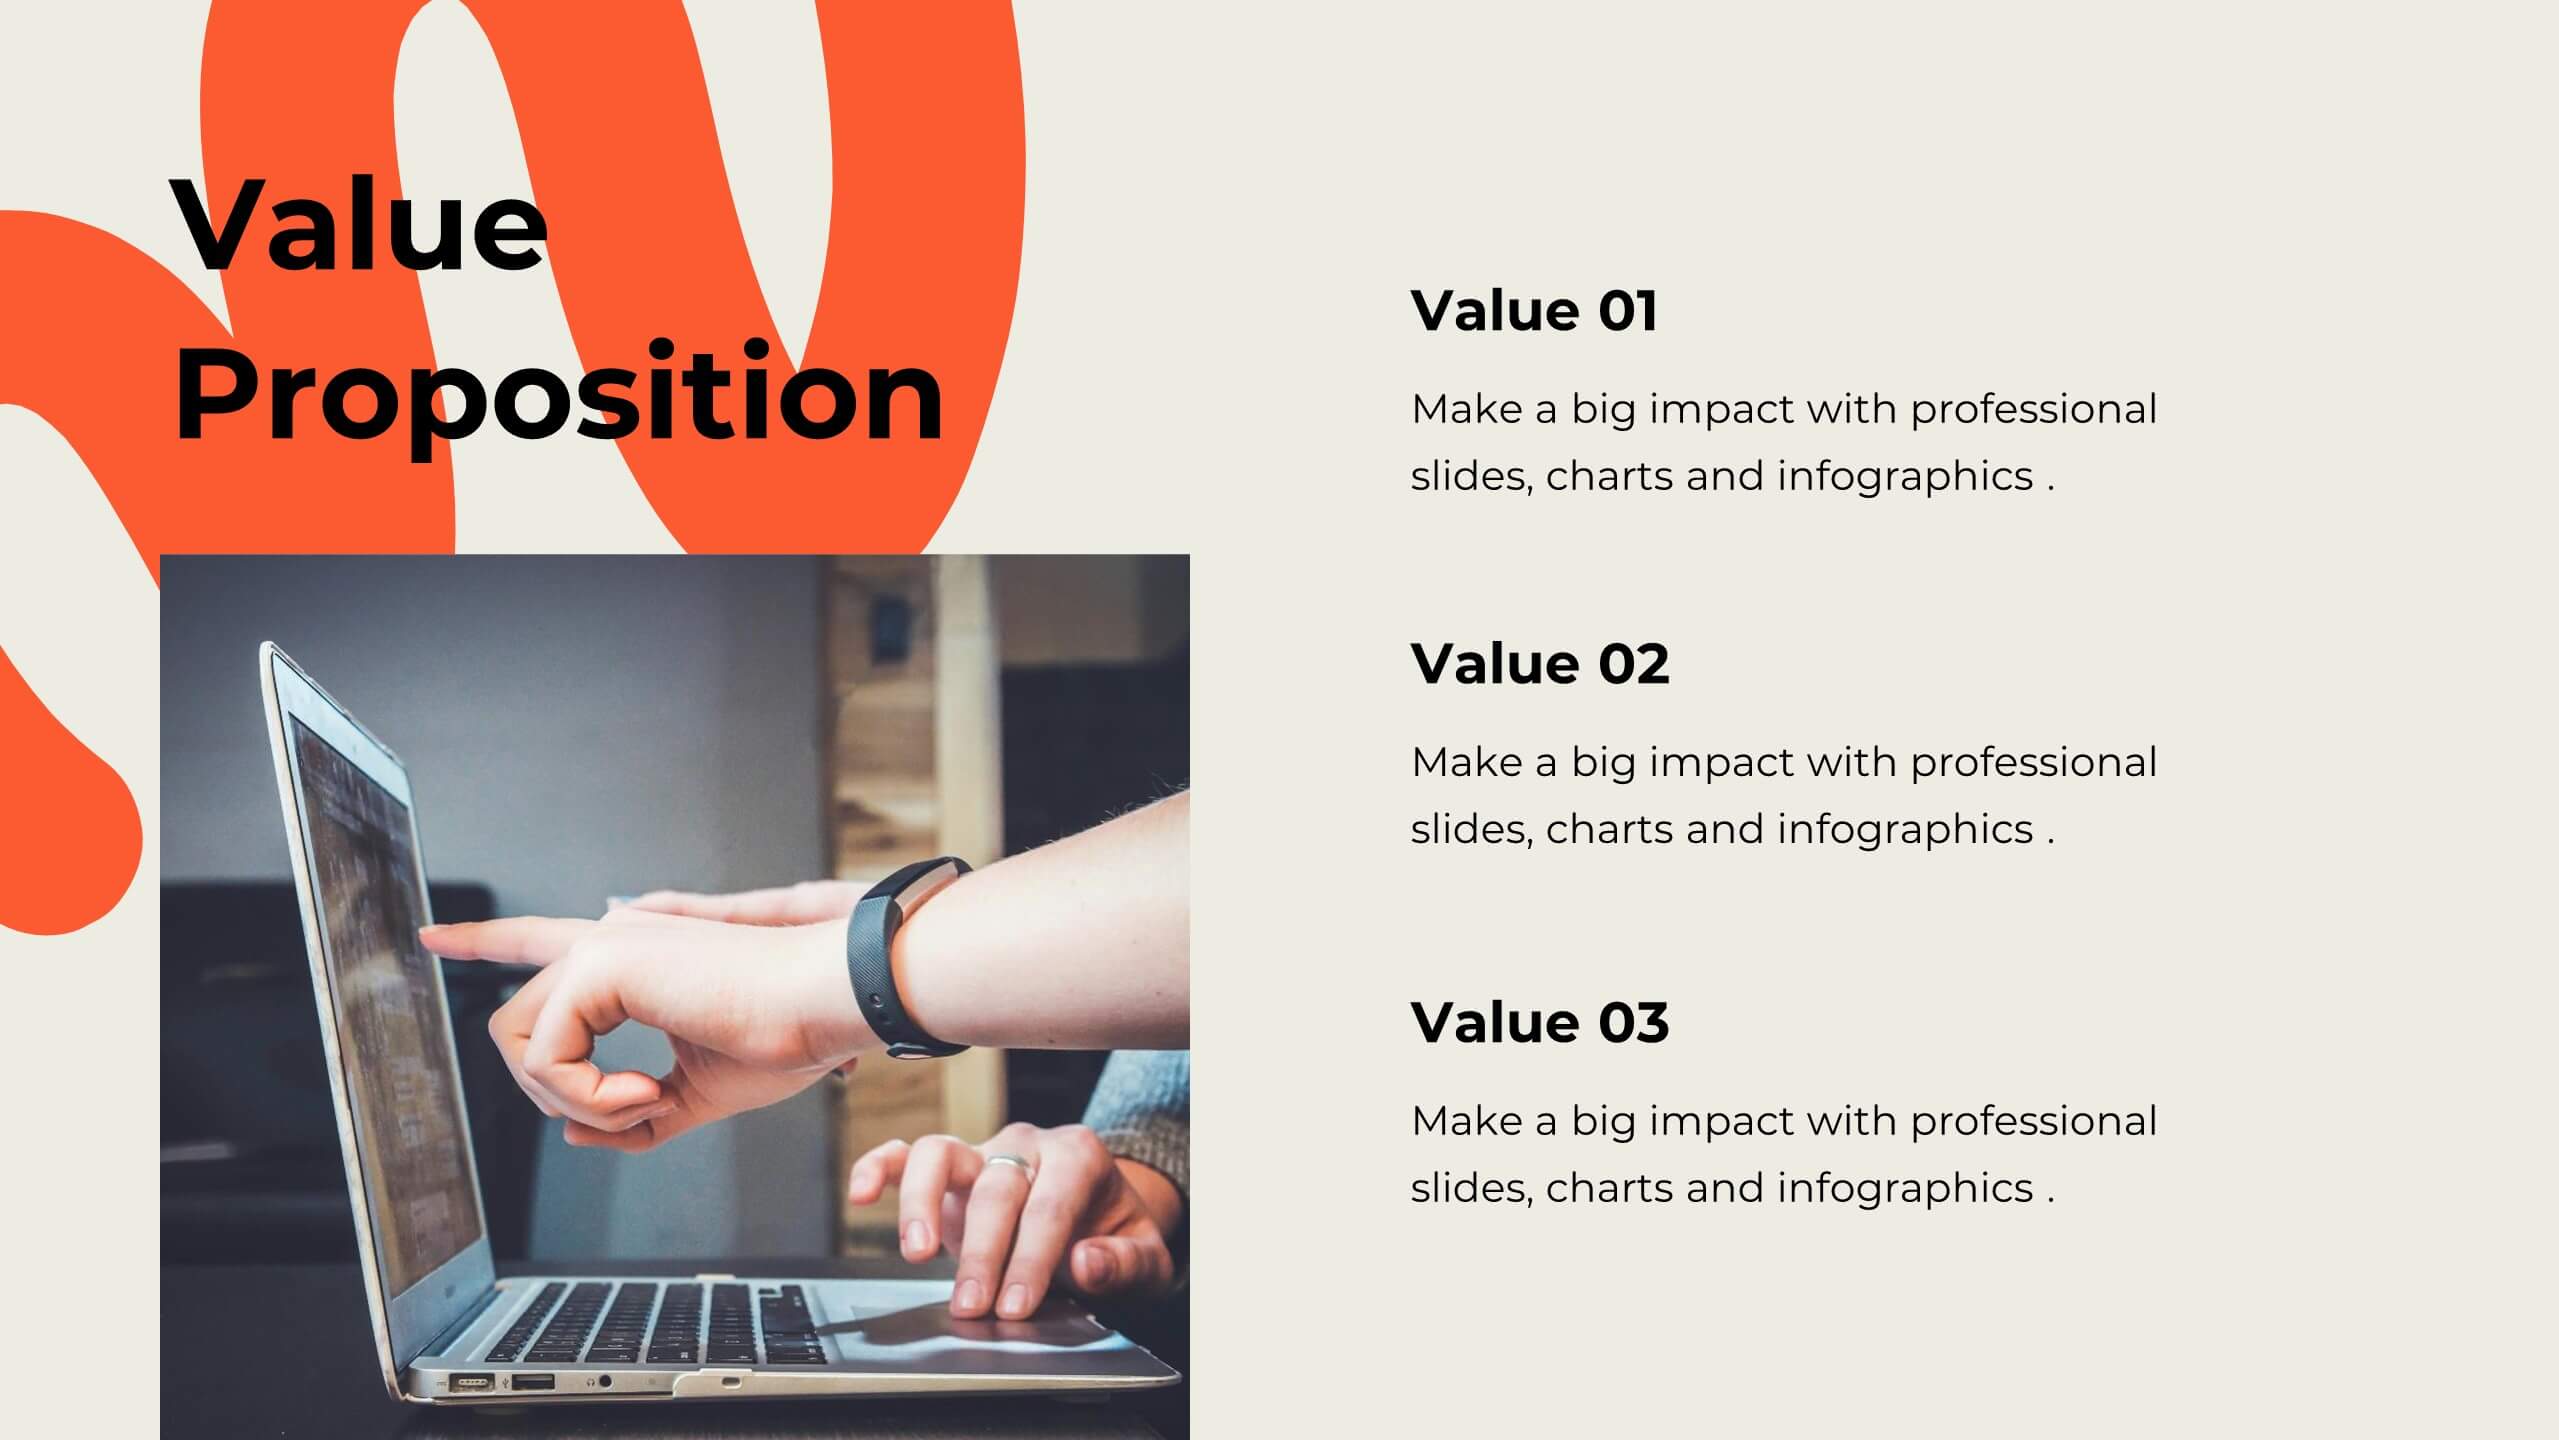
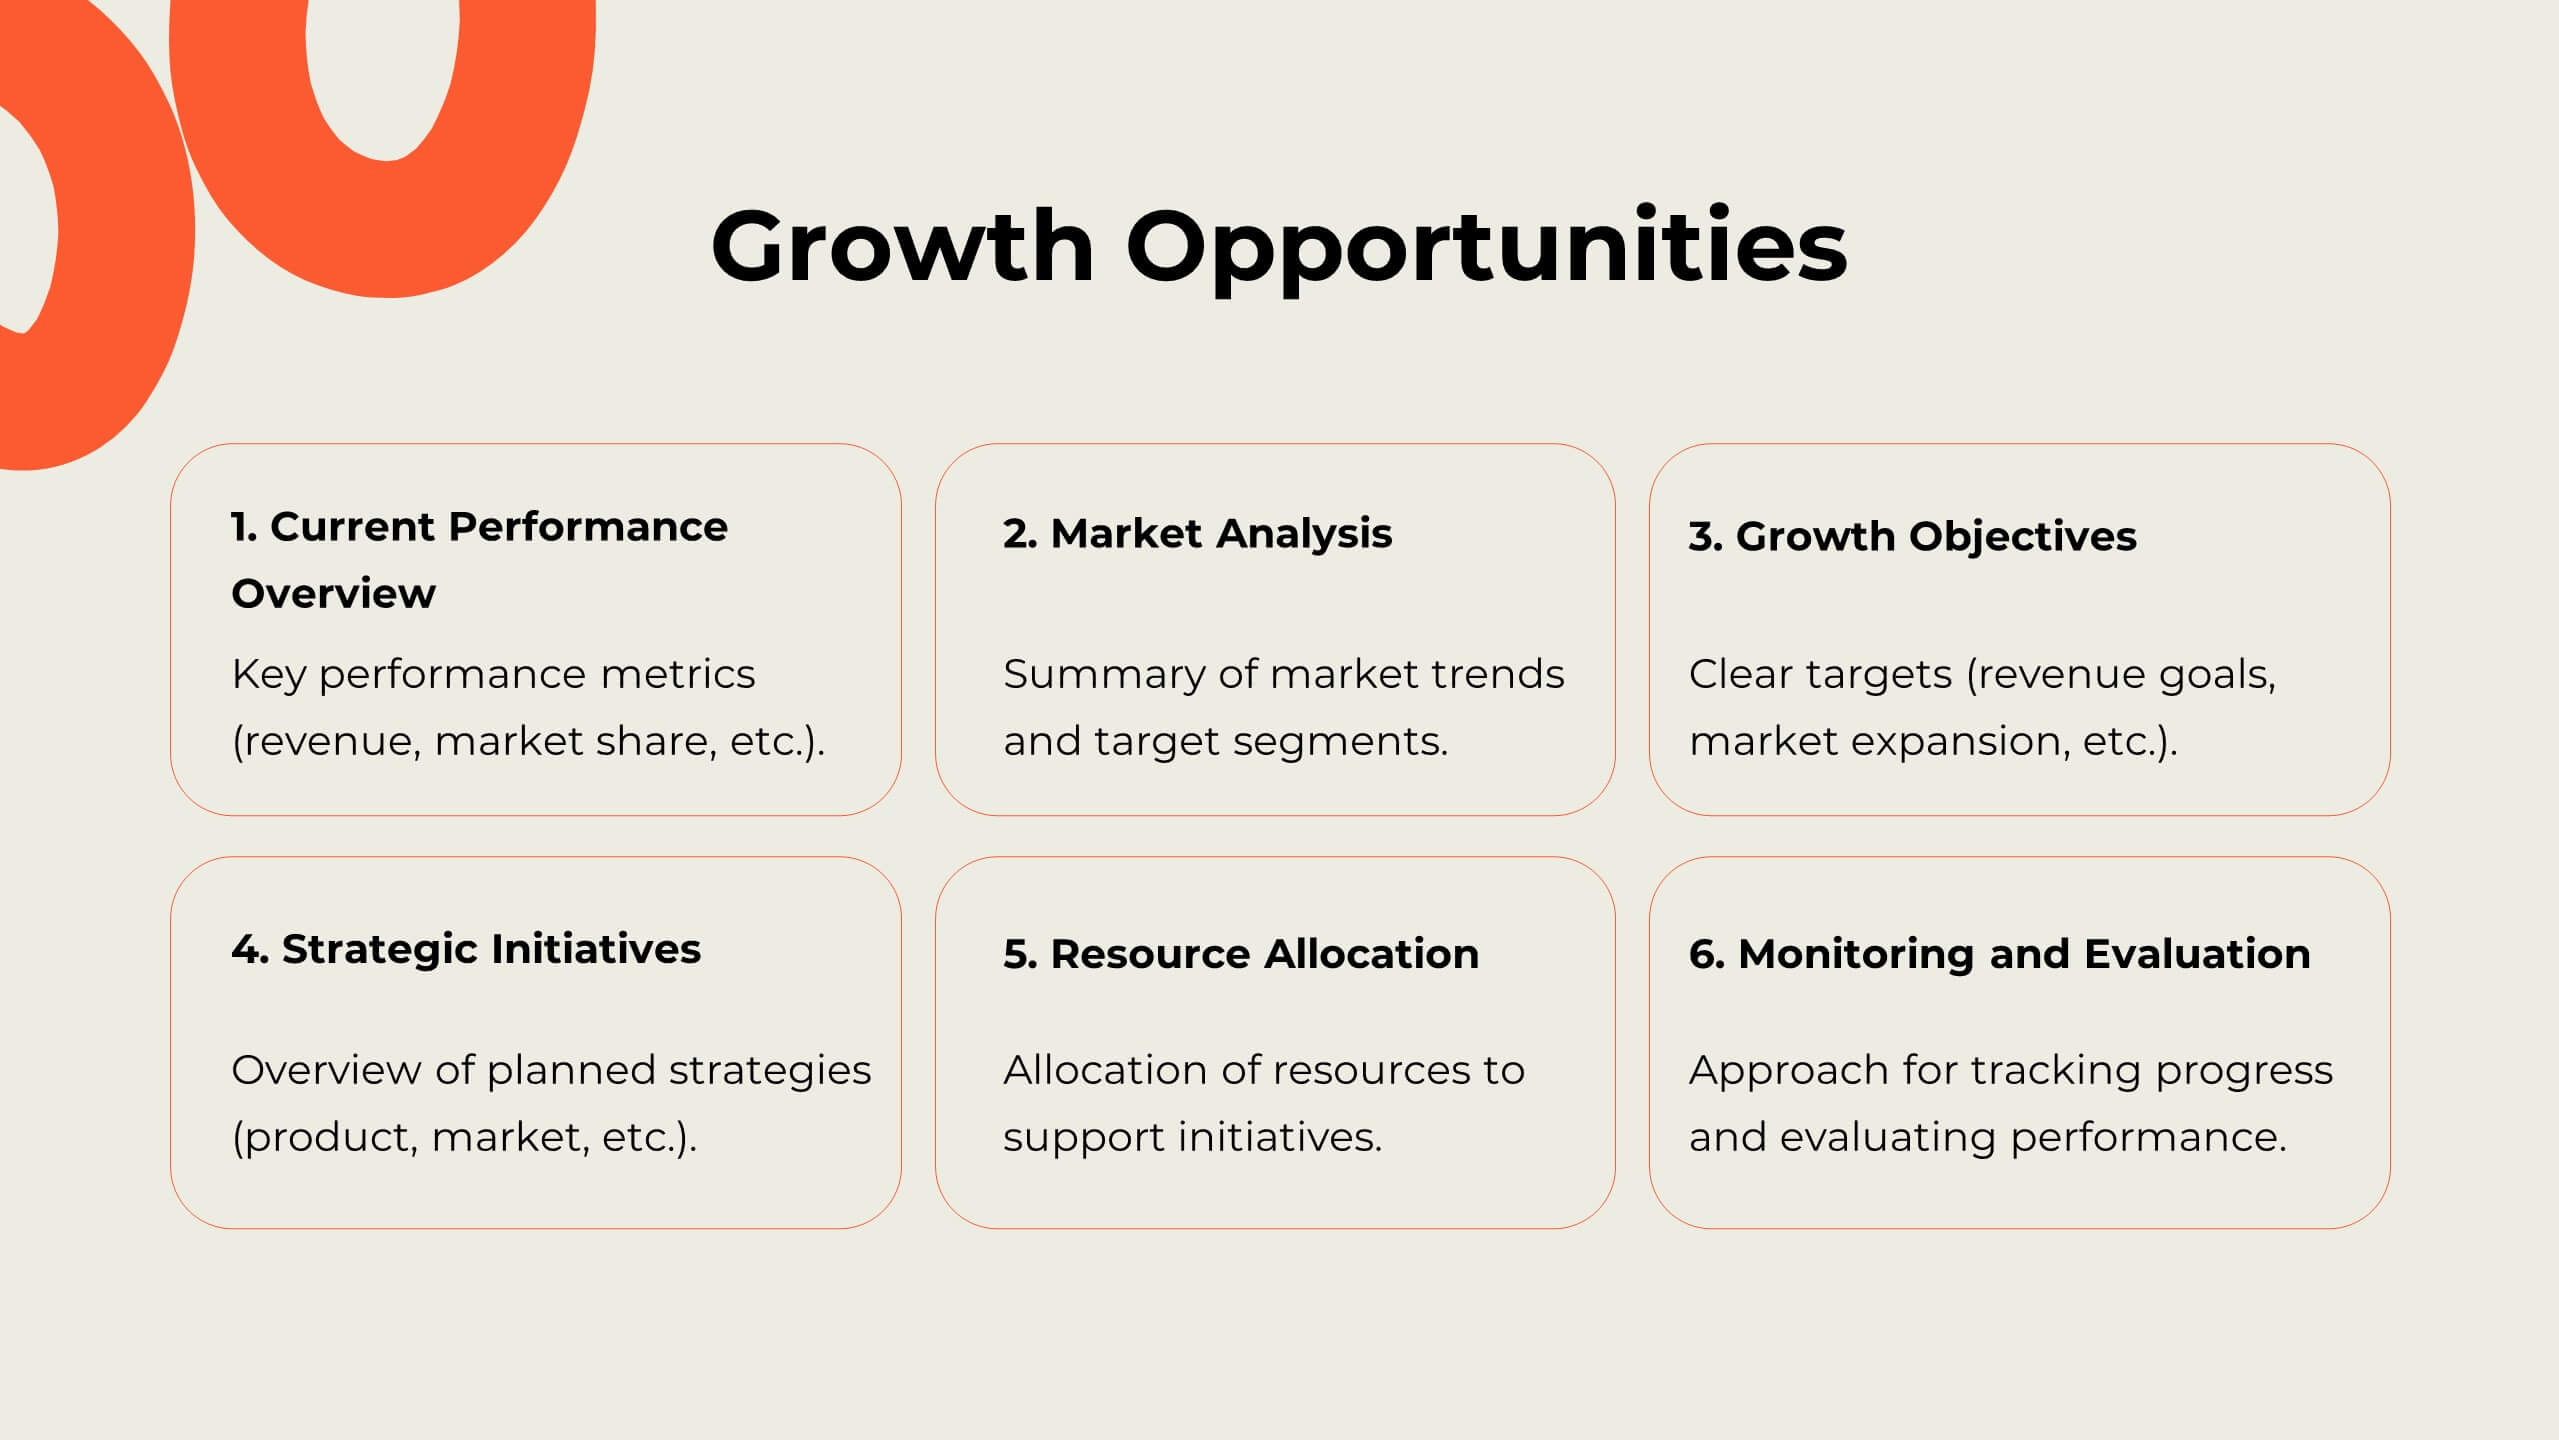
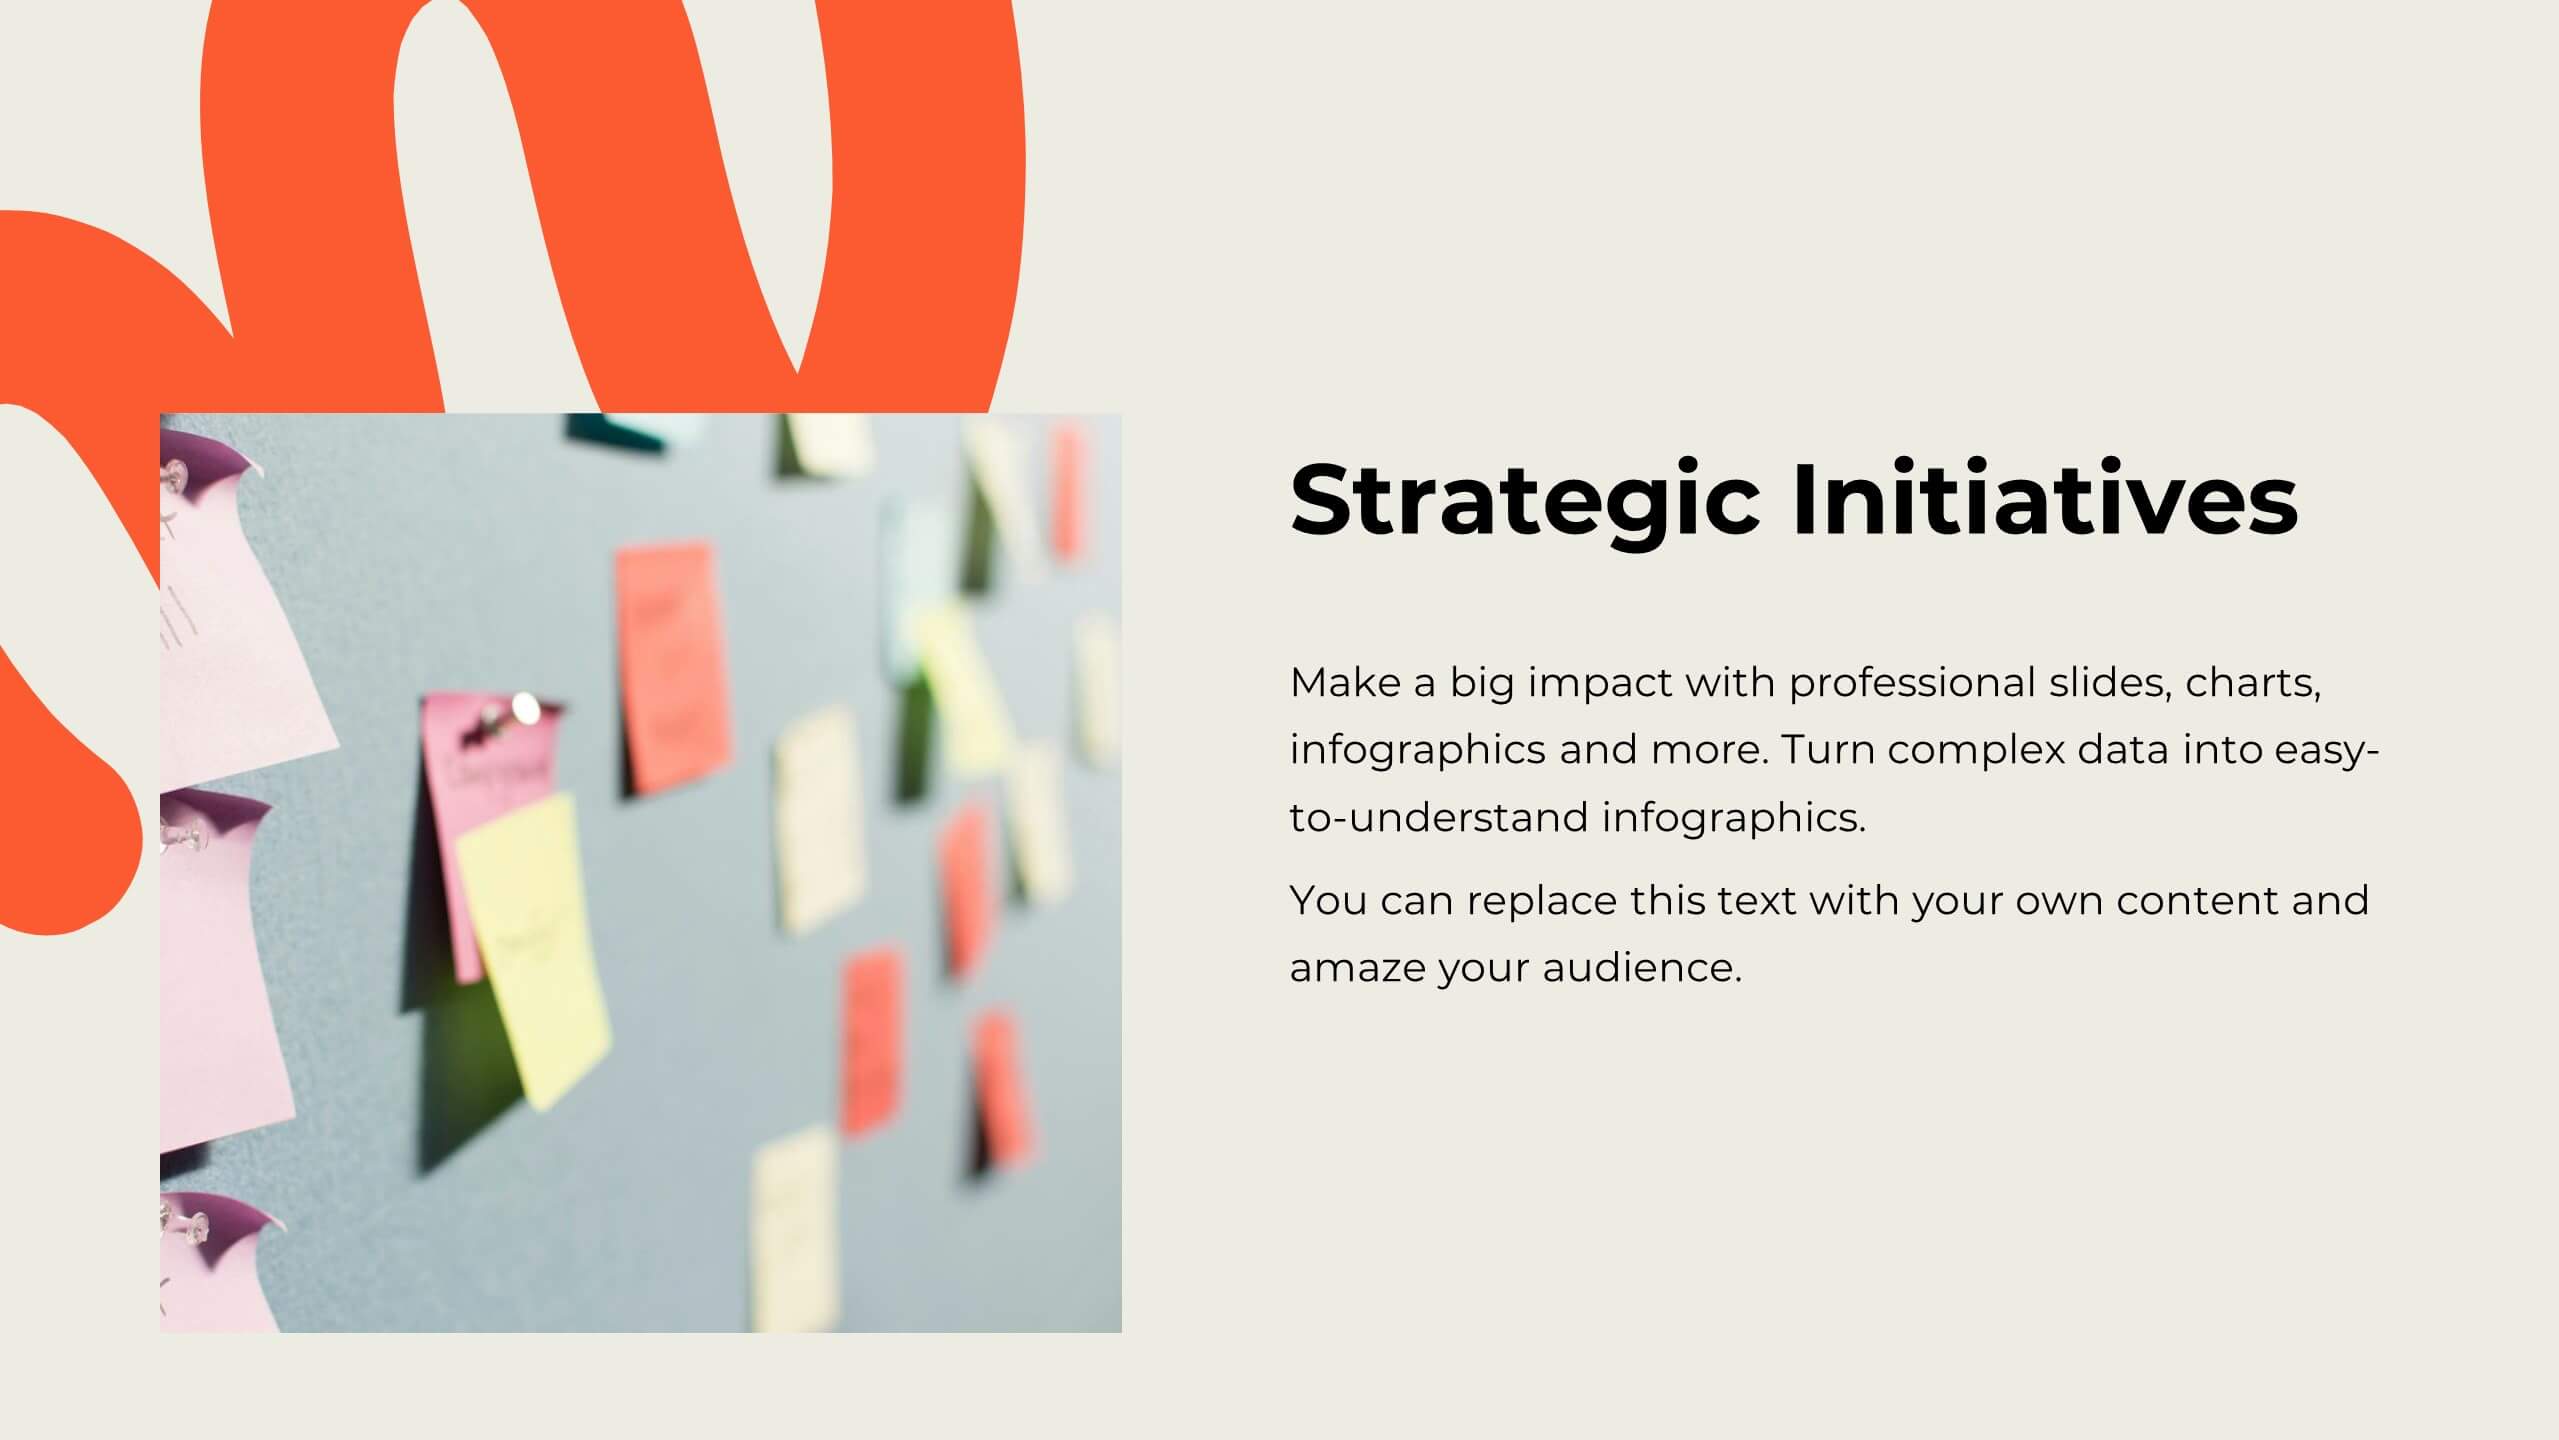
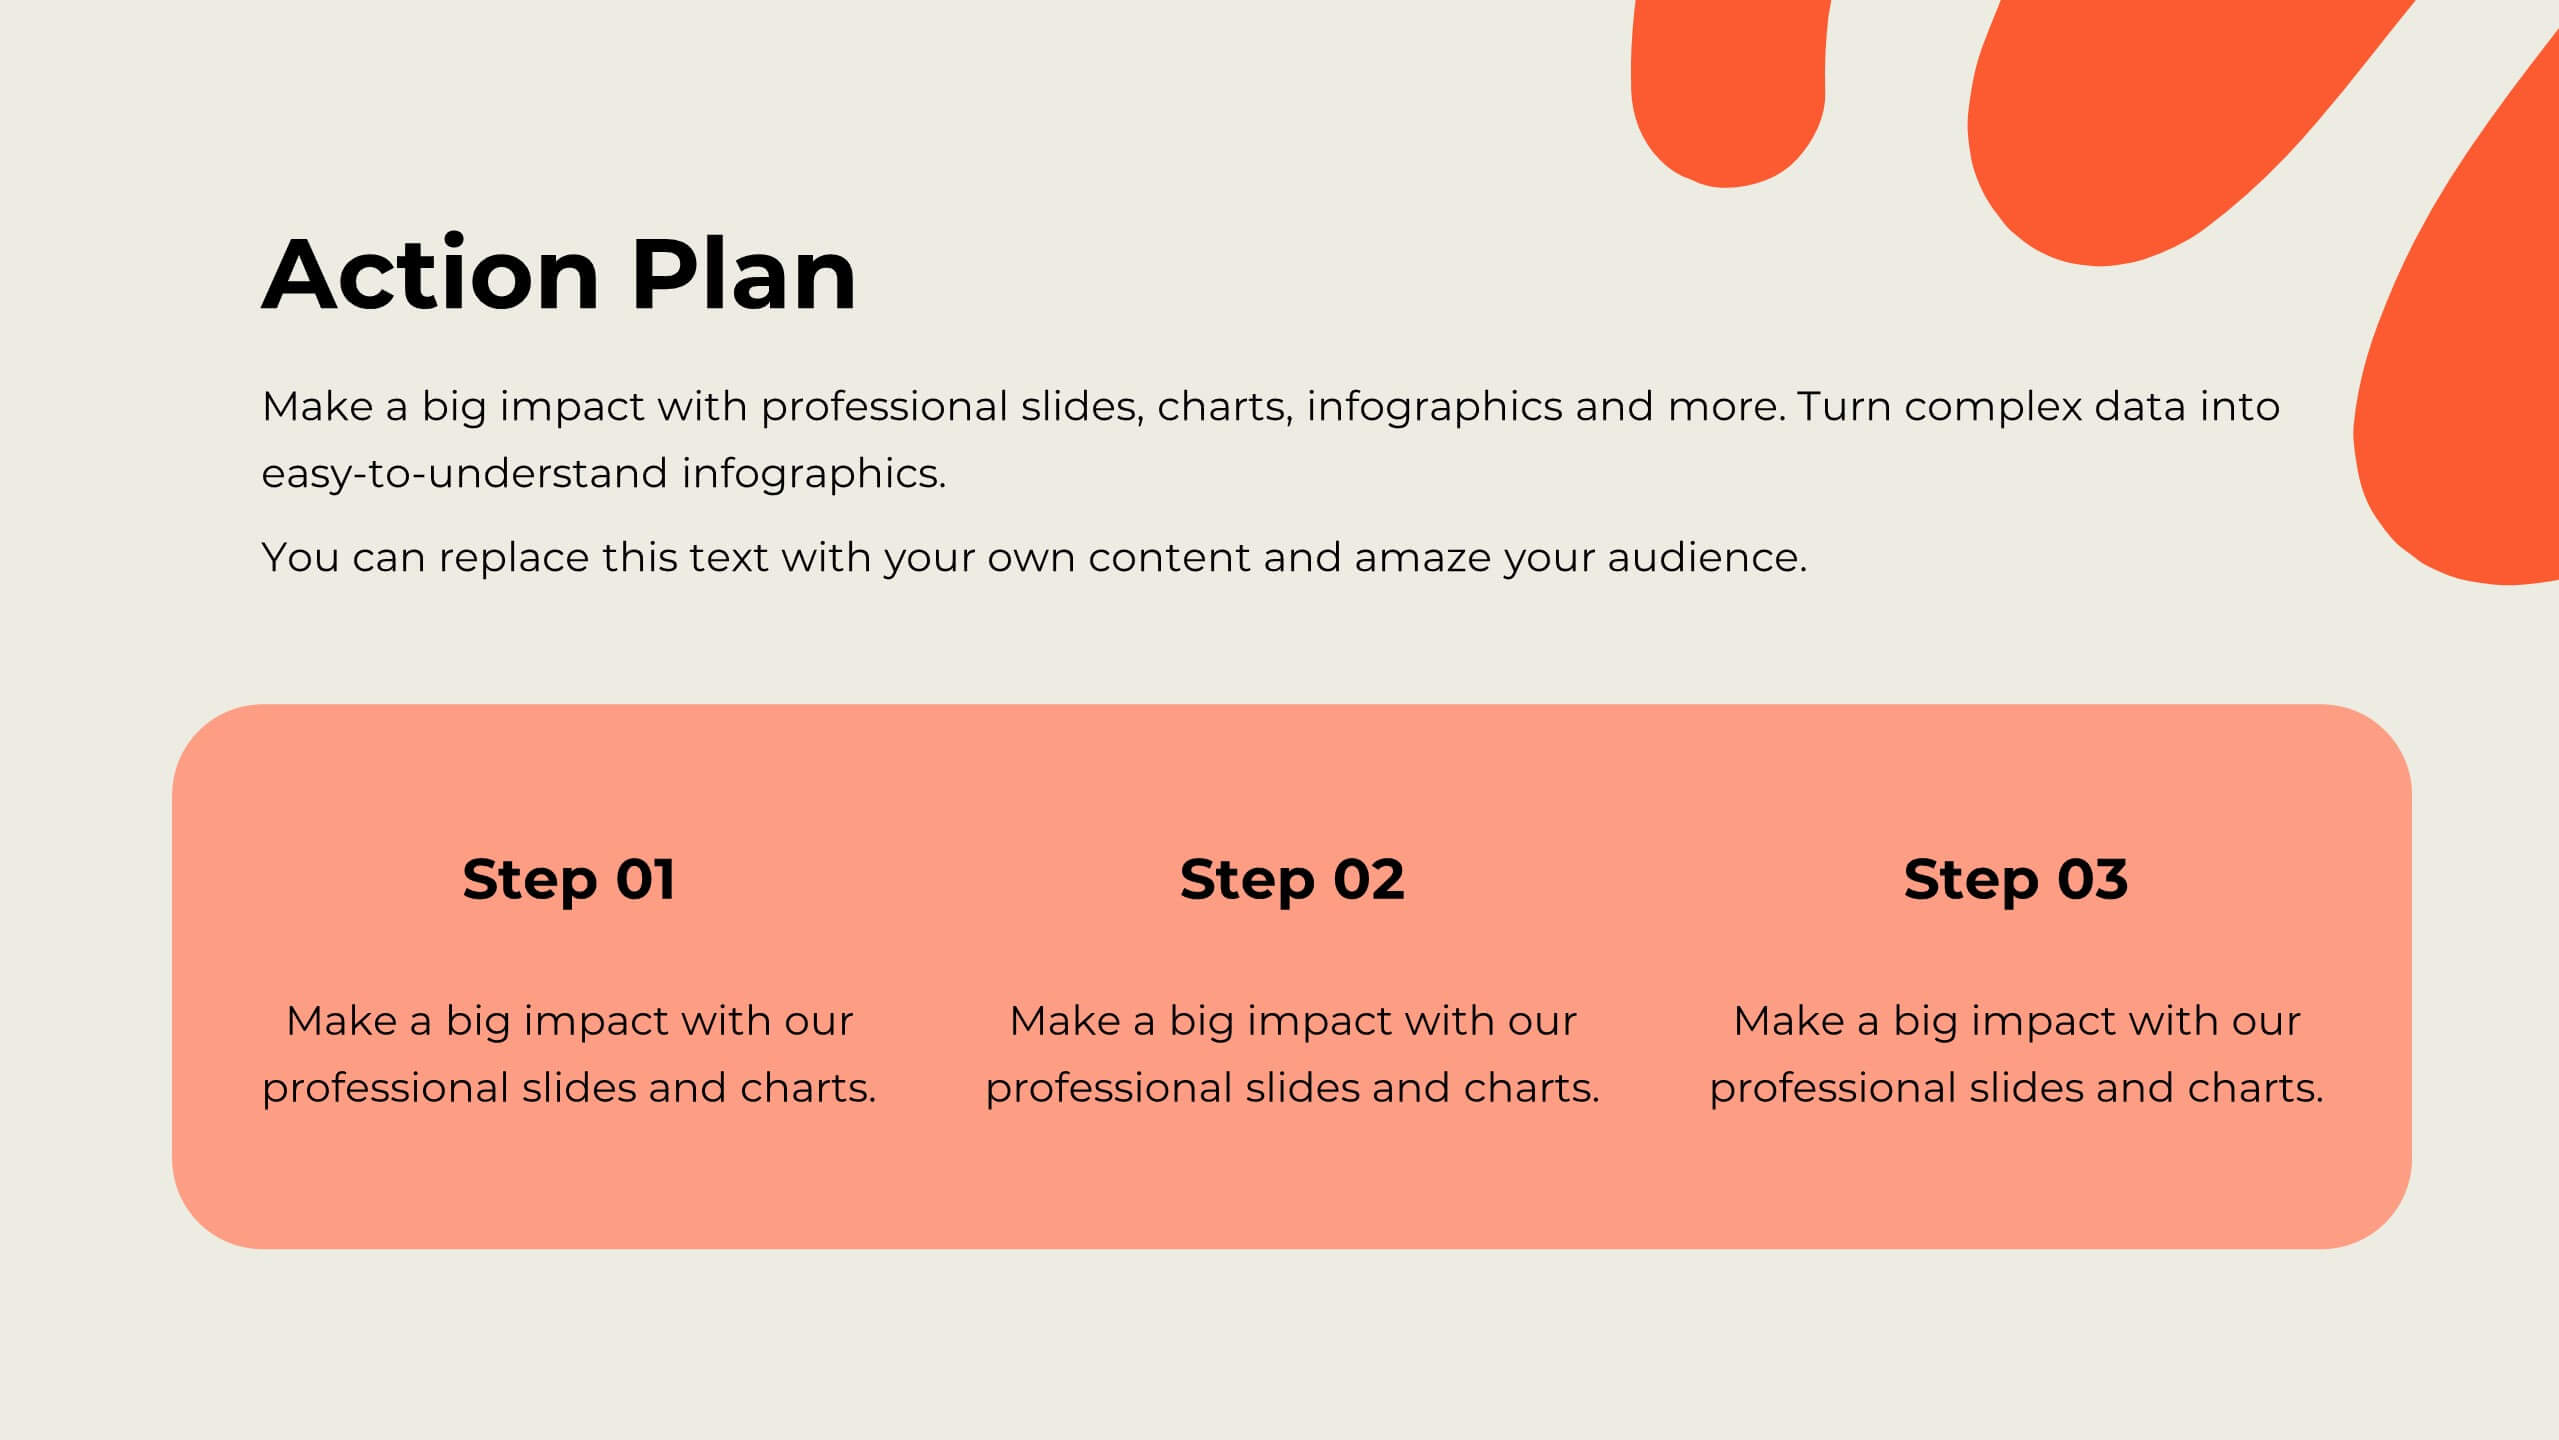
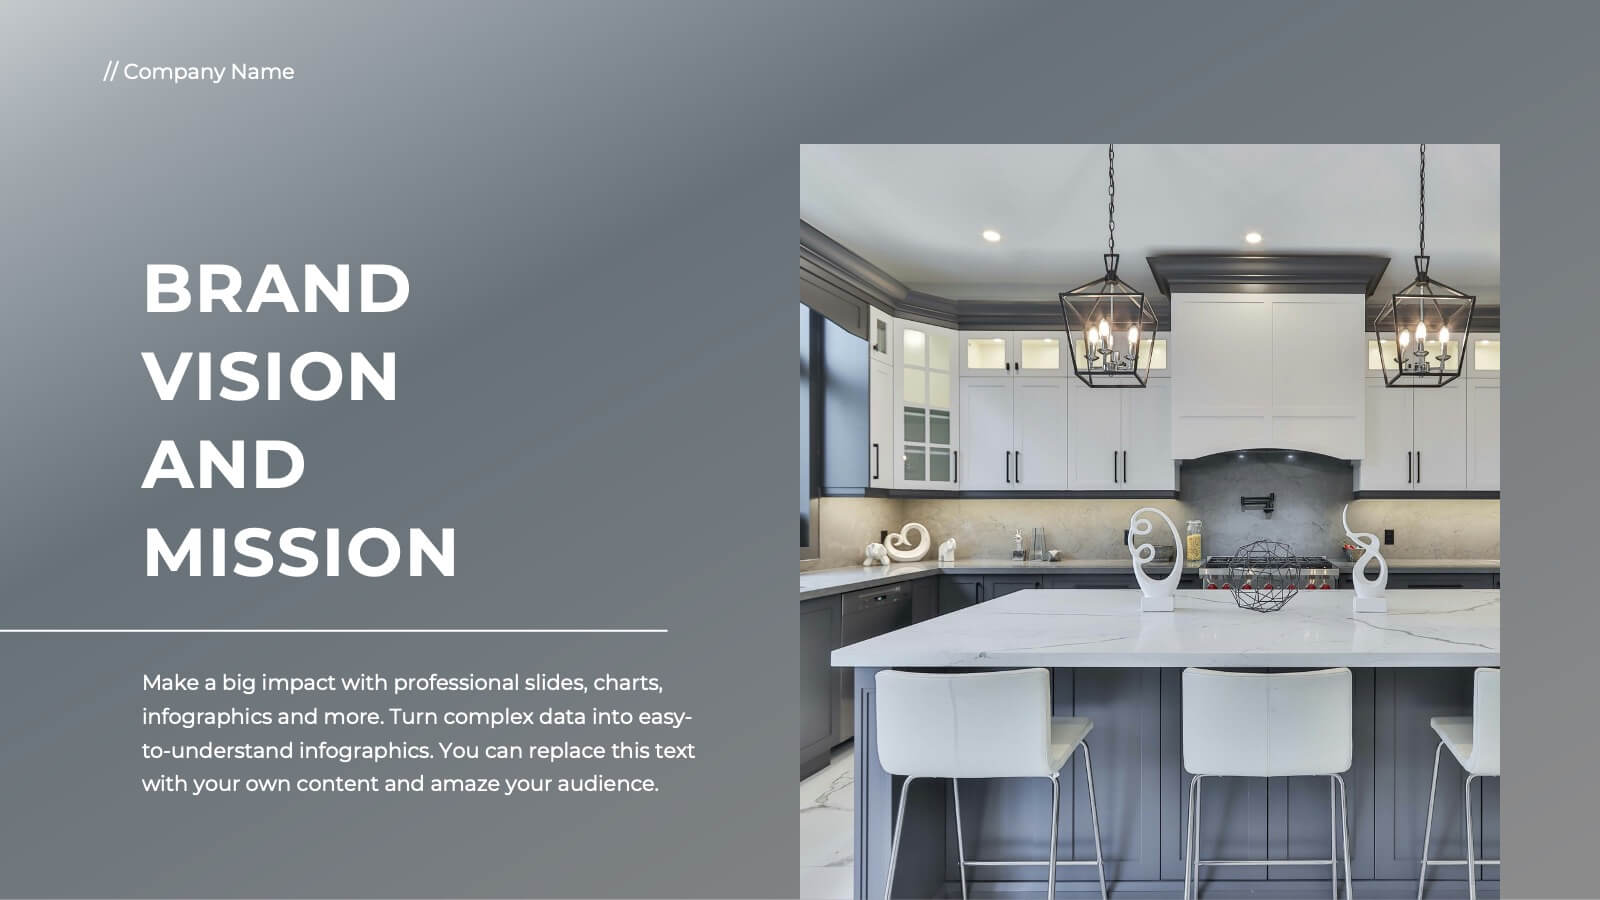
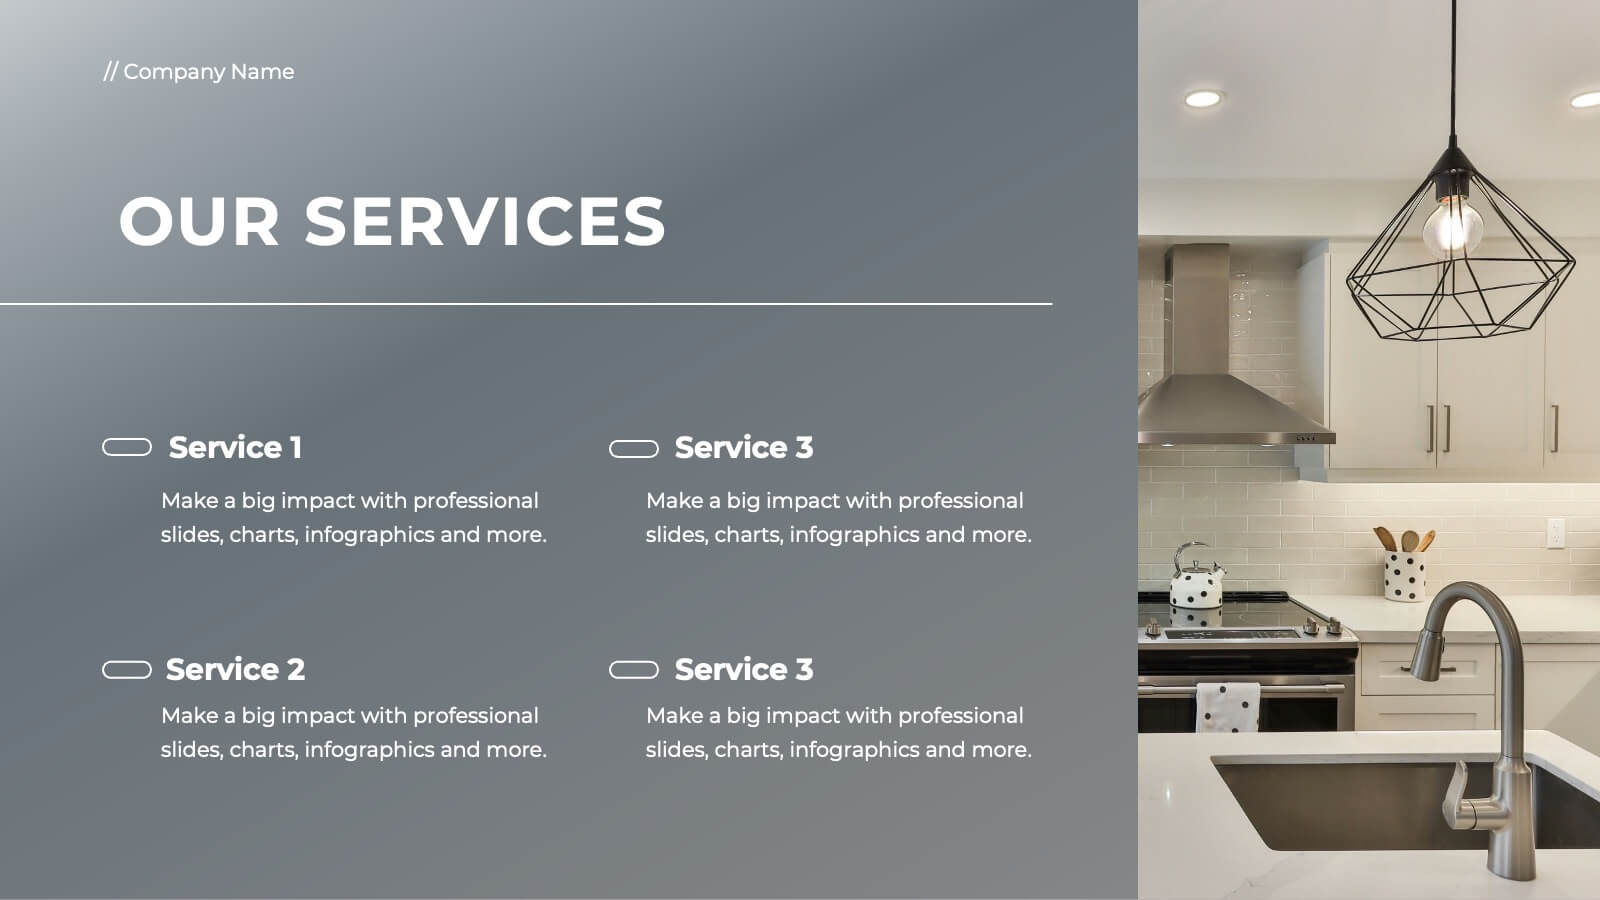
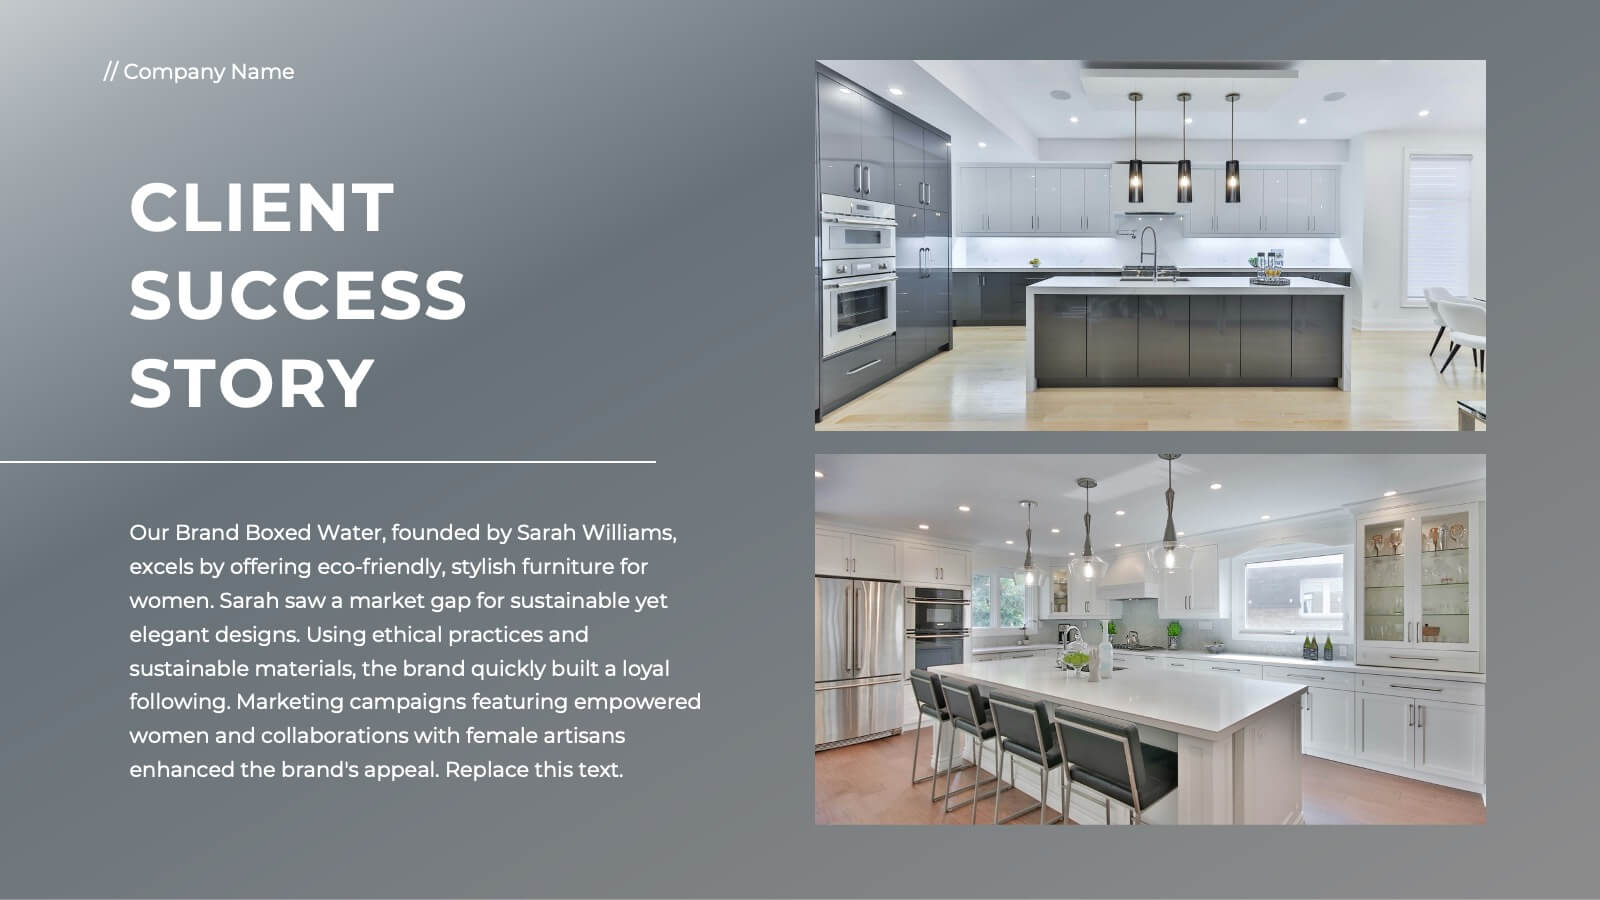
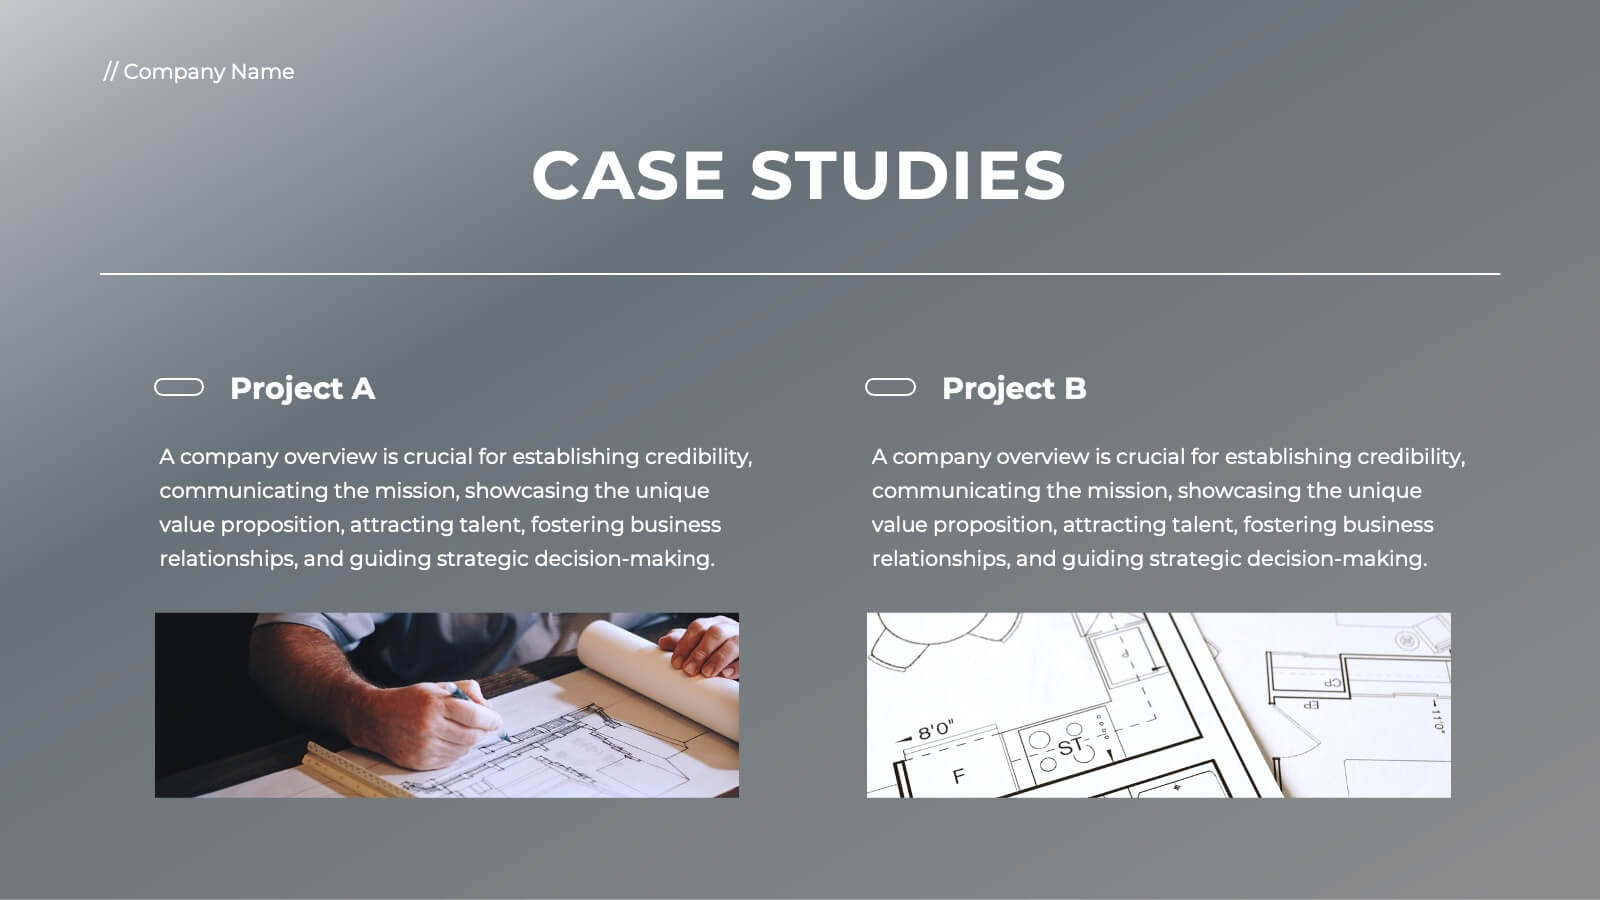
Corporate Vision and Mission Presentation
Present your company’s purpose with clarity using this Corporate Vision and Mission Presentation. Featuring modern visuals, bold typography, and image placeholders, this layout highlights your strategic goals effectively. Perfect for company profiles, startup decks, or internal briefings. Fully editable in PowerPoint, Keynote, and Google Slides for seamless customization.


4 diapositivas
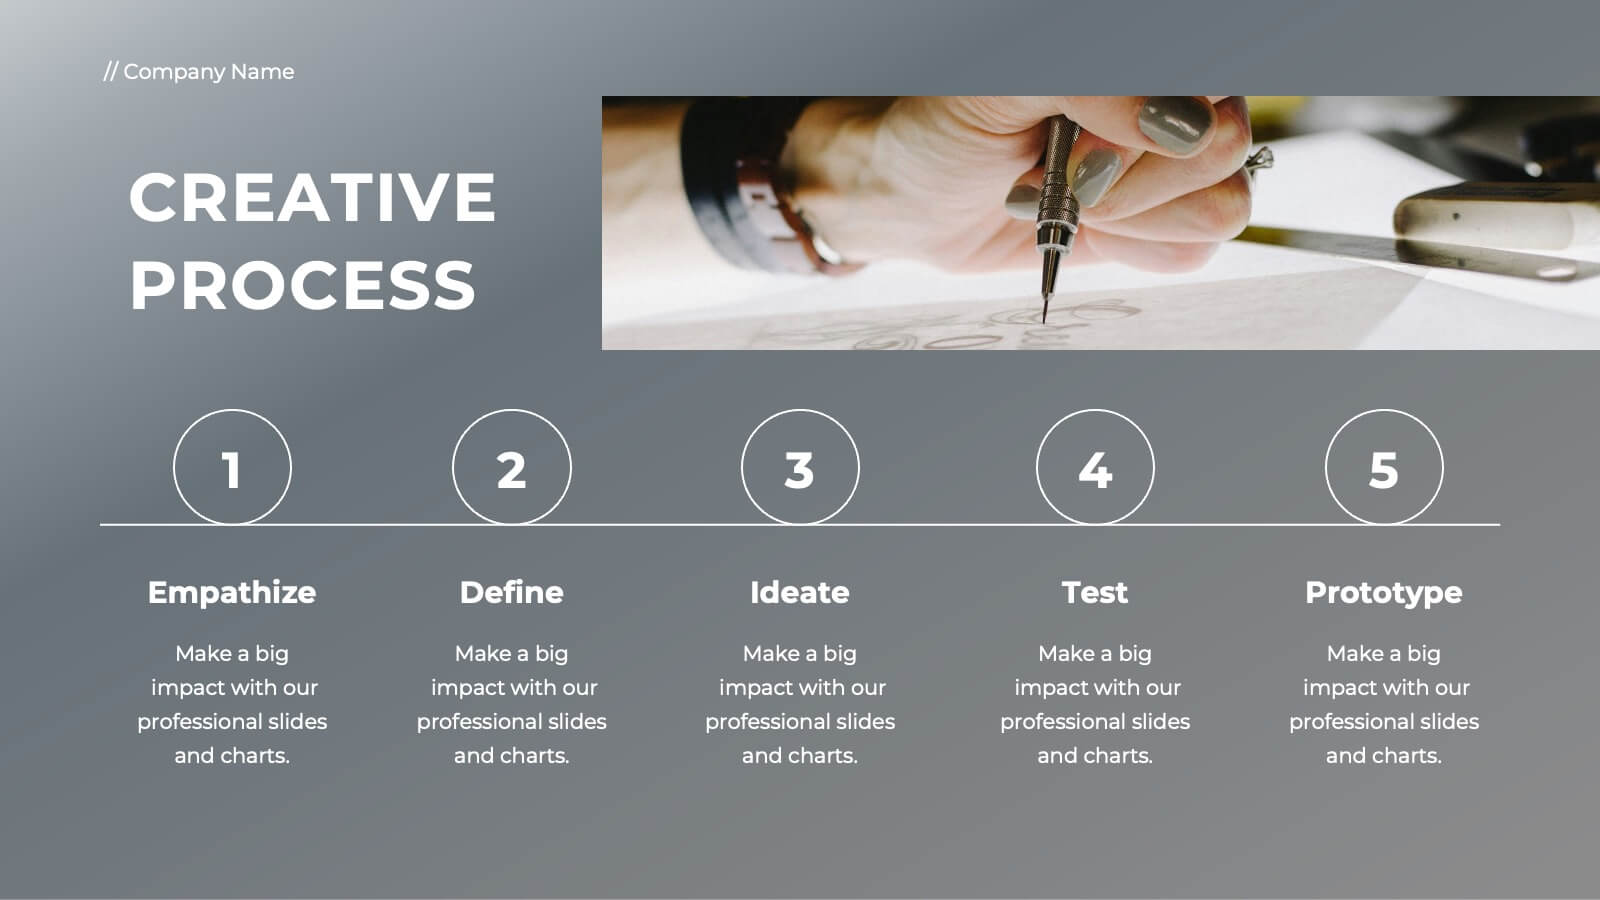
Aviation Industry Overview Presentation
Bring your data in for a smooth takeoff with this clean and modern visual layout. Perfect for presenting industry insights, market trends, or operational performance, this design helps convey complex information with clarity and flow. Fully editable and compatible with PowerPoint, Keynote, and Google Slides for seamless customization.


4 diapositivas
RACI Responsibility Assignment Matrix
Streamline your project roles with this clear and customizable RACI Matrix template. Easily define who's Responsible, Accountable, Consulted, and Informed across tasks or phases. Perfect for project managers, team leads, and business strategists. Fully editable in PowerPoint, Keynote, and Google Slides.


5 diapositivas
Innovative Business Solutions Presentation
Elevate your strategy discussions with the Innovative Business Solutions template, providing a visually engaging framework designed to present complex business solutions clearly and effectively. It features a unique puzzle design that integrates up to five key business insights, ensuring each piece contributes to a holistic understanding of strategies or solutions. It is compatible with PowerPoint, Keynote and Google Slides, providing flexibility and ease of use across different platforms.


5 diapositivas
Tiered Strategy Framework Pyramid Presentation
Break down your plan into clear, actionable steps with this Tiered Strategy Framework Pyramid presentation. Each arrow-shaped tier helps visualize hierarchical strategies, workflows, or growth levels. Use this layout to communicate priorities, initiatives, or milestones in a sleek and modern format. Fully editable in Canva, PowerPoint, or Google Slides.


6 diapositivas
Business Flow Chart Design Presentation
Bring clarity and momentum to your process with a clean, visual layout that turns complex steps into an easy-to-follow flow. This presentation helps teams map stages, responsibilities, and progress with confidence, making it perfect for planning, strategy, and operations. Fully compatible with PowerPoint, Keynote, and Google Slides.


23 diapositivas
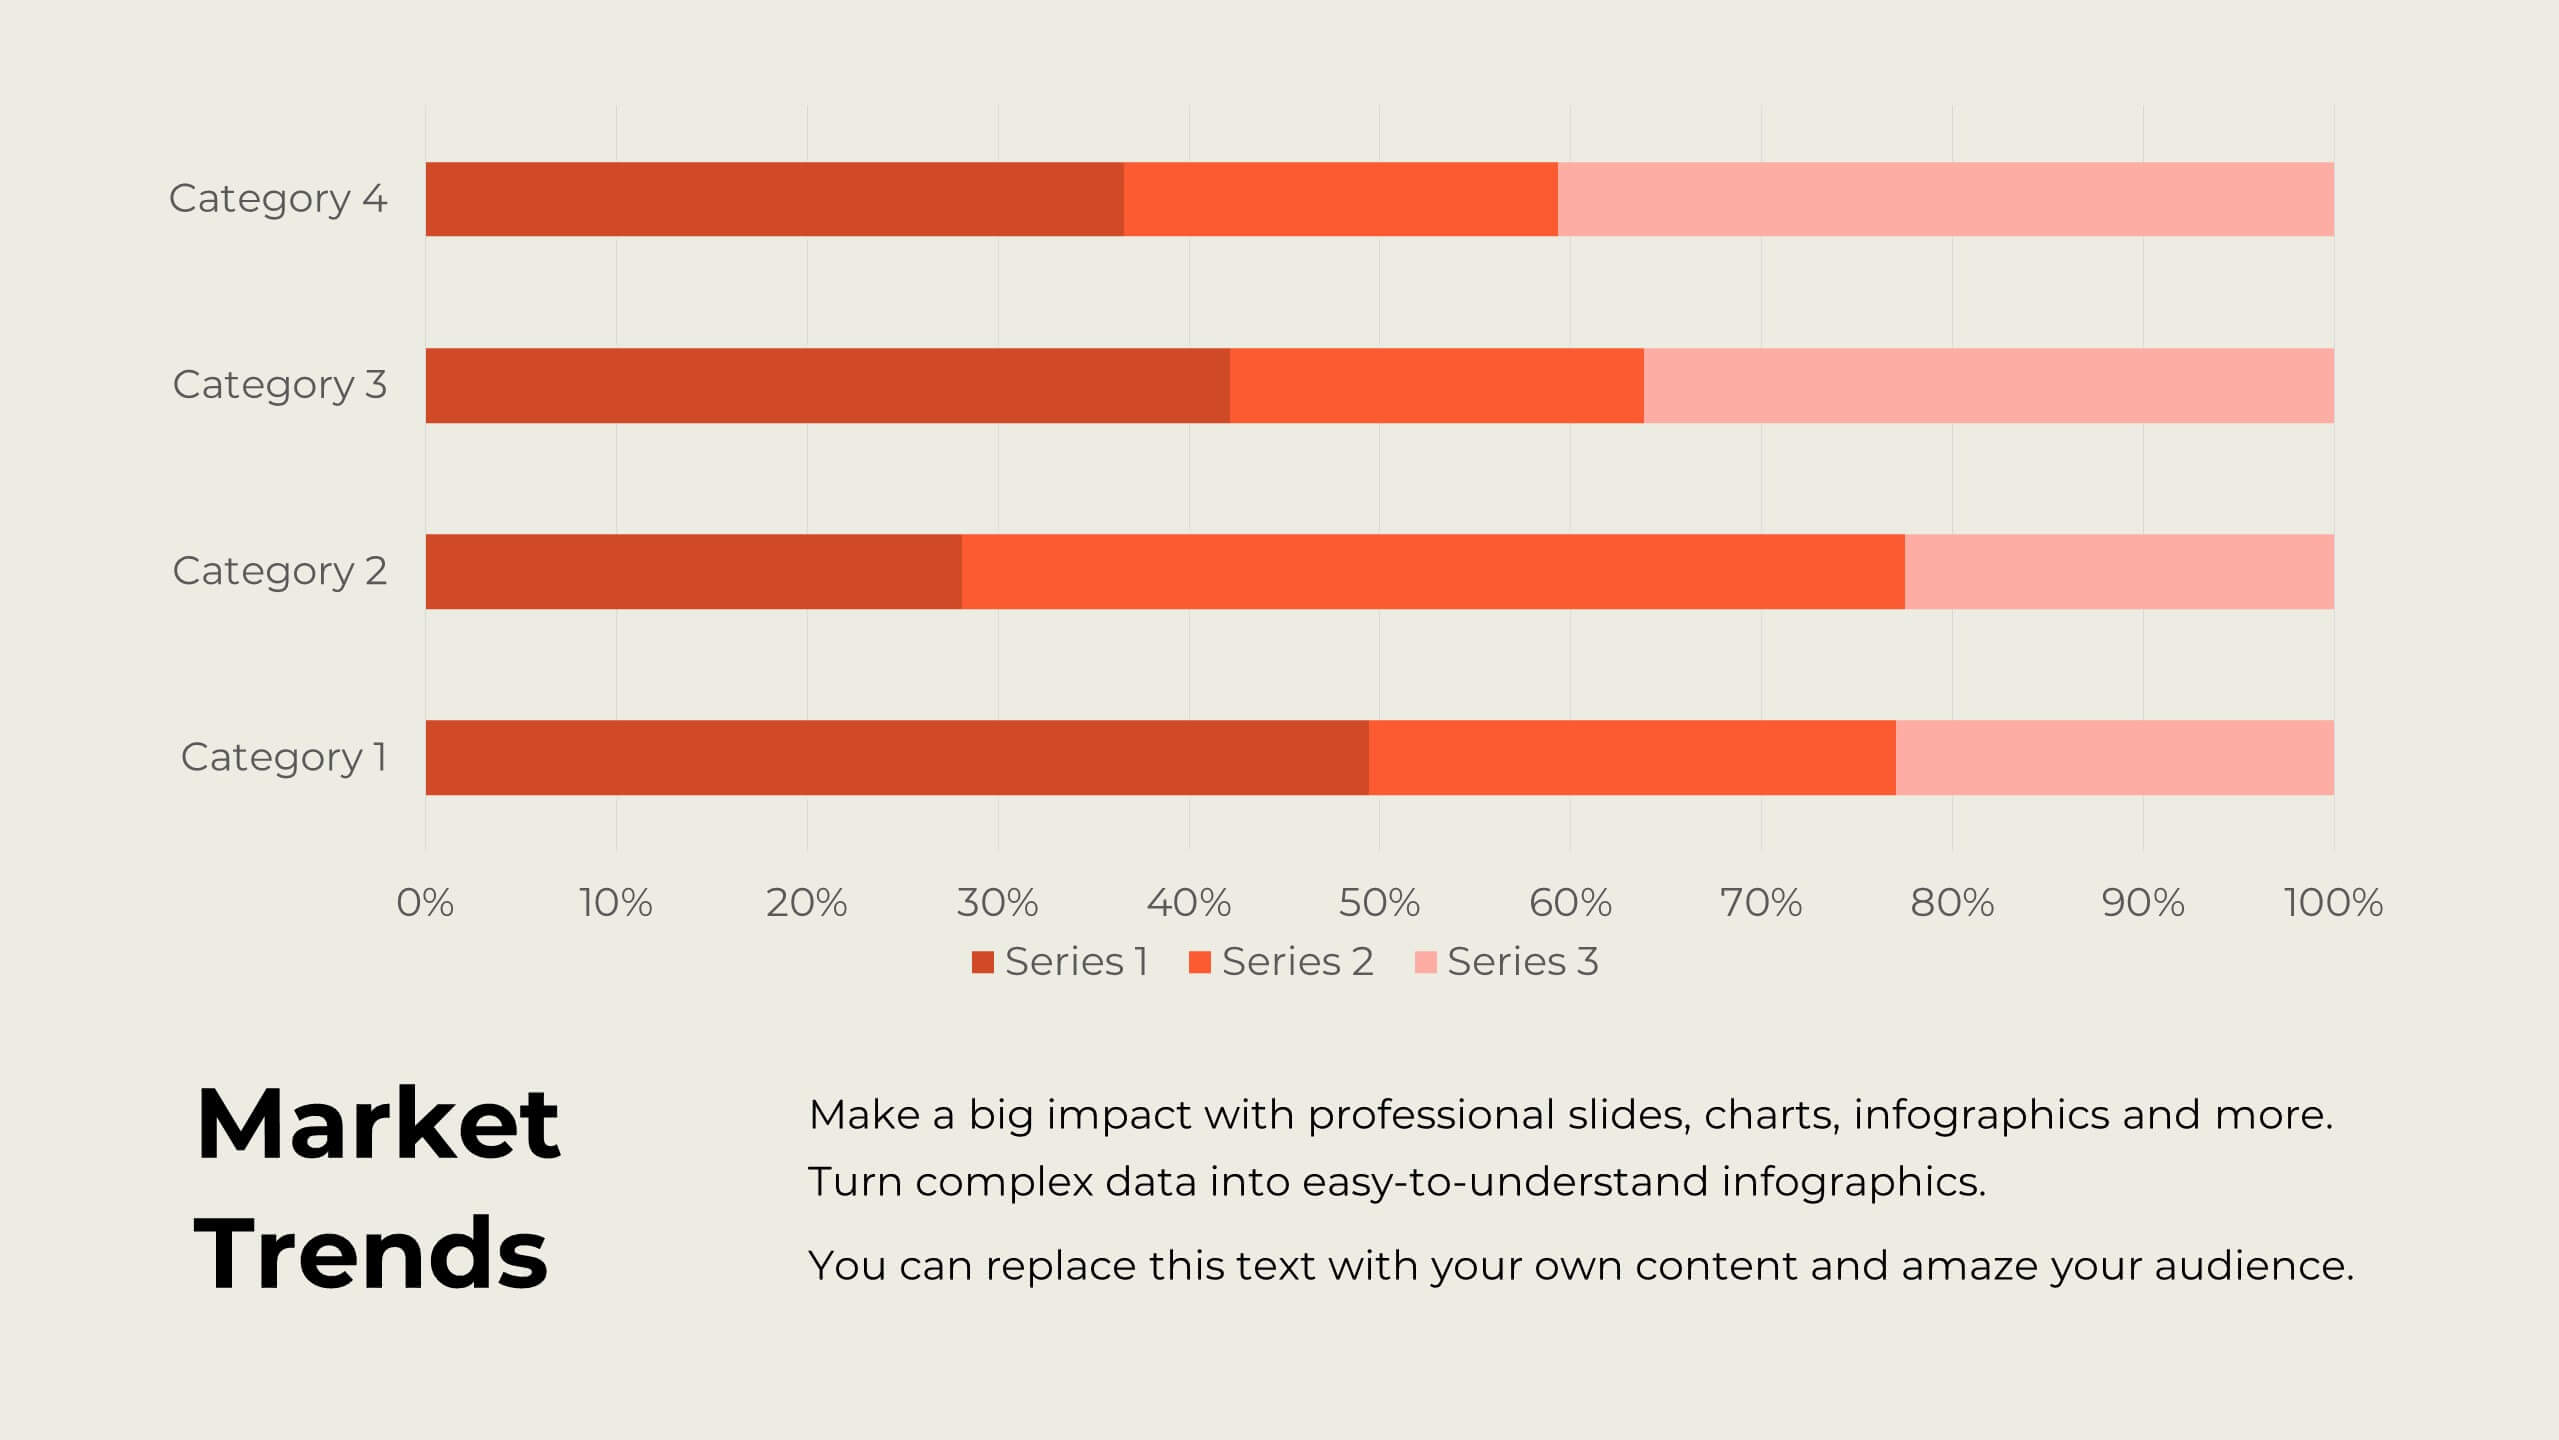
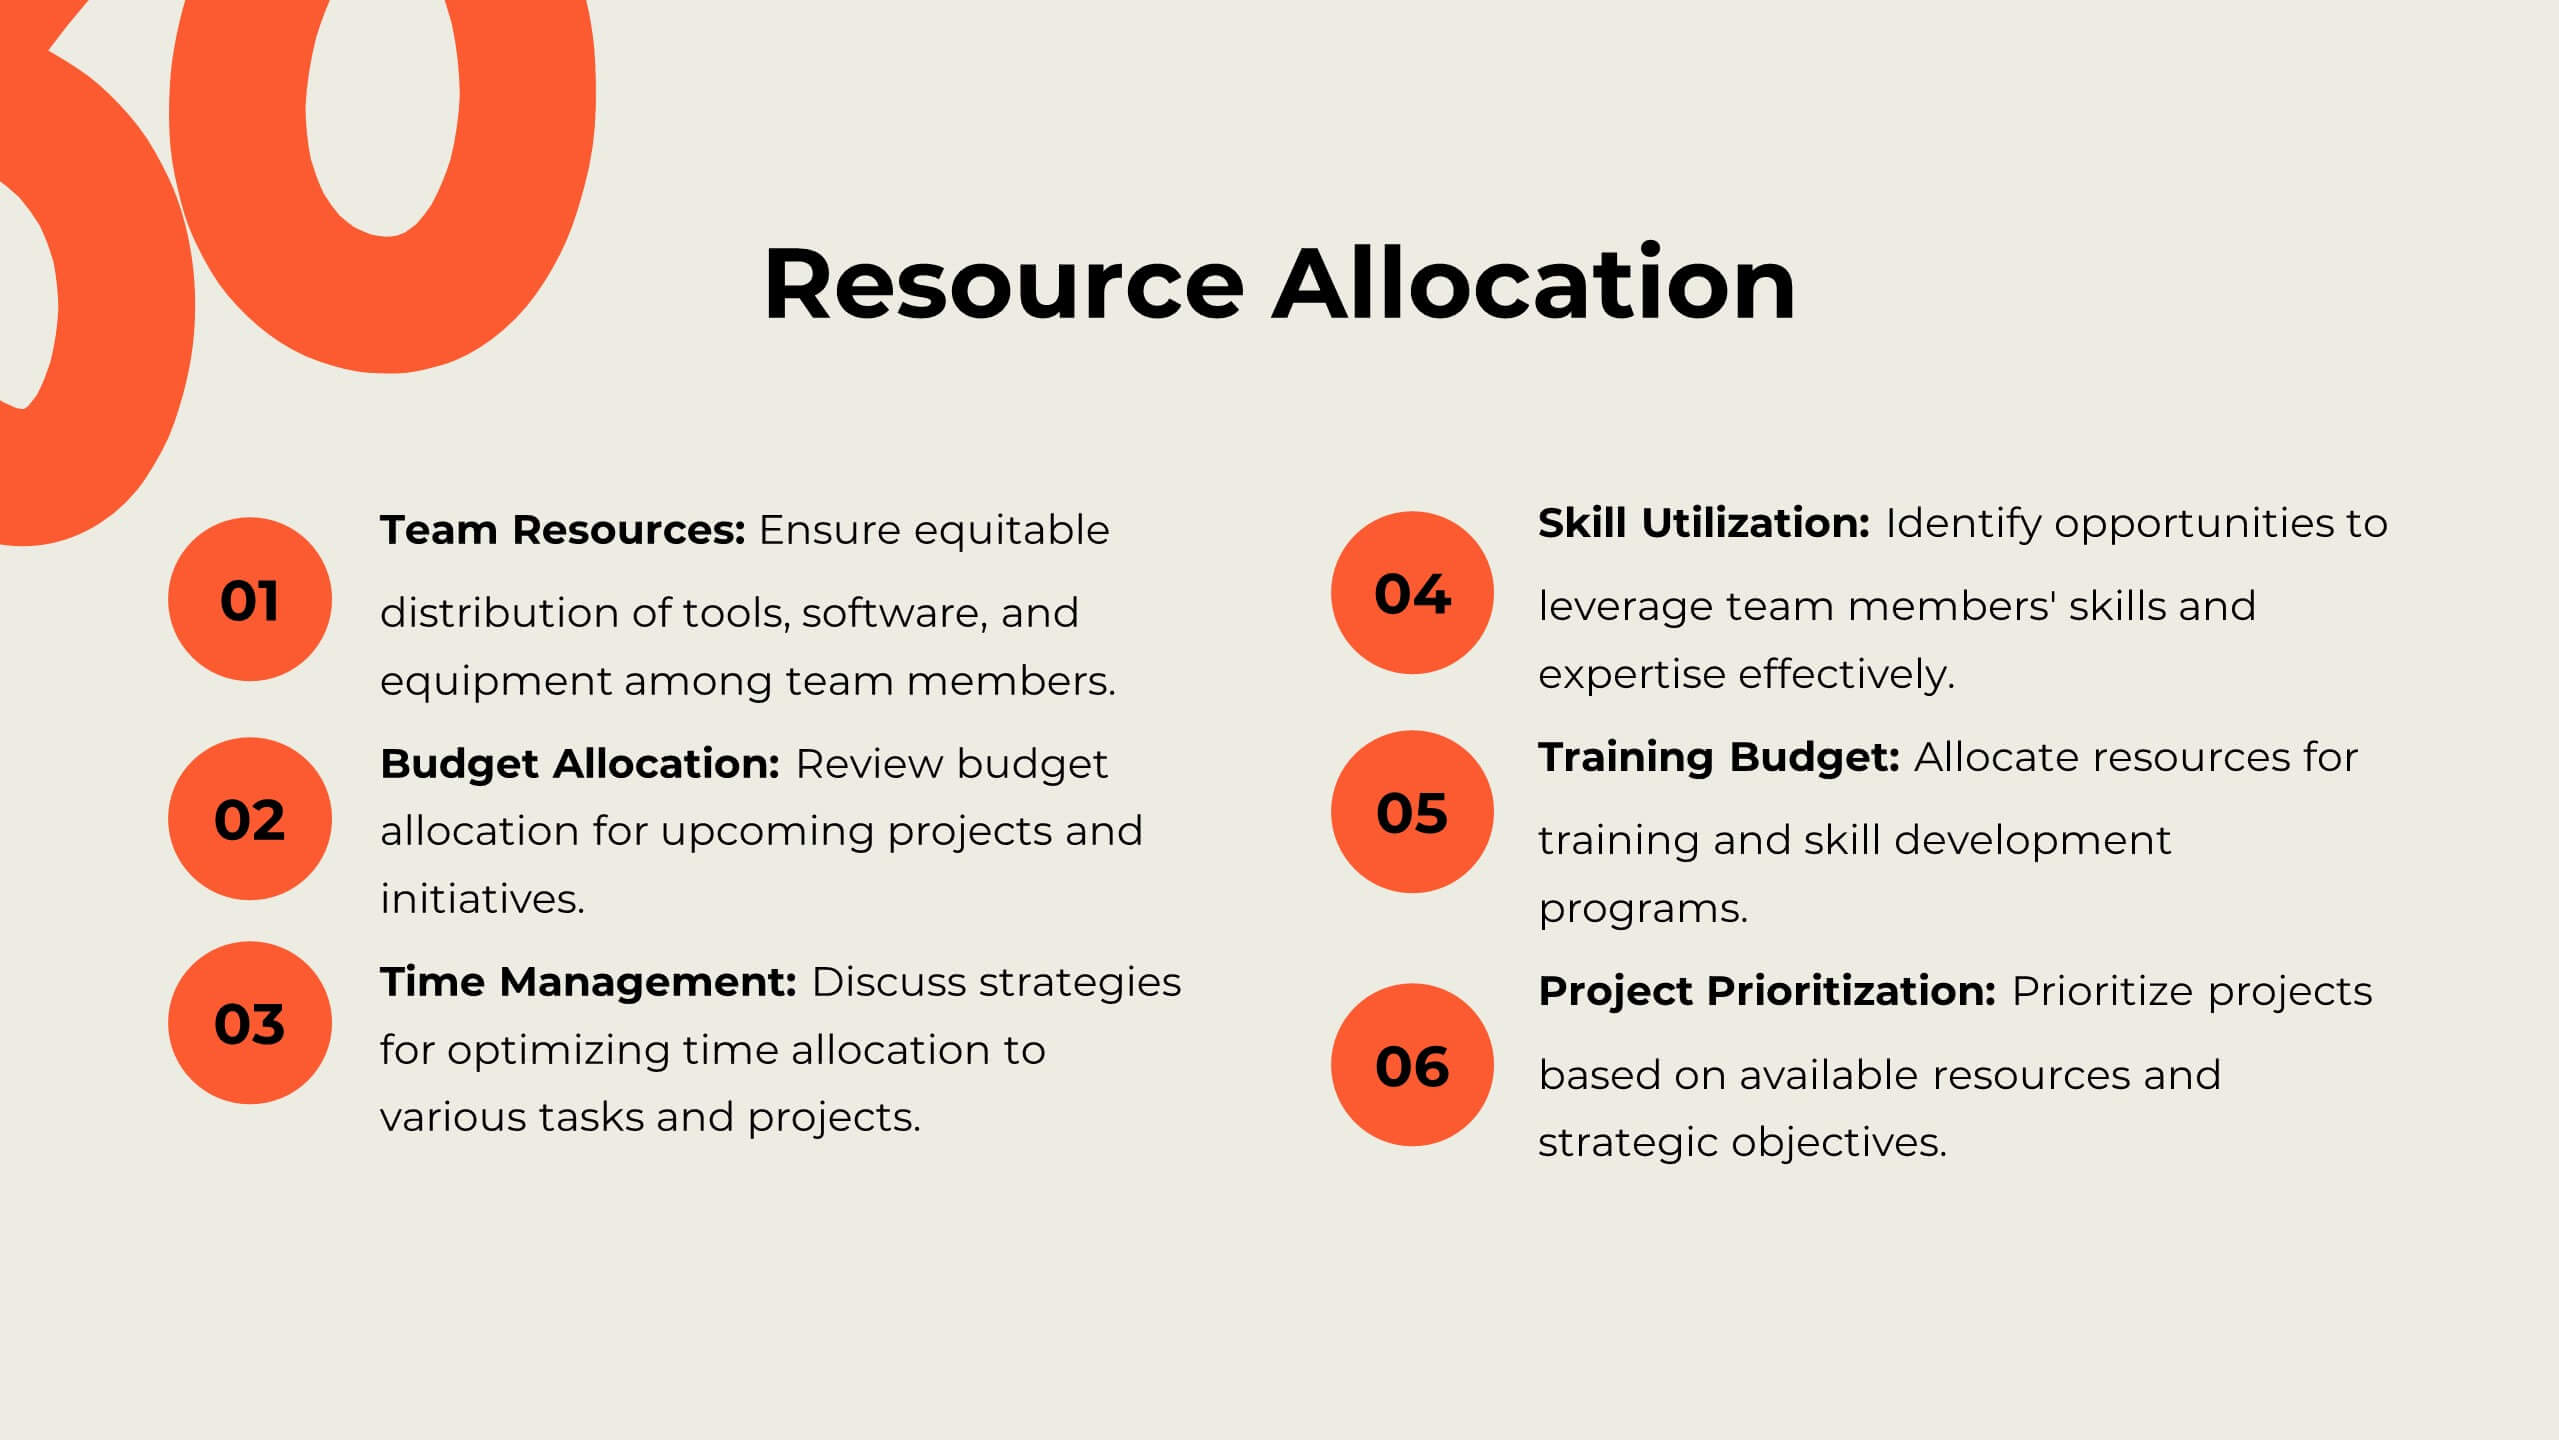
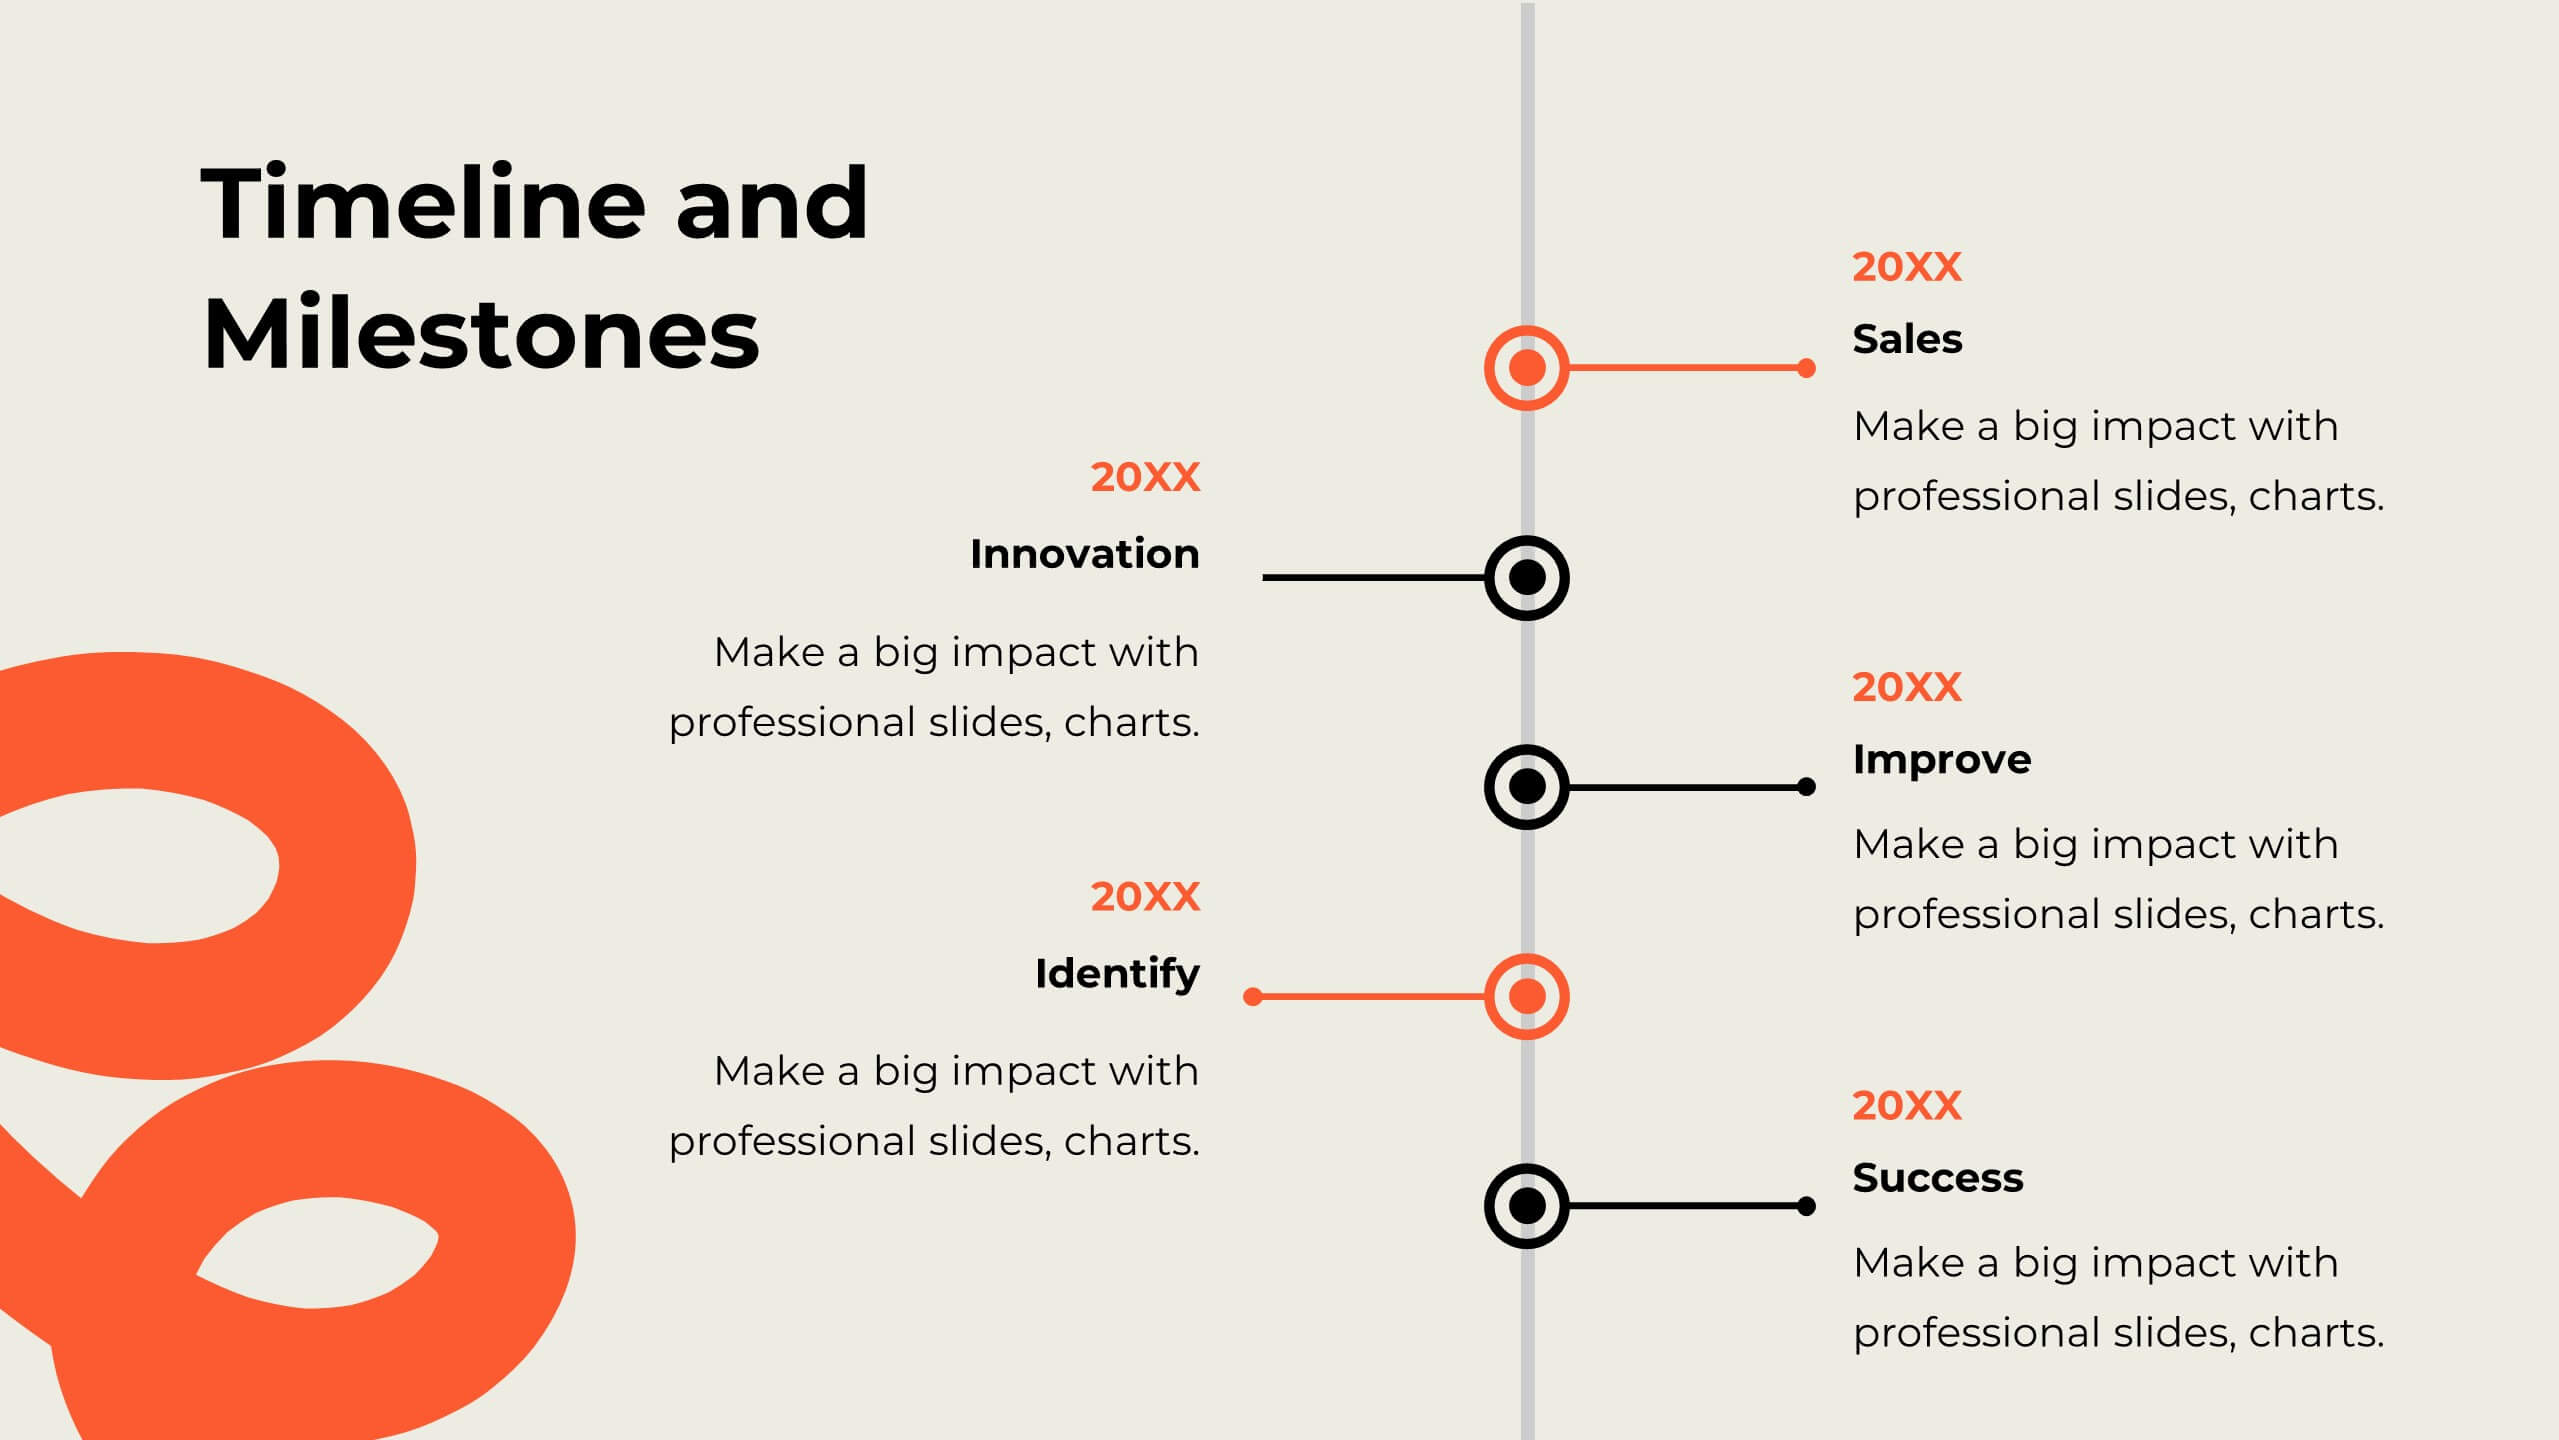
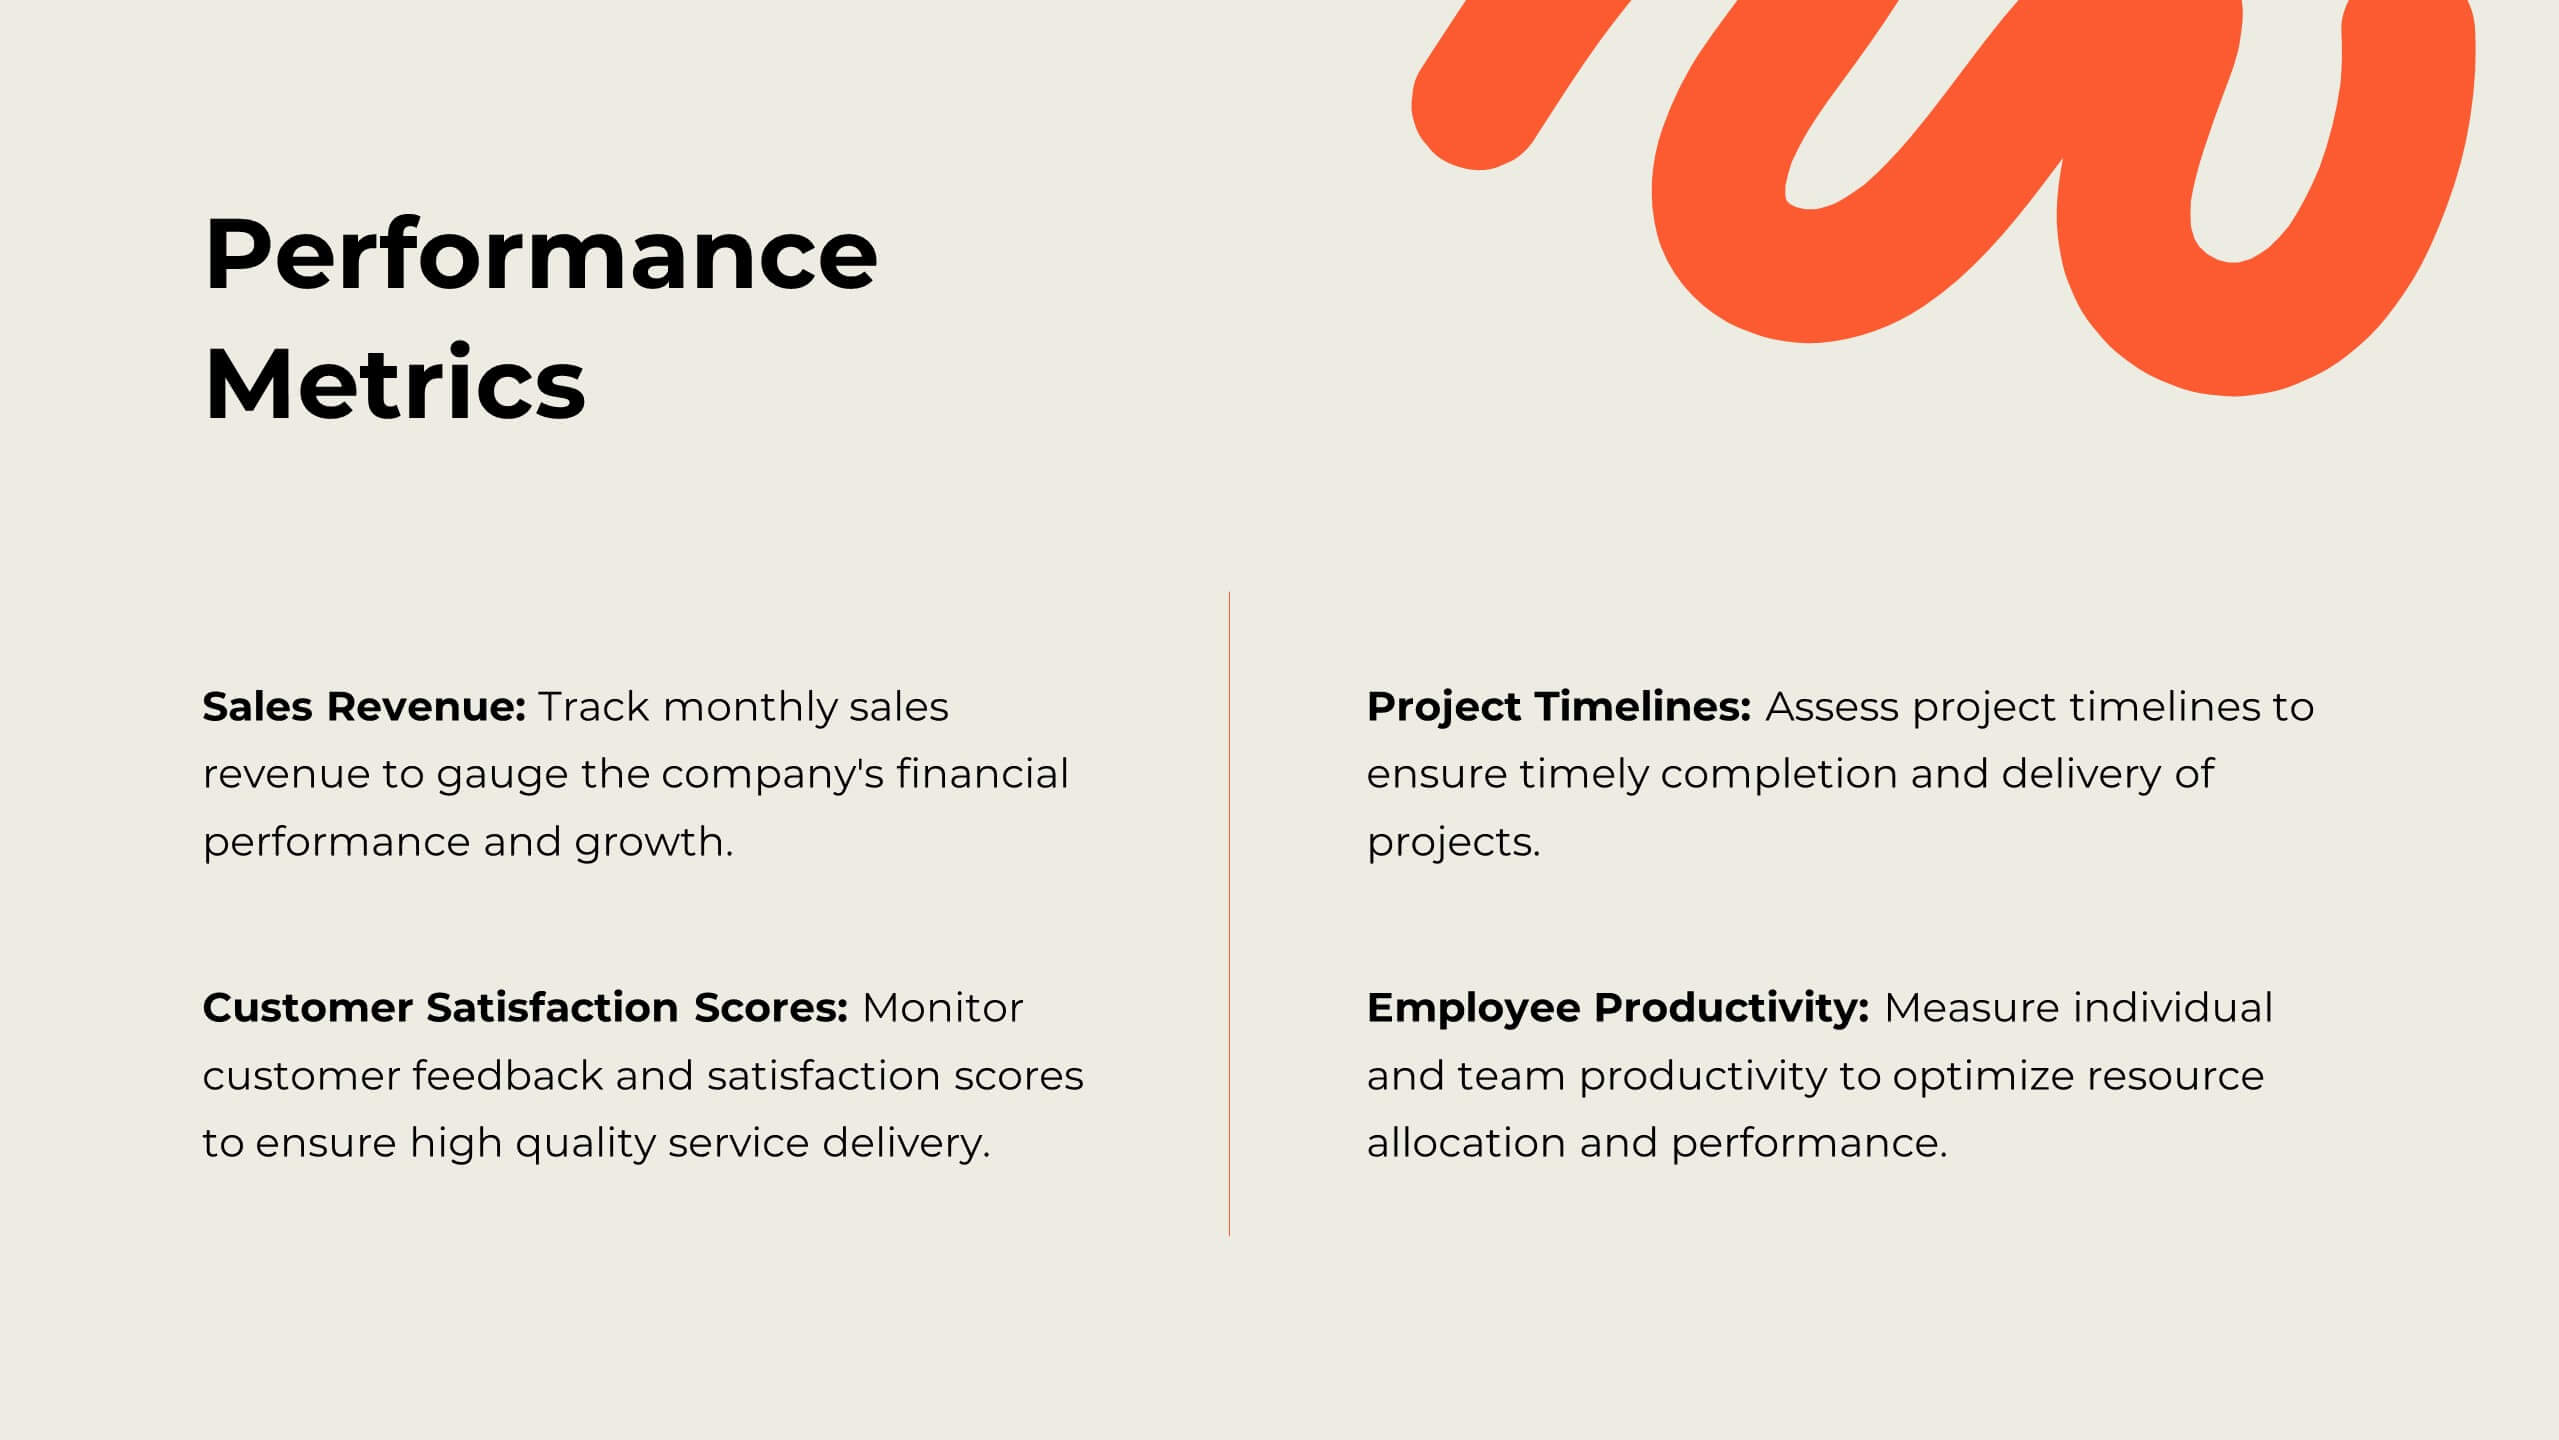
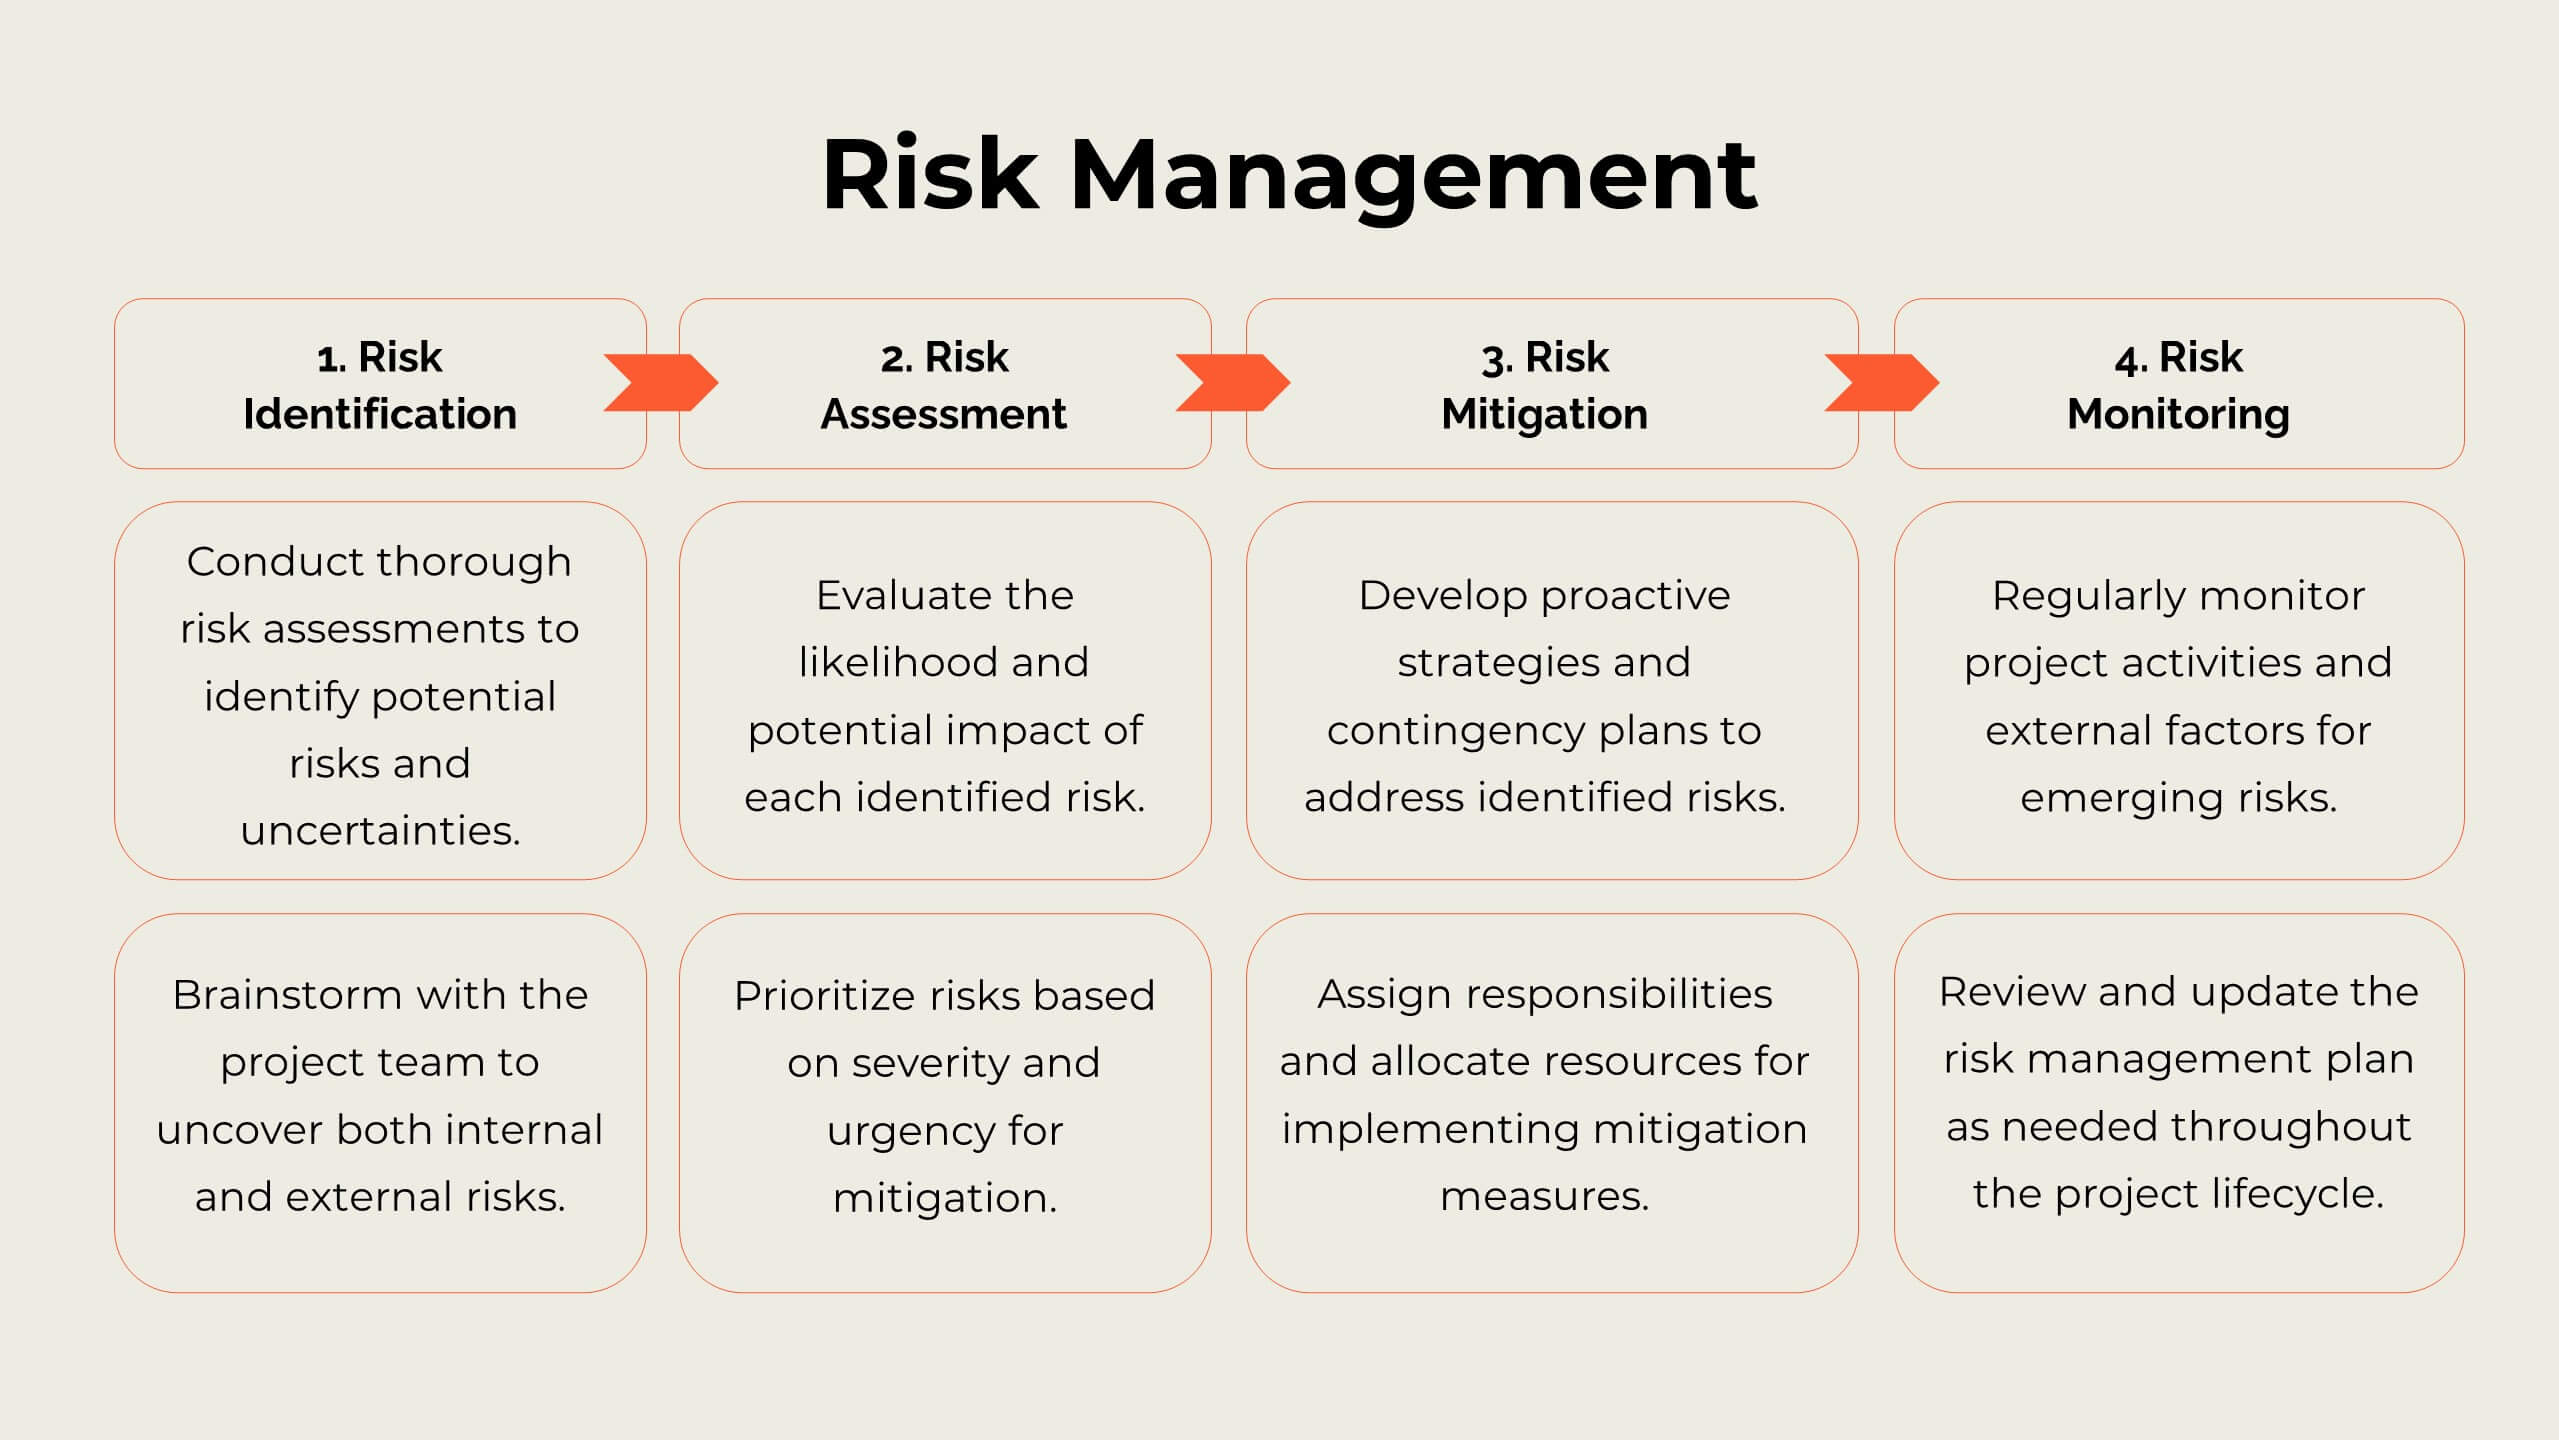
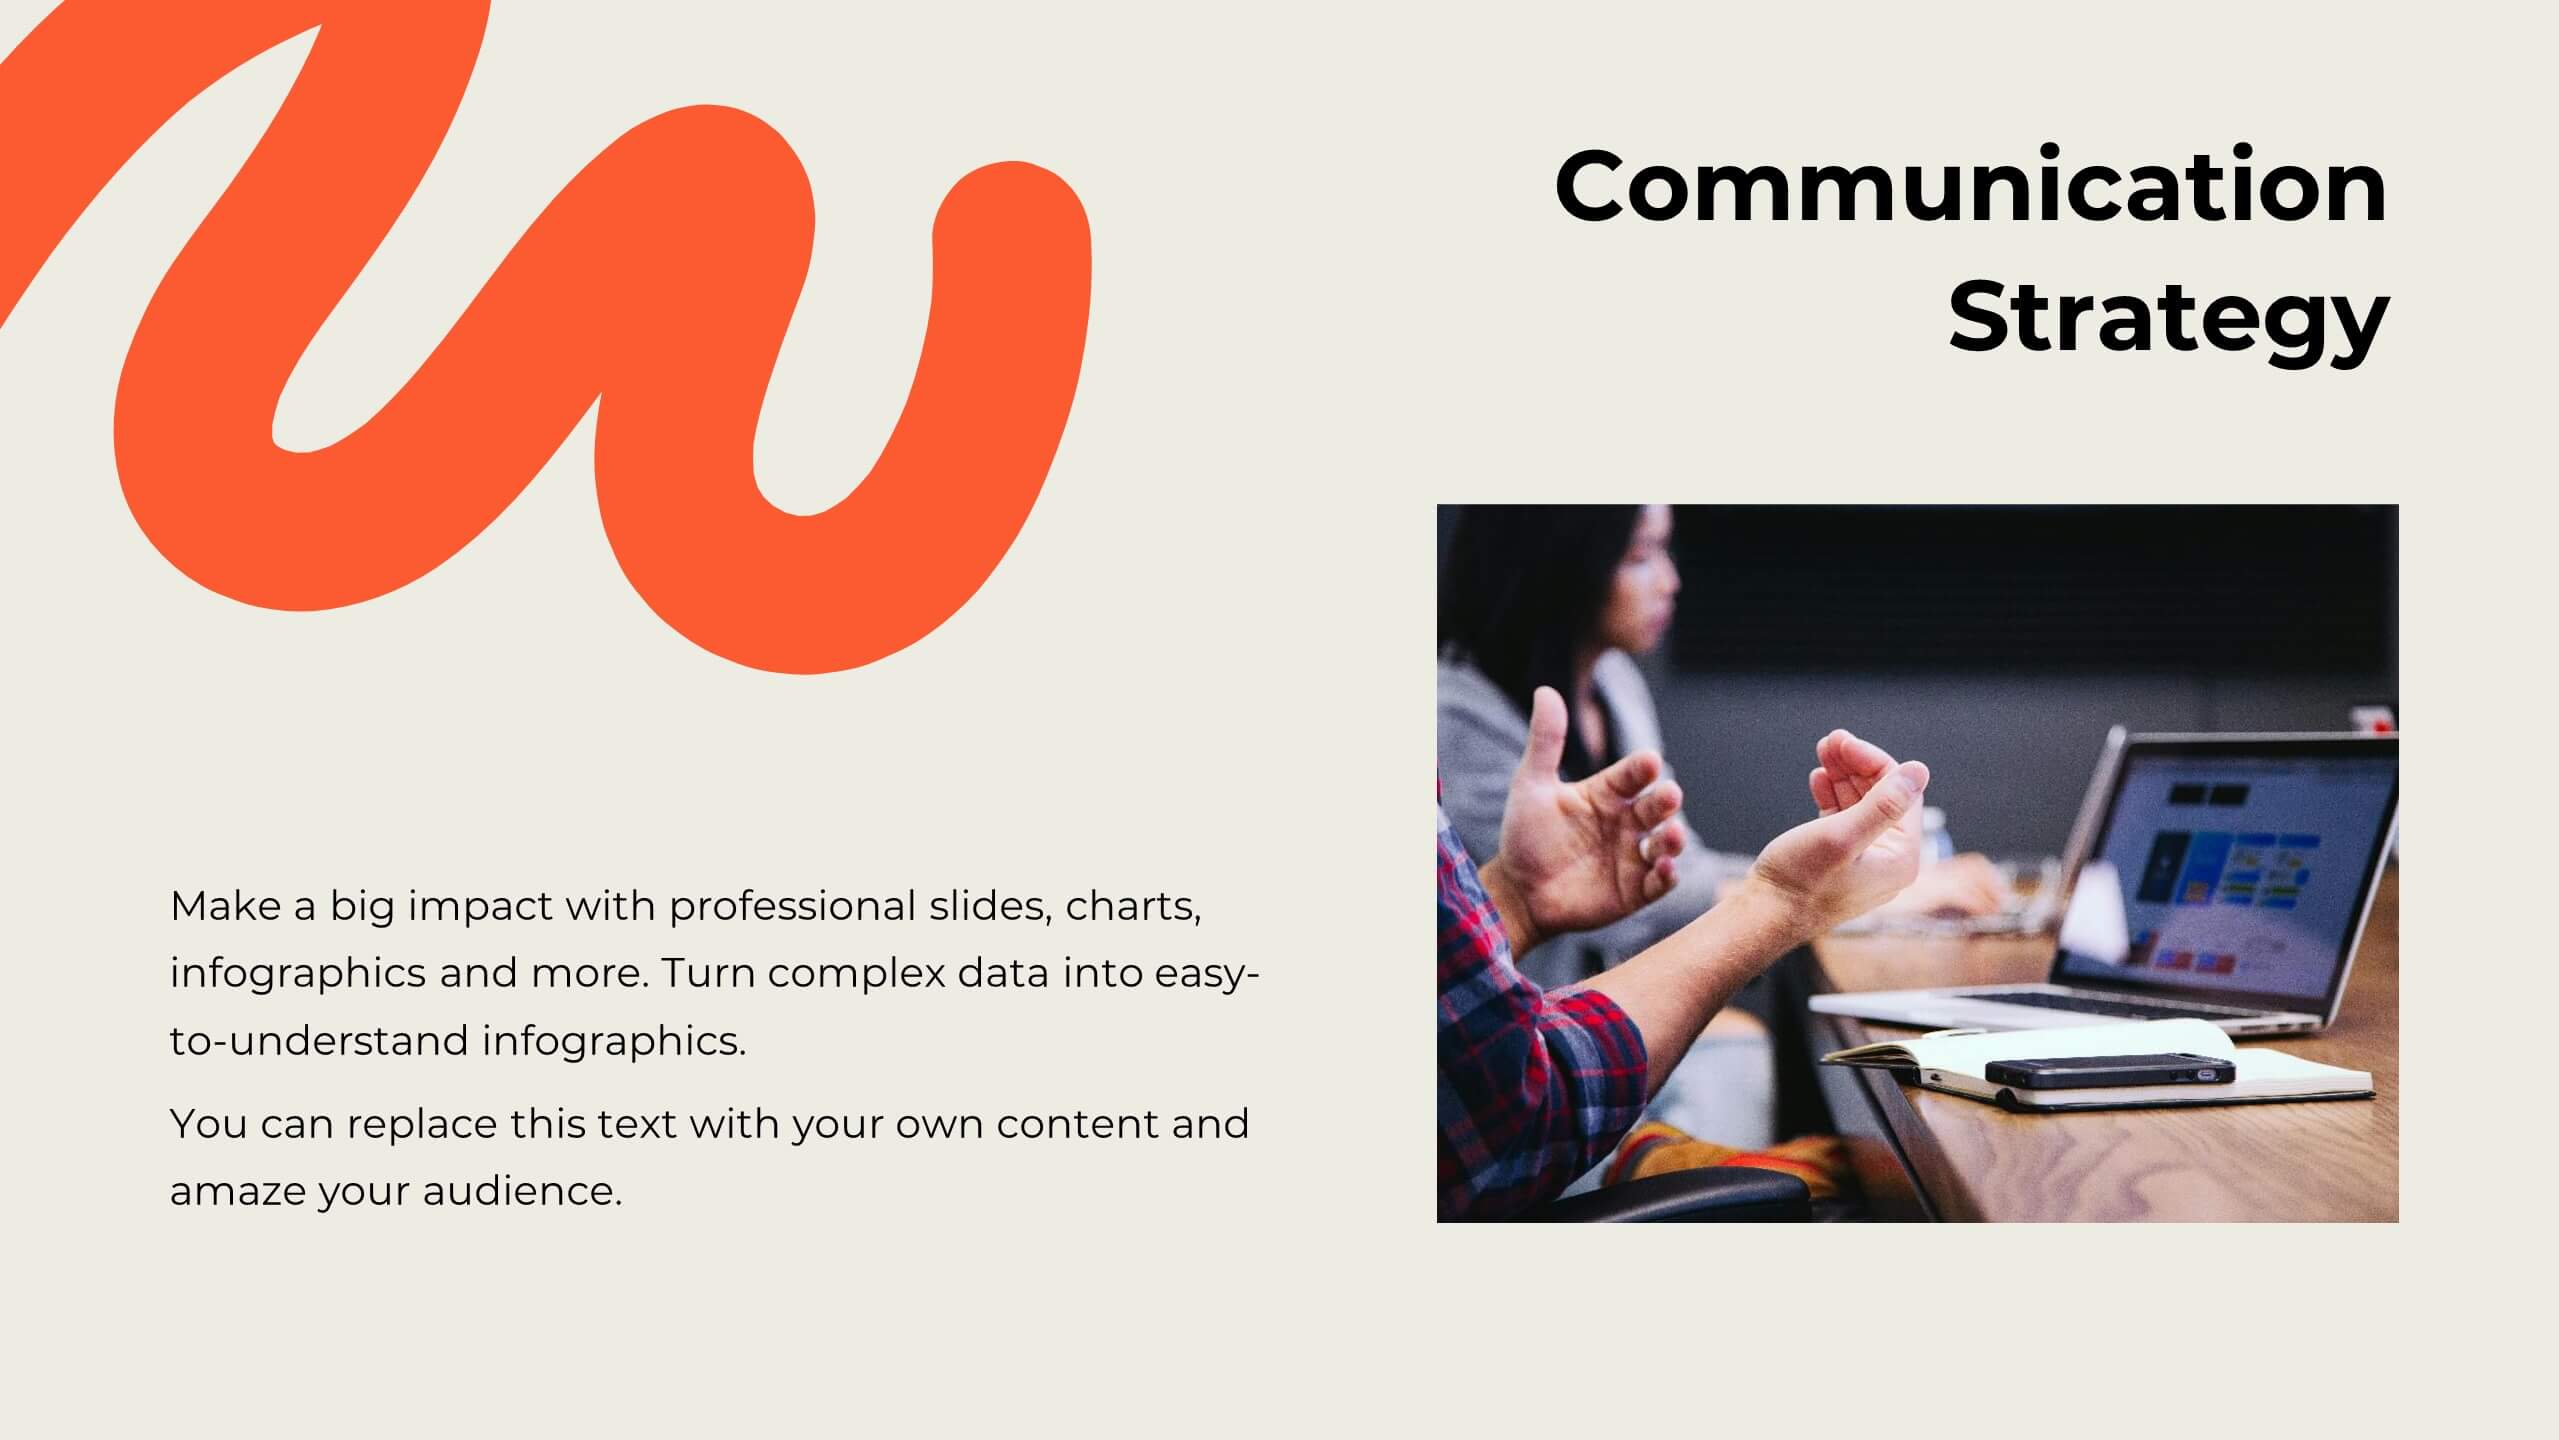
Mirage Digital Strategy Presentation
Revitalize your marketing efforts with this dynamic strategy plan template! Perfect for outlining objectives, competitive analysis, and target audience identification, it includes slides for SWOT analysis, resource allocation, and implementation plans. Engage stakeholders with vibrant visuals and comprehensive content. Compatible with PowerPoint, Keynote, and Google Slides for seamless presentations on any platform.

22 diapositivas
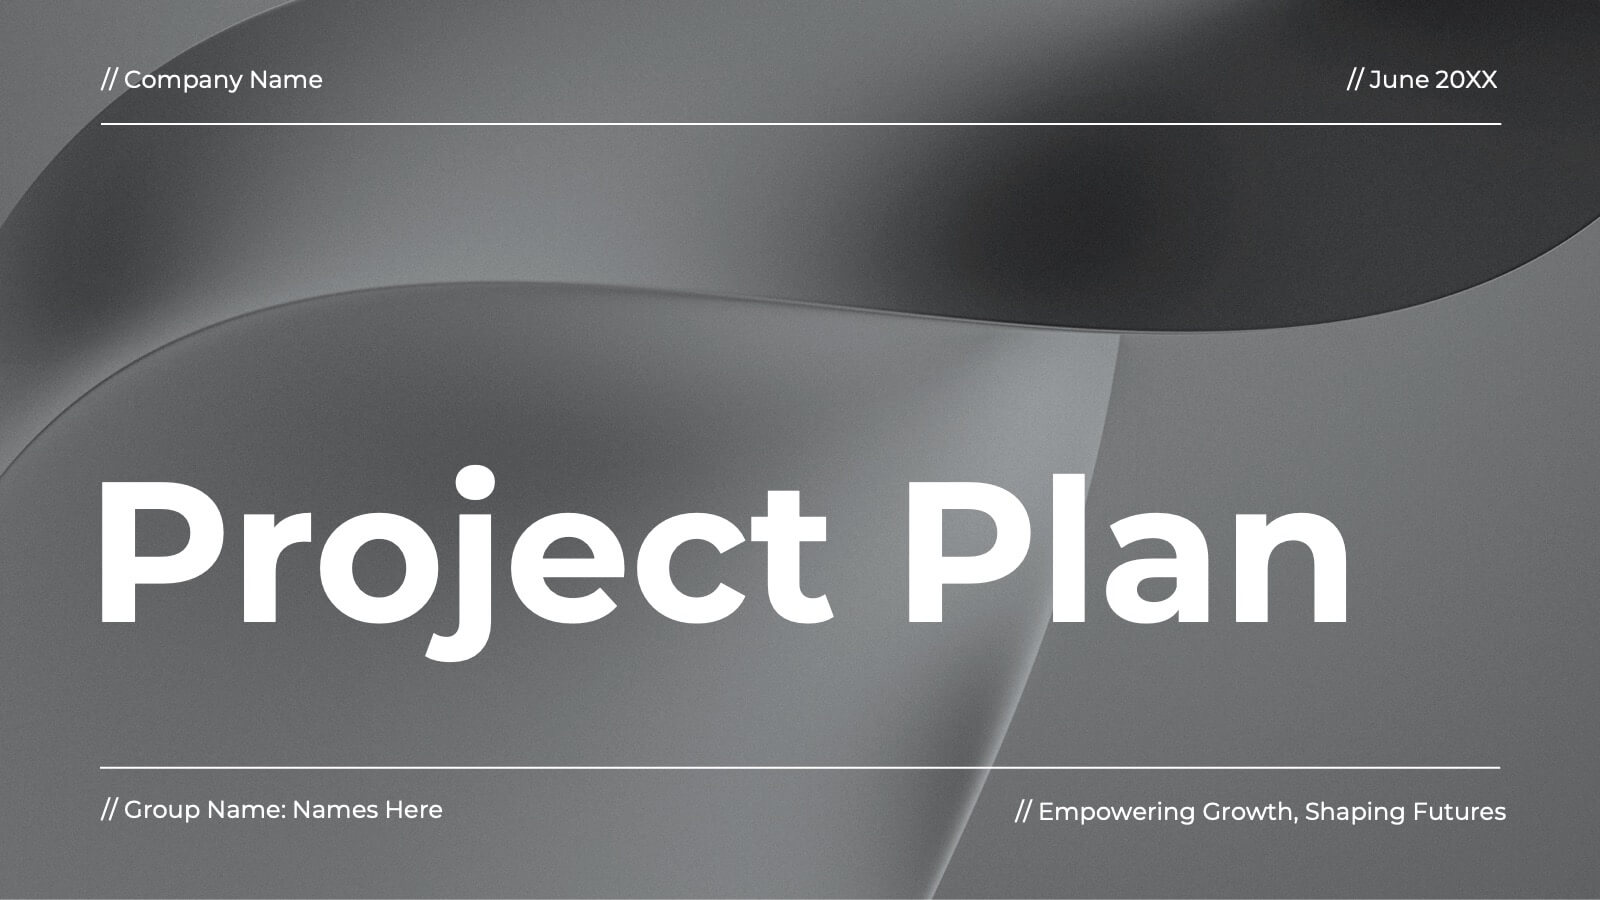
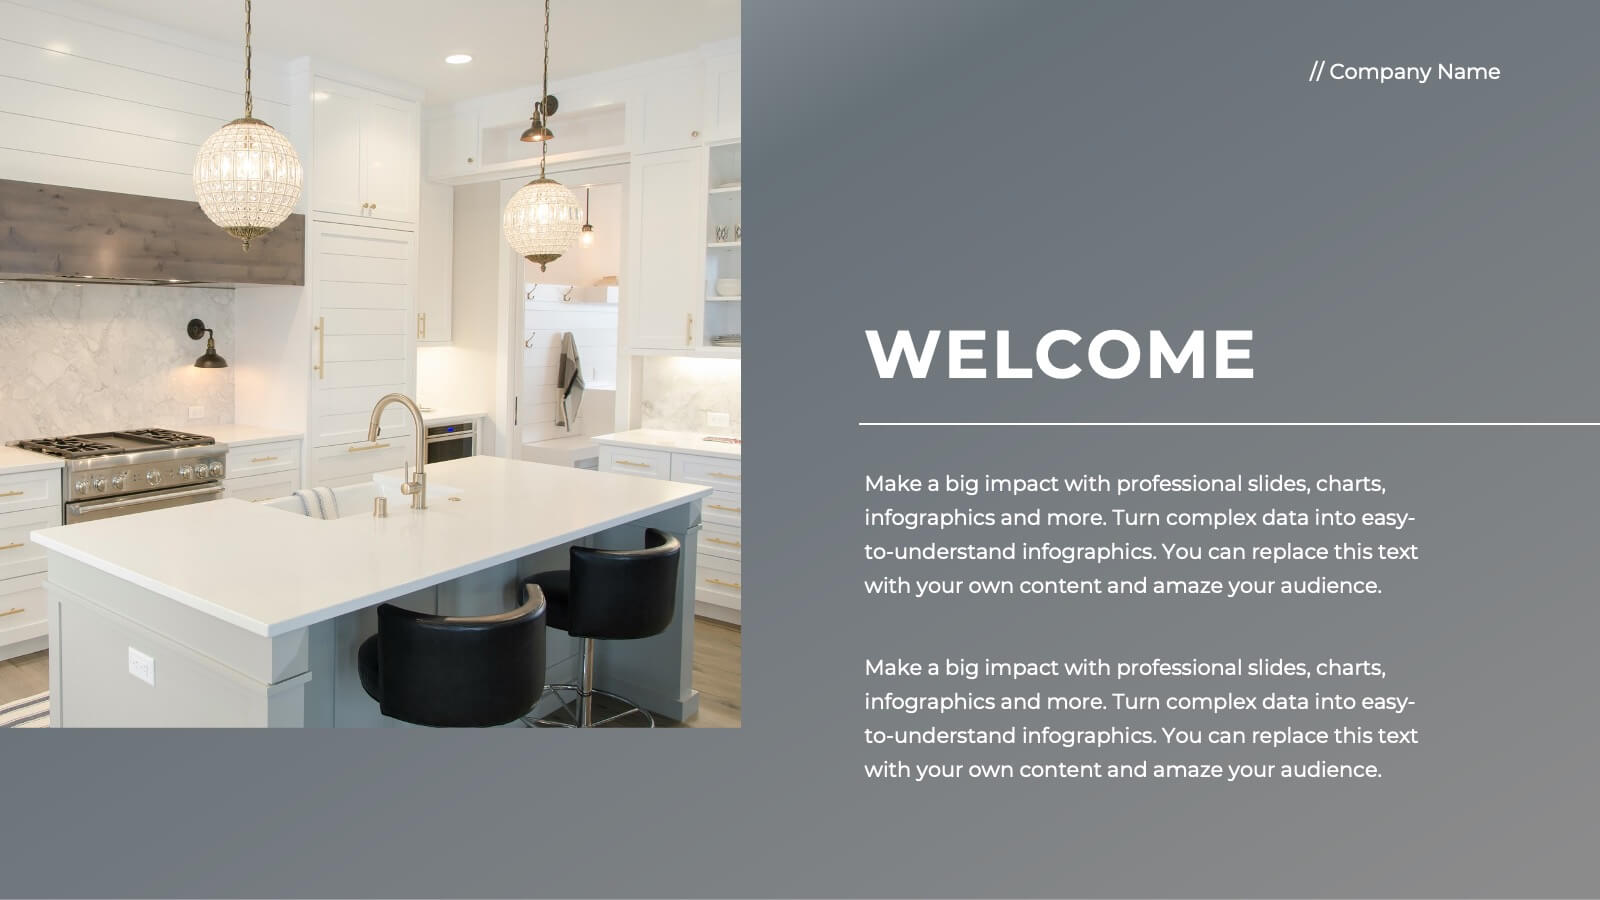
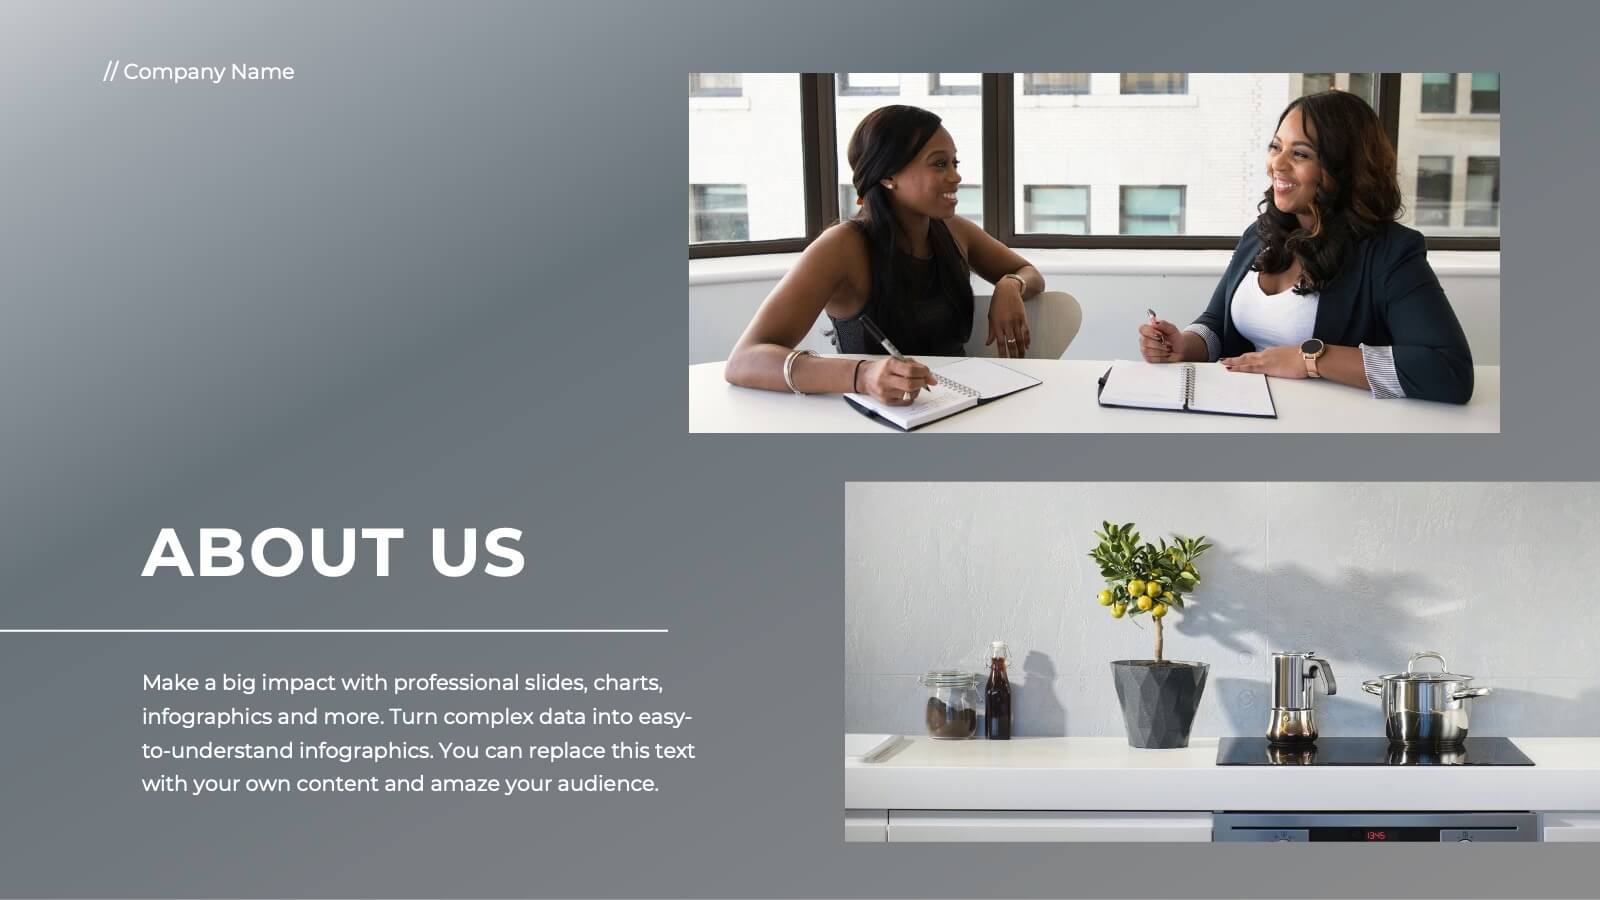
Ember Full-Service Agency Project Plan Presentation
Elevate your agency's presentation with this sleek project plan template! Ideal for showcasing your team's vision, market analysis, and client success stories, it includes slides for strategic development, campaign execution, and partnerships. Impress clients and stakeholders with professional visuals and detailed content. Compatible with PowerPoint, Keynote, and Google Slides for seamless presentations on any platform.


14 diapositivas
Business Expense and Cost Control Presentation
Optimize your financial strategy with the Business Expense and Cost Control Presentation template. This slide helps visualize cost management, spending efficiency, and budgeting strategies with a clear, data-driven layout. Ideal for financial planners, business analysts, and executives aiming to streamline operational expenses. Fully customizable in PowerPoint, Keynote, and Google Slides.


24 diapositivas
Catalyst Strategic Planning Report Presentation
Unleash your strategic vision with the Catalyst Strategic Planning Report template! This vibrant and dynamic layout is designed to make your strategic planning presentations not only effective but also visually captivating. The template’s playful yet professional design elements, including bold color blocks and creative graphics, draw attention to key points, ensuring your message resonates with your audience. From SWOT analysis to market trends, and resource allocation to action plans, every slide is crafted to communicate your strategic objectives clearly and compellingly. Perfect for business reviews, strategic meetings, or investor presentations, this template allows you to present data-driven insights and actionable steps in an engaging manner. It’s fully customizable, making it easy to adapt to your brand’s colors and style. Whether you’re presenting to a team or stakeholders, the Catalyst template provides the perfect platform to articulate your vision. Compatible with PowerPoint, Keynote, and Google Slides, it’s your go-to tool for impactful strategic presentations!


21 diapositivas
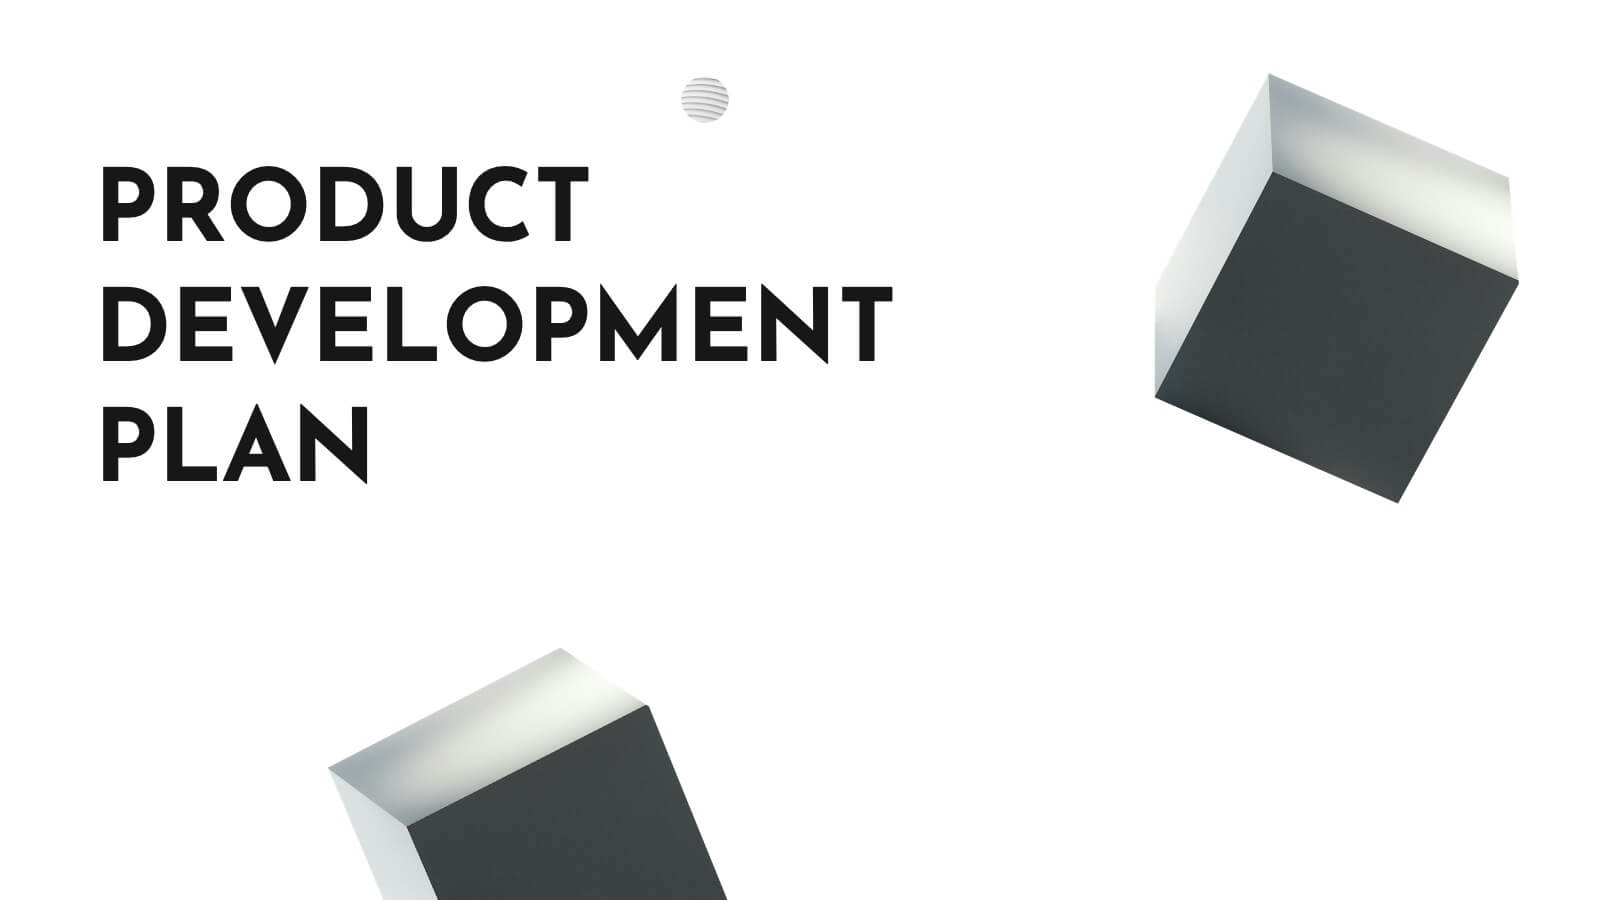
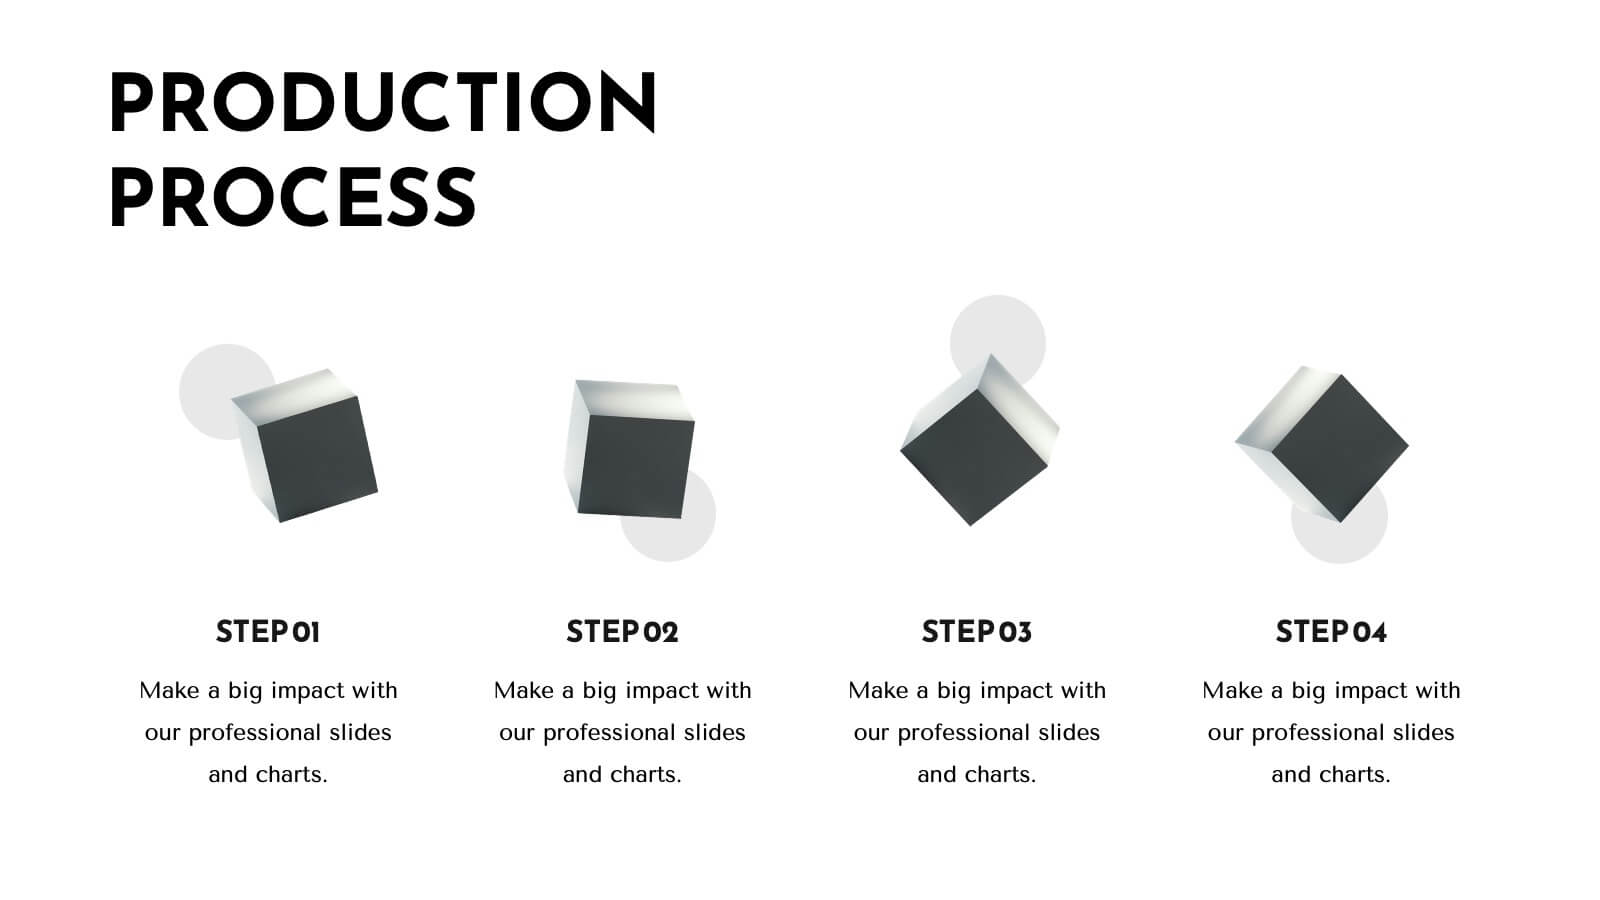
Trident Product Development Plan Presentation
Present your product development strategy with this sleek, professional template! Highlight company overview, product features, and unique selling proposition. Ideal for showcasing market analysis, pricing strategy, and production process. Perfect for developers and project managers. Compatible with PowerPoint, Keynote, and Google Slides.


4 diapositivas
Workplace Safety and Compliance Presentation
Ensure a safer work environment with our 'Workplace Safety and Compliance' presentation template. Perfect for illustrating essential safety protocols and compliance standards, this visual tool boosts understanding and adherence. Fully compatible with PowerPoint, Keynote, and Google Slides, it's an excellent resource for any safety-oriented presentation.


5 diapositivas
Renewable Energy Sector Infographics
Illuminate your audience's knowledge with our renewable energy sector infographics. Radiating with vibrant shades of orange, yellow, and blue, this creative, vertical template breathes life into data and trends in the clean energy realm. Compatible with Powerpoint, Keynote, and Google Slides. Whether you're an environmental advocate or an academic researcher, these infographics, embellished with relevant graphics and icons, serve as a catalyst for enlightening discussions. From solar power breakthroughs to wind energy statistics, these visual aids are geared to power impactful presentations and reports in the renewable energy sector.


8 diapositivas
Business Data Analytics Dashboard
Monitor performance with clarity using this Business Data Analytics Dashboard. Featuring data bars, numeric highlights, and color-coded insights, this slide is perfect for quarterly updates, data reviews, or executive summaries. Clean and professional, it's fully editable in PowerPoint, Keynote, and Google Slides.