


Características


¿Tienes alguna pregunta?
Recomendar


6 diapositivas
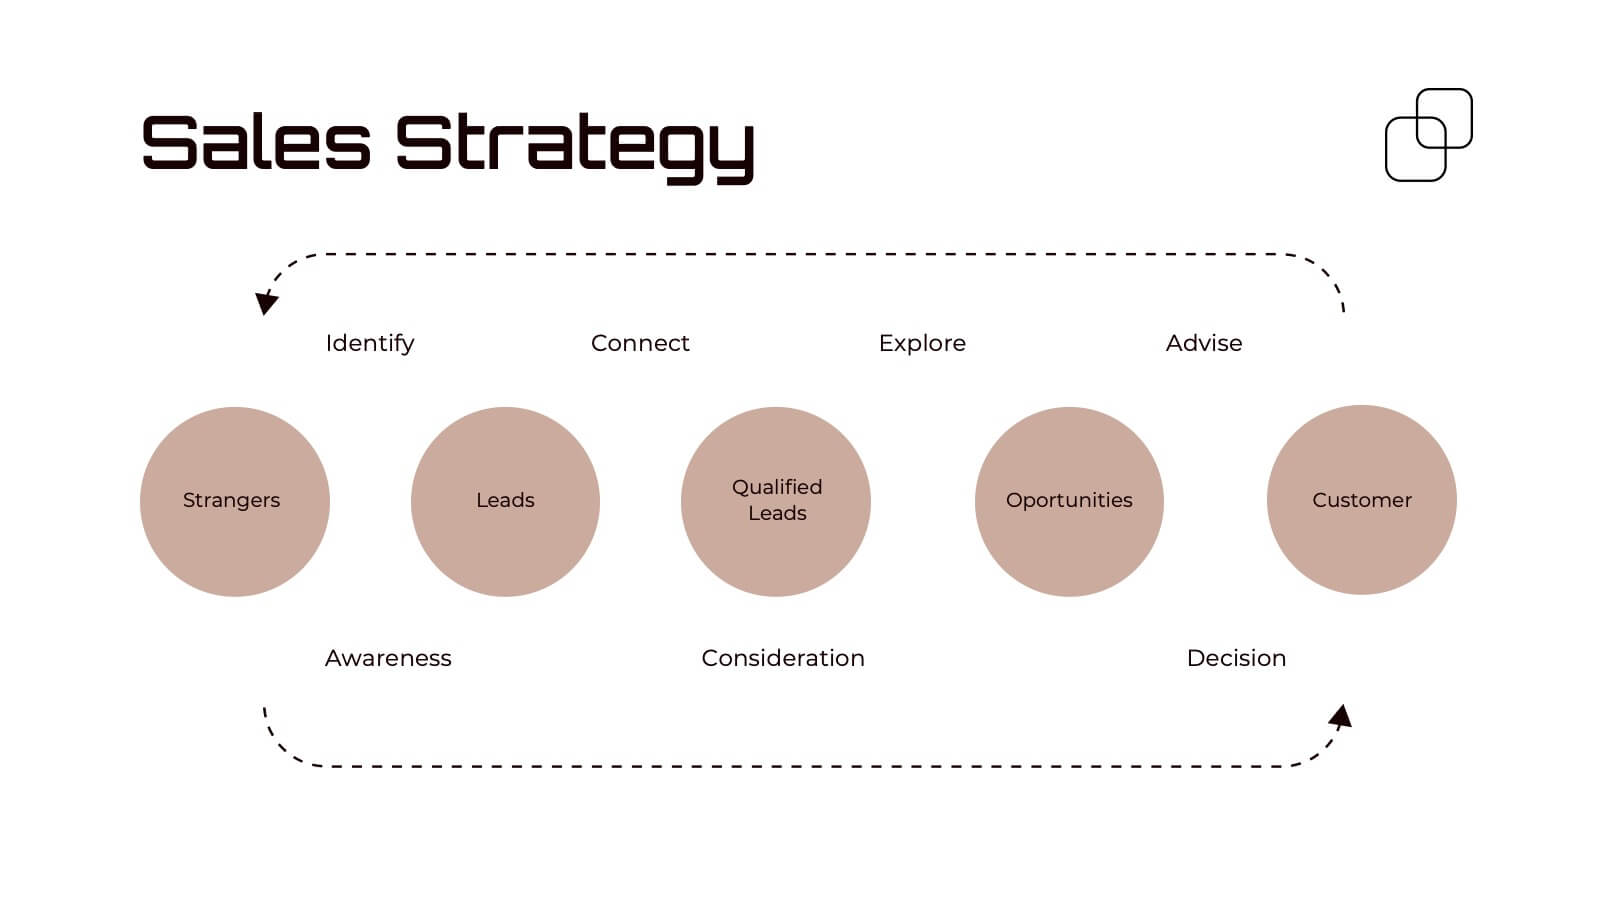
Funnel Stages Infographic
In marketing and sales, the term "funnel stages" refers to the different stages or steps that a potential customer goes through in their journey from initial awareness of a product or service to making a purchase decision. These infographics visualize and help you understand the customer's progression through these stages. They aim to help businesses and professionals understand the customer journey and optimize their strategies for each stage of the funnel. Whether used in sales presentations, marketing workshops, or educational materials, this template helps businesses build successful sale funnels and maximize their revenue potential.


10 diapositivas
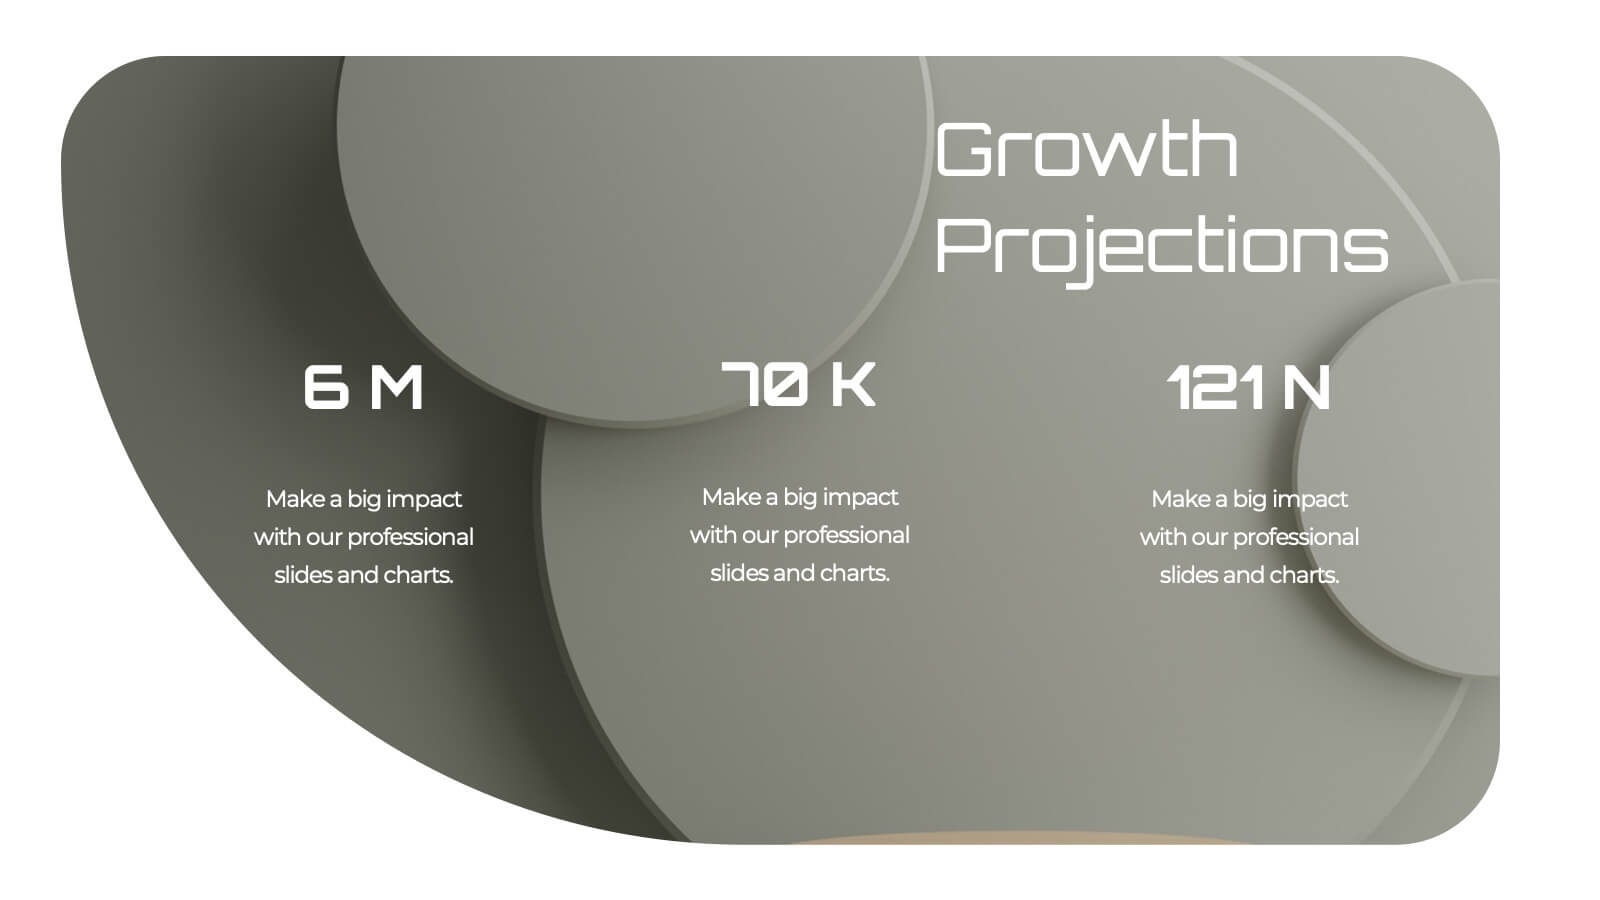
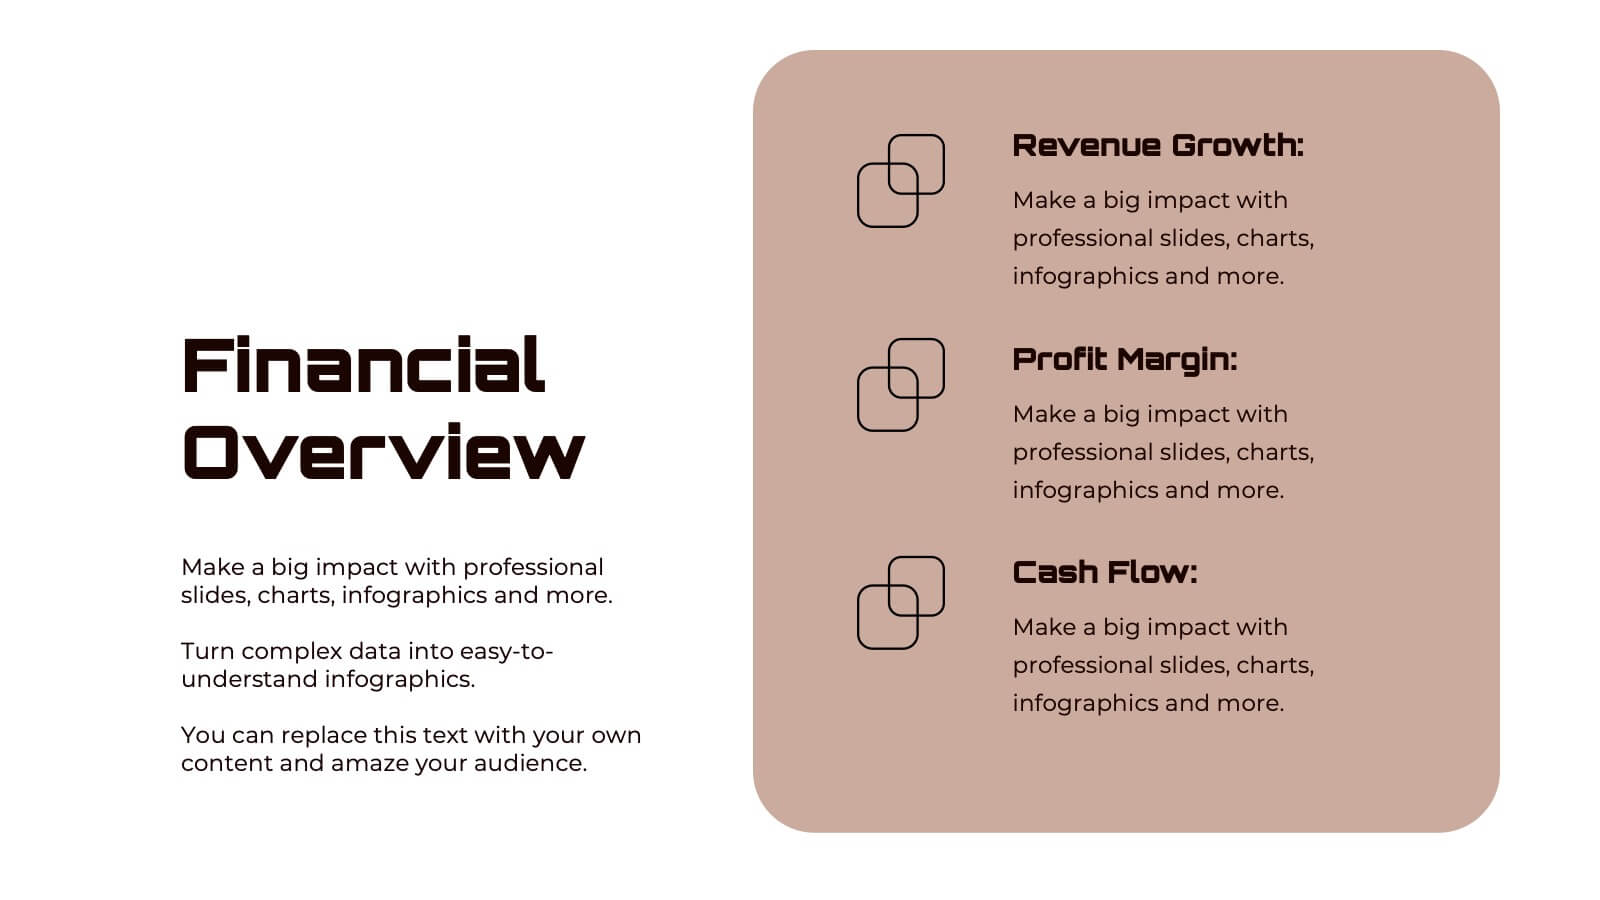
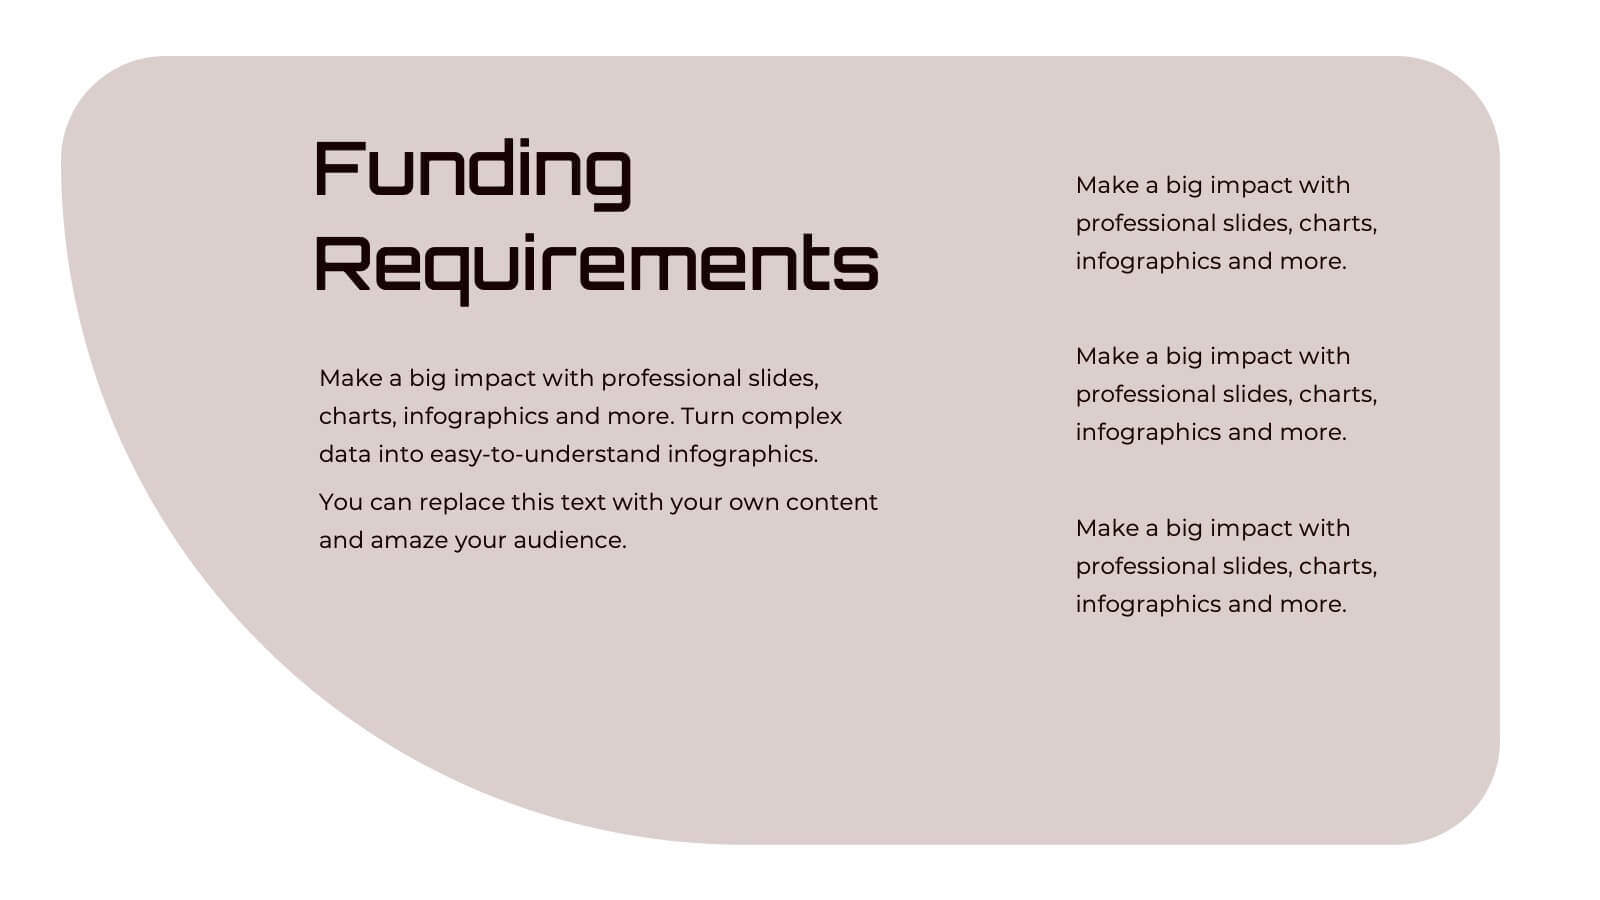
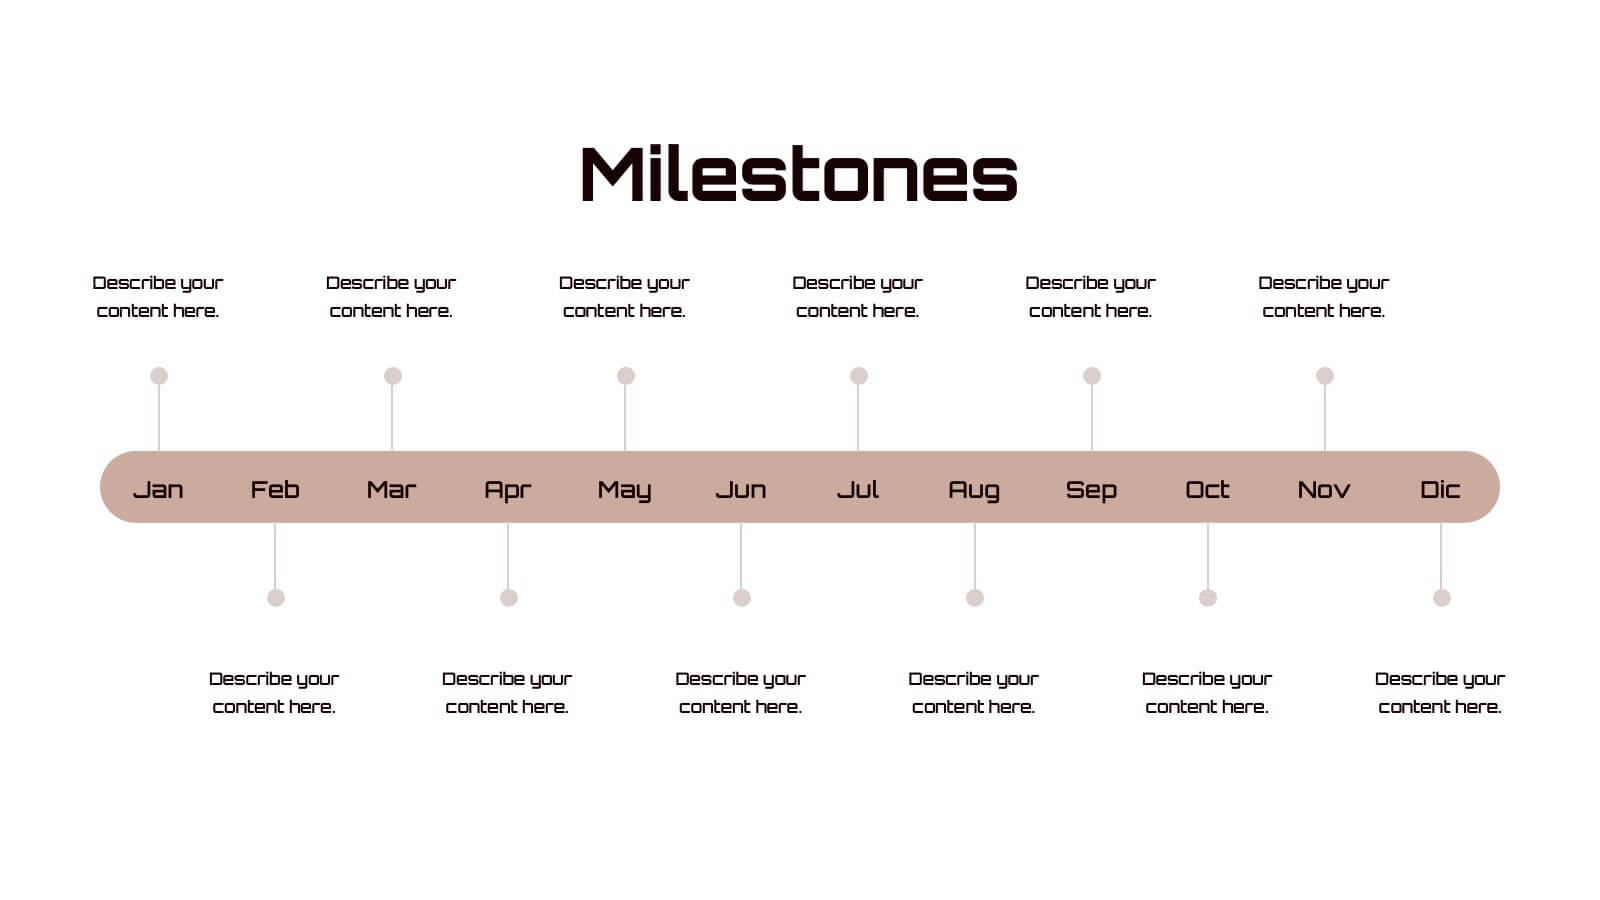
Overcoming Market Challenges Presentation
Overcome business obstacles with confidence using this Overcoming Market Challenges template. Designed with a dynamic step-by-step growth visual, this slide helps illustrate challenges, solutions, and progress in an engaging way. Ideal for strategy meetings, financial forecasts, and competitive analysis, this template makes complex information easy to understand. Fully editable for PowerPoint, Keynote, and Google Slides.


6 diapositivas
Stakeholder Analysis Chart Infographic
Stakeholder analysis is a process used by organizations to identify and assess the interests, concerns, expectations, and potential impact of various individuals, groups, or entities that have a stake in a particular project, decision, or initiative. The goal of this infographic is to better understand the perspectives and needs of different stakeholders and to use this information to inform decision-making and project planning. This template summarizes the importance of stakeholder analysis in project management or organizational decision-making. This compatible with Powerpoint, Keynote, and Google Slides.


4 diapositivas
Layered Pyramid Structure Diagram Presentation
Break down your data into visual layers with this Layered Pyramid Structure Diagram presentation. Ideal for showing proportions, hierarchies, or step-based processes, each pyramid tier is color-coded and labeled with editable titles and percentage values. Fully customizable in Canva, PowerPoint, and Google Slides to match your business or educational needs.


7 diapositivas
Pillar Distribution Infographic
Discover a striking visual representation of data with the pillar distribution Infographic. Bathed in shades of blue, white, and green, this template masterfully showcases the core foundations of any topic in a 'pillar' format. Specifically tailored for business analysts, educators, and marketers, the infographic aids in simplifying dense information. With its crisp graphics, bespoke icons, and dedicated image placeholders, conveying your insights becomes an engaging narrative experience. Its versatility ensures smooth integration with PowerPoint, Keynote, and Google Slides, transforming any presentation into a captivating visual story.


6 diapositivas
Harvey Ball Assessment Infographics
Evaluate performance or satisfaction with our Harvey Ball Assessment infographic template. This template is fully compatible with popular presentation software like PowerPoint, Keynote, and Google Slides, allowing you to easily customize it to represent and communicate assessment results using Harvey Balls. The Harvey Ball Assessment infographic template offers a visually engaging platform to visually depict evaluations, ratings, or levels of satisfaction using Harvey Balls. Whether you're a manager, HR professional, or evaluator, this template provides a user-friendly canvas to create informative presentations and reports to convey assessment outcomes effectively. Enhance your assessment reporting with this SEO-optimized Harvey Ball Assessment infographic template, thoughtfully designed for clarity and ease of use. Customize it to showcase assessment data, ratings, and scores, making it a valuable tool for sharing performance or satisfaction levels with your audience. Start crafting your personalized infographic today to communicate your assessment results efficiently.


4 diapositivas
Task and Role Allocation Matrix
Clarify team responsibilities with this modern Task and Role Allocation Matrix. Easily visualize who is Responsible, Accountable, Contributing, and Informed for each task. Ideal for team leaders, HR planners, and project coordinators. Fully customizable in PowerPoint, Keynote, and Google Slides.


4 diapositivas
Real Estate and Housing Market Presentation
Turn market insights into visual stories that captivate investors and clients alike. This sleek and modern presentation helps you illustrate property trends, housing data, and real estate growth with clarity and confidence. Fully customizable and compatible with PowerPoint, Keynote, and Google Slides for easy editing and professional results.


6 diapositivas
Achieving Career Success Presentation
Achieve your professional goals with the Achieving Career Success Presentation template. Designed for career coaches, professionals, and personal development strategists, this slide deck helps outline key milestones, success strategies, and growth trajectories in a visually compelling way. With a sleek, modern layout and clear step-by-step structure, this template is fully customizable and compatible with PowerPoint, Keynote, and Google Slides.


6 diapositivas
Circle Schedule Infographic
A circle schedule, also known as a radial schedule, is a visual representation of time management that organizes tasks or activities in a circular format. This visually engaging infographic allows you to create a dynamic and intuitive schedule using a circular design. The template offers a creative way to showcase time-based information, such as daily routines, event schedules, project timelines, or weekly agendas. This can be used in various contexts where schedules or timelines need to be visually presented. Fully customizable and compatible with Powerpoint, Keynote, and Google Slides.


7 diapositivas
Framework Documentation Infographic
A framework infographic presents a framework for organizing and understanding complex information, to provide an overview of the key elements and relationships between them. This template is designed to break down your large amounts of information into smaller, more manageable parts. This infographic can be used in fields such as business, marketing, and strategy, as well as in education and research. Use it to explain complex concepts, theories, and models, and to provide a visual representation of how elements fit together. This can take a variety of forms, including flowcharts and diagrams.


6 diapositivas
Meeting Planner Infographics
Efficiently plan and organize meetings with our Meeting Planner infographic template. This template is fully compatible with popular presentation software like PowerPoint, Keynote, and Google Slides, allowing you to easily customize it to illustrate and communicate the key steps and strategies for effective meeting planning. The Meeting Planner infographic template offers a visually engaging platform to outline the meeting planning process, including scheduling, agenda creation, participant coordination, and follow-up actions. Whether you're a project manager, event planner, or business professional, this template provides a user-friendly canvas to create informative presentations and educational materials on meeting planning best practices. Optimize your meeting planning skills and efficiency with this SEO-optimized Meeting Planner infographic template, thoughtfully designed for clarity and ease of use. Customize it to showcase tips for successful meetings, tools for scheduling, and strategies for engaging participants, ensuring that your audience becomes more proficient in planning and executing productive meetings. Start crafting your personalized infographic today to become a more effective Meeting Planner.


22 diapositivas
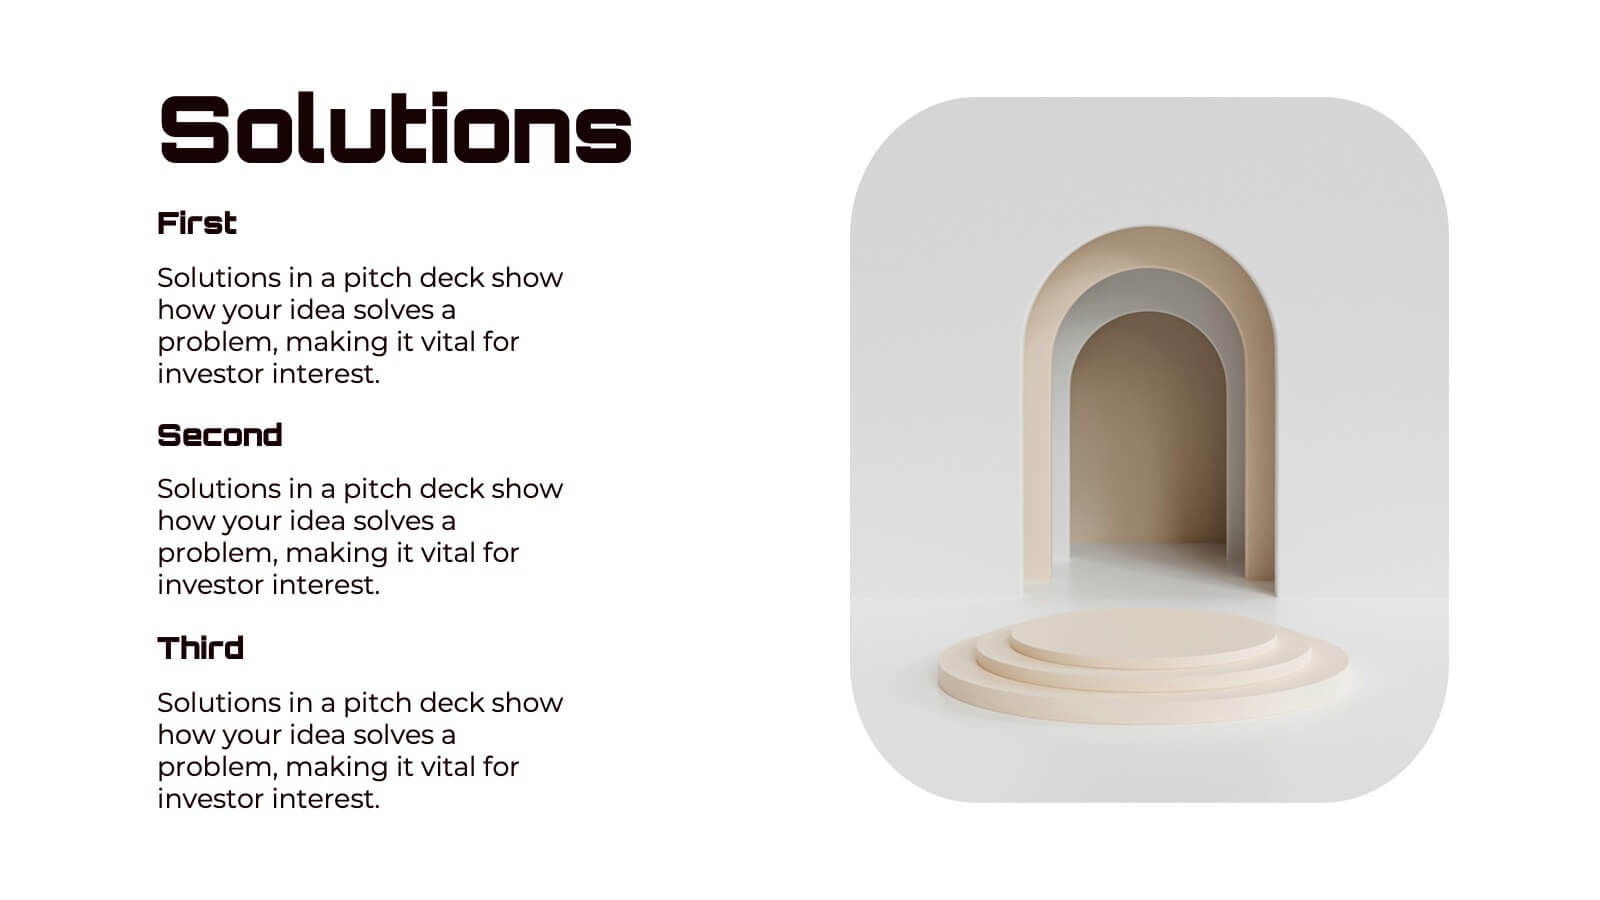
Pearl Product Launch Pitch Deck Presentation
Make your product launch shine with this sleek, pearl-inspired presentation! Perfect for pitching your product’s unique value, market positioning, and growth potential, this template is designed to captivate investors and stakeholders. Its elegant, minimalist layout keeps your message front and center. Compatible with PowerPoint, Keynote, and Google Slides.


7 diapositivas
Simple Schedule Infographic
Effortlessly structure your time with our simple schedule infographic. Rendered in a clean white canvas, enhanced with dependable blue tones and anchored with timeless black, our template is the epitome of clarity and organization. Equipped with streamlined infographics, universal icons, and adaptable image placeholders, it facilitates easy time management and daily planning. Seamlessly tailored for Powerpoint, Keynote, or Google Slides. A fundamental tool for project managers, event planners, educators, or any professional aiming to efficiently allocate their time. Plan with ease; let every slide bring order to your daily chaos.


6 diapositivas
Organizational Structure Framework Presentation
Unlock the potential of your organization with our Organizational Structure Framework template. This versatile tool is designed to help you present and analyze various business structures, from chain-of-command to functional divisions. Ensure clear, concise communication of strategies across your organization. Perfect for use in PowerPoint, Keynote, and Google Slides, this template supports a professional presentation of your organizational strategy, ensuring alignment and clarity in your business processes.


5 diapositivas
Banking Security Service Infographics
Navigate the complexities of financial safety with our banking security services infographics template. Dressed in calming pastel tones of cream, blue, purple, and yellow, this invaluable tool is tailored for banking professionals, financial consultants, and cybersecurity experts. Its vertical, creative, and informative design is dense with up-to-date graphics and icons, simplifying intricate data into engaging content. Whether it's for client presentations, or internal communications, this template translates banking security concepts into visually striking, easily understandable infographics, bolstering confidence and comprehension.


7 diapositivas
Big Data Infographic Presentation Template
This Big Data Infographic template is the perfect tool for any business presentation. This template has been designed to help you create truly engaging data-driven visuals, with powerful typography and interesting details that help draw in your audience. Introduce your business to the world with this big data infographic template. It's just what you need to describe the role of big data in the evolution of modern businesses. Our Big Data Infographic Presentation features all the tools for you to create wonderful charts, graphs, transitions and striking shapes both for your text and images.