


Características


¿Tienes alguna pregunta?
Recomendar


19 diapositivas
Philosium Design Strategy Proposal Presentation
Bring your creative vision to life with this sleek and structured design strategy proposal presentation. Covering key elements like concept development, wireframes, typography, and user research, this template helps you communicate a compelling design approach. Fully customizable and compatible with PowerPoint, Keynote, and Google Slides for a seamless and professional presentation experience.


8 diapositivas
Effective Leadership Strategy
Visualize leadership pillars with this bold hexagonal layout designed to showcase four key components of effective leadership. Each colored segment allows you to present core strategies like vision, communication, decision-making, and team empowerment. Perfect for business training, organizational development, or executive briefings. Fully customizable in PowerPoint, Keynote, and Google Slides.


7 diapositivas
Stakeholder Analysis Infographics Presentation Template
A stakeholder analysis is a process used to identify stakeholders and analyze the needs of each stakeholder. The purpose of a stakeholder analysis is identifying the people who are involved, or interested in your project and determining how best to involve and communicate with each of them throughout. This template is the perfect tool to help you embrace, or get started on, your stakeholder analysis. With this template, you are taken through each step of a stakeholder analysis in a strategic and easy-to-follow manner. This template makes it easy to communicate your plan and influence change.


5 diapositivas
Scientific Research Presentation
Break down complex processes with clarity using this Scientific Research Presentation Template. Featuring a modern lab flask visual segmented into four stages, it’s perfect for illustrating experimental phases, research progress, or scientific data. Ideal for educators, researchers, and science-based companies. Fully compatible with PowerPoint, Keynote, and Google Slides for effortless editing.


7 diapositivas
Pyramid Model Infographic
A pyramid model is a visual representation that uses the structure of a pyramid to convey information, concepts, or hierarchies in a clear and visually engaging manner. Our Pyramid Model Infographic template is the perfect tool to depict your concepts in a structured way. This template embodies an essence, enabling you to present your ideas in a way that's both powerful and timeless. This infographic is a powerful representation of your ideas, allowing you to showcase their strength, structure, and enduring potential. Use this template to construct a visual masterpiece that stands tall, just like the pyramids of ancient times!


6 diapositivas
Customer Journey Map Presentation
Visualize the customer experience step-by-step with the Customer Journey Map Presentation. This sleek infographic helps you outline key touchpoints from awareness to post-purchase, making it ideal for marketing strategies, service design, or UX presentations. Fully editable and compatible with PowerPoint, Keynote, and Google Slides.


8 diapositivas
Employee Onboarding Process
Guide new hires with clarity using the Employee Onboarding Process Presentation. This clean, step-by-step visual is perfect for HR managers, team leads, and company trainers. It includes four distinct onboarding phases, each with icons, titles, and editable descriptions to explain the key tasks in each stage—from welcome orientation to integration. Choose between dark and light background versions to suit your branding, and easily edit in PowerPoint, Keynote, or Google Slides.


2 diapositivas
Minimalist Cover Page Design Presentation
A clean, modern visual instantly sets the tone, giving your audience a polished start before your message even begins. This presentation introduces your content with a bold, minimalist layout that feels intentional and professional. Perfect for business, creative, or academic use. Fully compatible with PowerPoint, Keynote, and Google Slides.


5 diapositivas
Professional Business People Collaboration Presentation
Showcase effective teamwork and synergy with this Professional Business People Collaboration slide. The puzzle-piece visual metaphor highlights how diverse roles fit together to build cohesive strategies. With five clearly labeled sections, it’s perfect for project collaboration plans, department overviews, or joint venture strategies. Fully editable and compatible with PowerPoint, Keynote, and Google Slides.


26 diapositivas
Shadowyn Brand Guidelines Proposal Presentation
Present your branding vision with a polished and professional template designed to capture the essence of your identity. This comprehensive set includes sections for brand values, identity components, and voice and tone, ensuring your message is consistent and memorable. Showcase essential details like color palettes, typography, and imagery with visually engaging slides. Communicate your market position, unique selling proposition, and brand strategy clearly to stakeholders. Dive into consumer personas and brand touchpoints for a deeper connection with your audience. Tailor each slide to align with your branding requirements. Perfect for use in PowerPoint, Google Slides, and Keynote, this template is ideal for creative professionals, marketing agencies, and business leaders aiming to make a lasting impression.
20 diapositivas
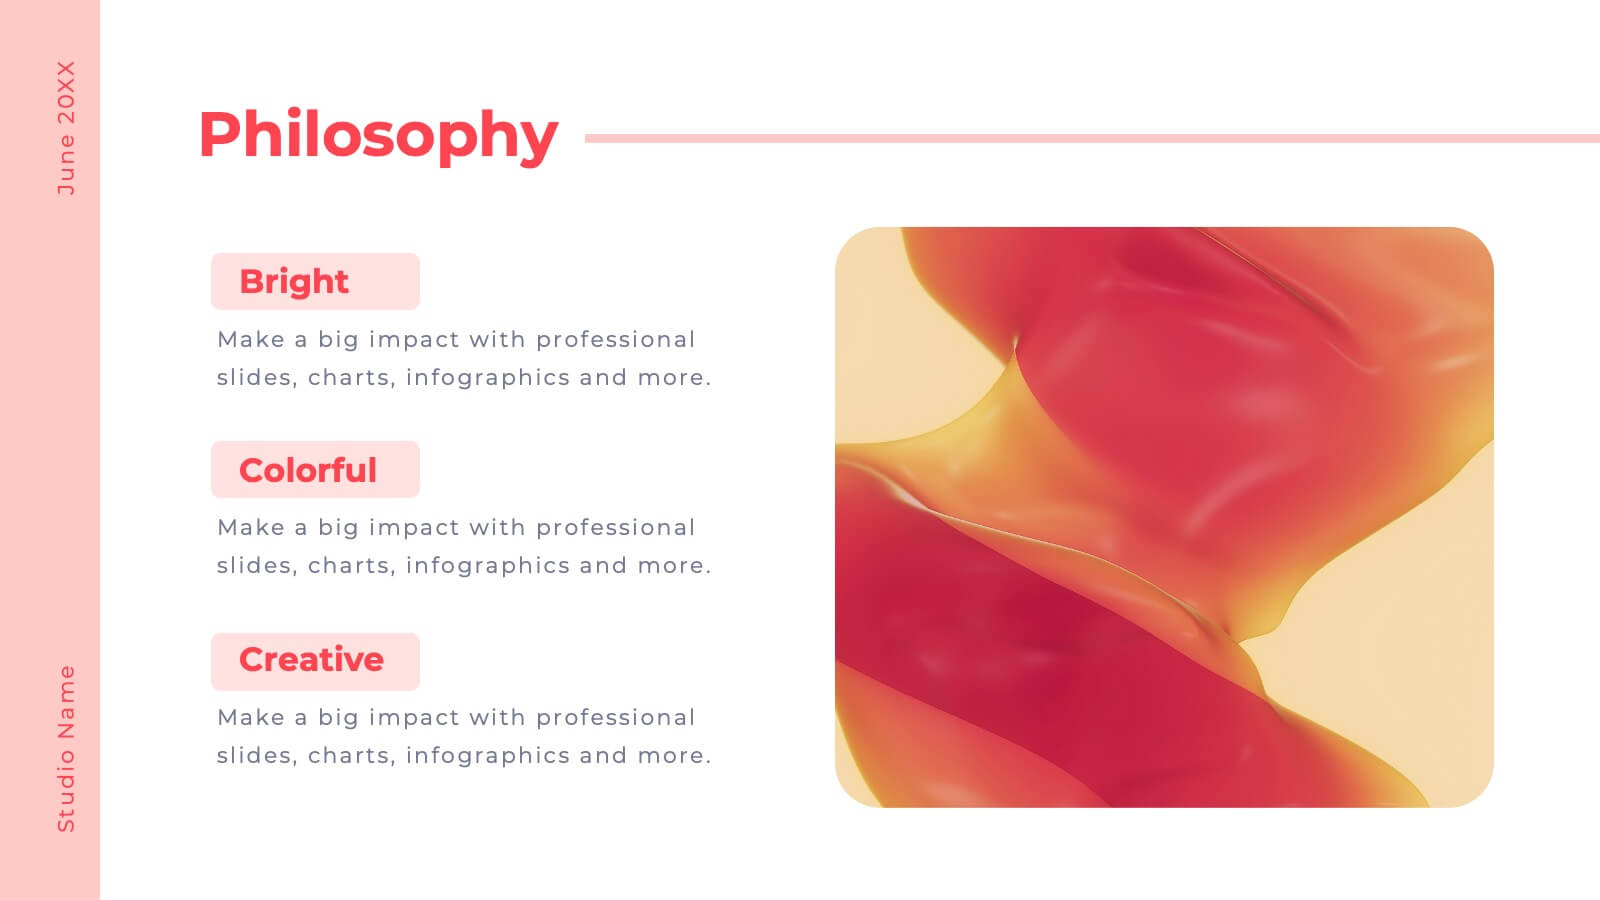
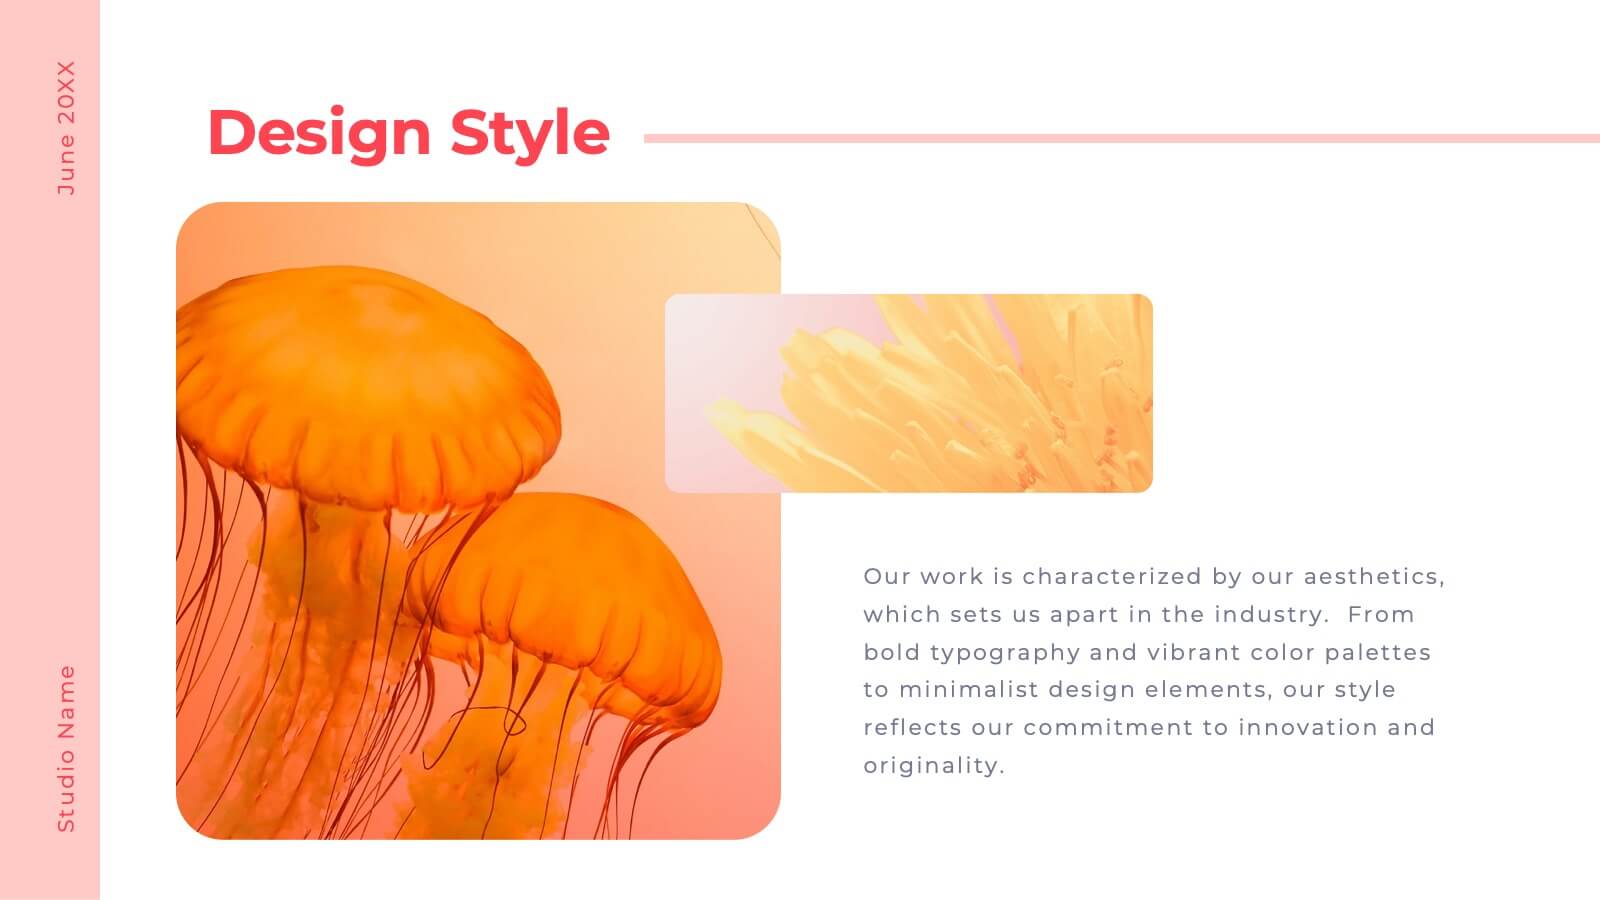
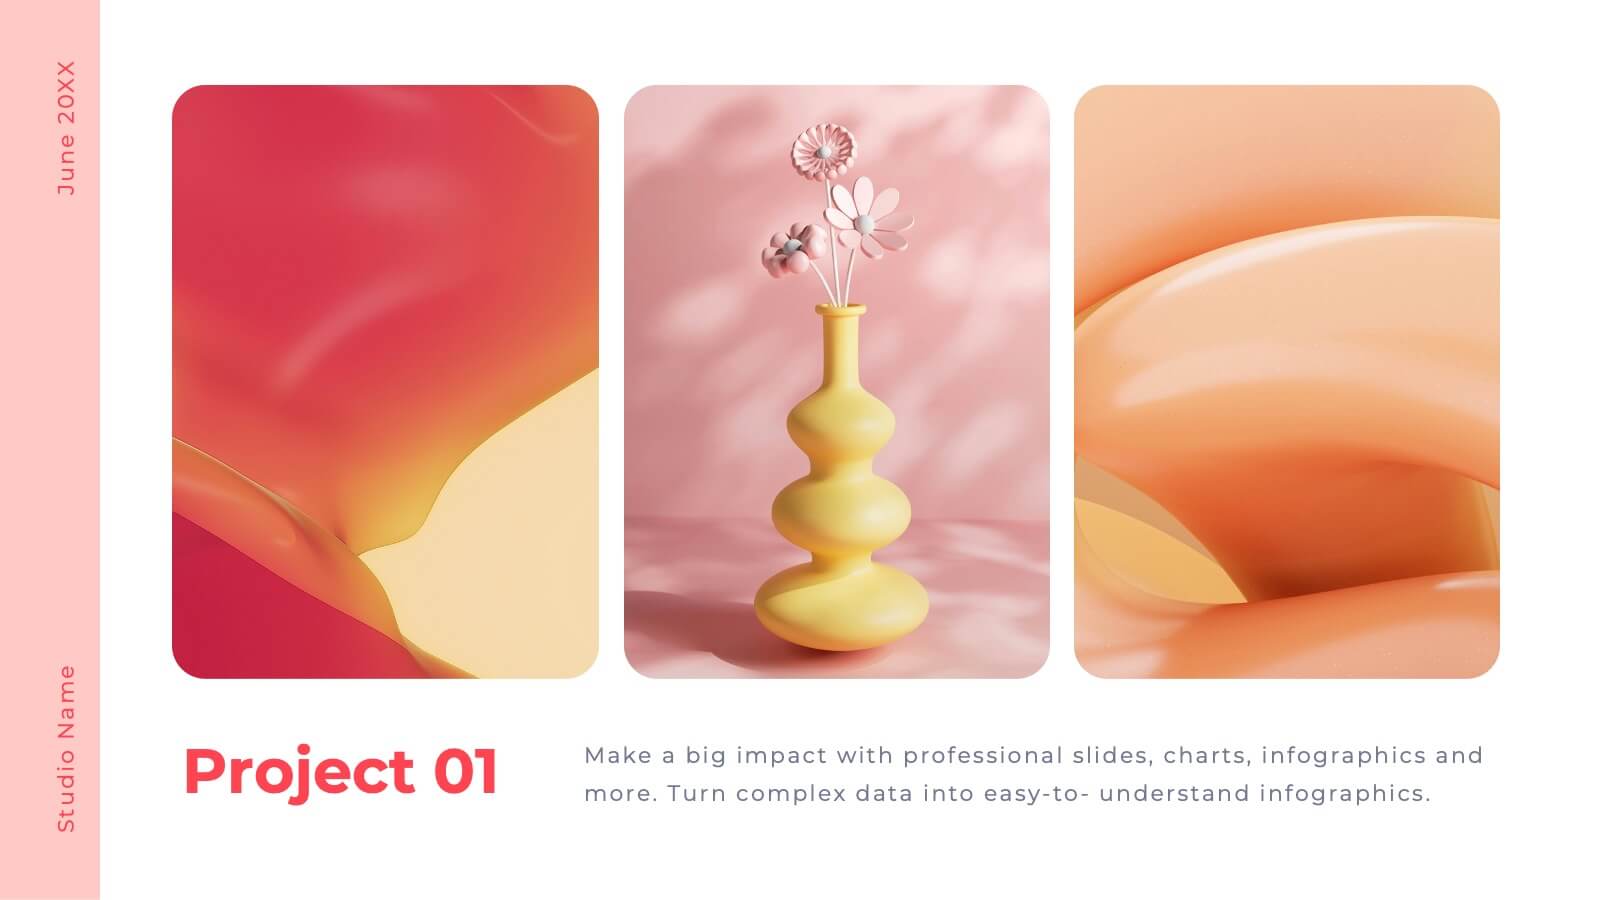
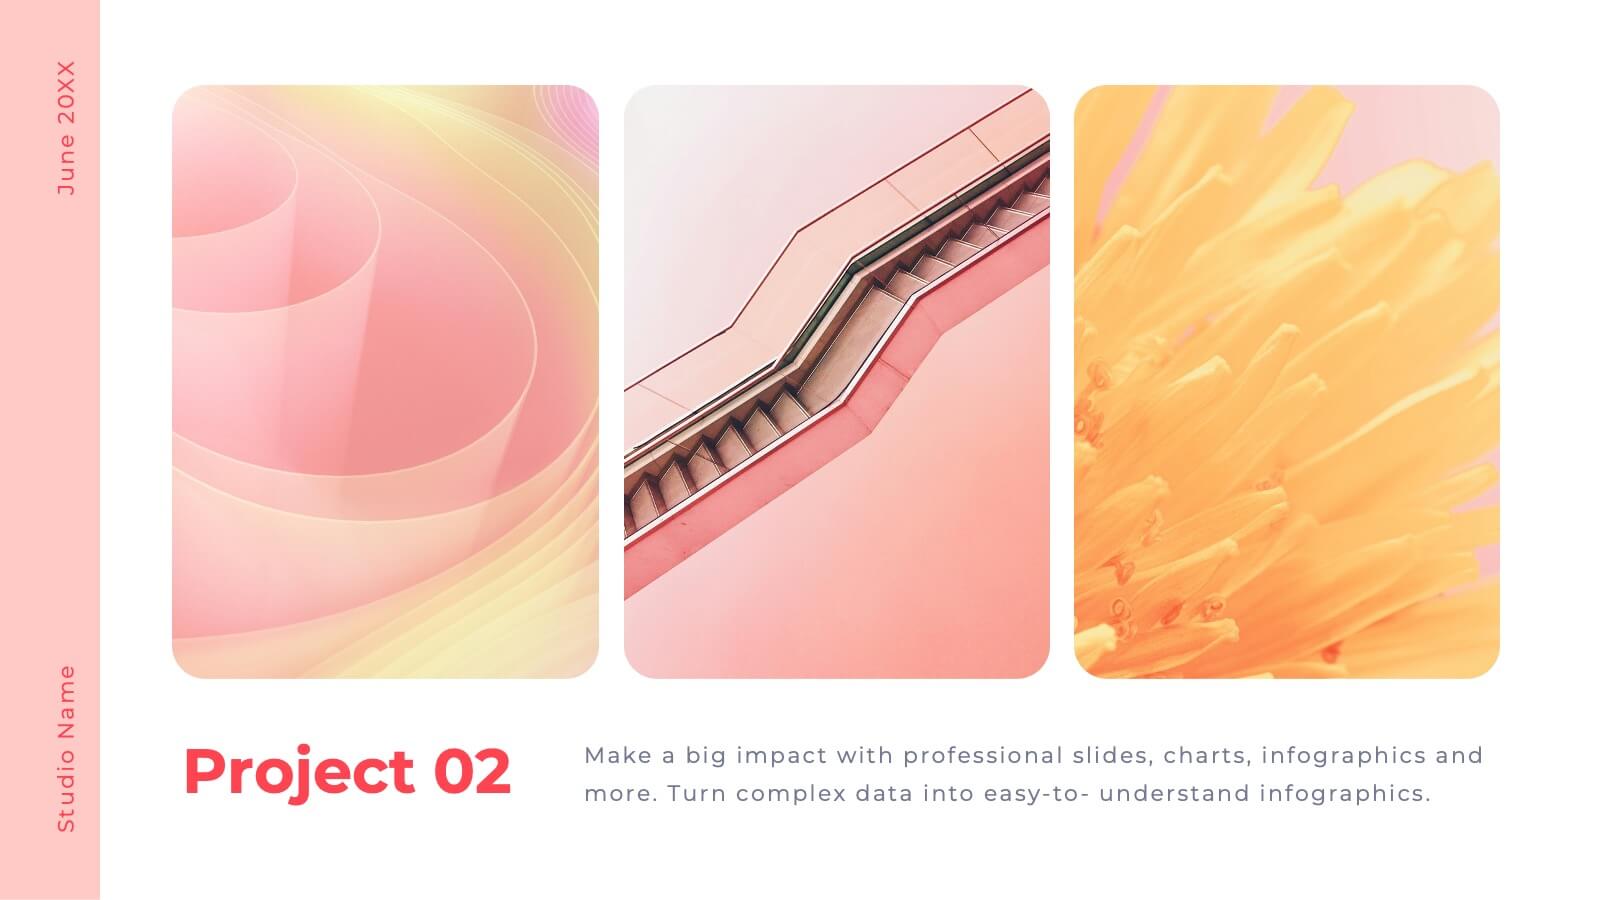
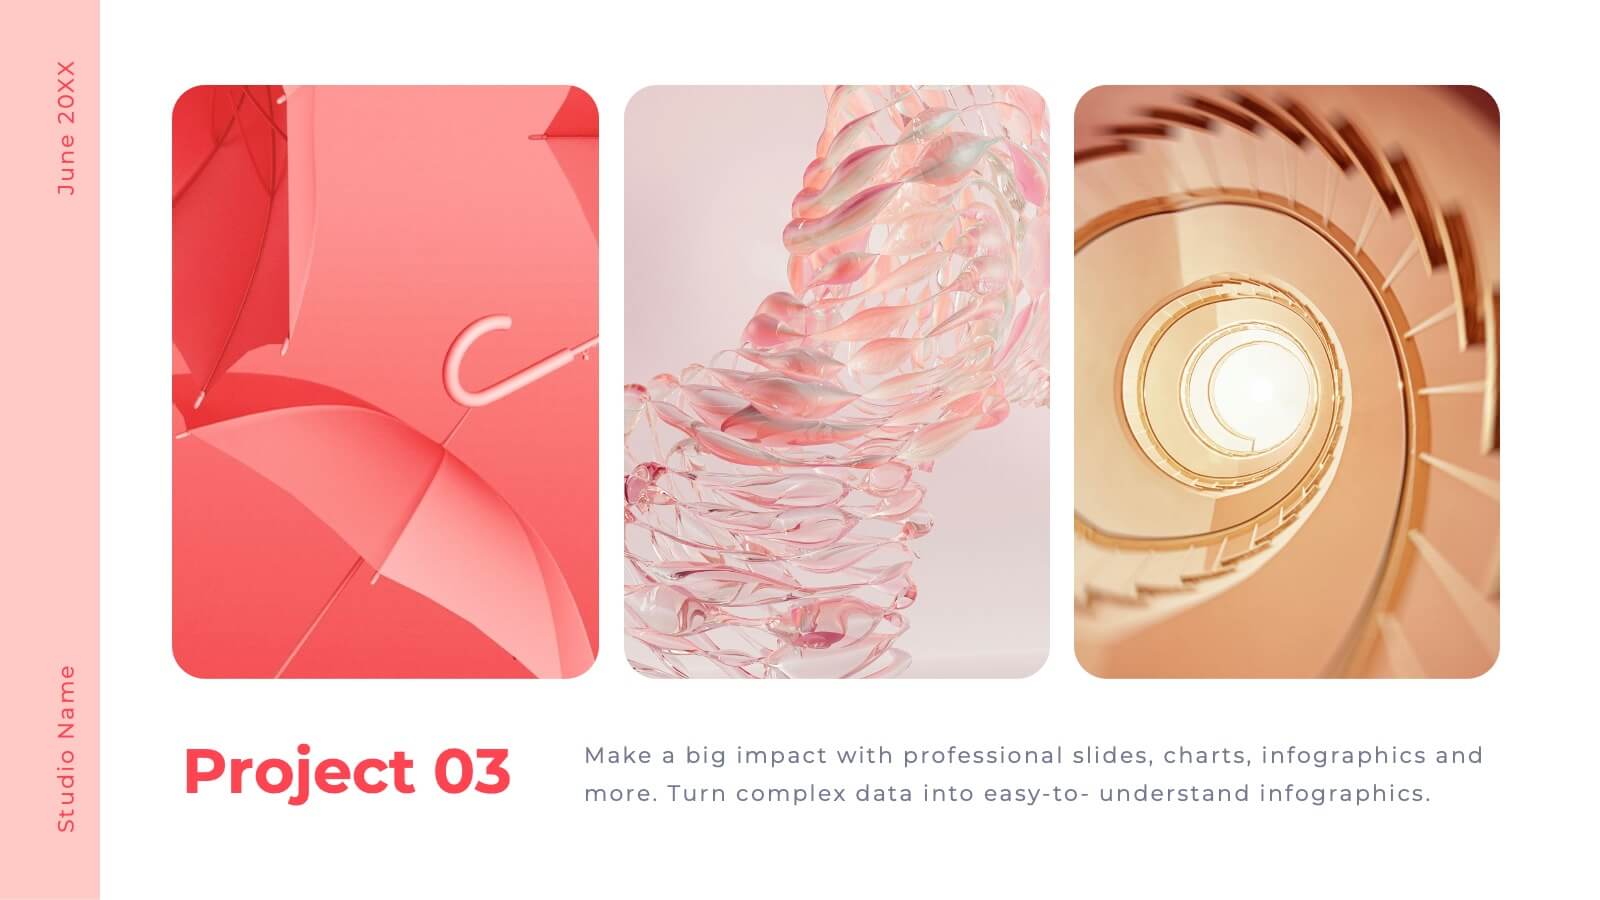
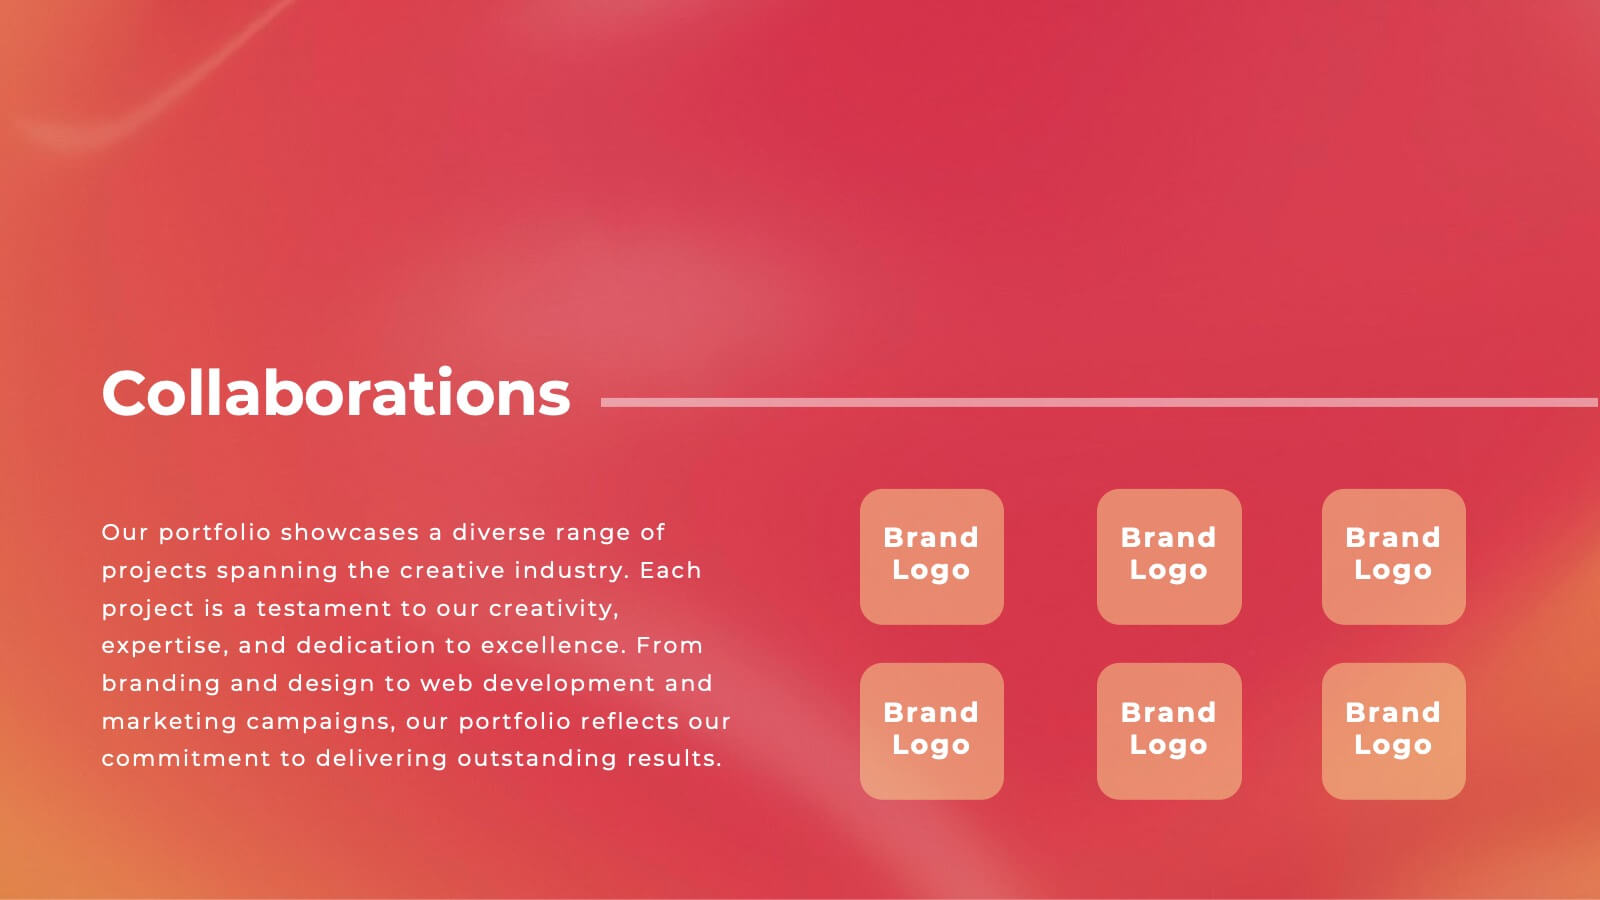
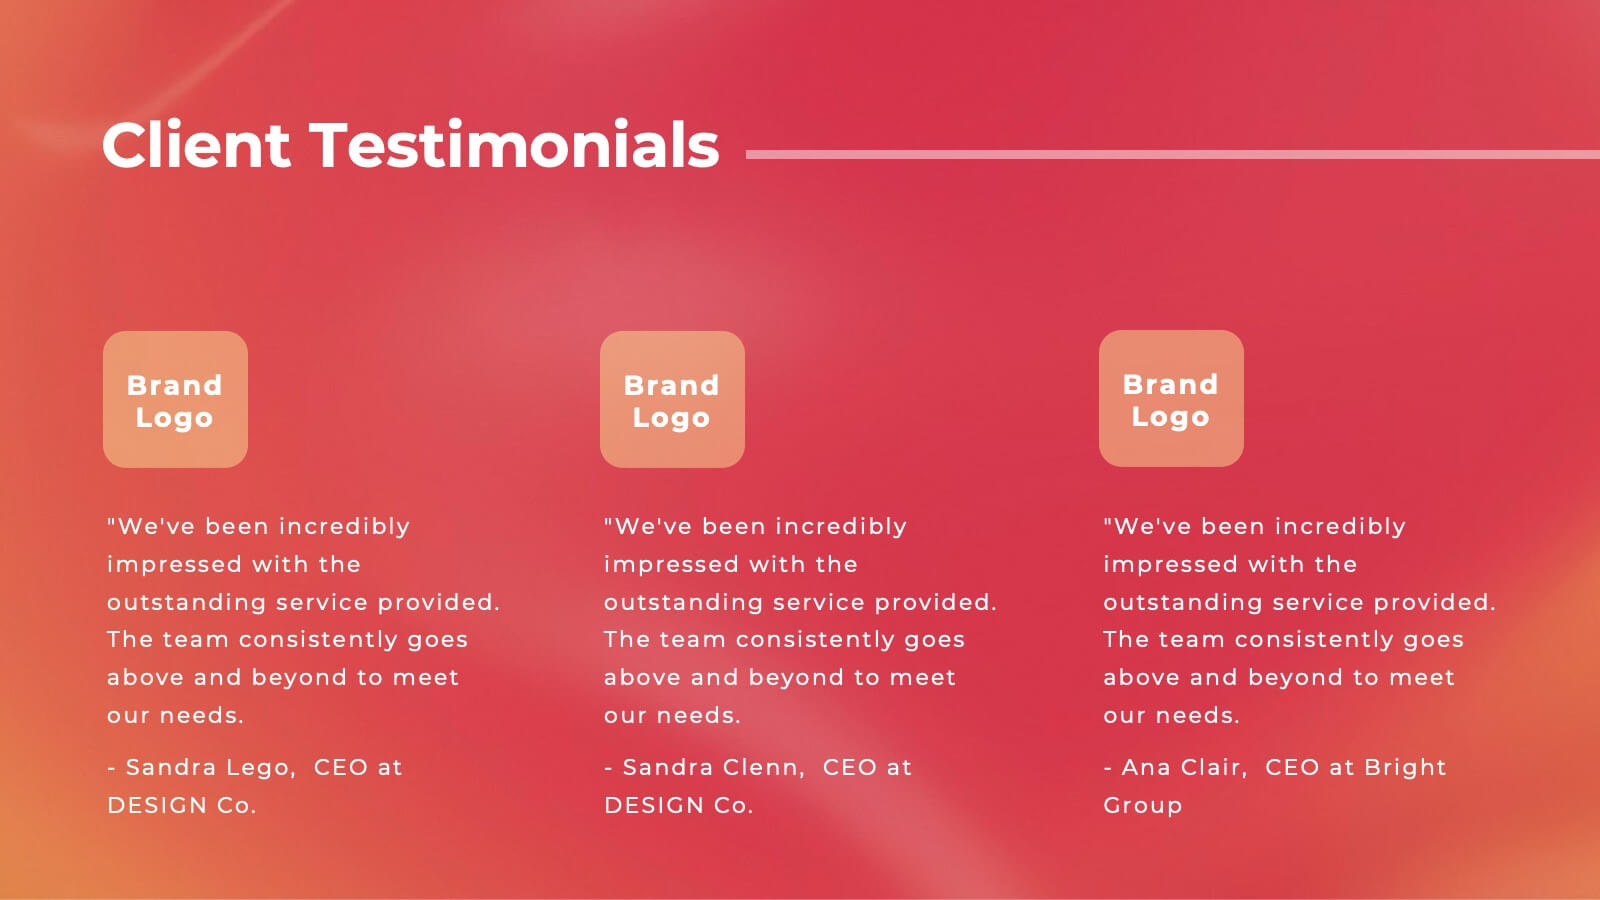
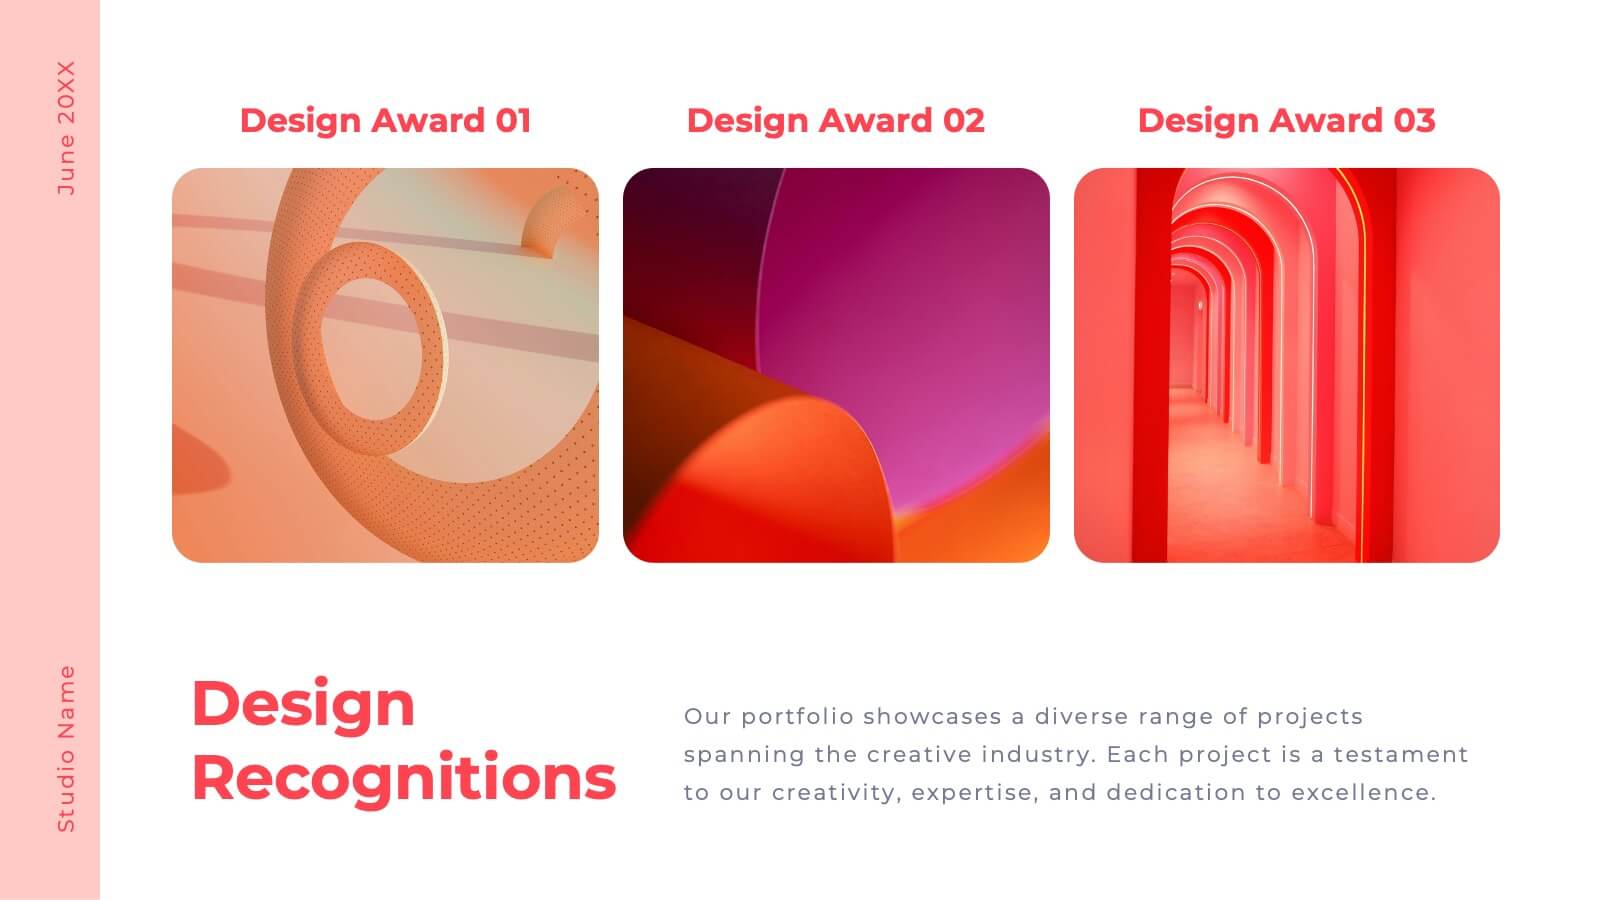
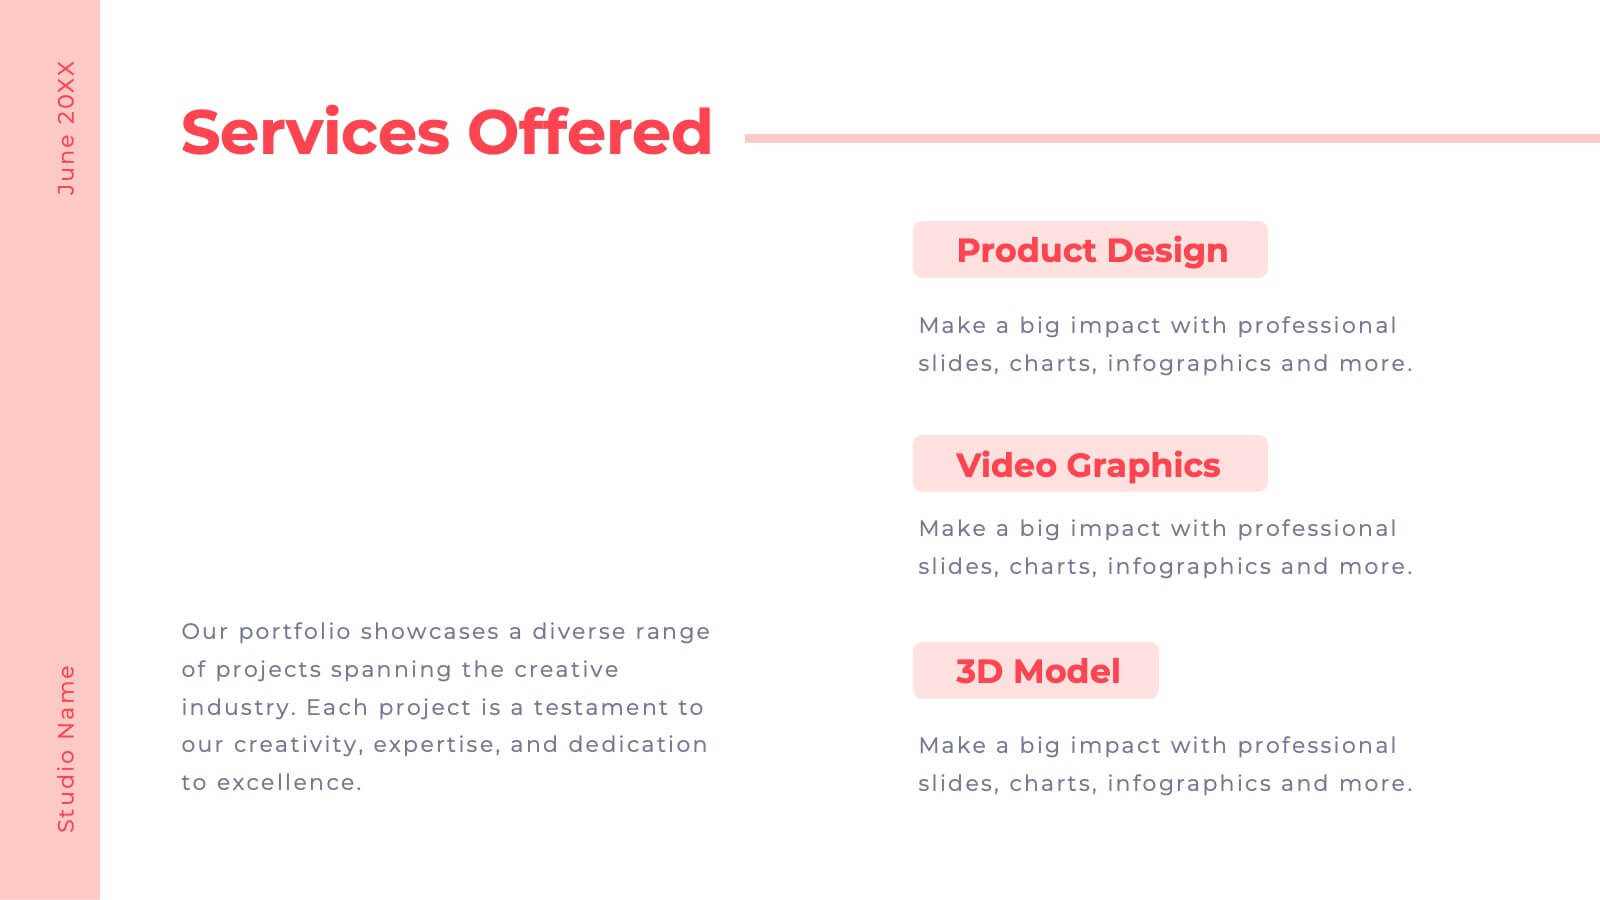
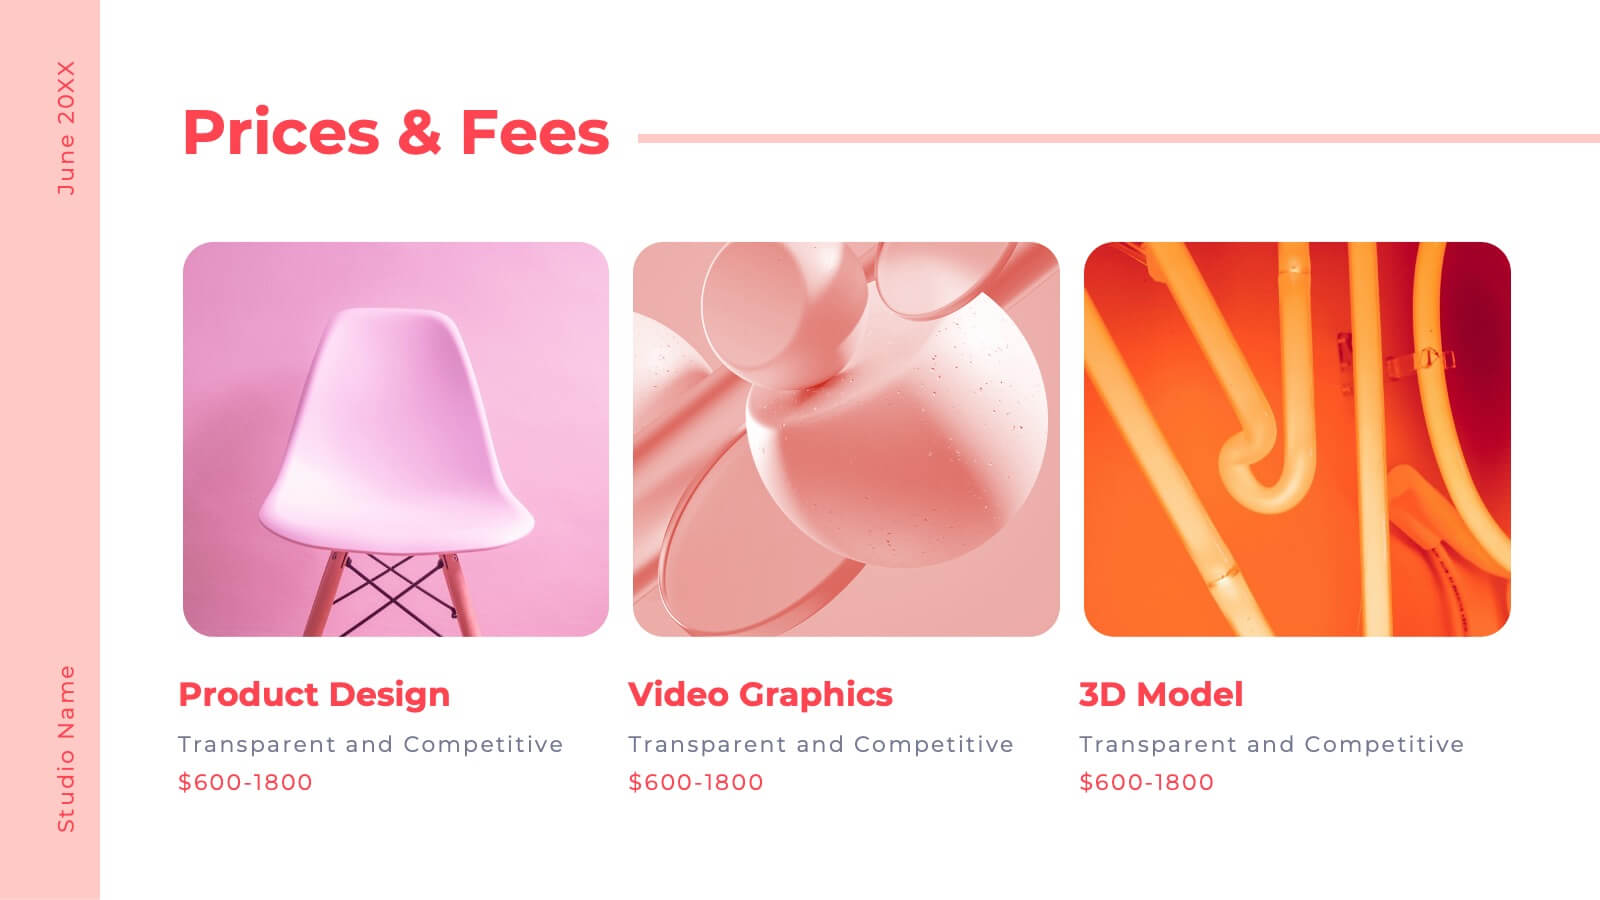
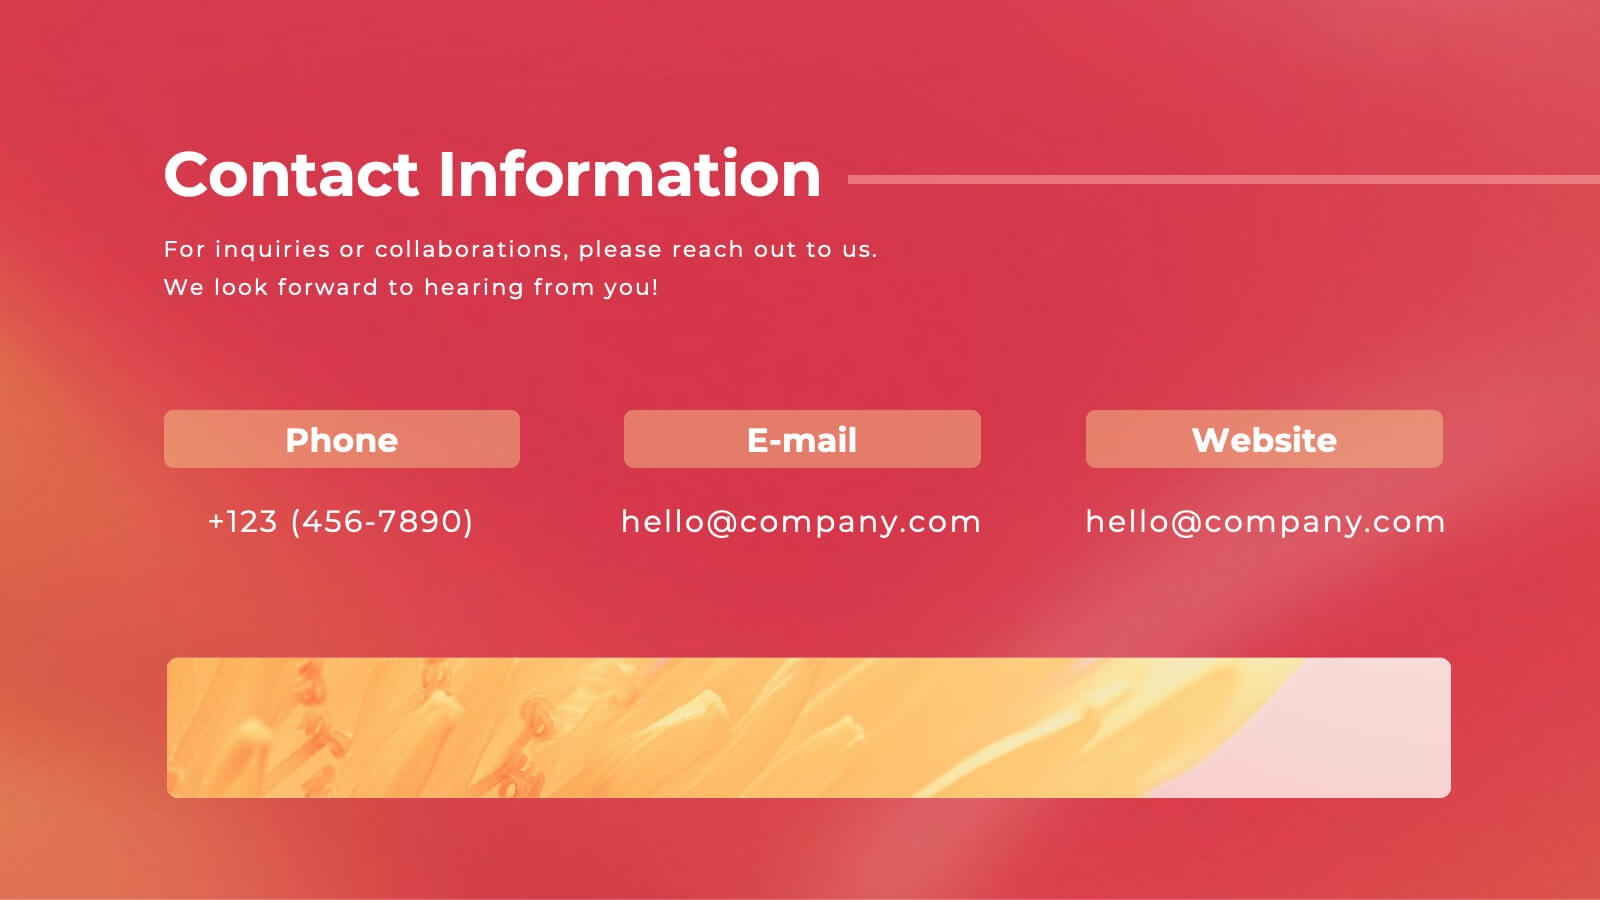
Valor Creative Portfolio Presentation
Step into creativity with this stunning portfolio template! Showcase your projects, design philosophy, and client testimonials with style and flair. Ideal for designers, artists, and creatives wanting to impress. Compatible with PowerPoint, Keynote, and Google Slides, this template elevates every portfolio to new heights. Perfect for making a lasting impact.


7 diapositivas
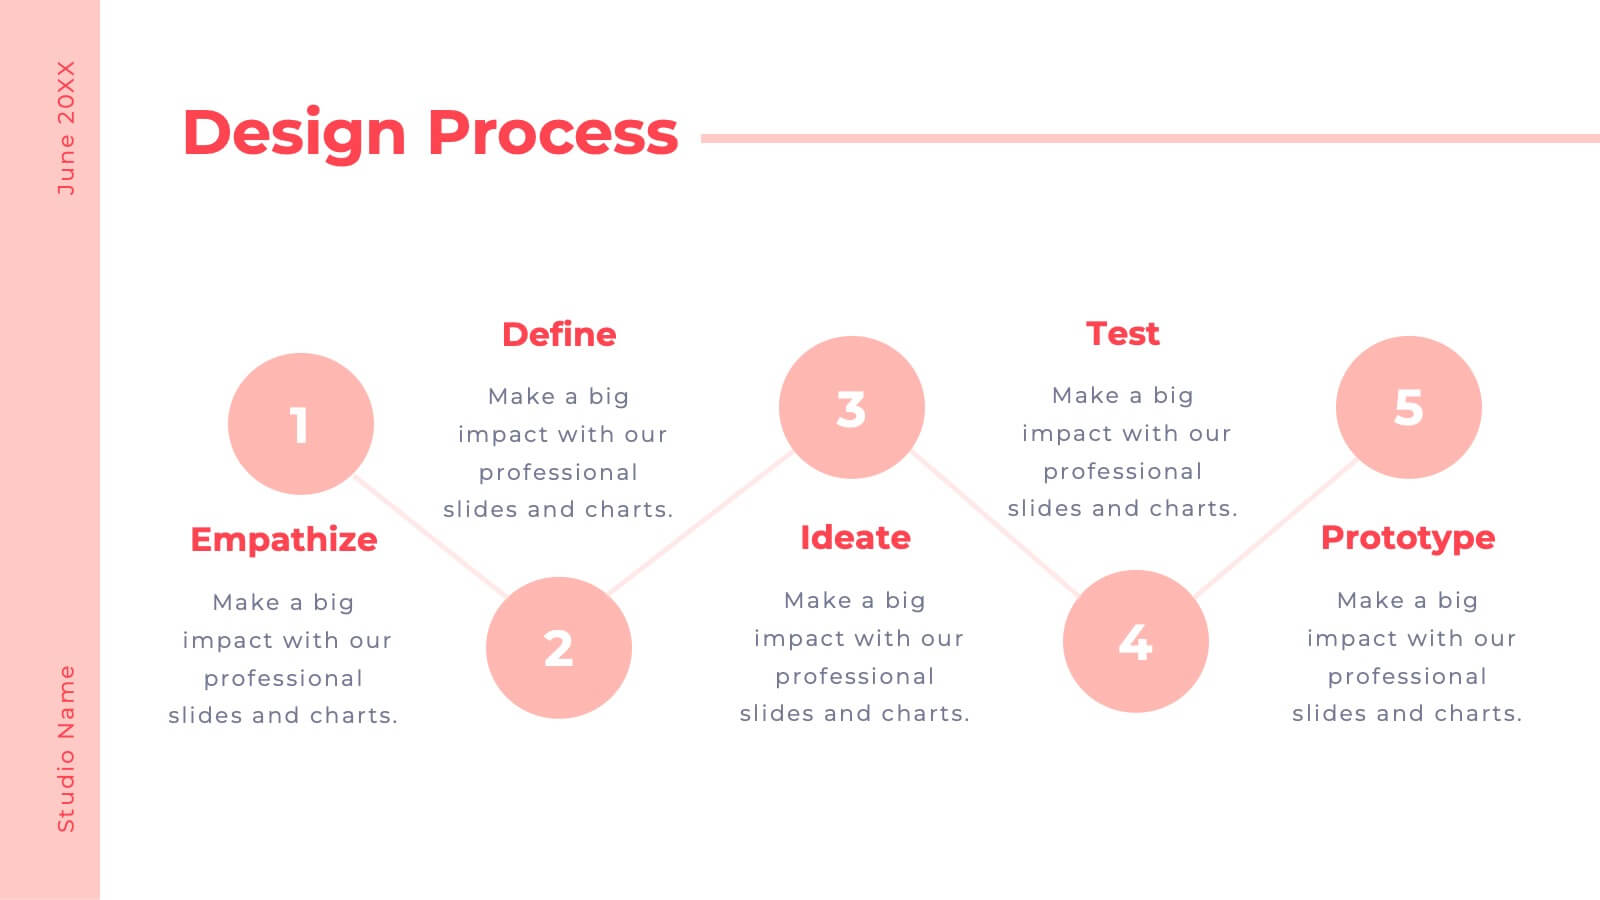
Design Process Infographic Presentation
A Process Infographic is a visual representation of a series of steps or stages in a particular process. Get inspired by this hands-on Design Process Infographic. Featuring the process from identifying to management and success. This template is perfect for sharing your story by showing the steps and creating a portfolio. In this template icons and other visual elements are included to help convey your complex information in an easy-to-understand format. Communicate your process clearly and make this your starting point just change the text, colors and fonts to fit your needs in only minutes.


21 diapositivas
Starforge Project Status Report Presentation
This Project Status Report Presentation template provides a professional and structured format to track progress, review performance metrics, and outline key achievements. Ideal for business updates, it covers agenda, financial summary, goals review, and next steps. Fully customizable and compatible with PowerPoint, Keynote, and Google Slides for effortless editing.


5 diapositivas
Benefits of Recycling Infographics
Recycling offers numerous benefits for the environment, society, and the economy. These vertical infographics highlights the numerous advantages of recycling for both the environment and society. This infographic serves as an educational tool to raise awareness about the positive impact of recycling on our planet and encourages individuals and businesses to participate in recycling efforts. The infographics are divided into clear and distinct sections, each focusing on a specific benefit of recycling. These sections are designed with vibrant colors and appealing visuals to capture the audience's attention.


7 diapositivas
Office Scenes Interview Infographic
Office Scenes refer to various activities, situations, or interactions that occur within a typical office environment. Embark on a visual journey through the dynamic world of interviews and office scenes with our office scenes interview infographic template. This visually appealing and informative template is tailored to give insights into the art of interviews, providing valuable tips and tricks for success within the corporate sphere. Compatible with Powerpoint, Keynote, and Google Slides. This template presents an enticing introduction to the world of interviews, setting the stage for a journey towards success and career growth.
4 diapositivas
Team Performance and Progress Tracker Presentation
Track momentum, highlight achievements, and visualize team success with this clean performance tracker layout. Featuring gauge meters and progress bars, this slide makes it easy to present productivity metrics, goal progress, or task completion at a glance. Fully editable and compatible with PowerPoint, Keynote, and Google Slides.


20 diapositivas
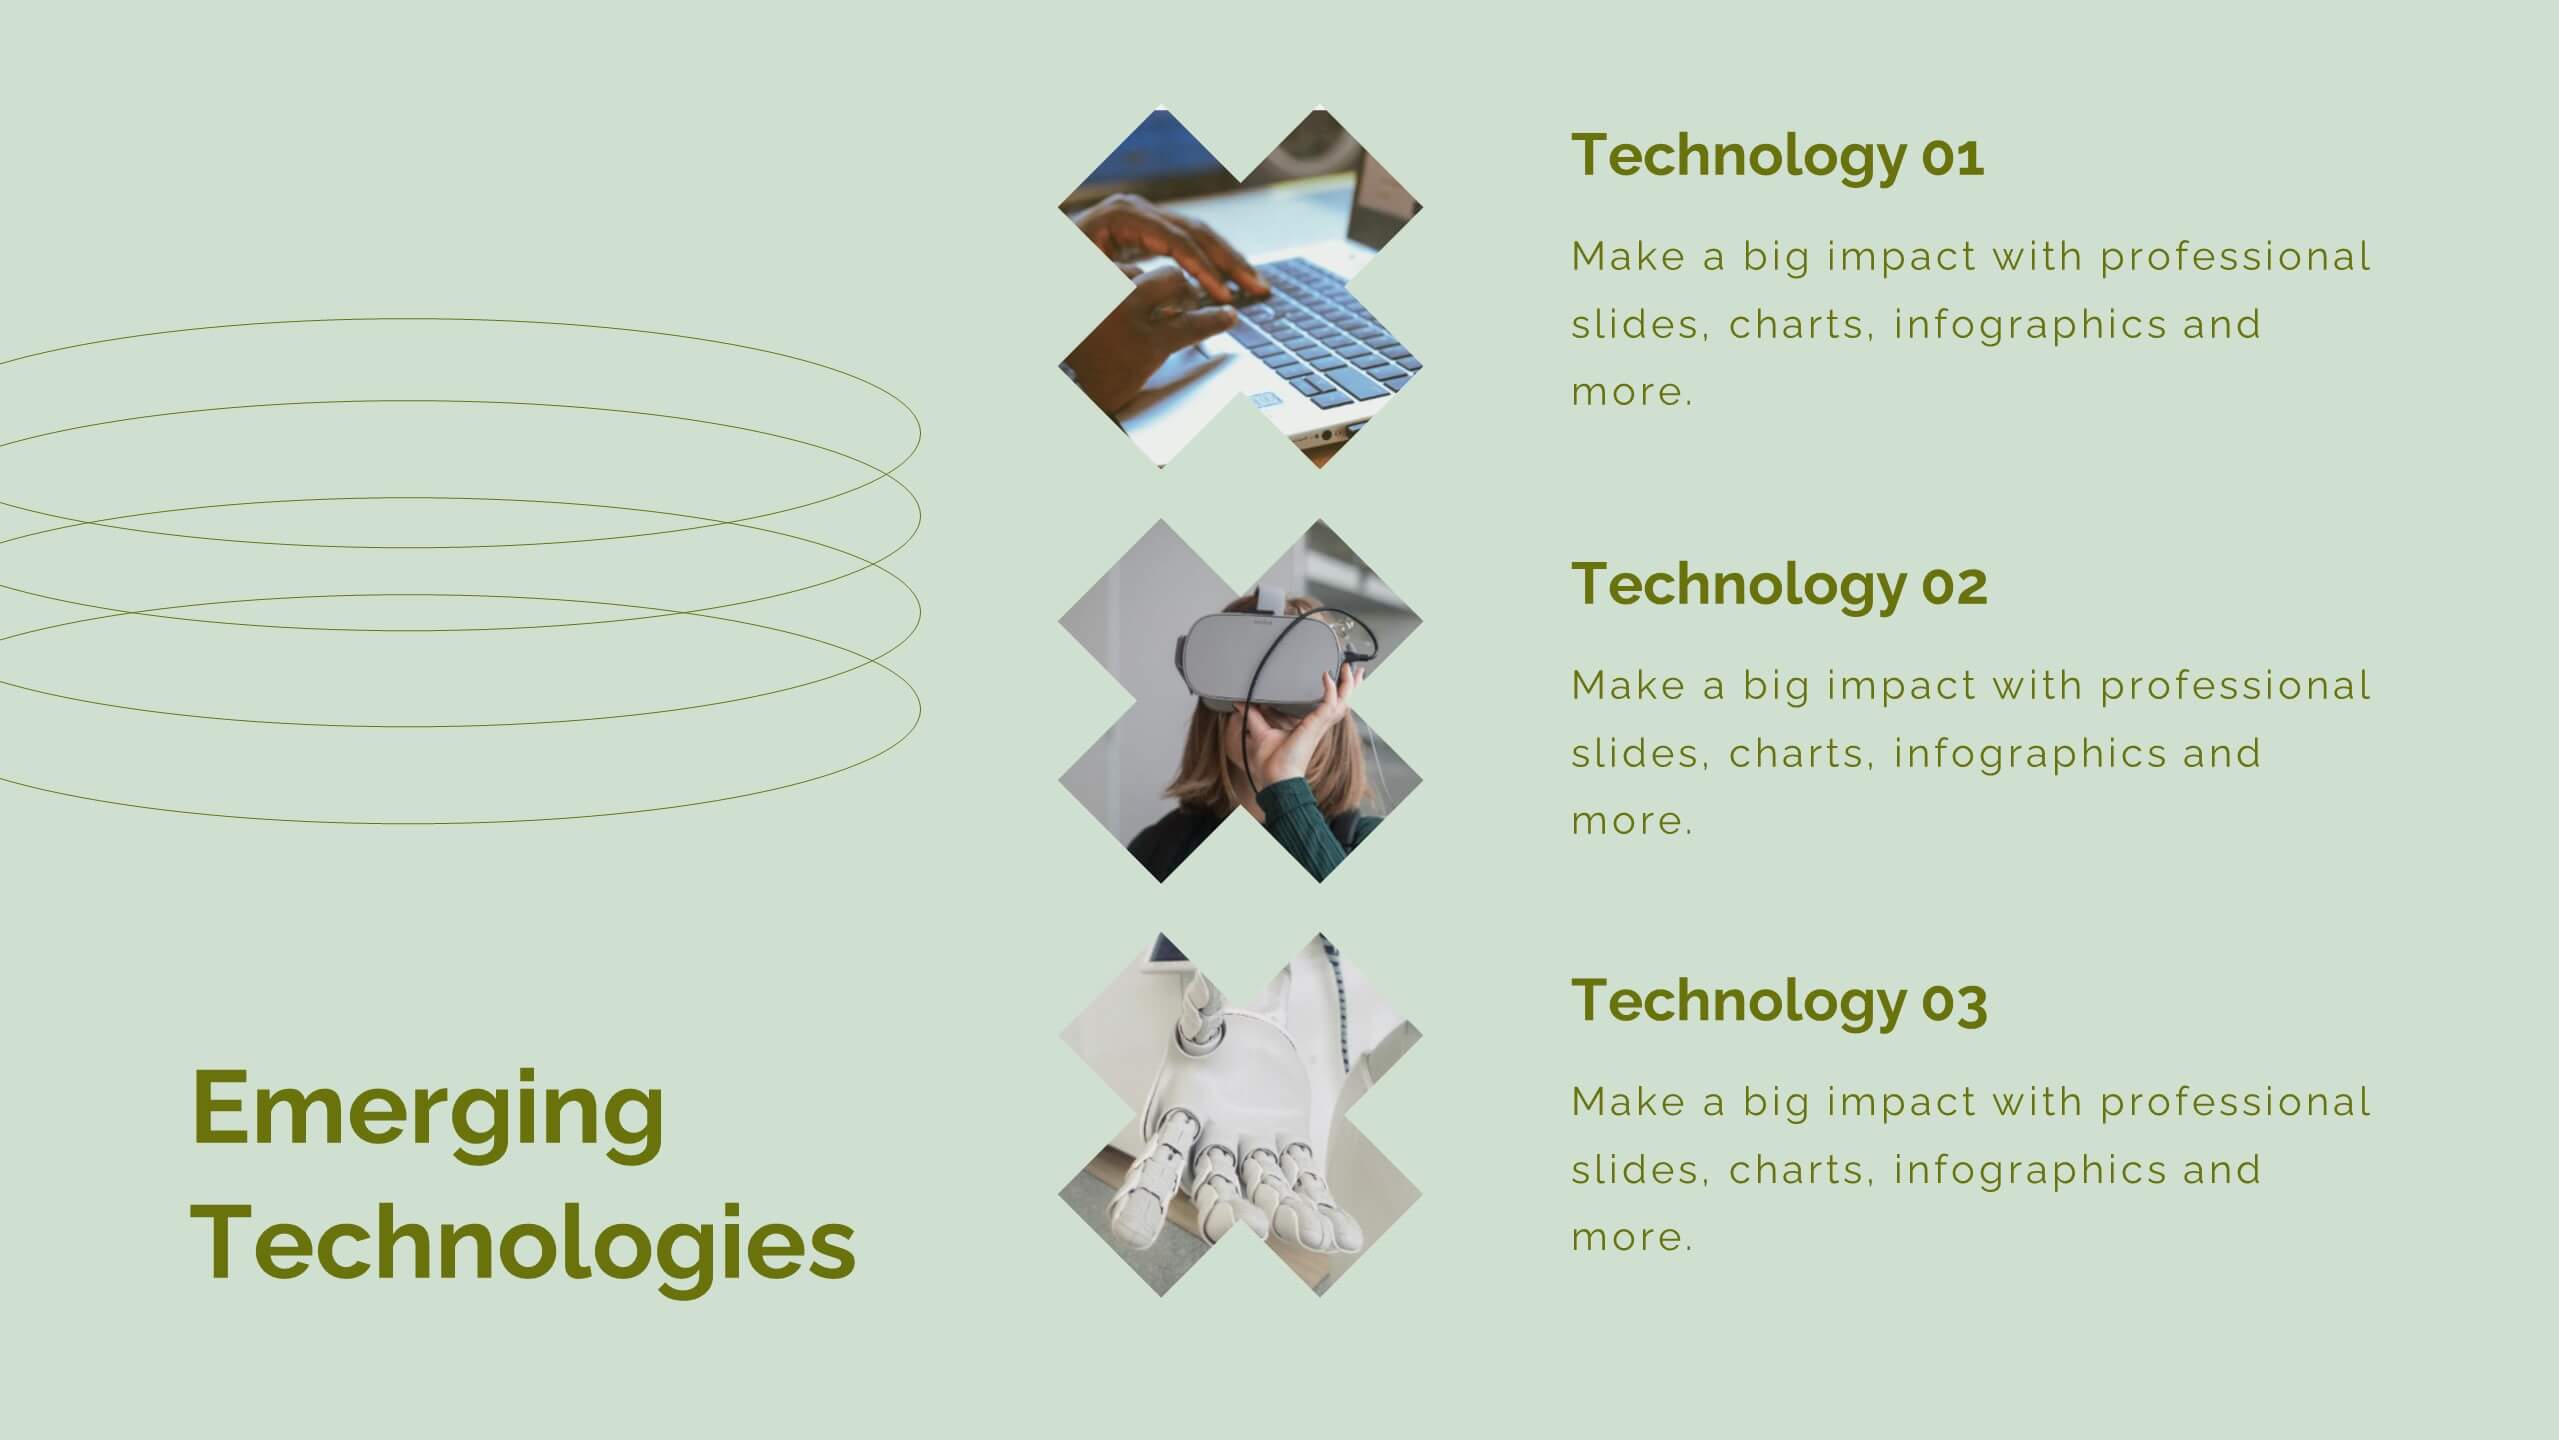
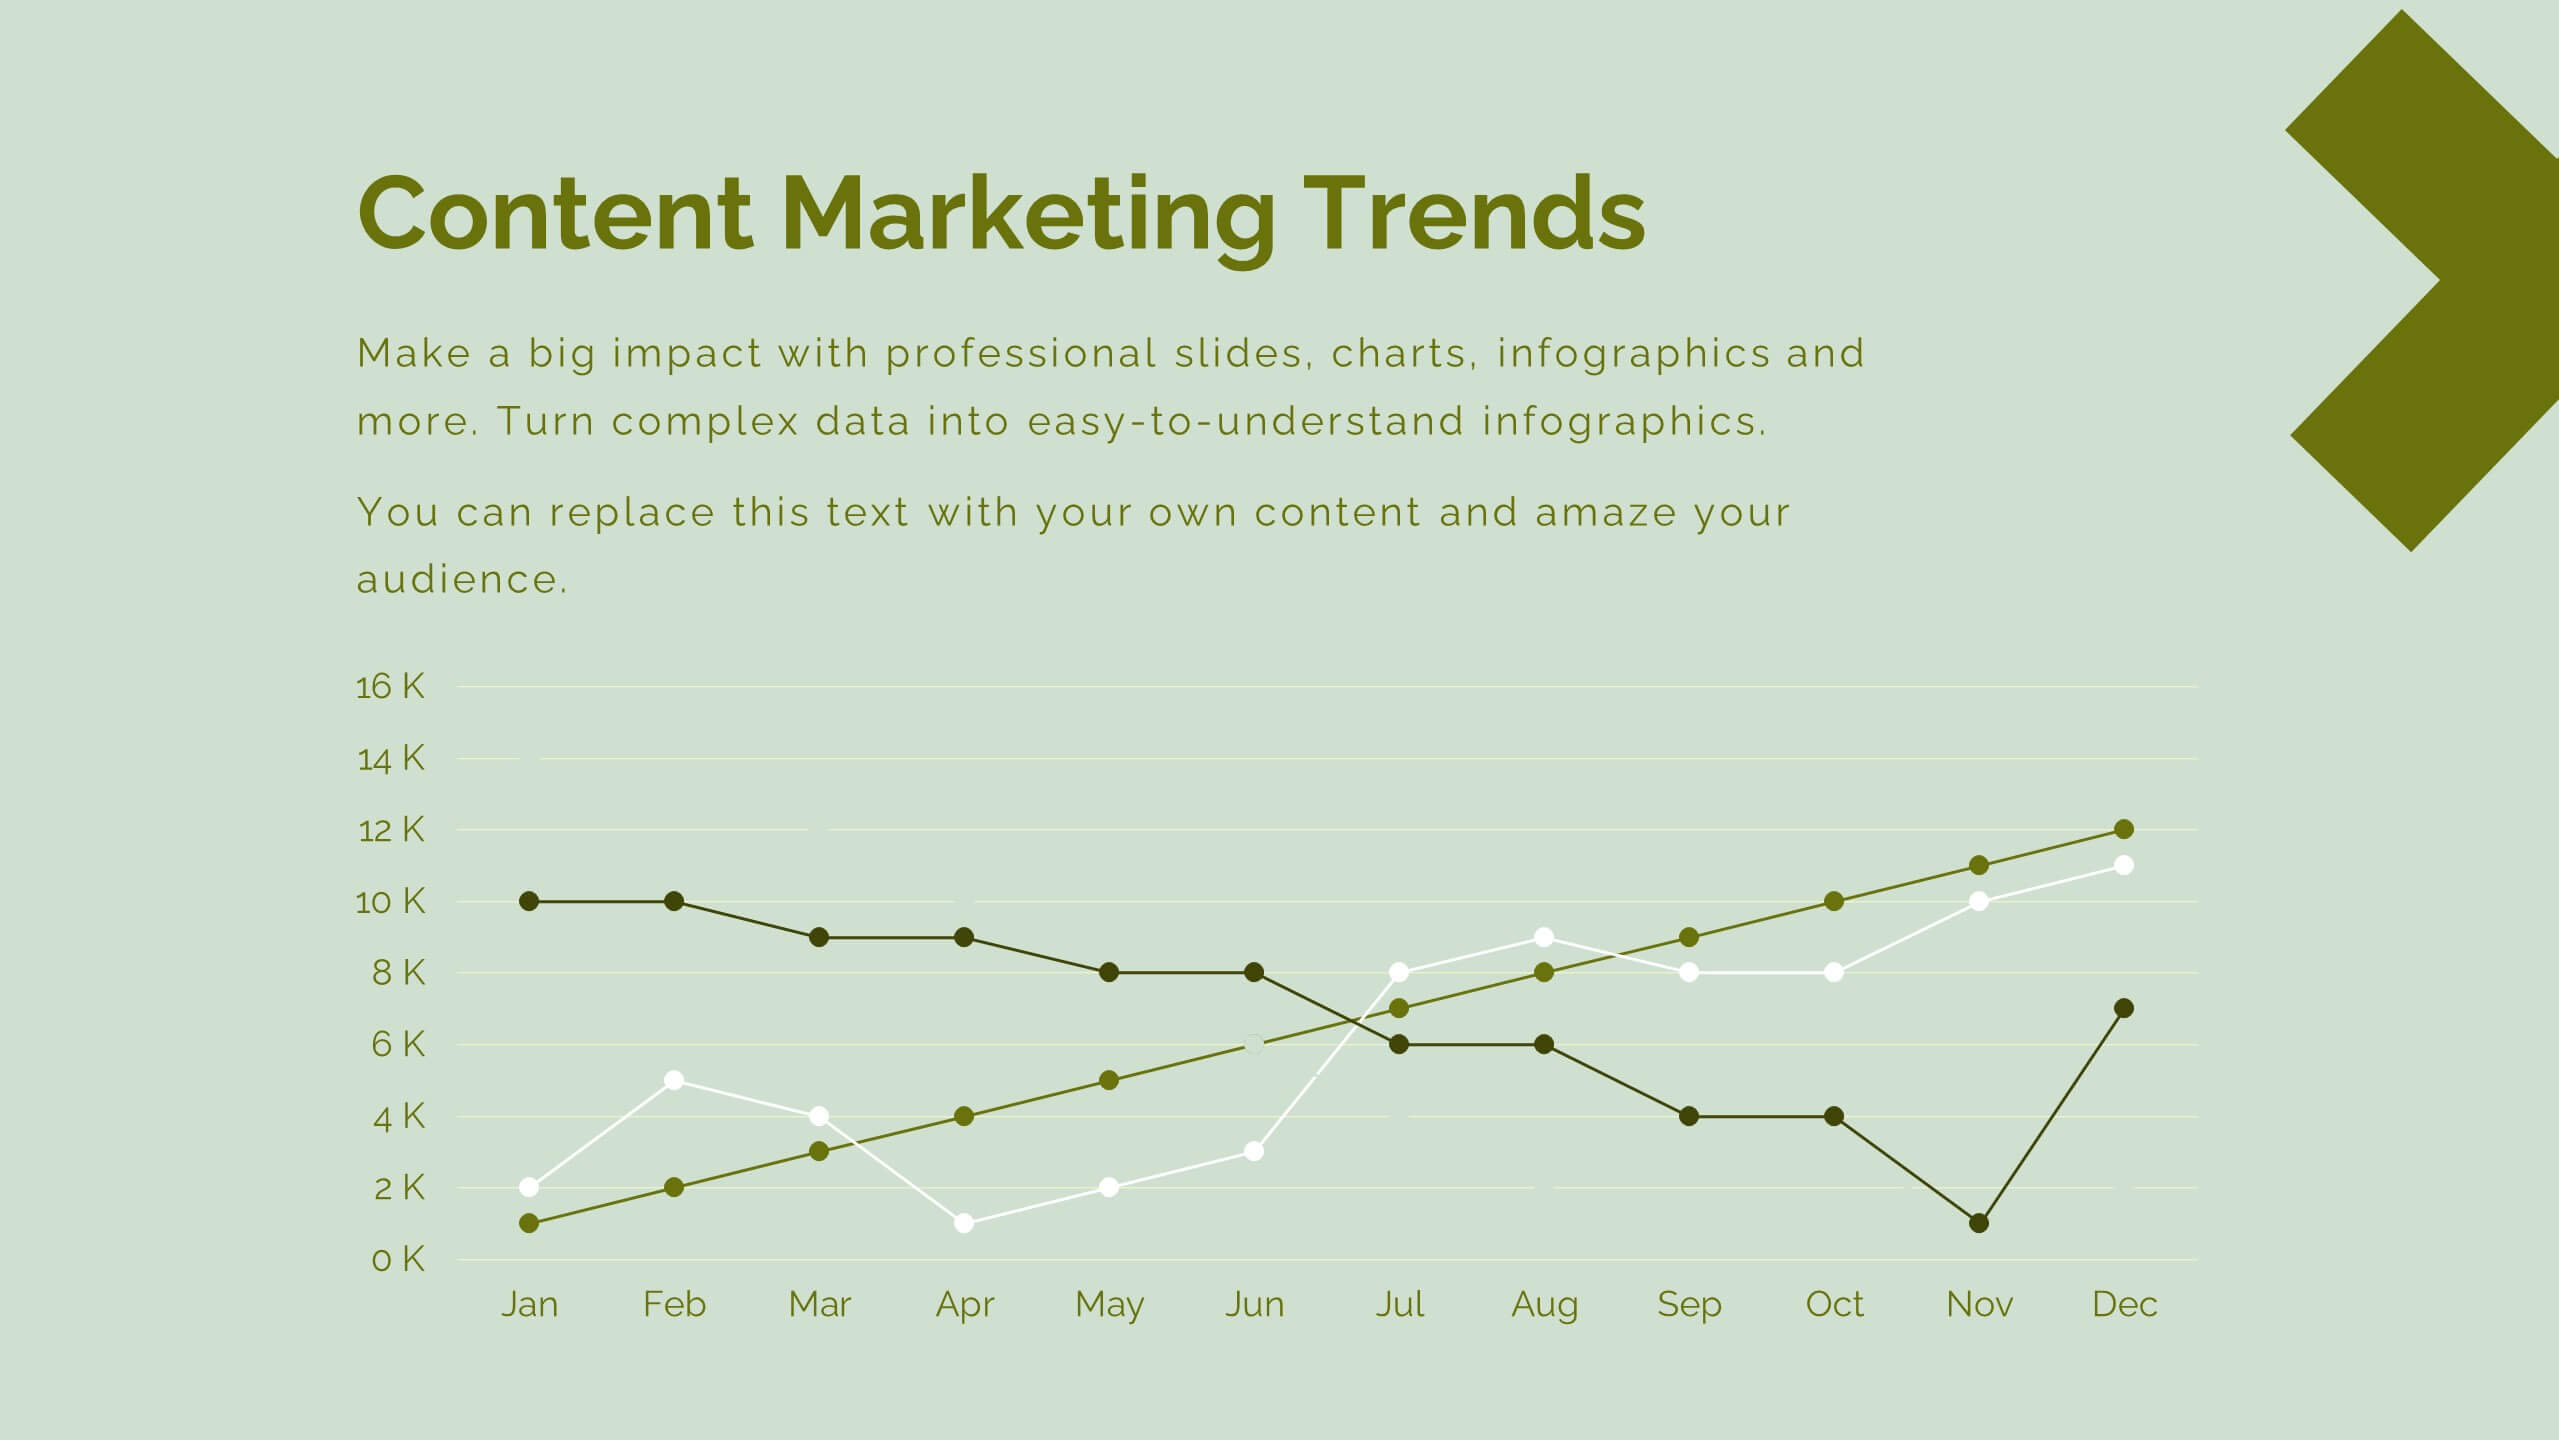
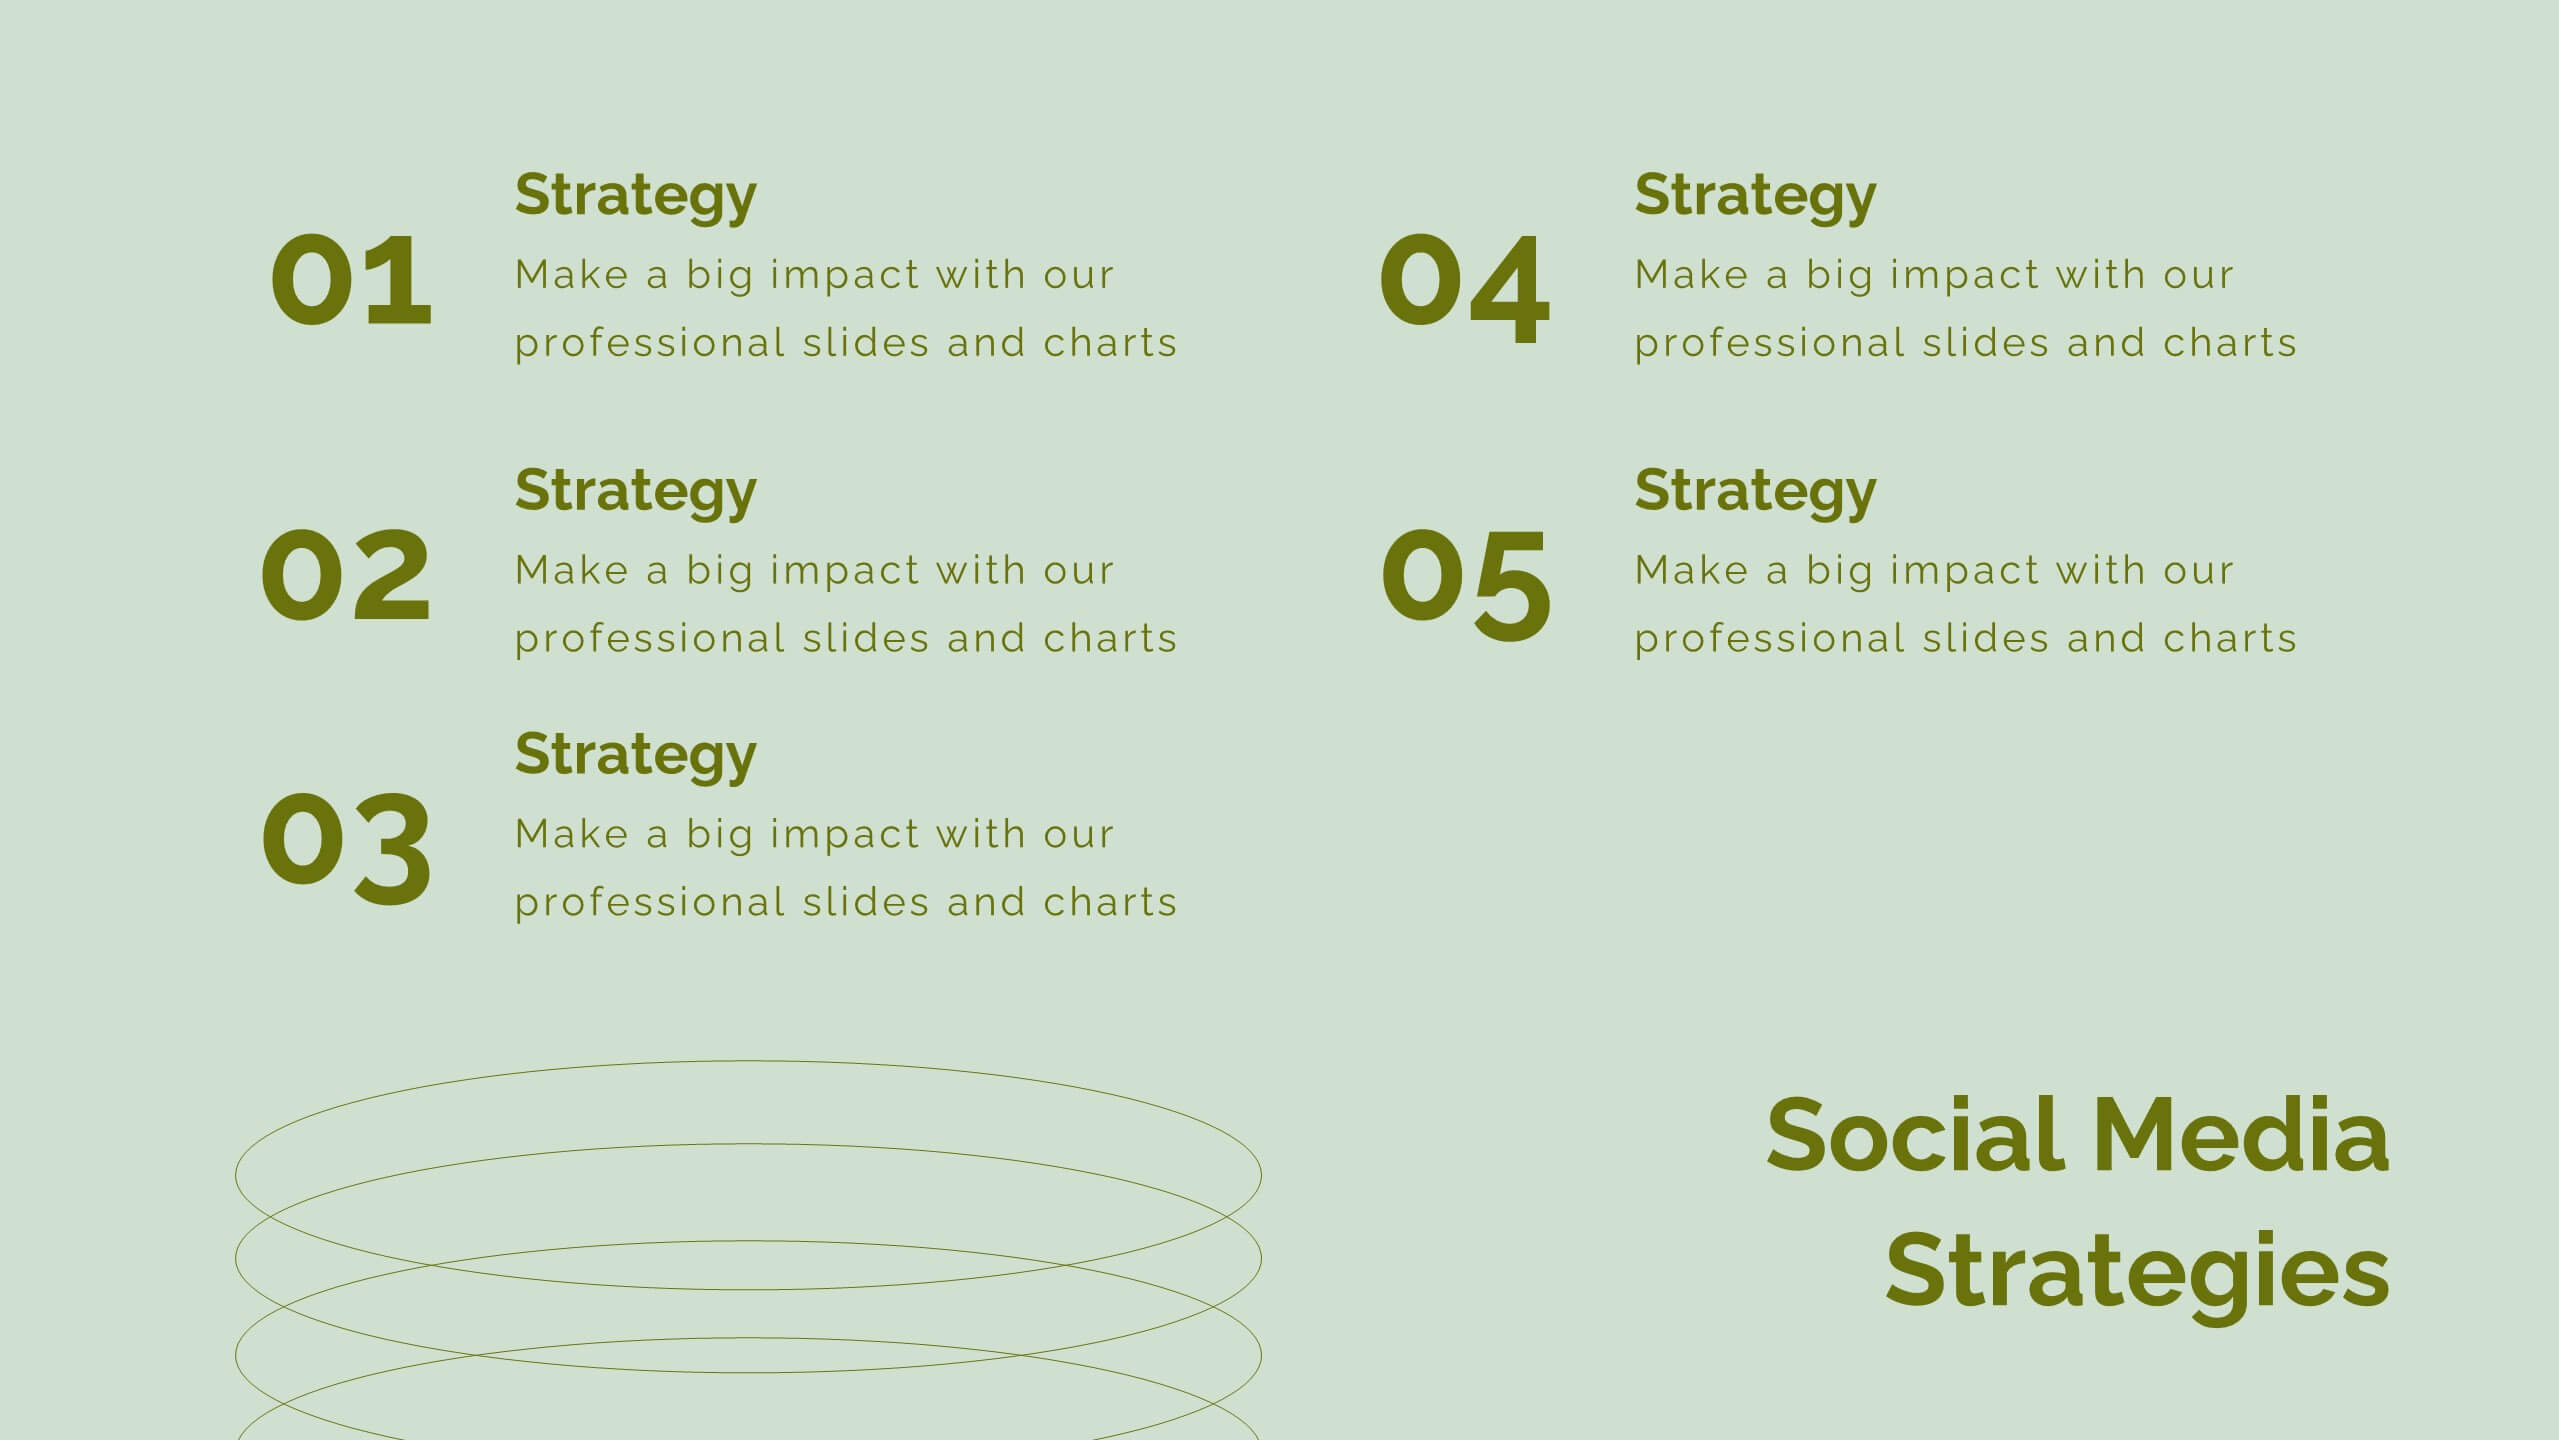
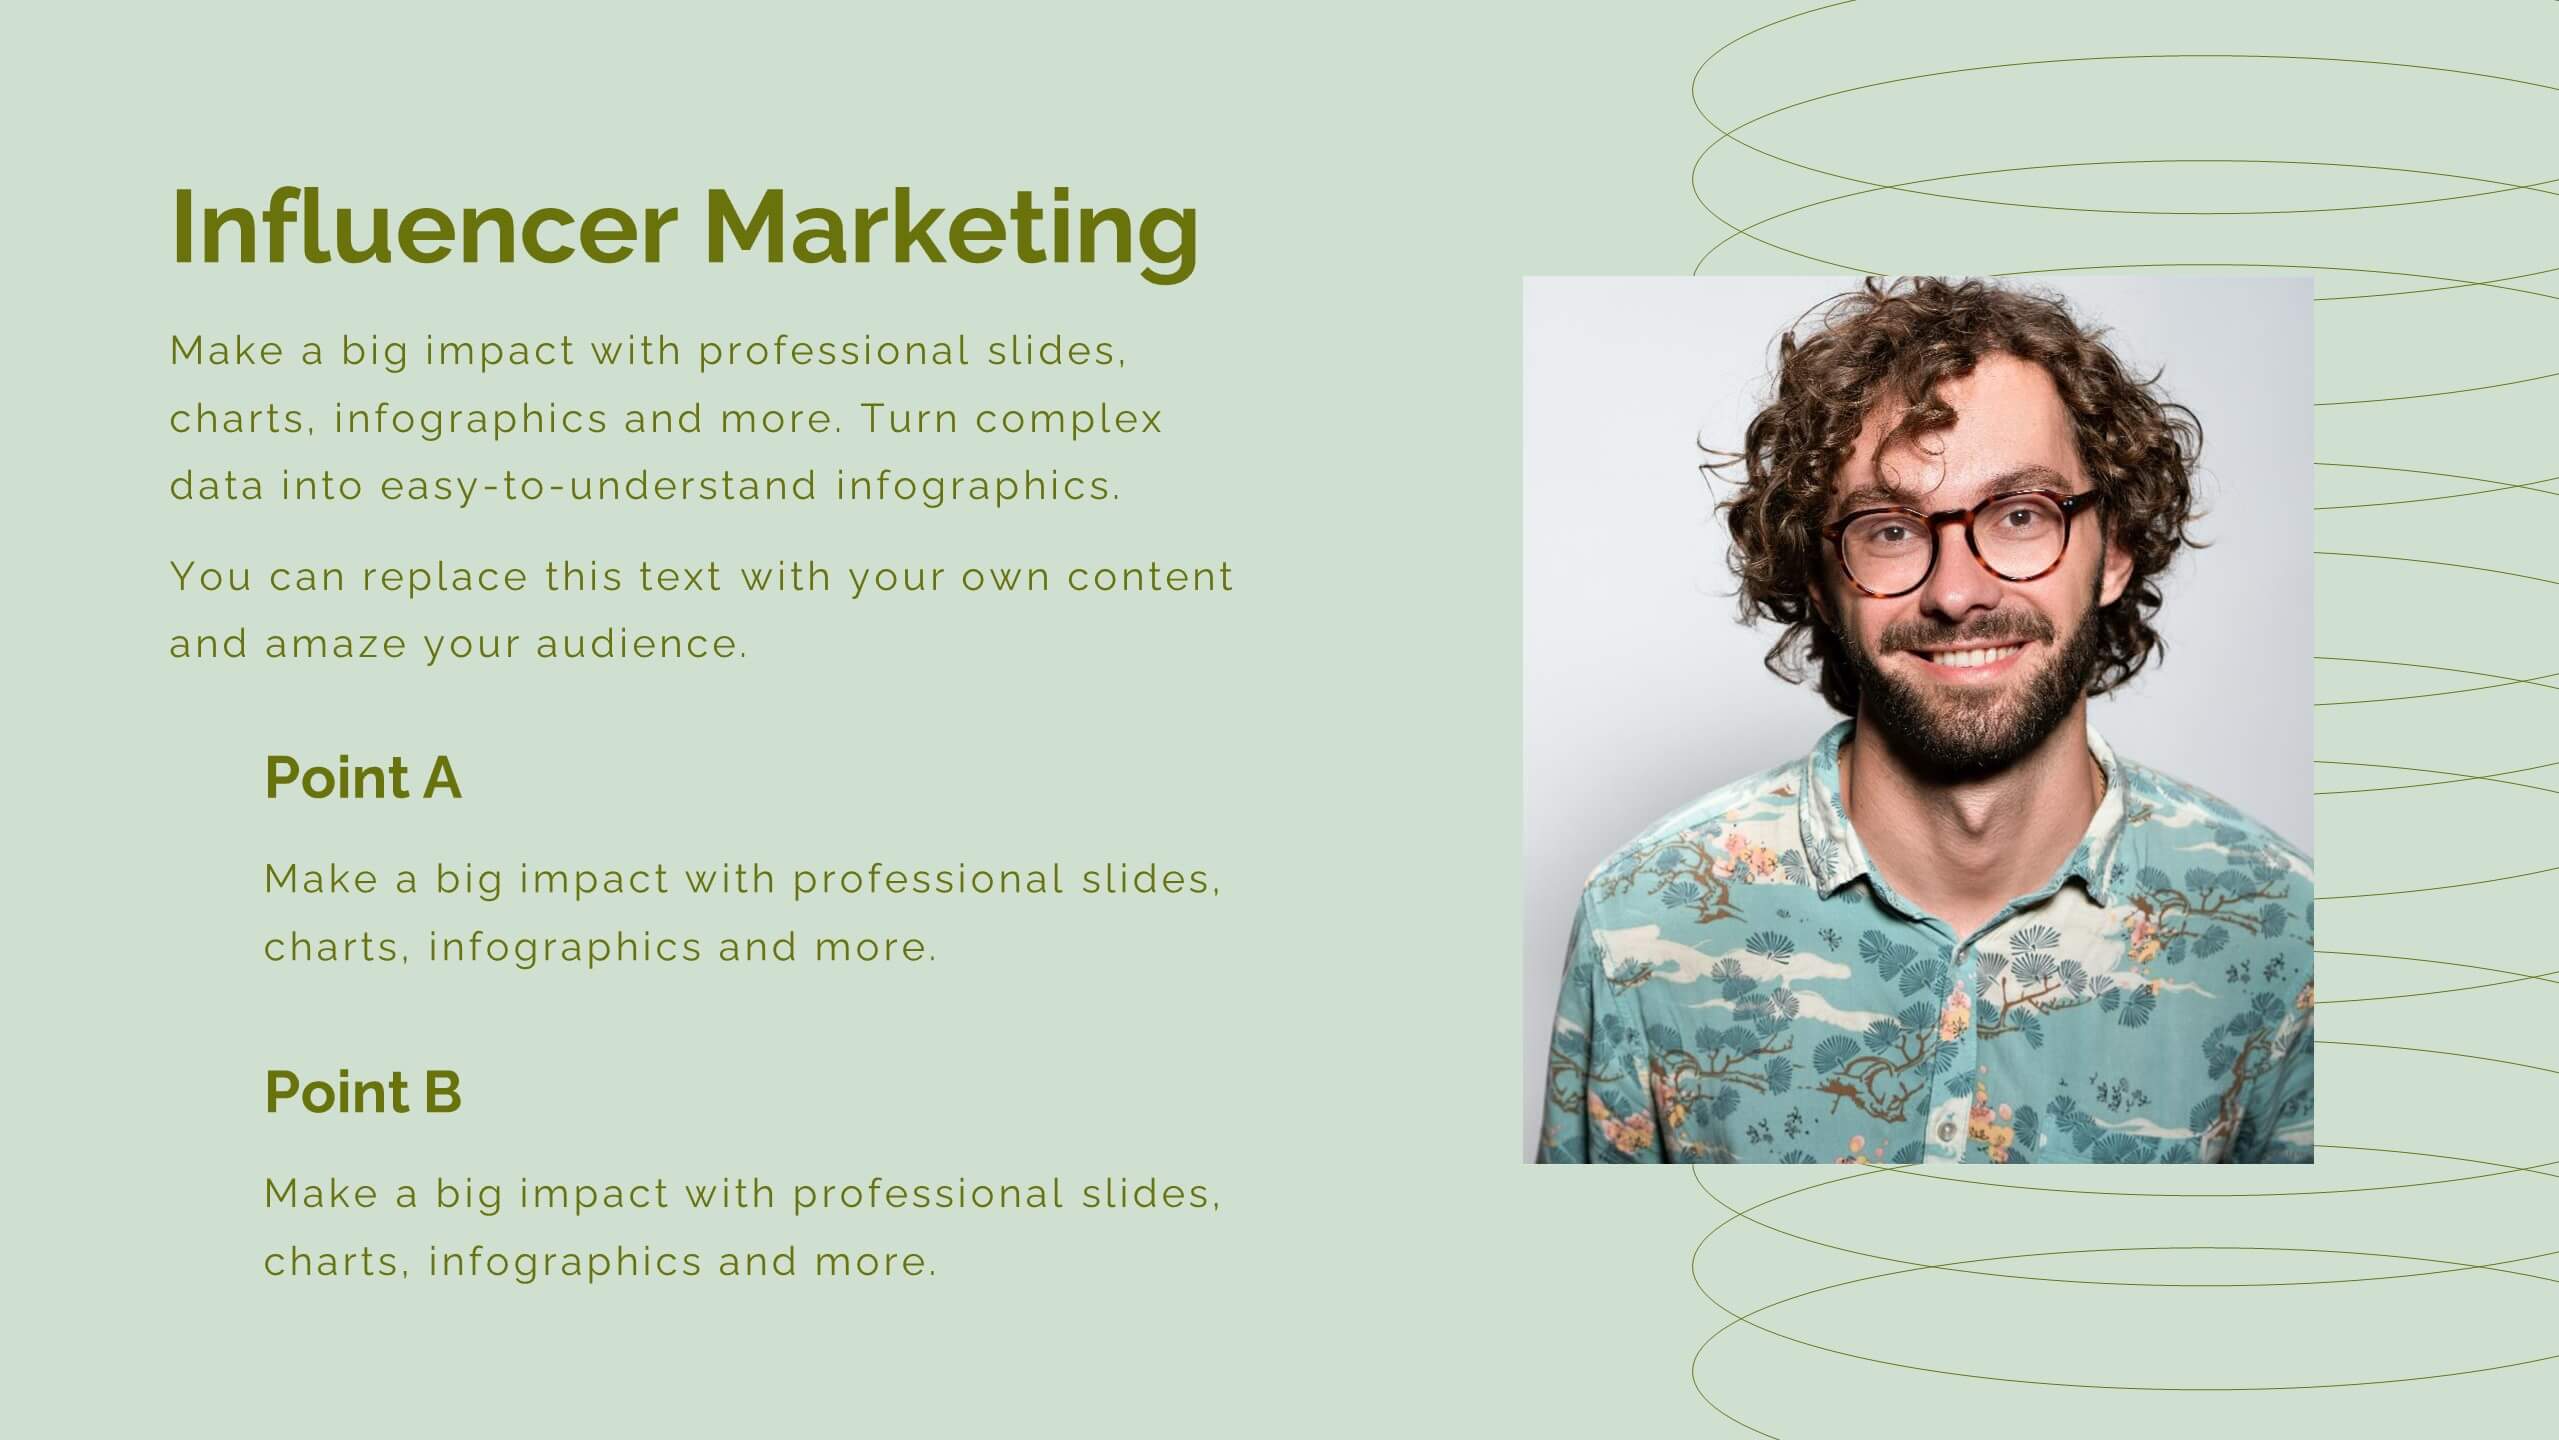
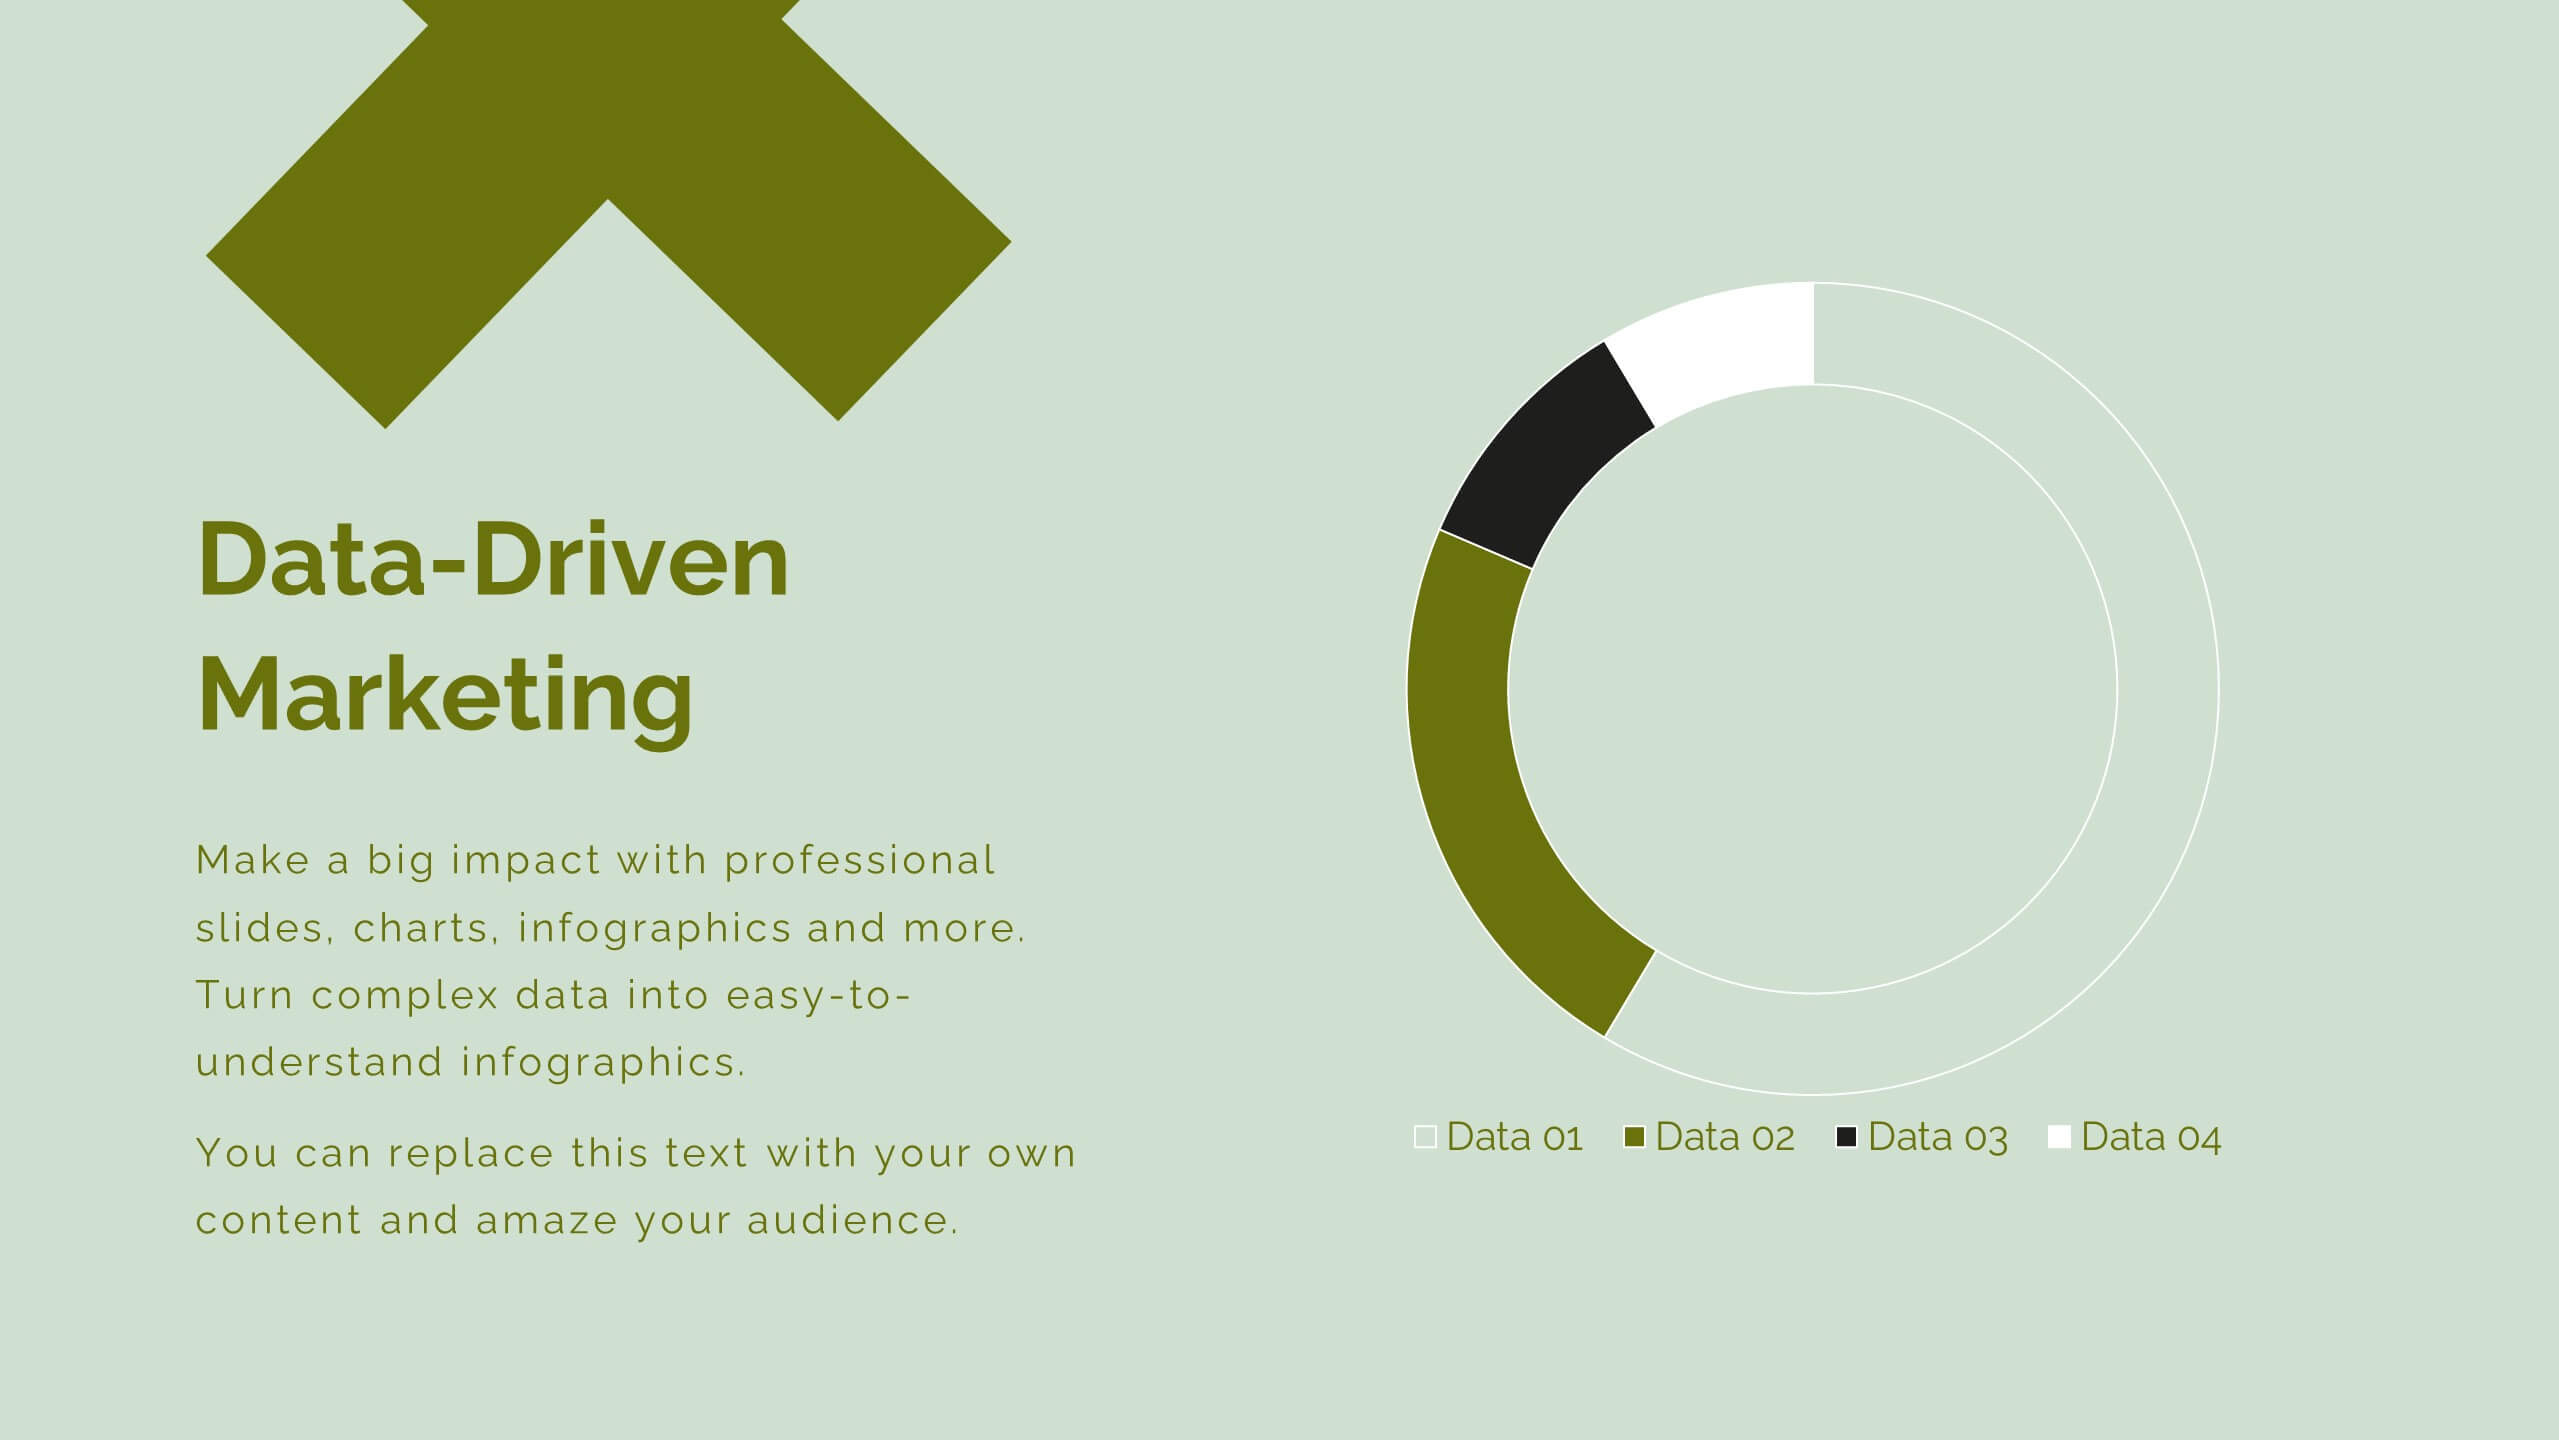
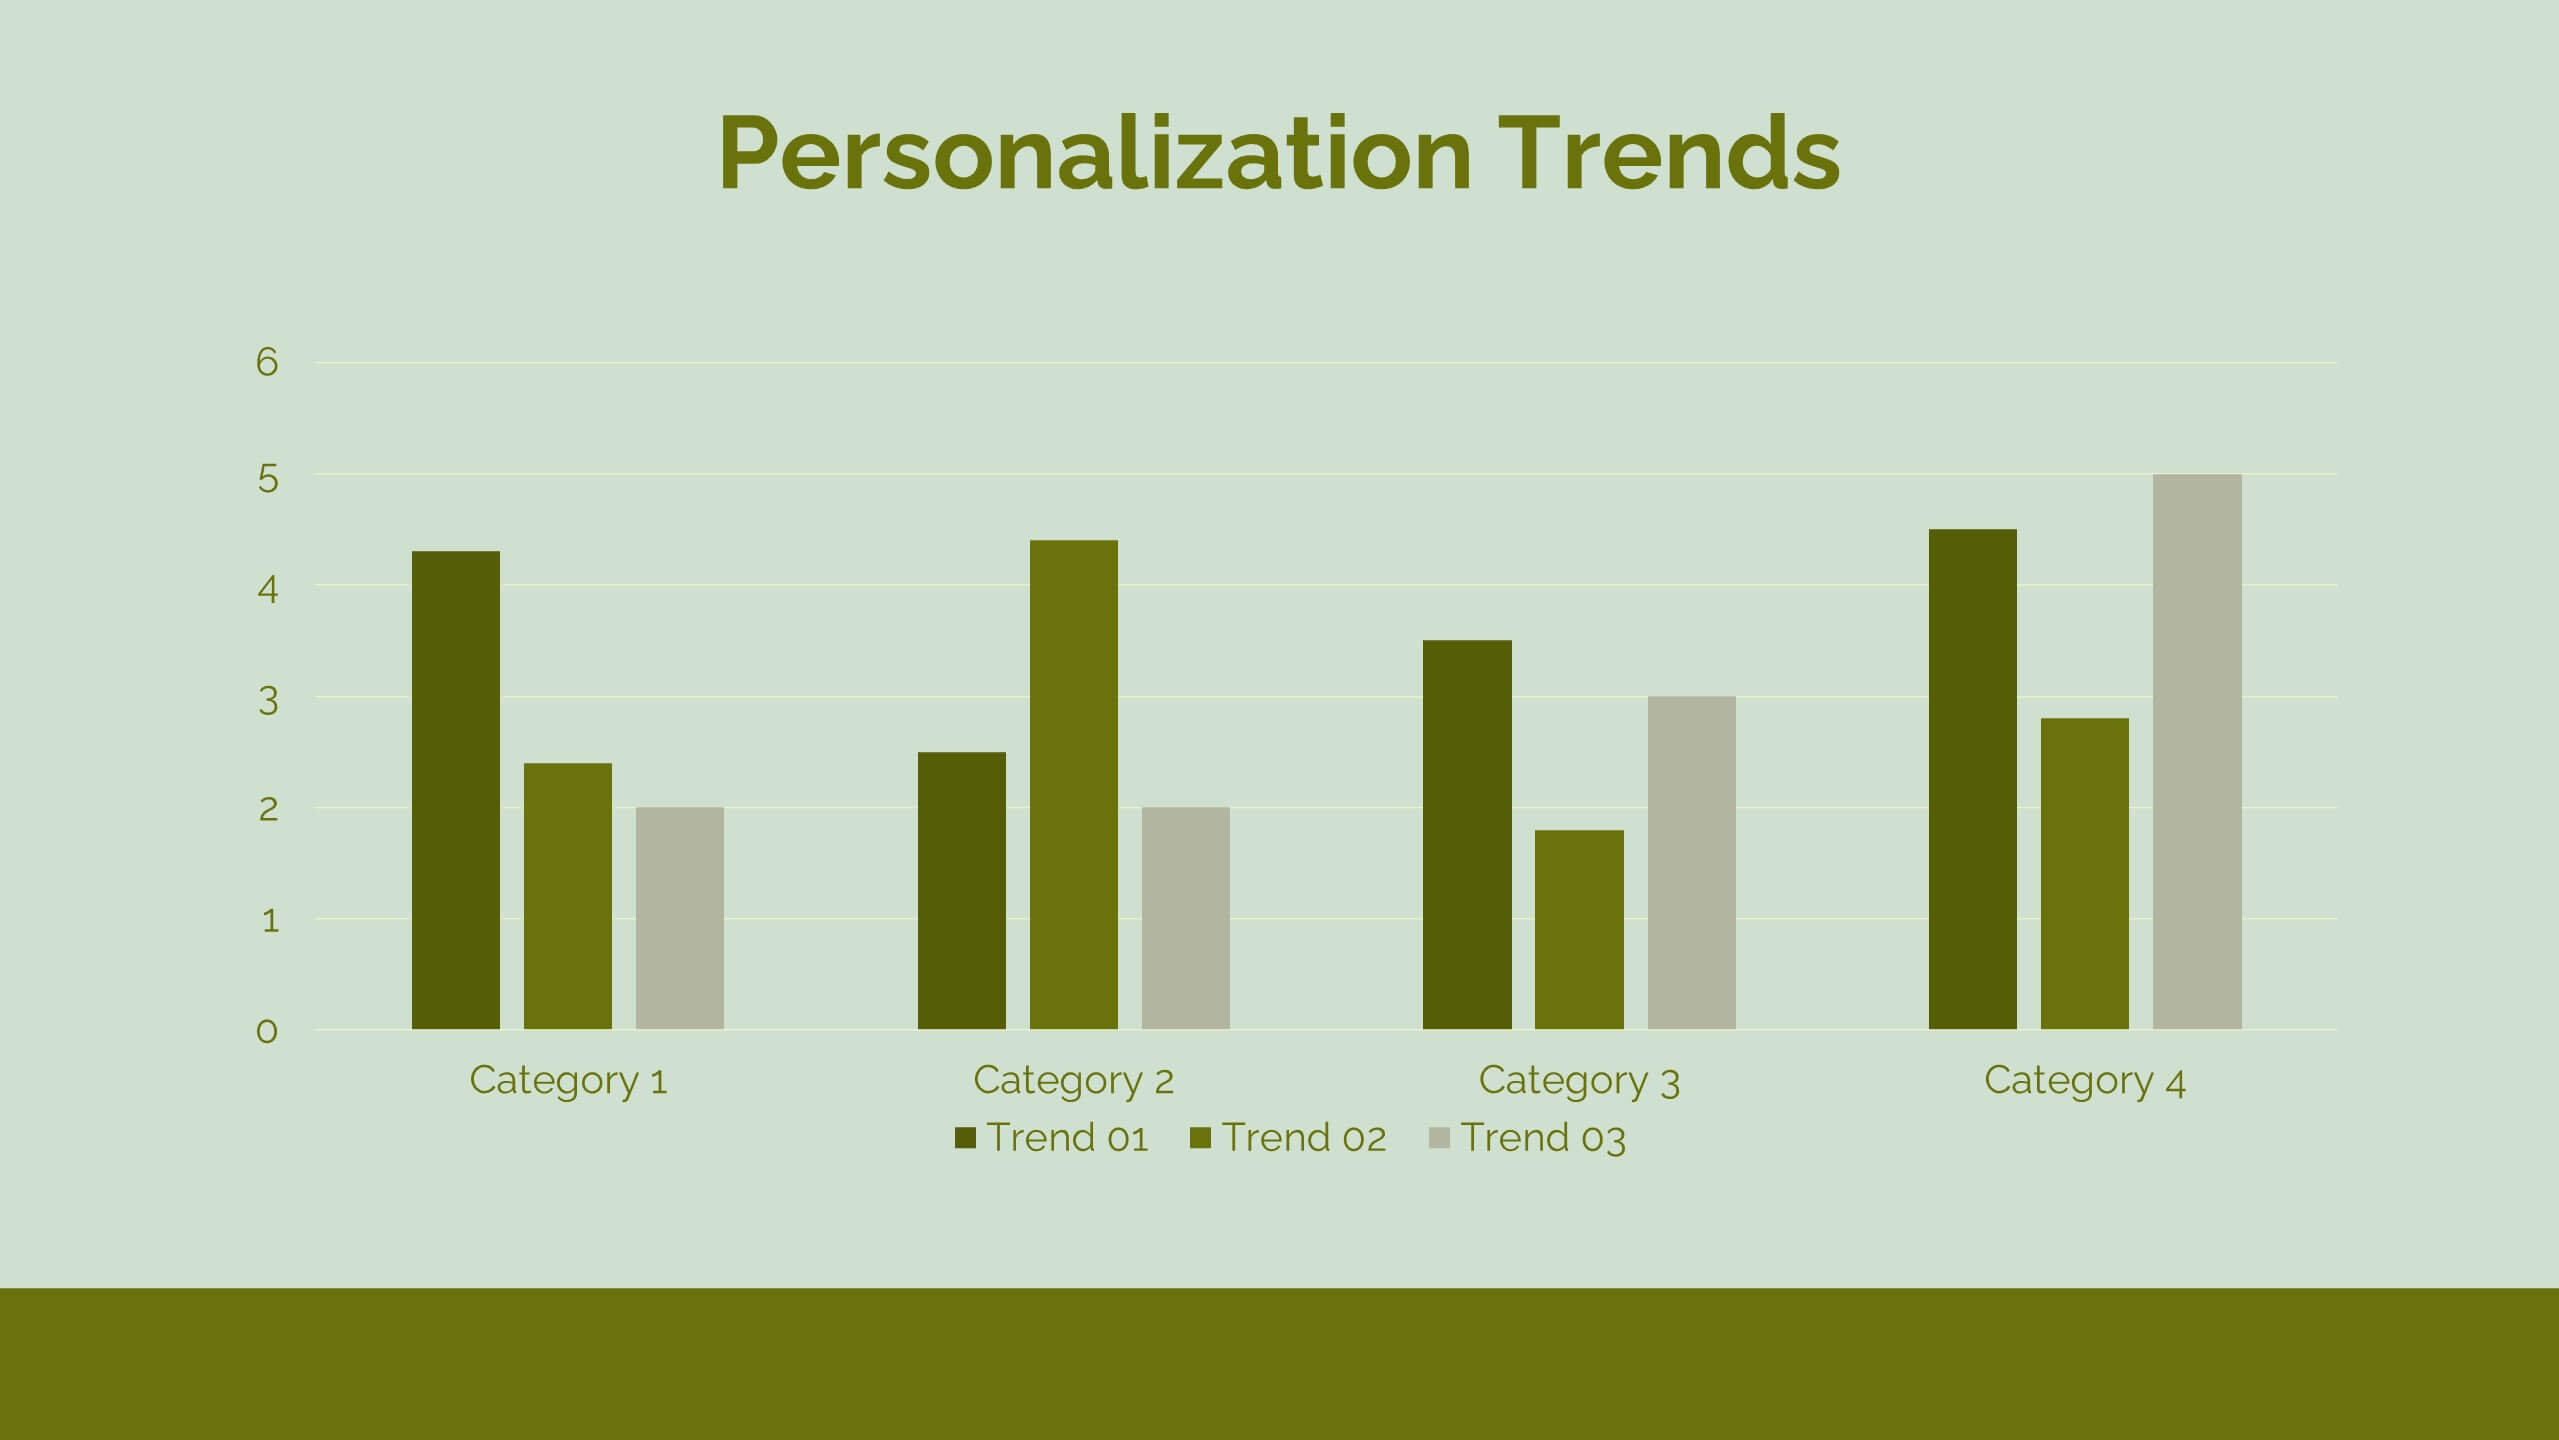
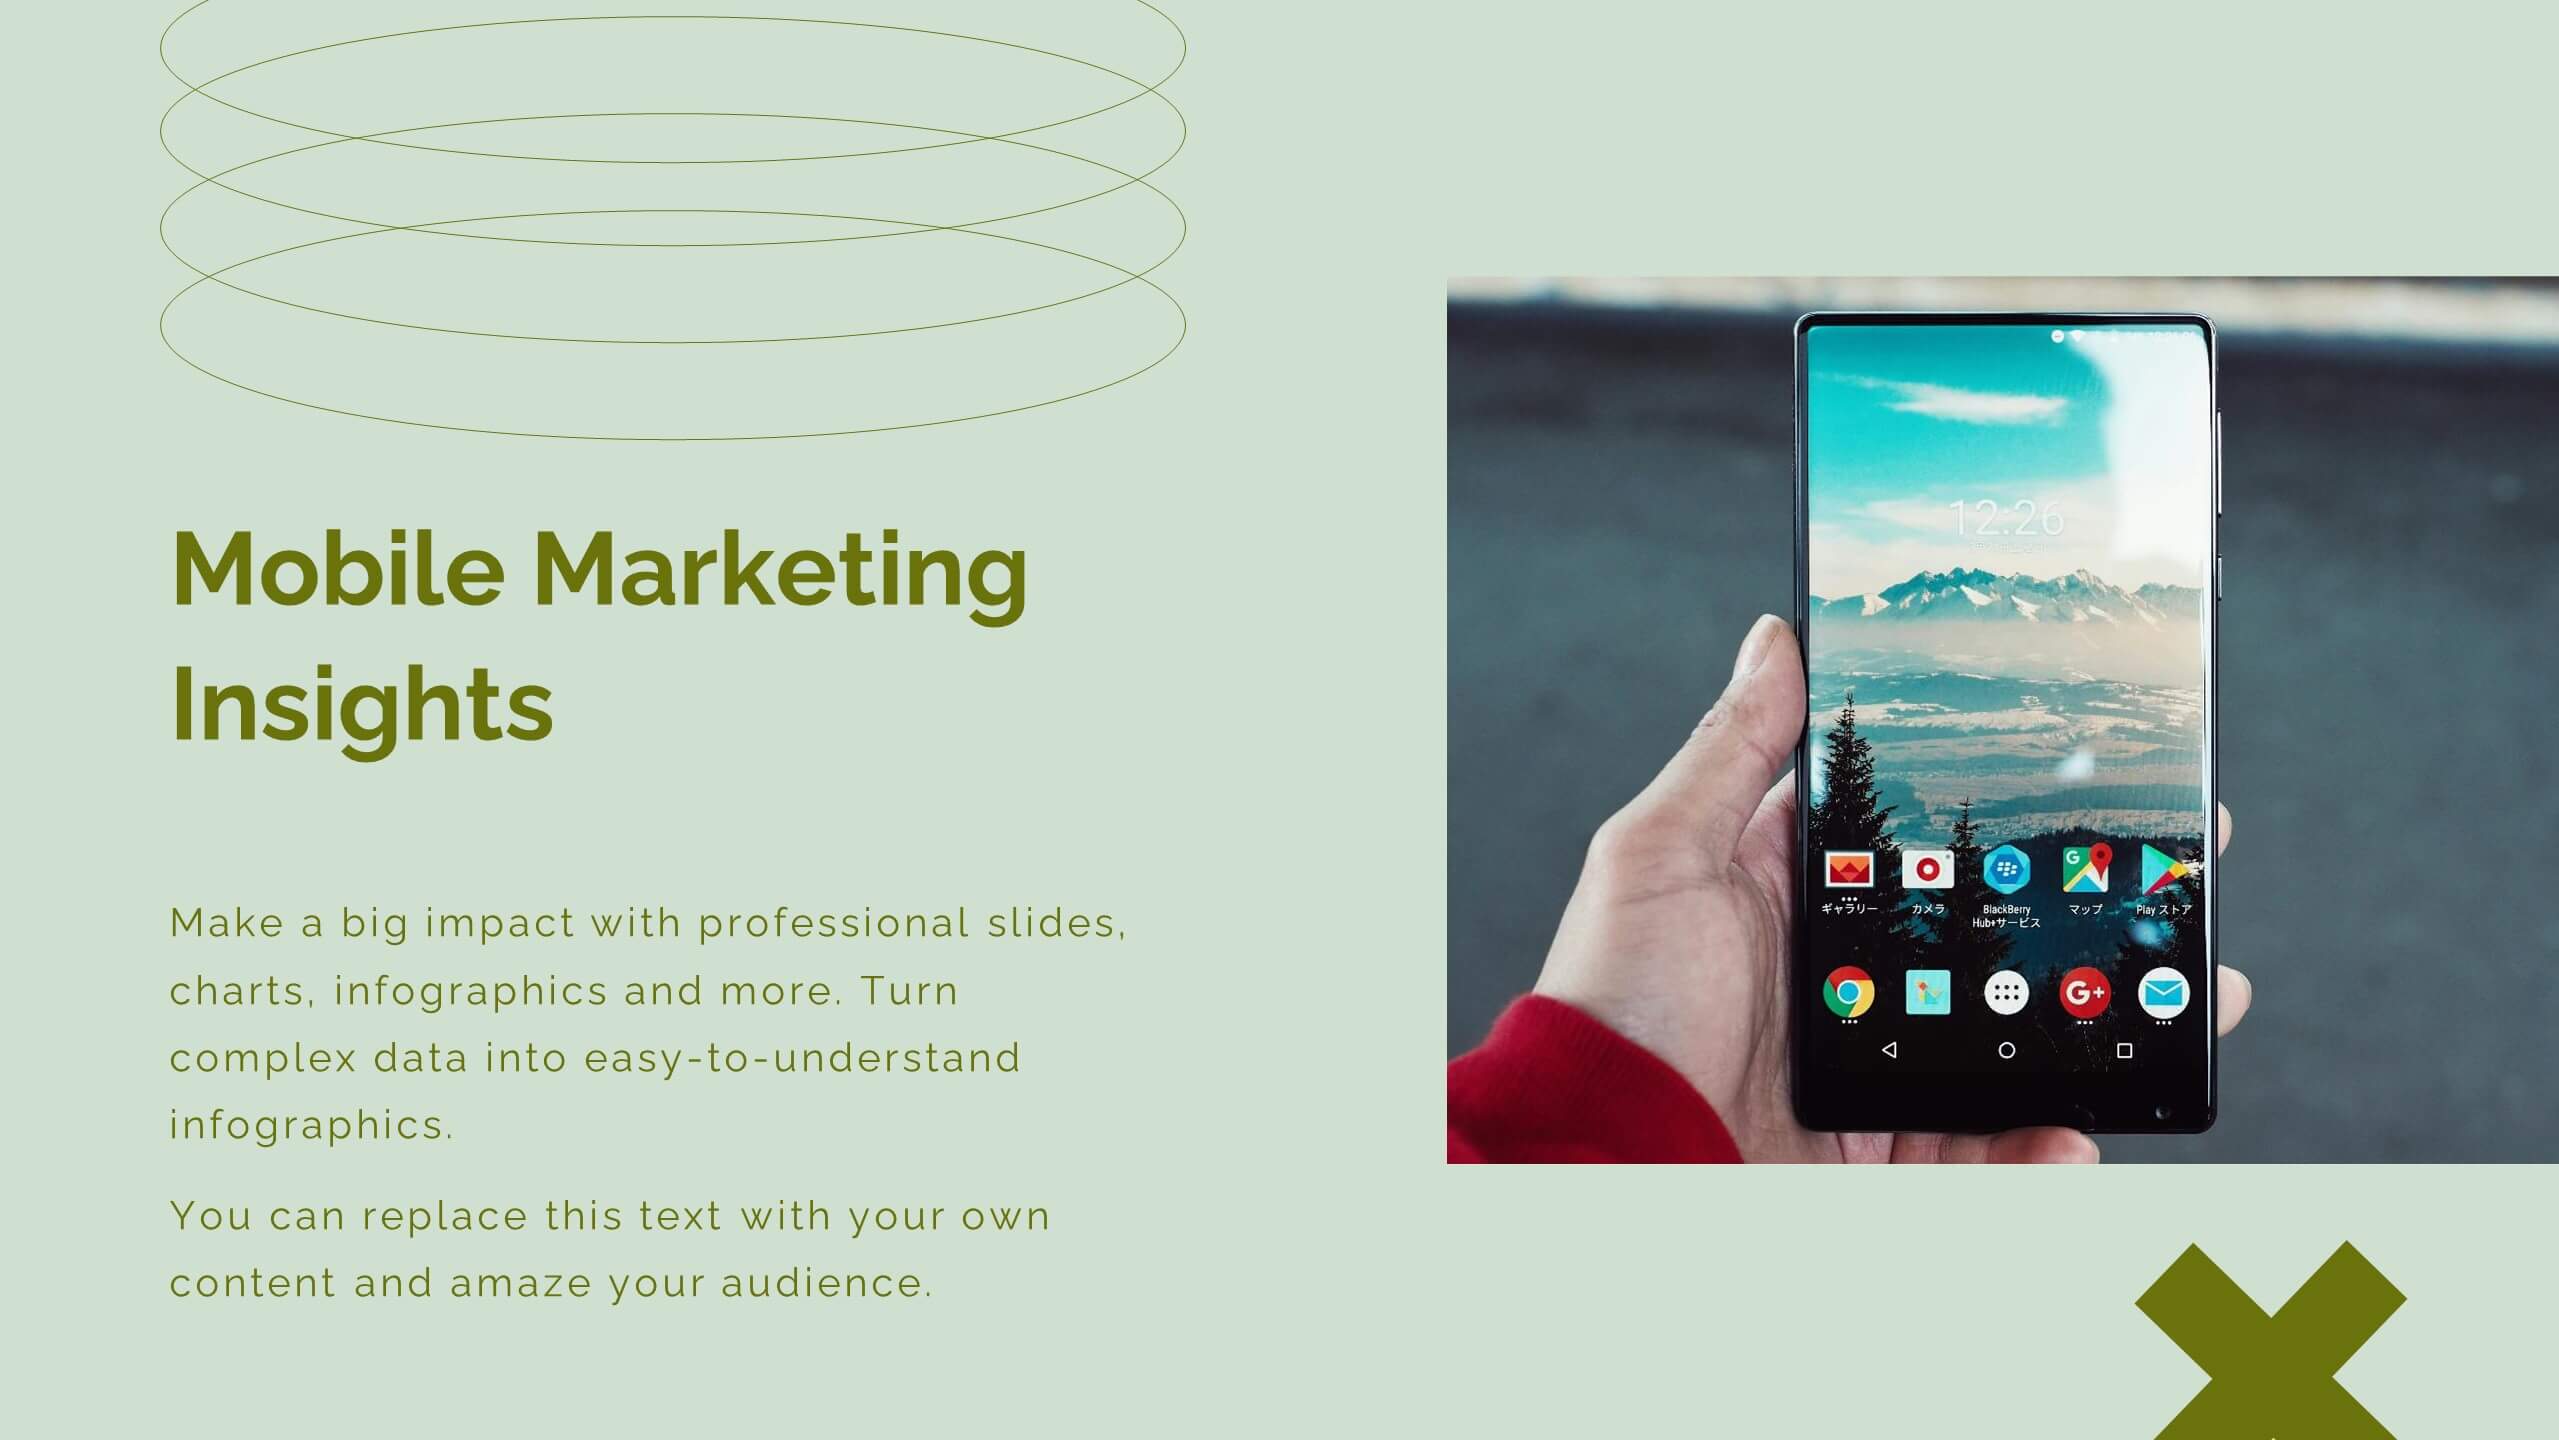
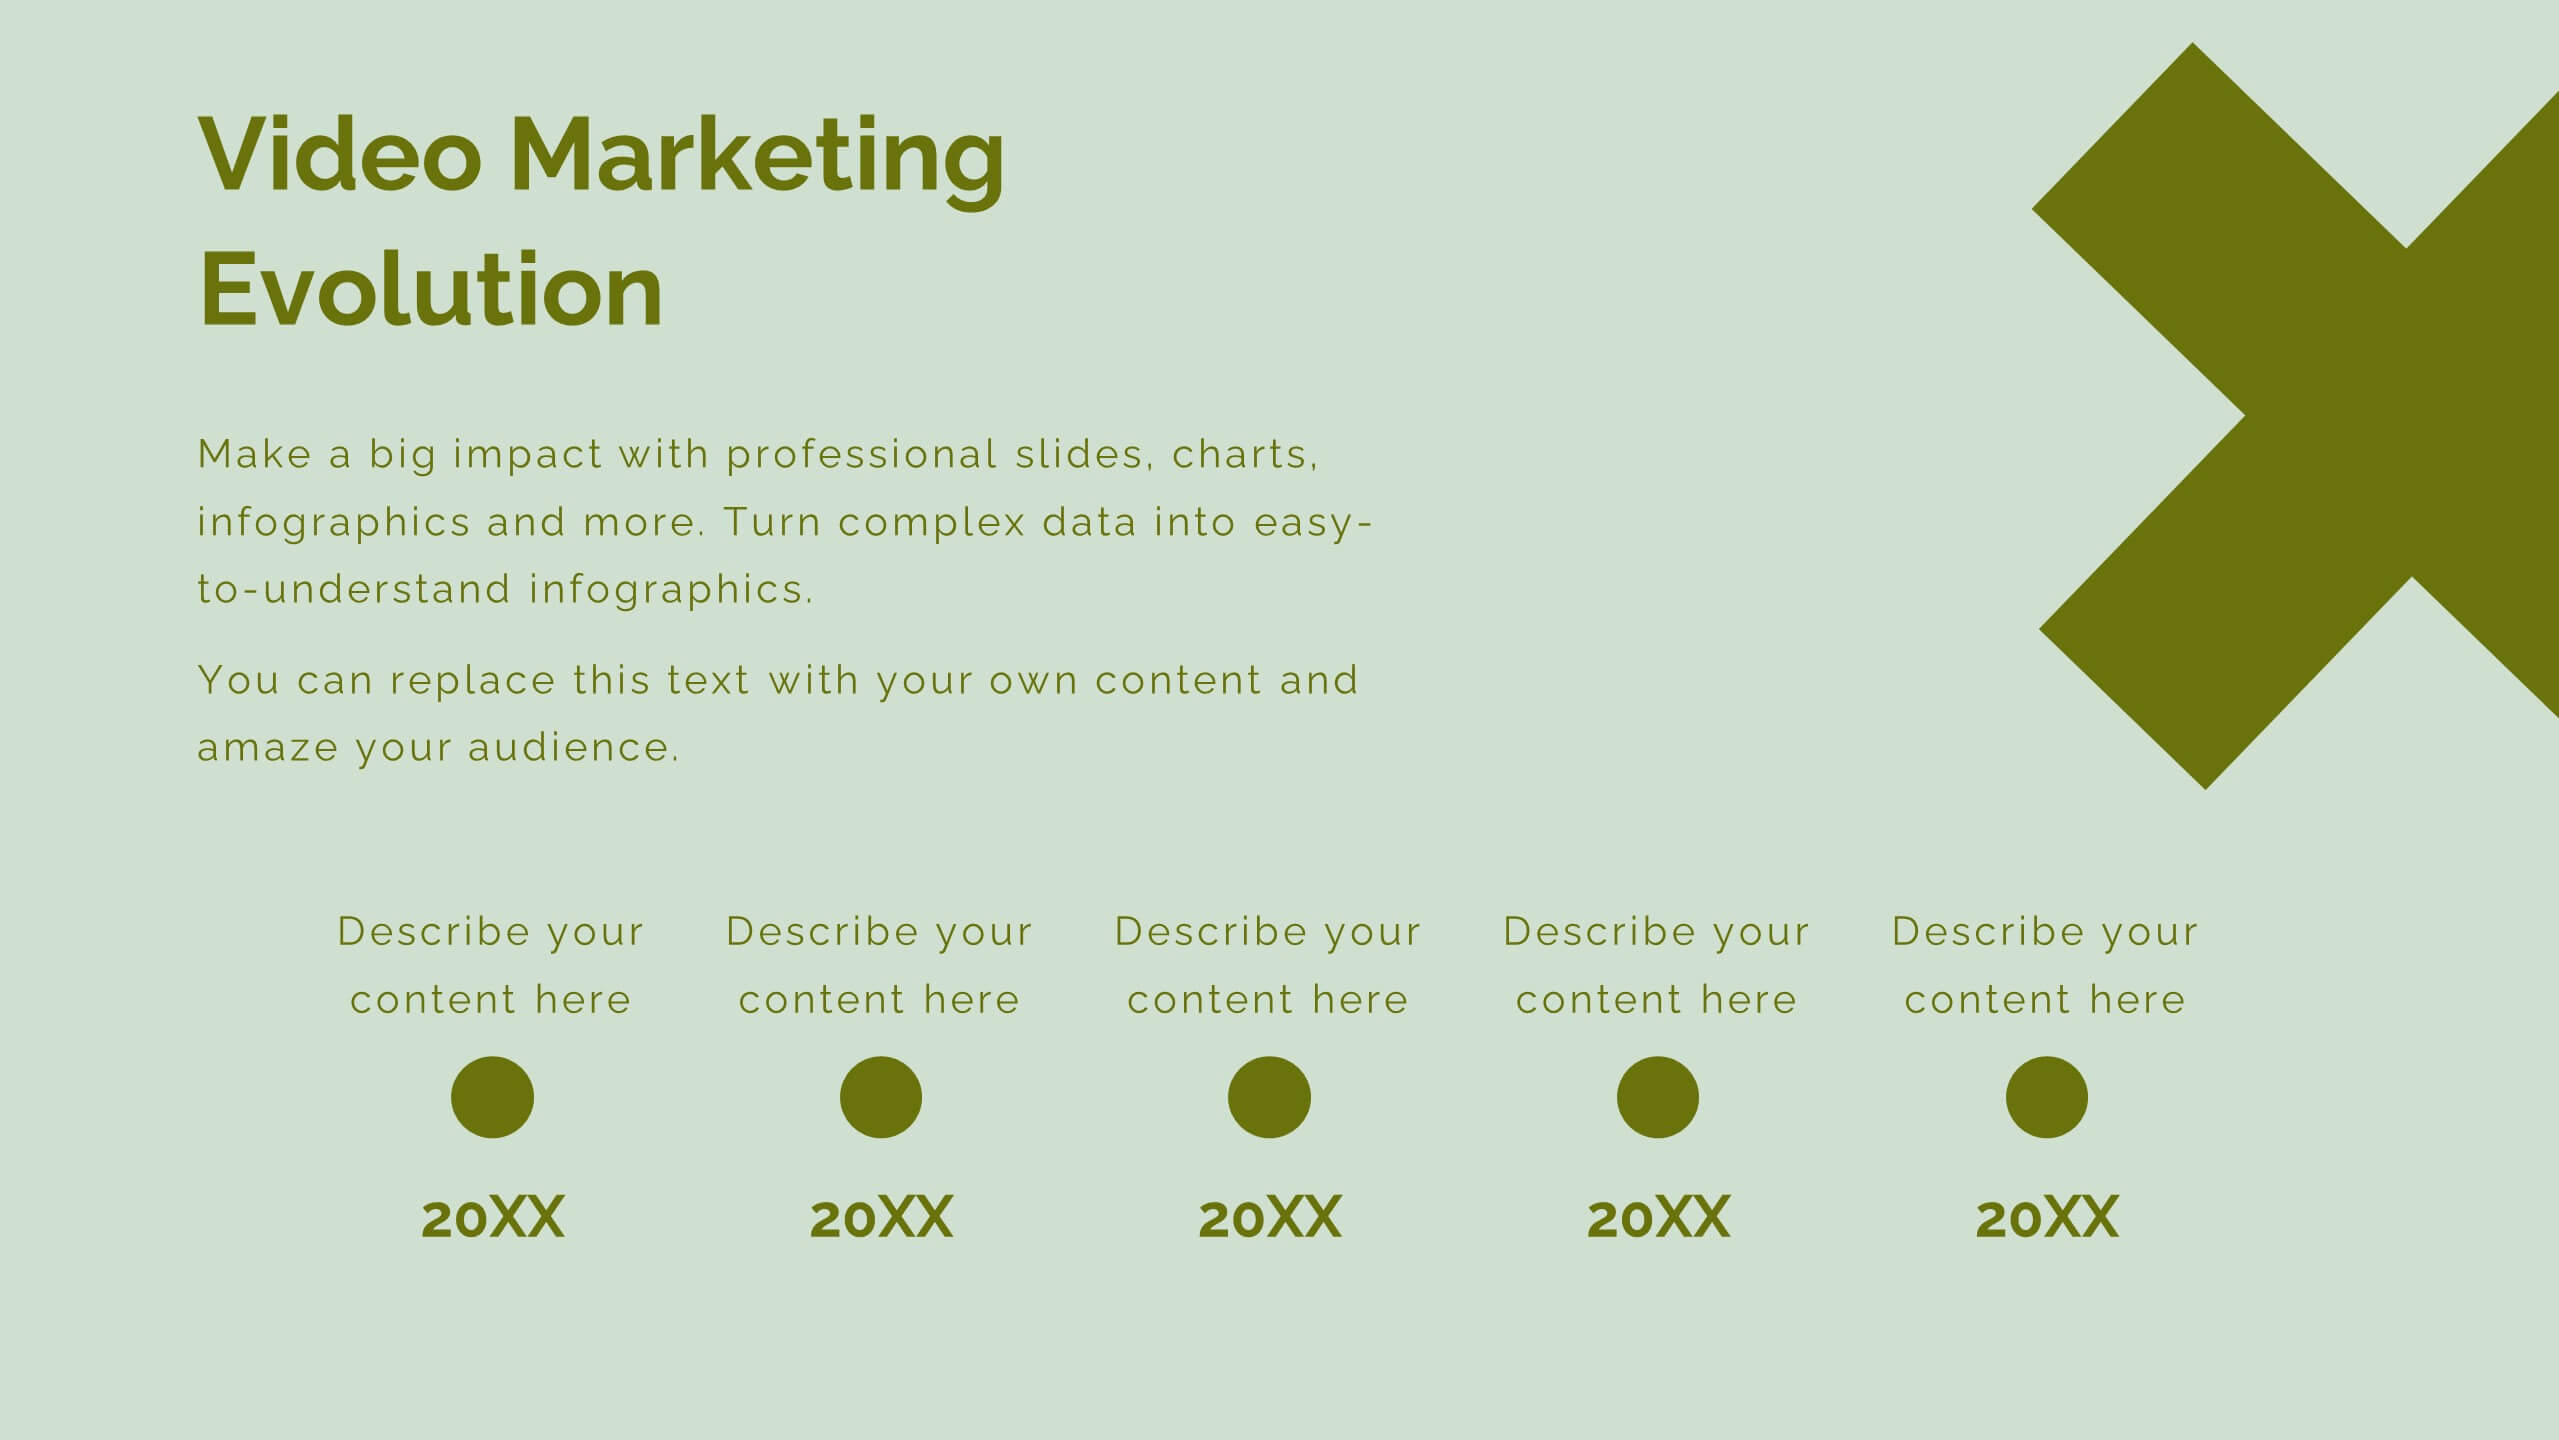
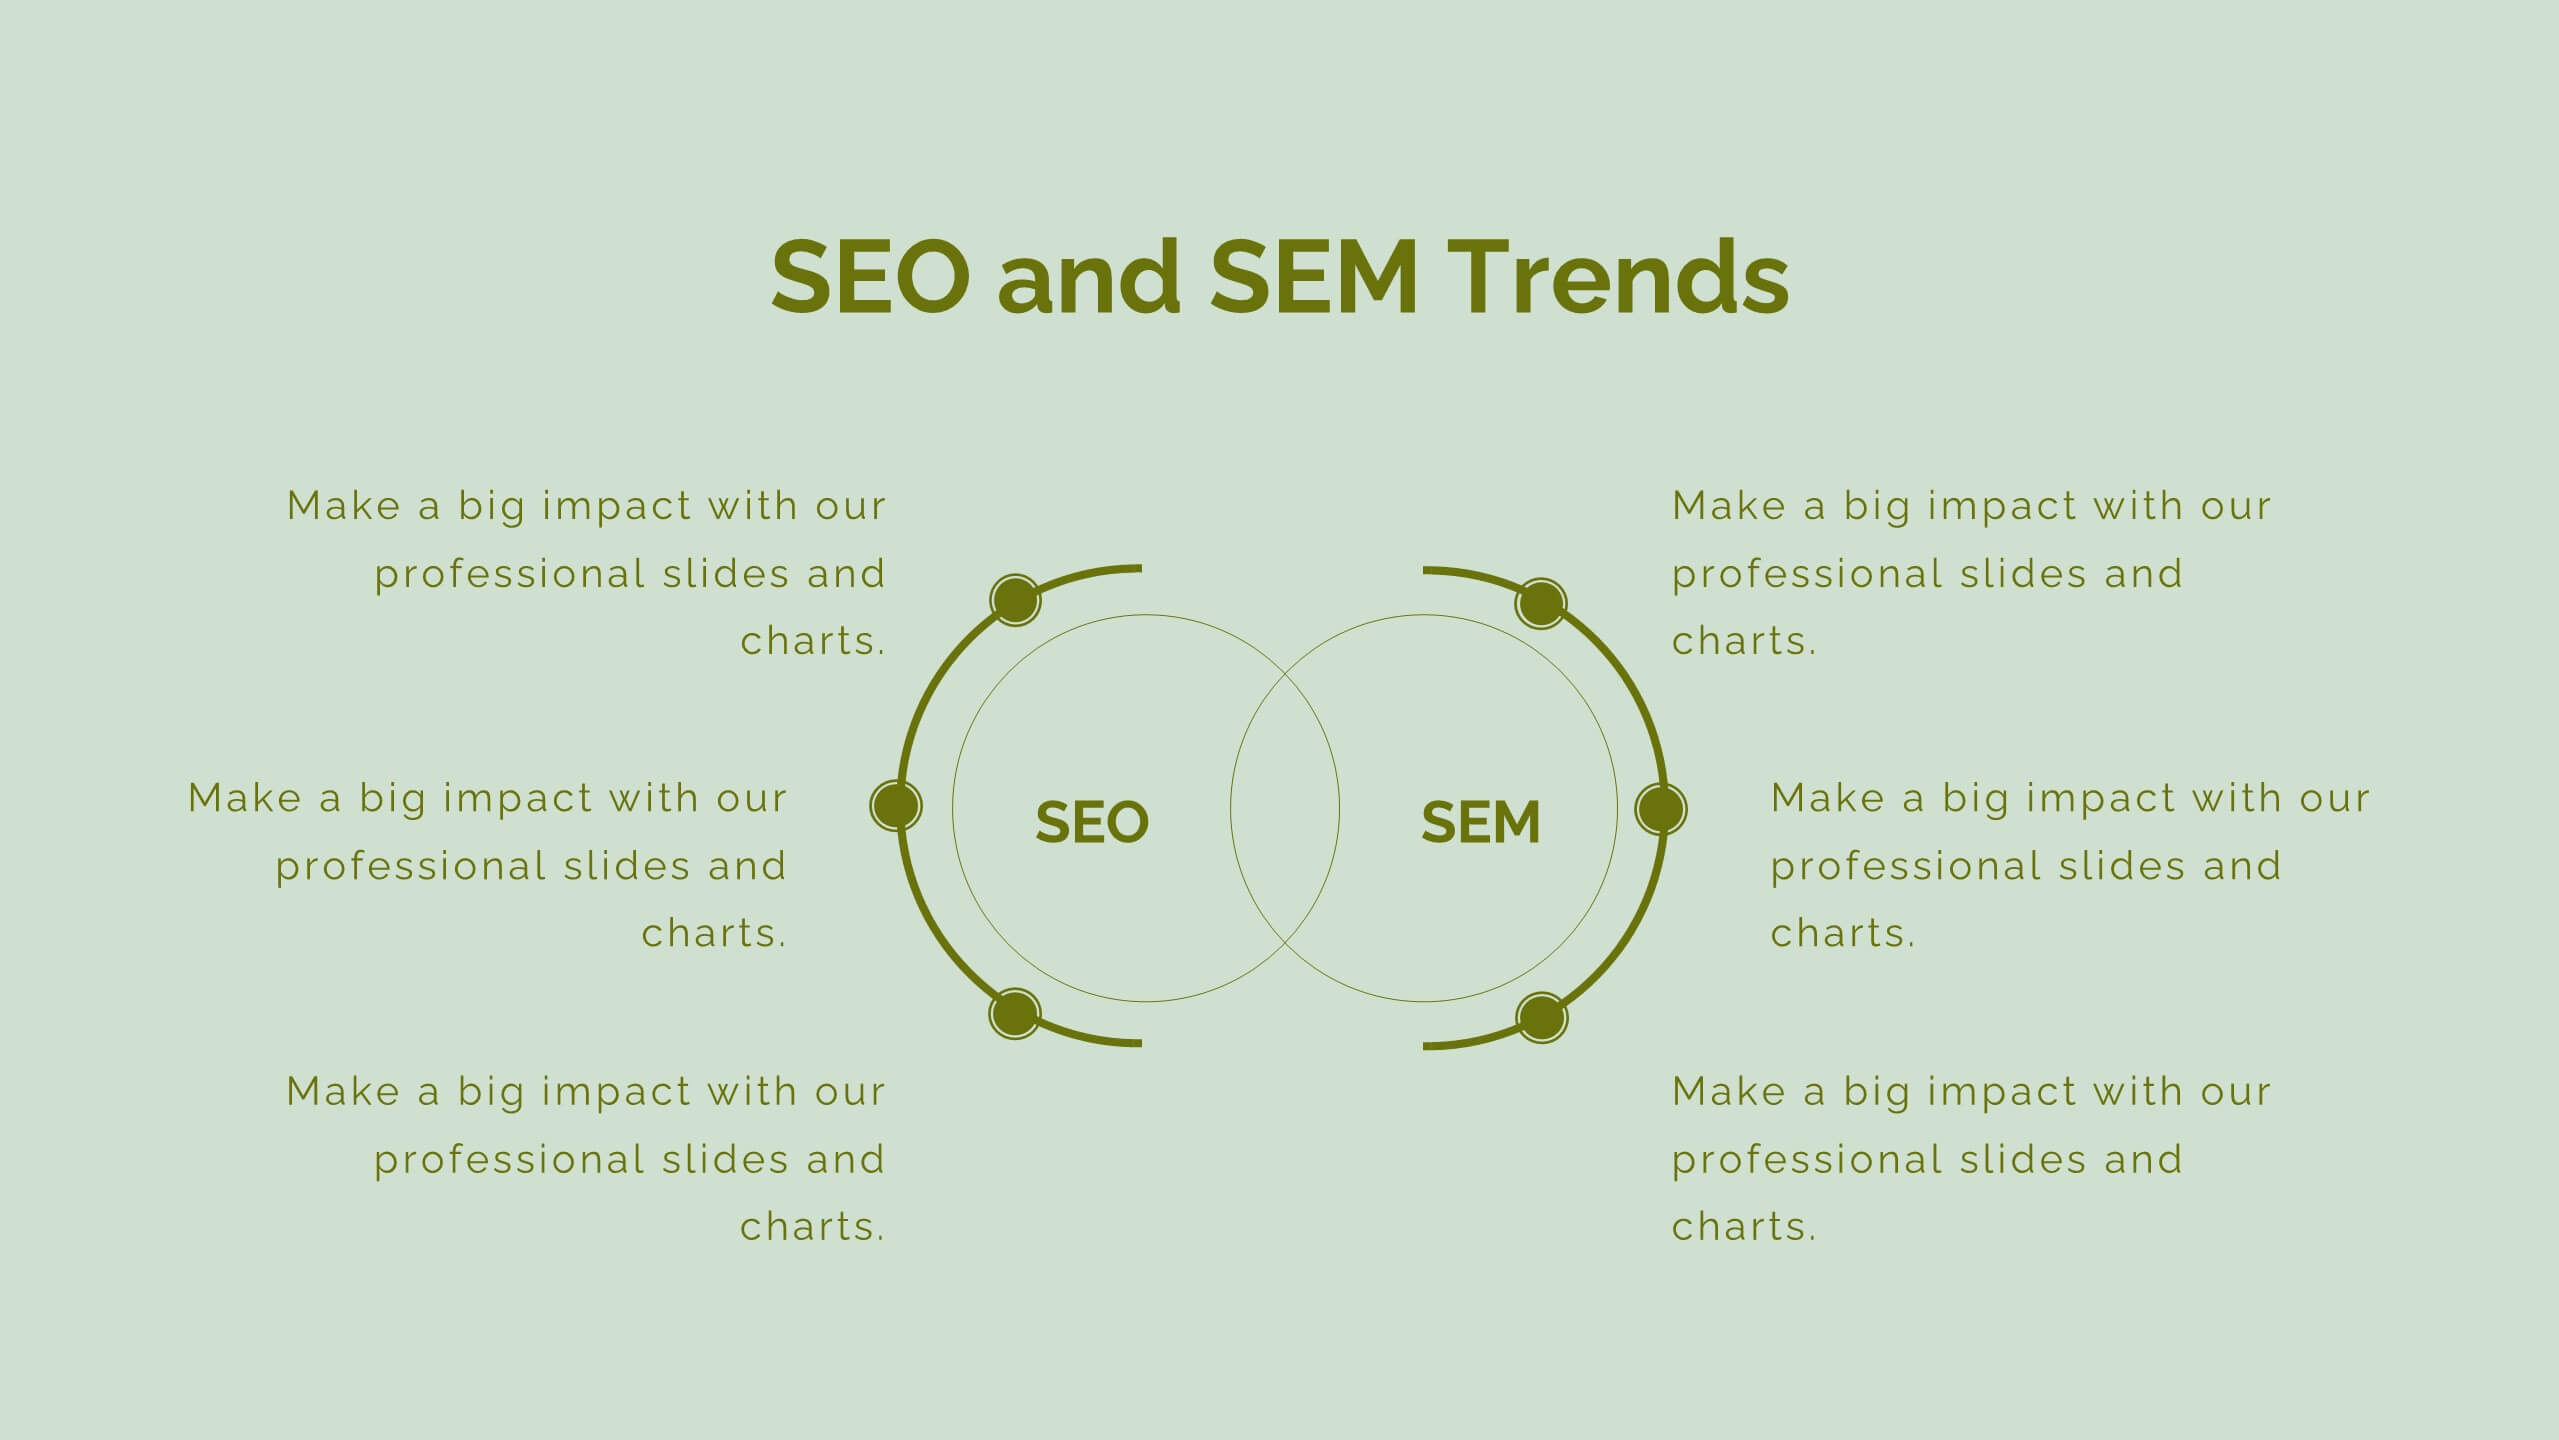
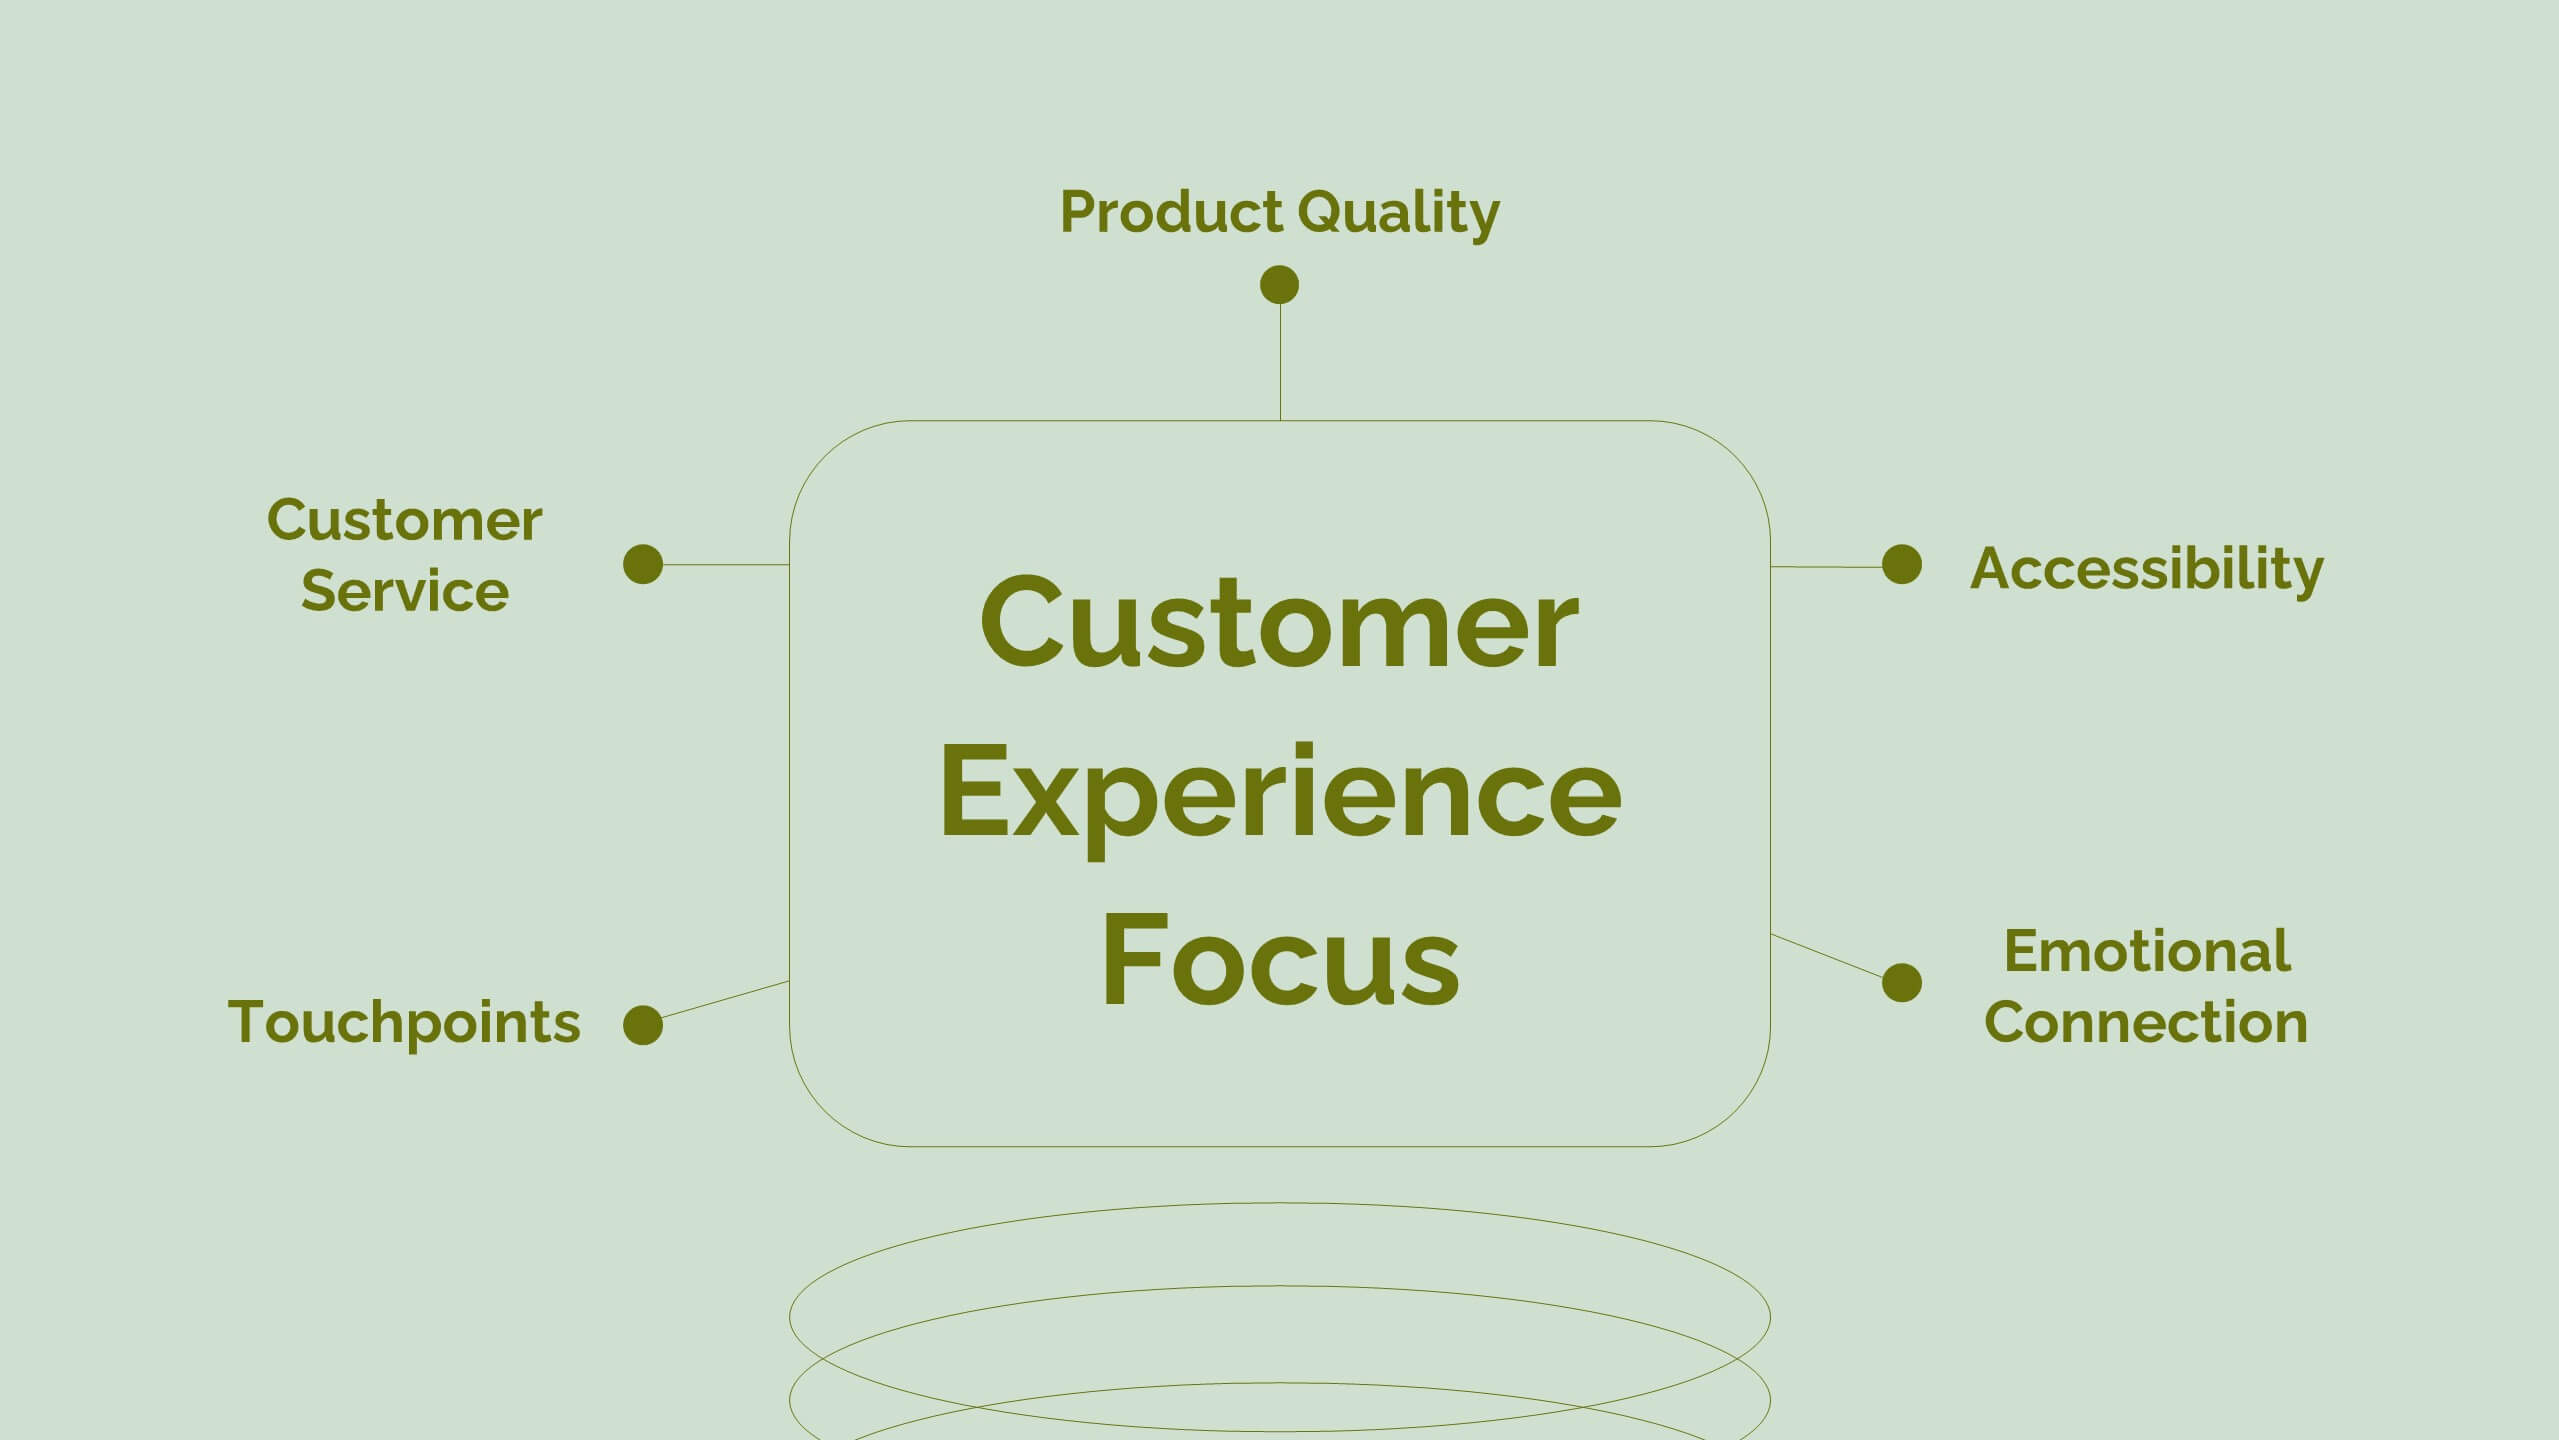
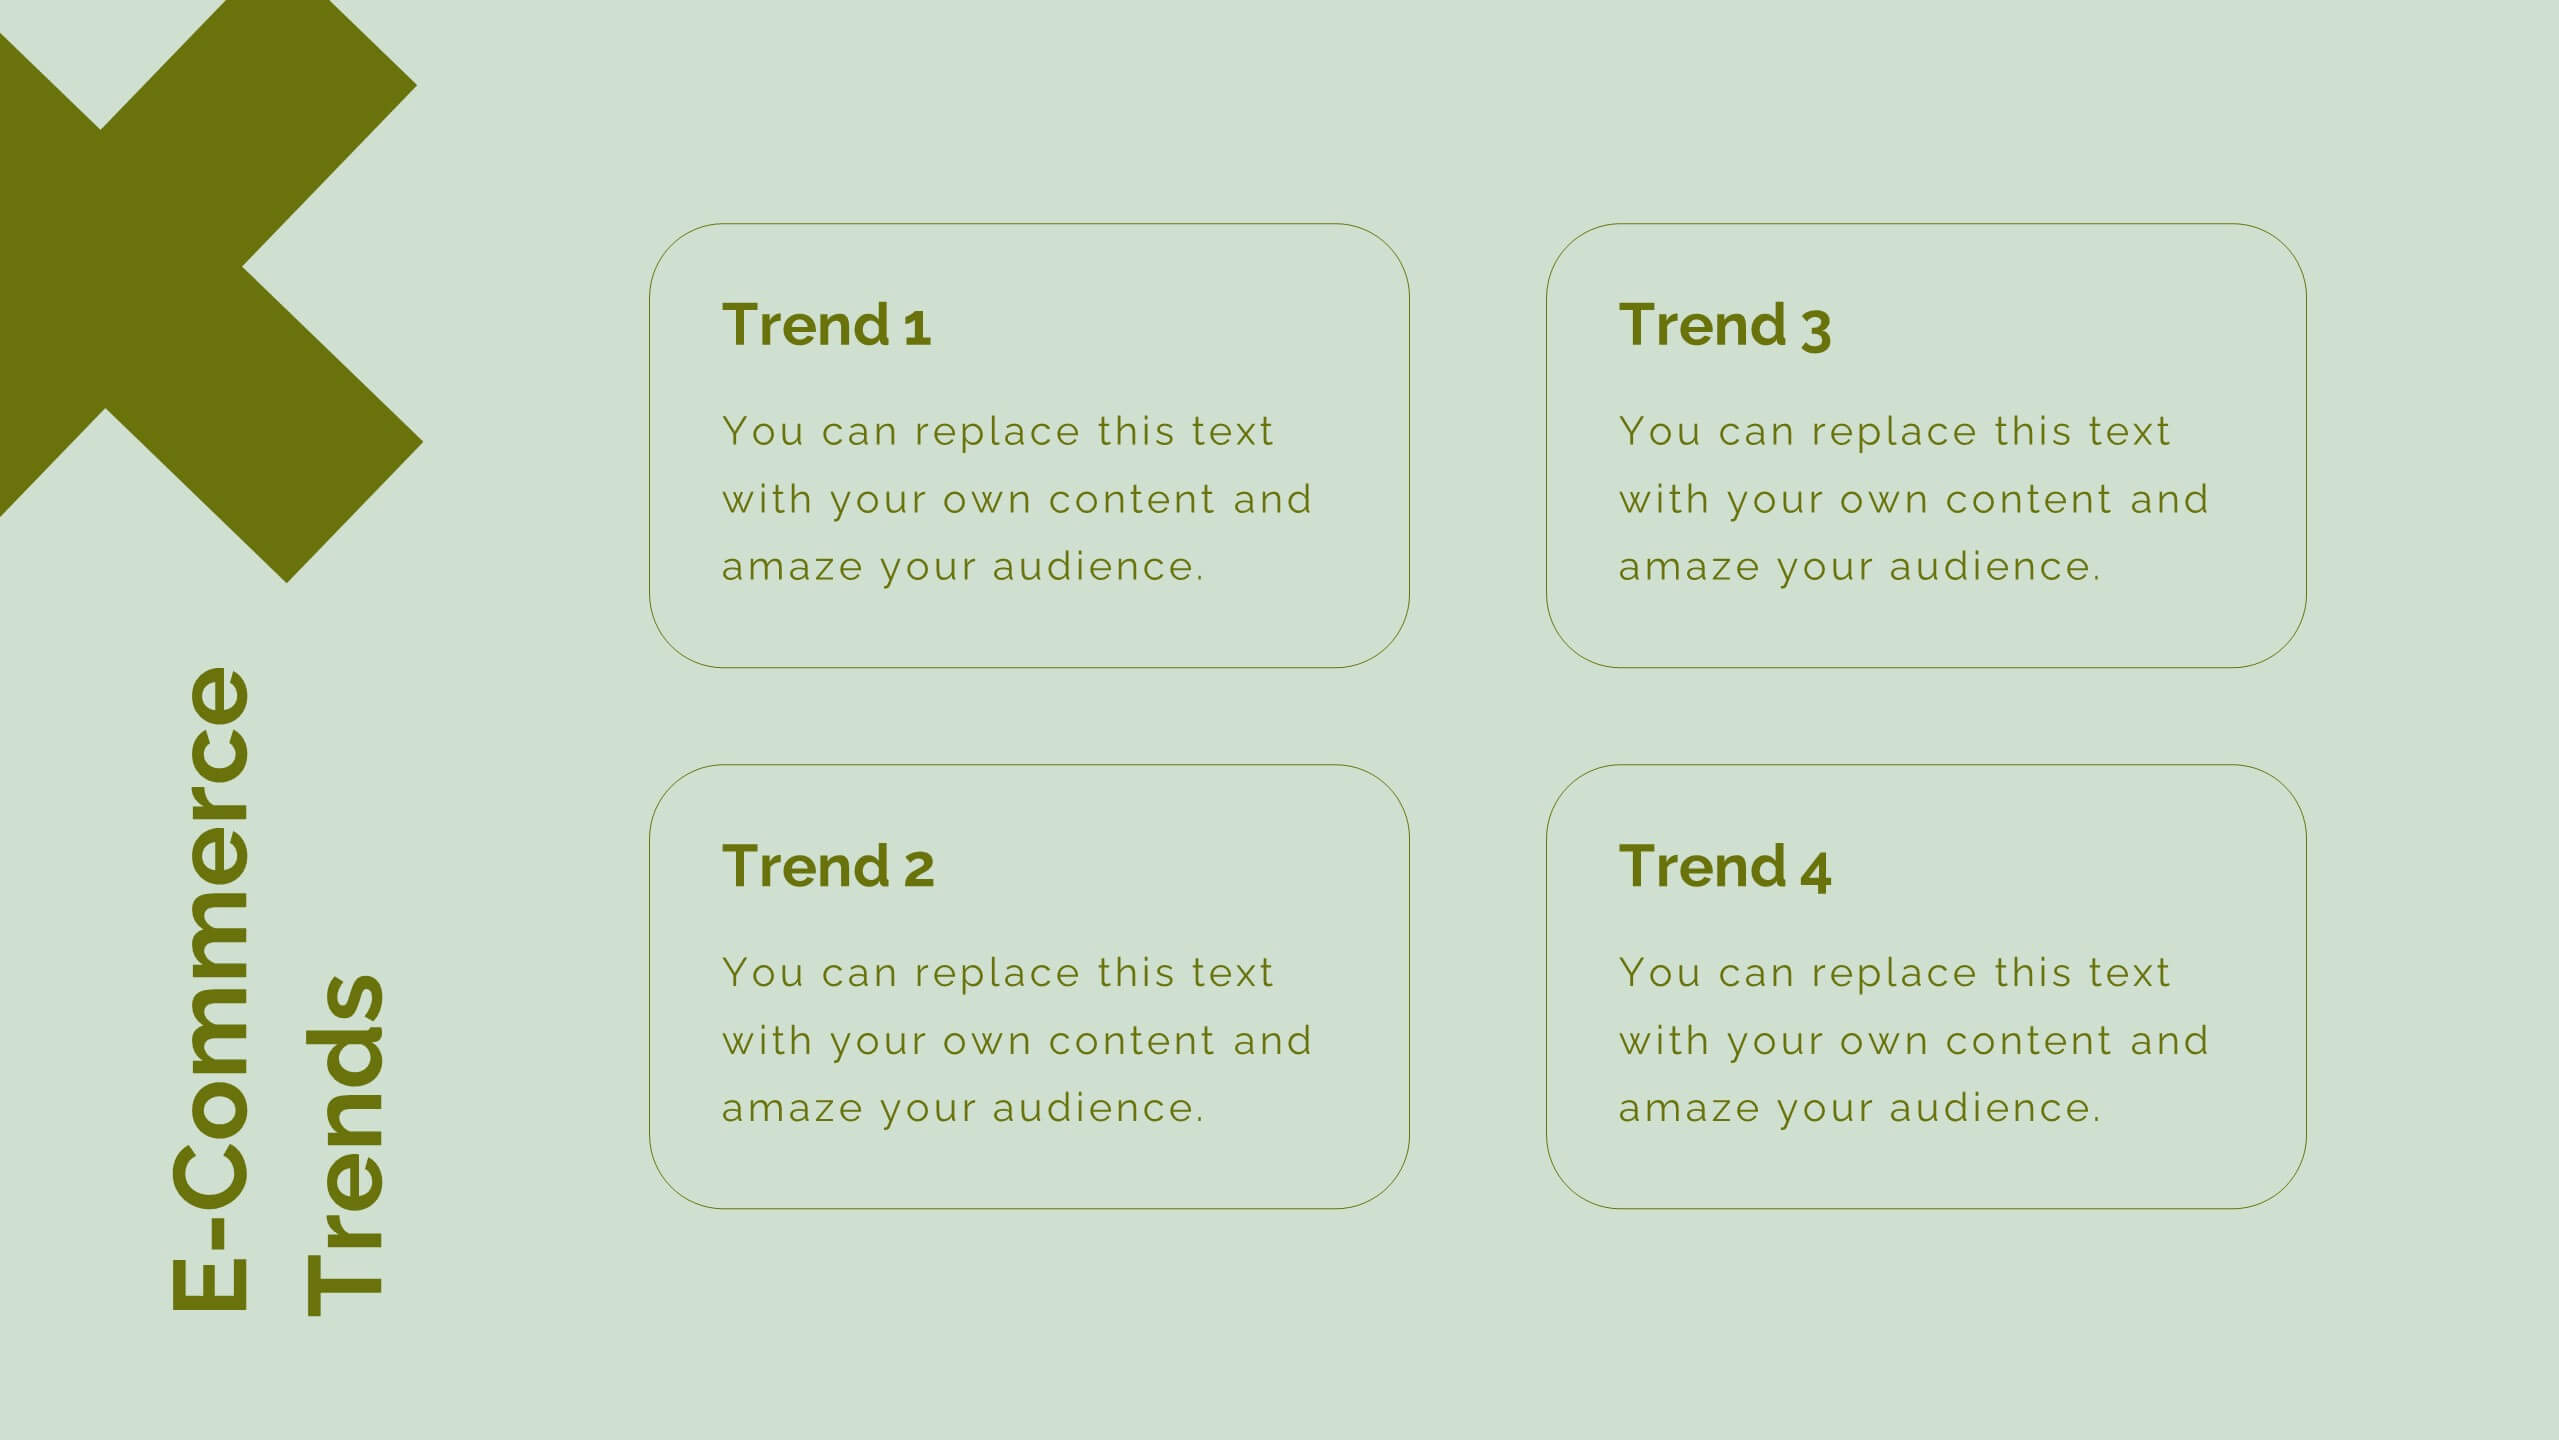
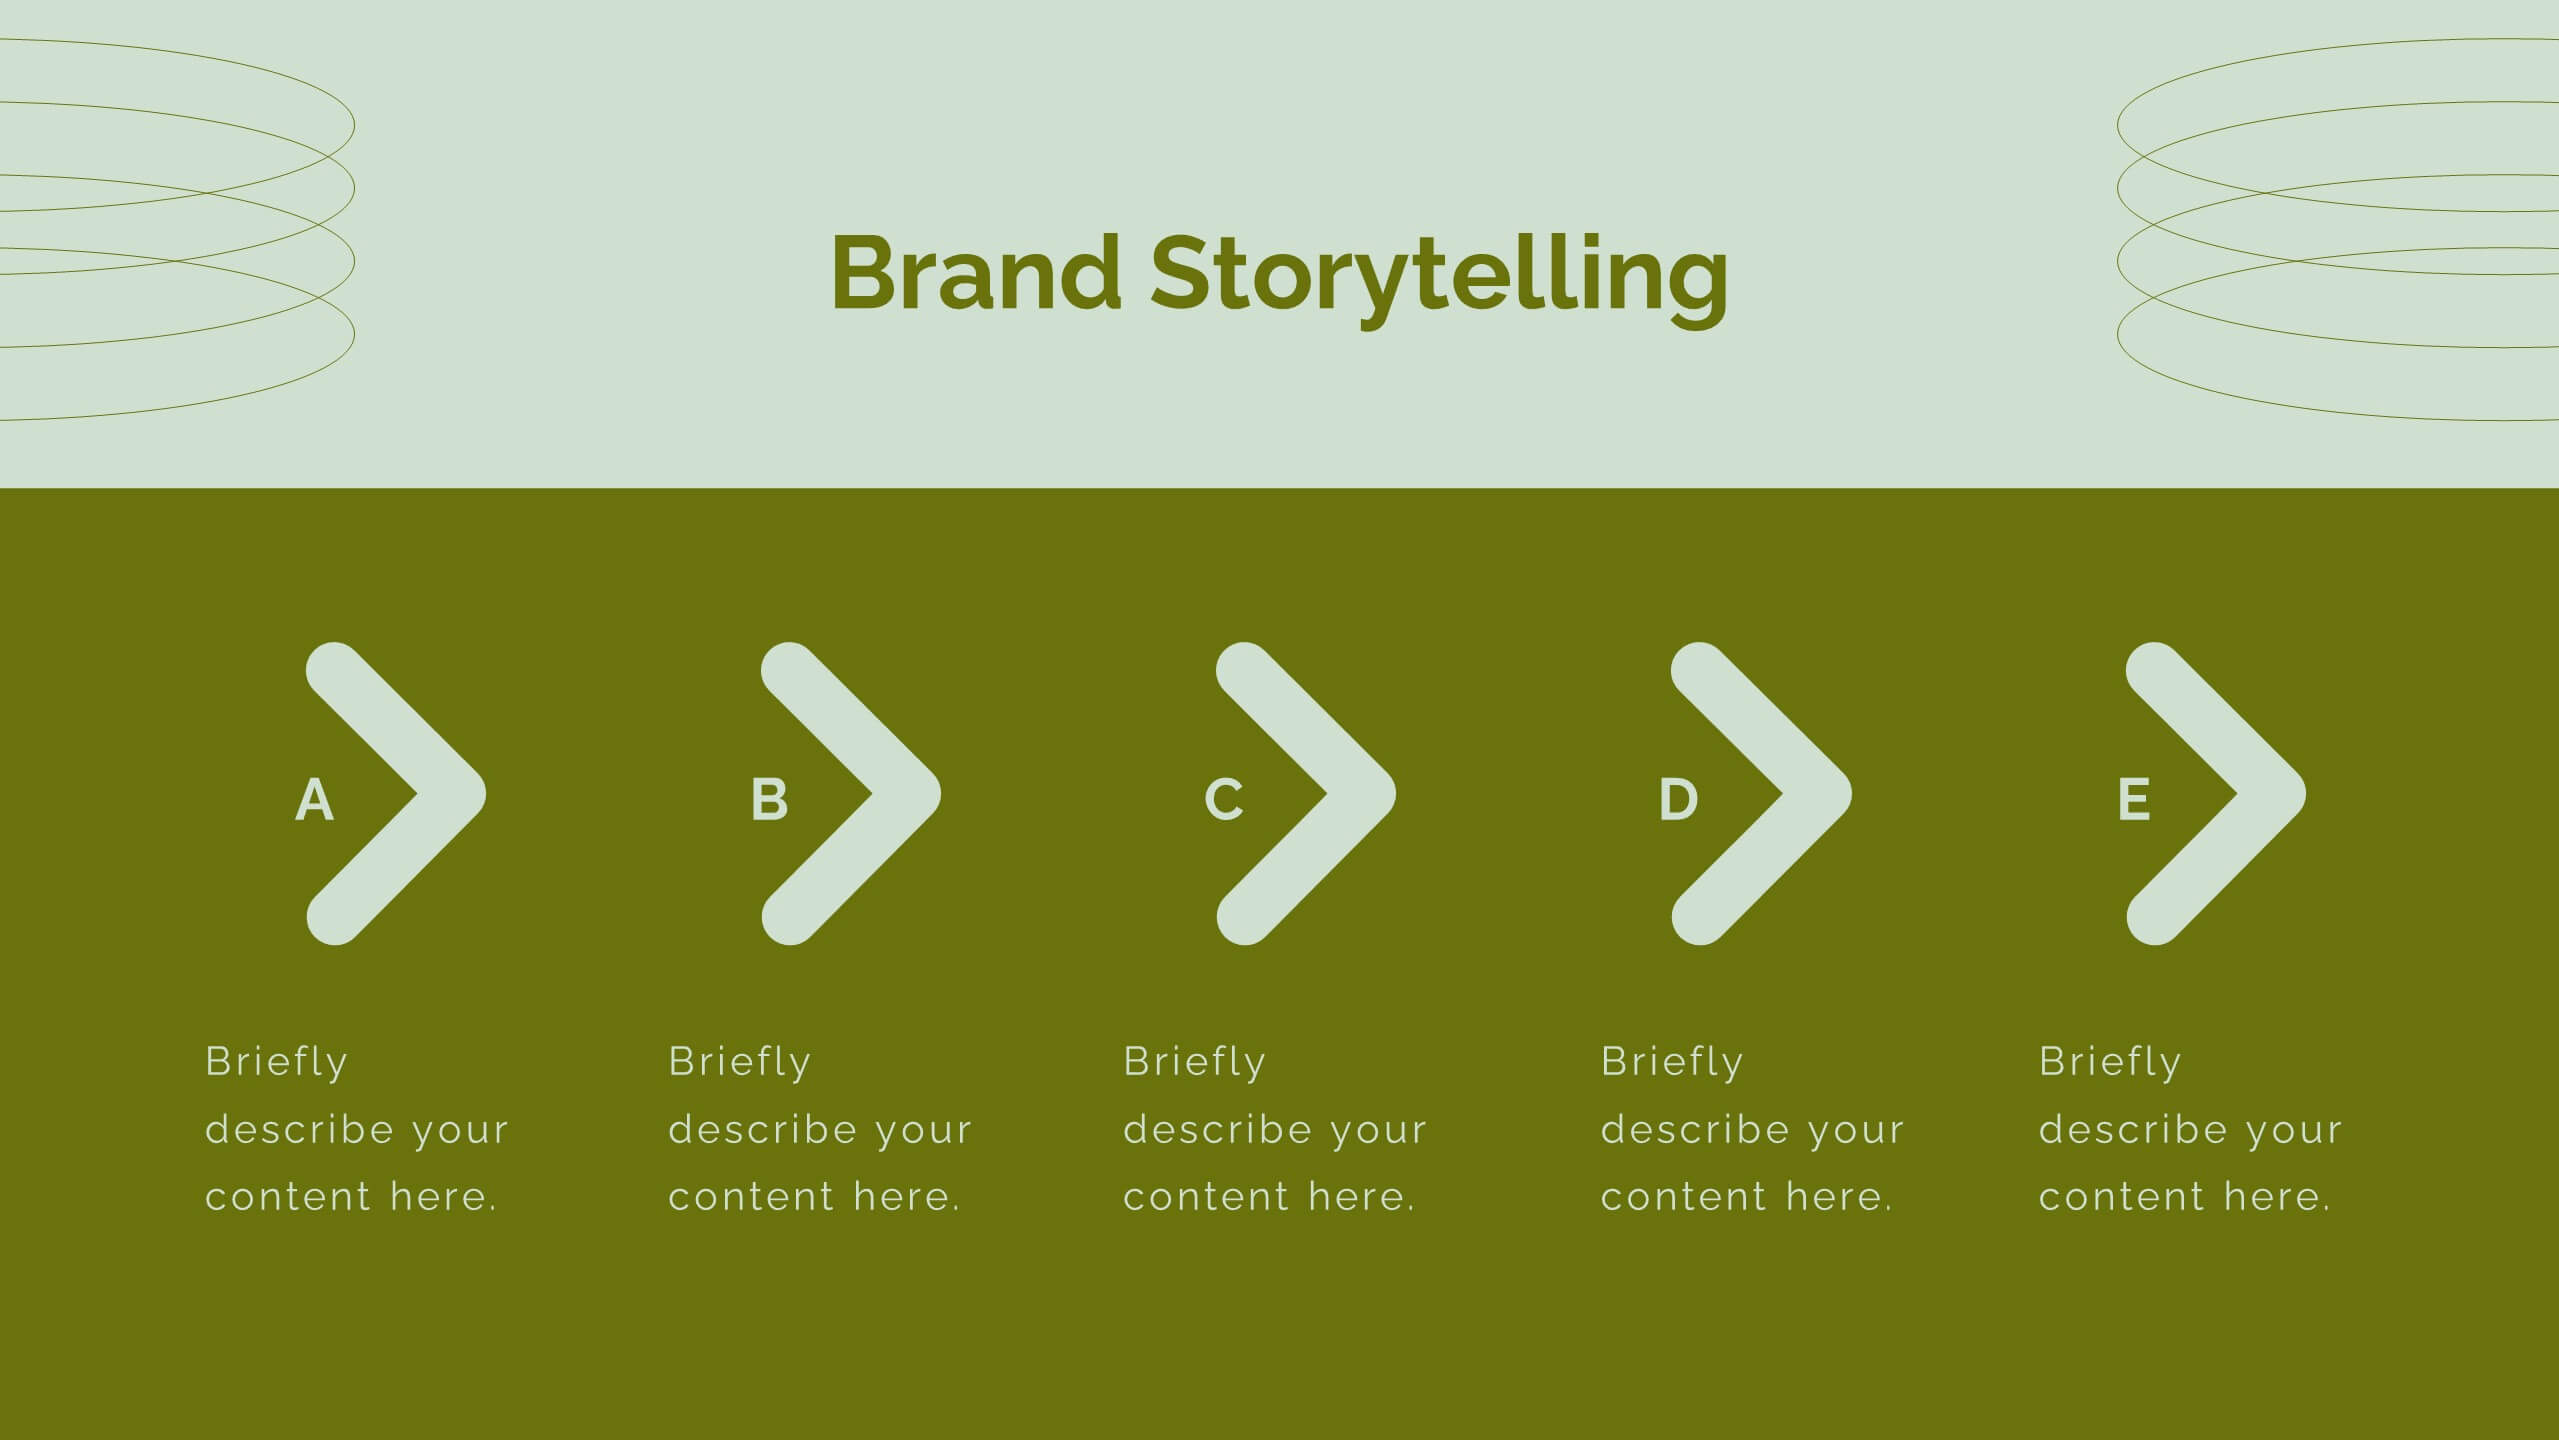
Aura Digital Marketing Strategy Plan Presentation
Revamp your digital marketing strategies with this dynamic template! Covering everything from industry overviews and consumer behavior analysis to emerging technologies and social media strategies, this template has it all. Perfect for creating compelling presentations that highlight data-driven marketing and brand storytelling. Compatible with PowerPoint, Keynote, and Google Slides.