


Características


¿Tienes alguna pregunta?
Recomendar


4 diapositivas
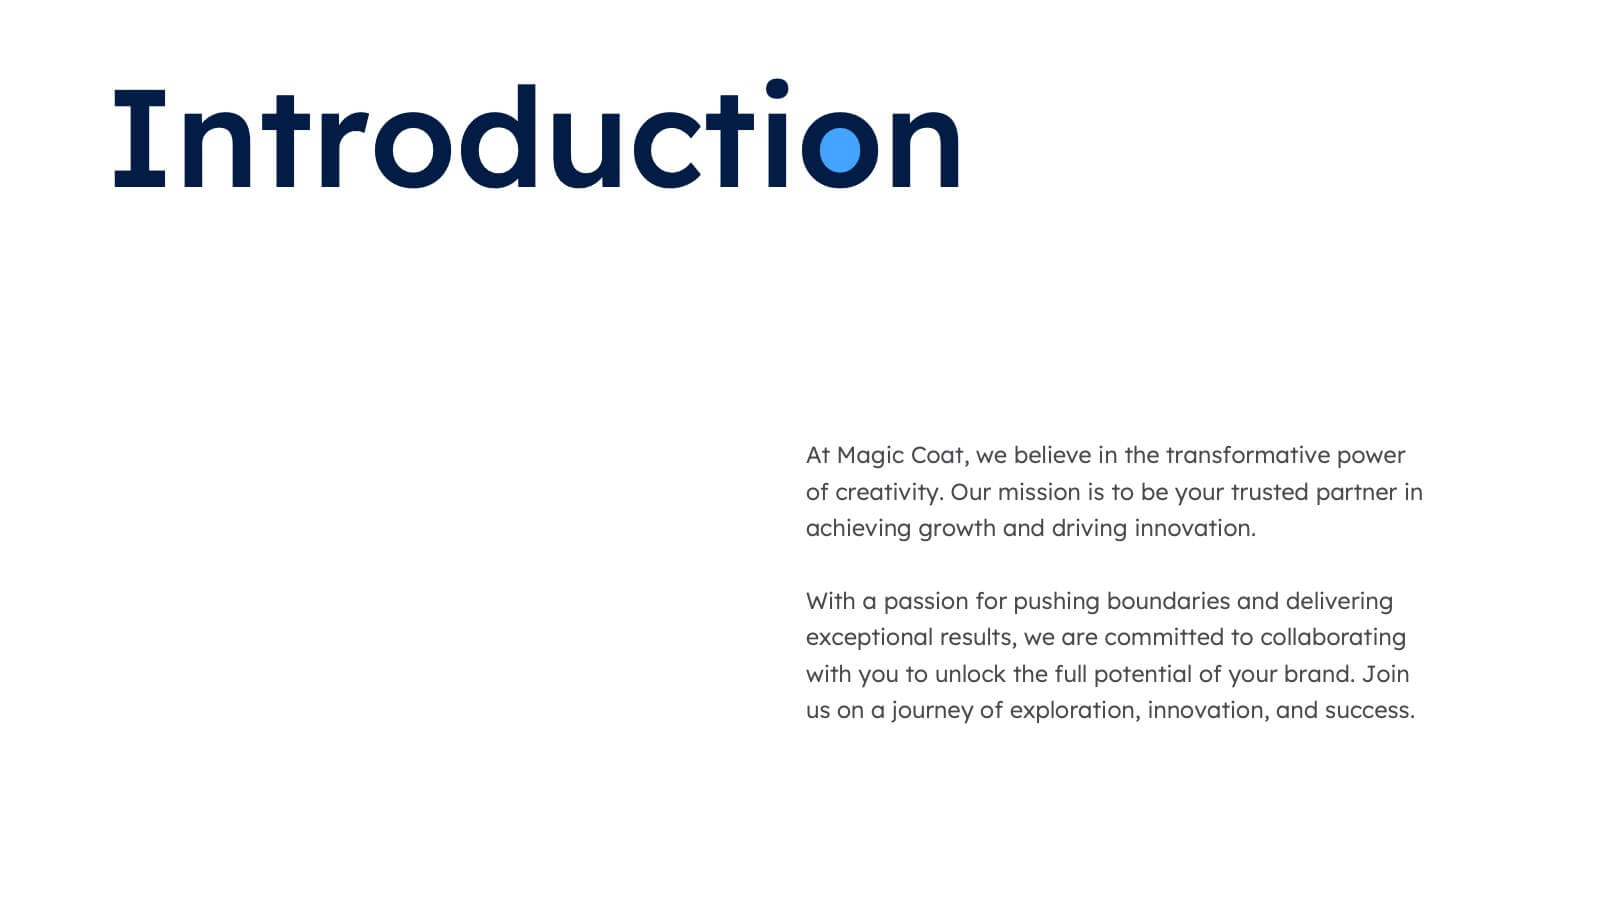
Design and Project Work Samples Presentation
Showcase your creative projects with this visually structured layout. Featuring a bold title area and three image slots for key works, it’s perfect for portfolios, proposals, or pitch decks. Fully editable in PowerPoint, Keynote, and Google Slides to suit your brand and project presentation needs.


10 diapositivas
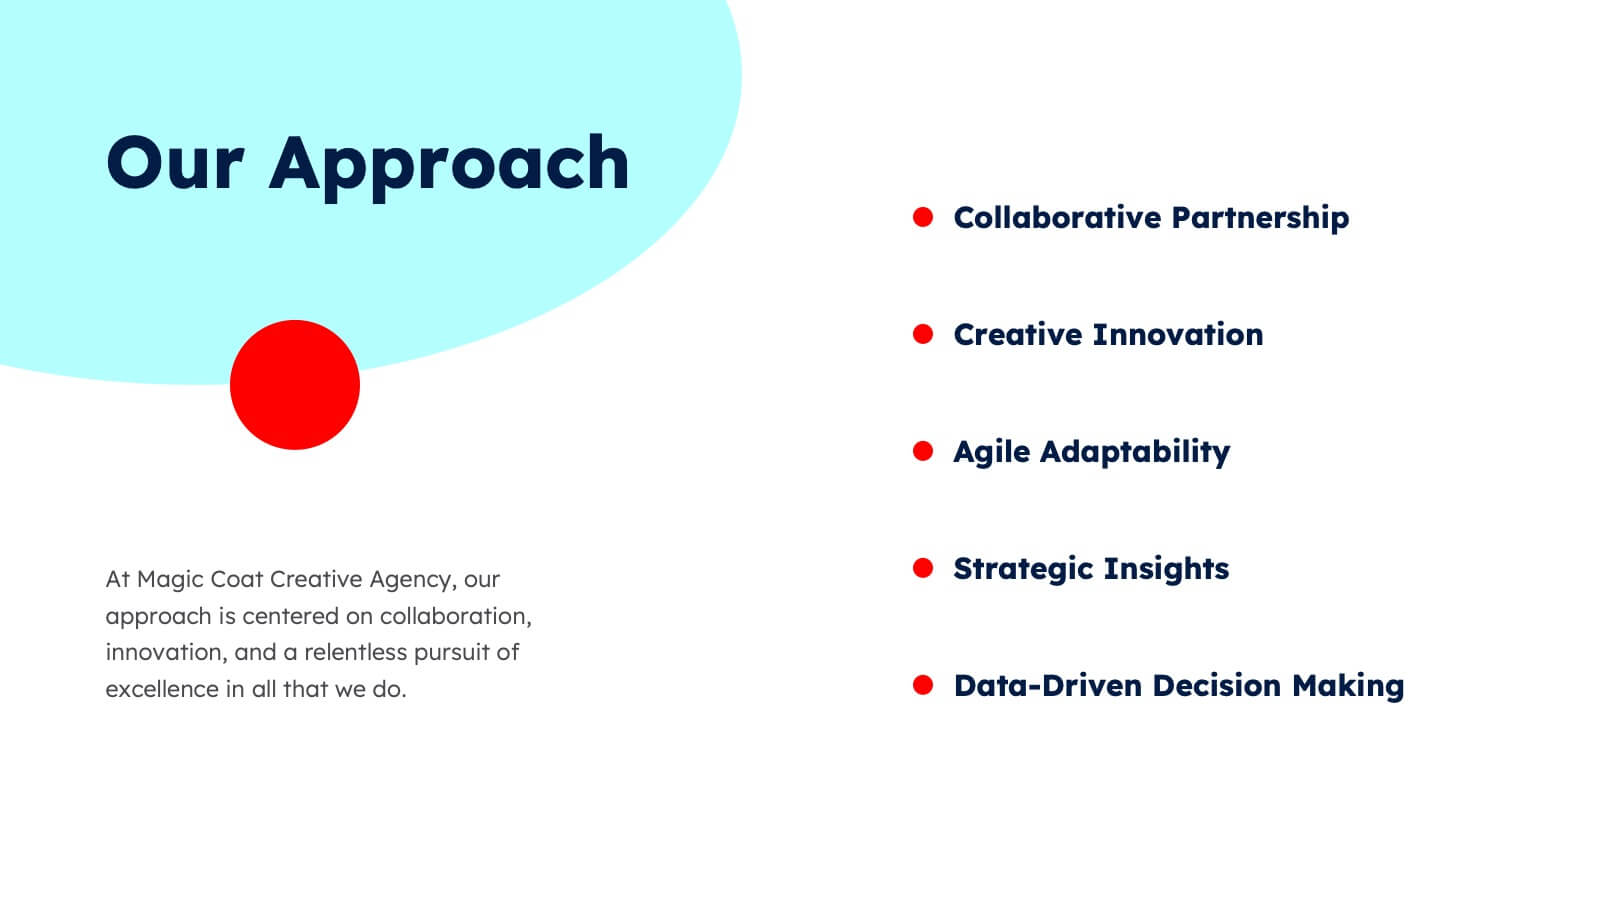
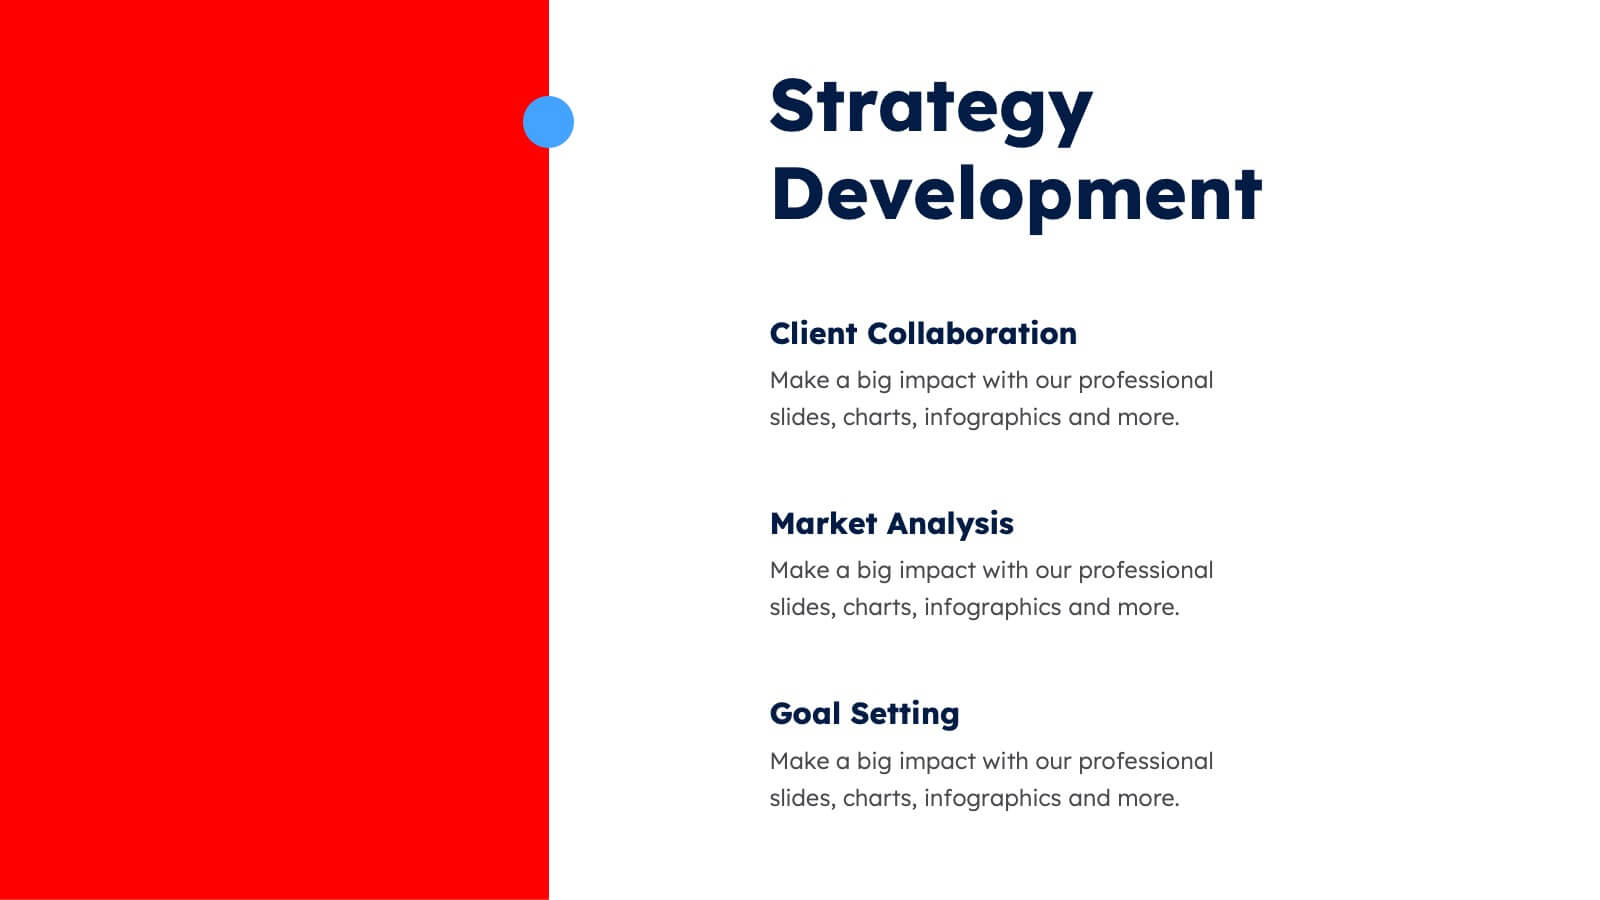
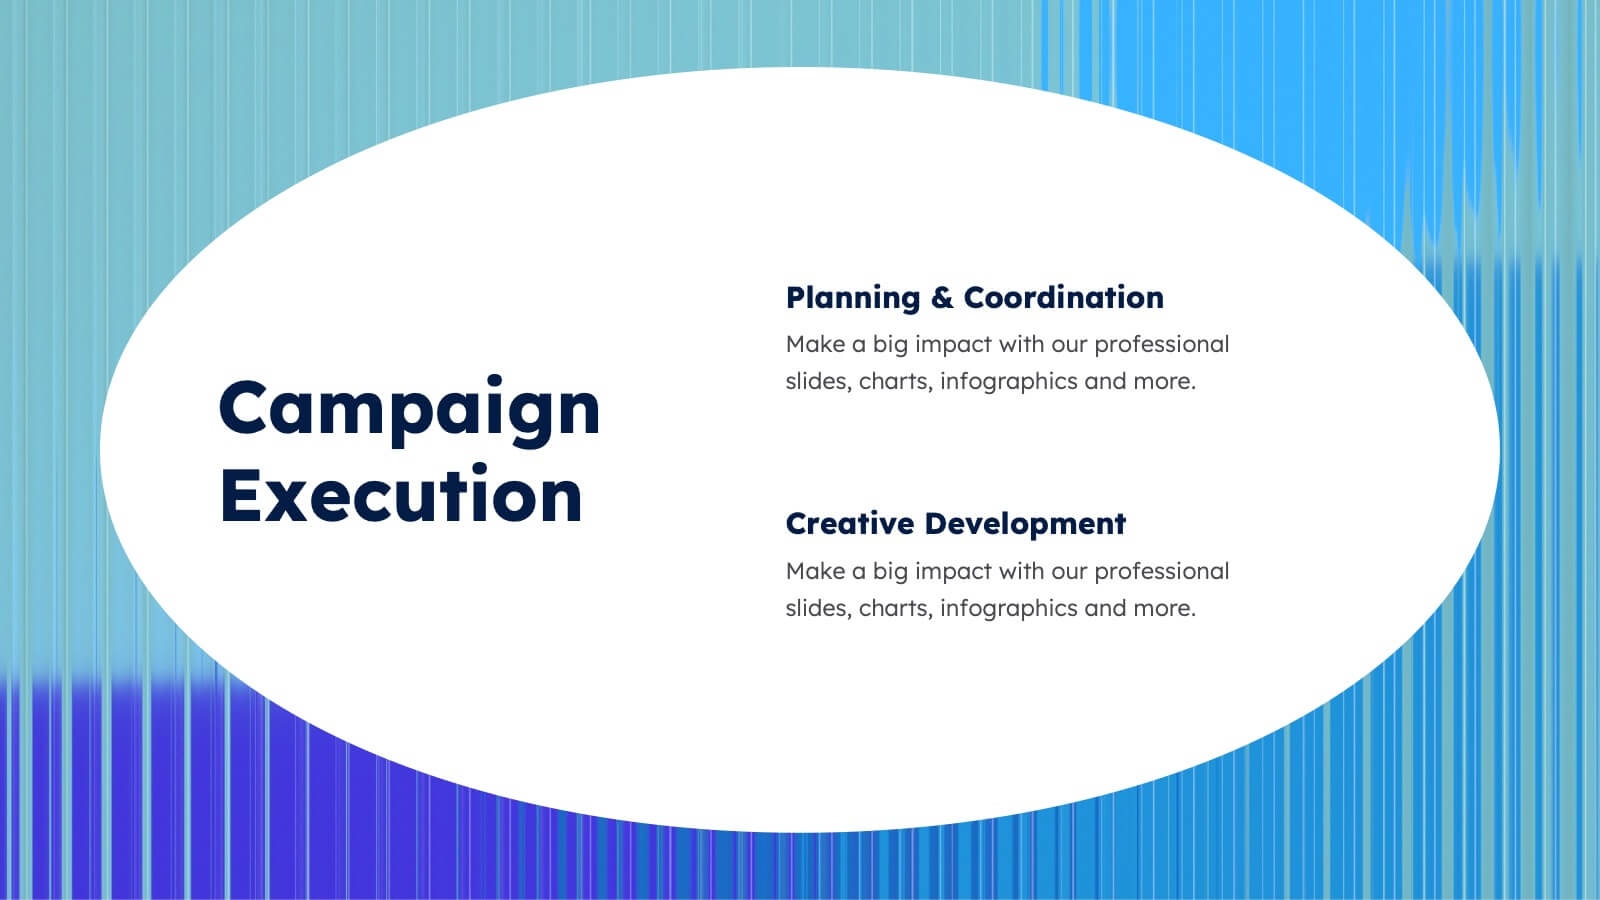
Growth Strategy in Four Steps Presentation
Achieve sustainable business expansion with the Growth Strategy in Four Steps presentation. This structured template guides teams through progressive development phases, using clear visuals to illustrate key milestones and percentage-based improvements. Ideal for entrepreneurs, marketers, and business strategists, this slide layout is fully customizable and compatible with PowerPoint, Keynote, and Google Slides for seamless integration into your workflow.


22 diapositivas
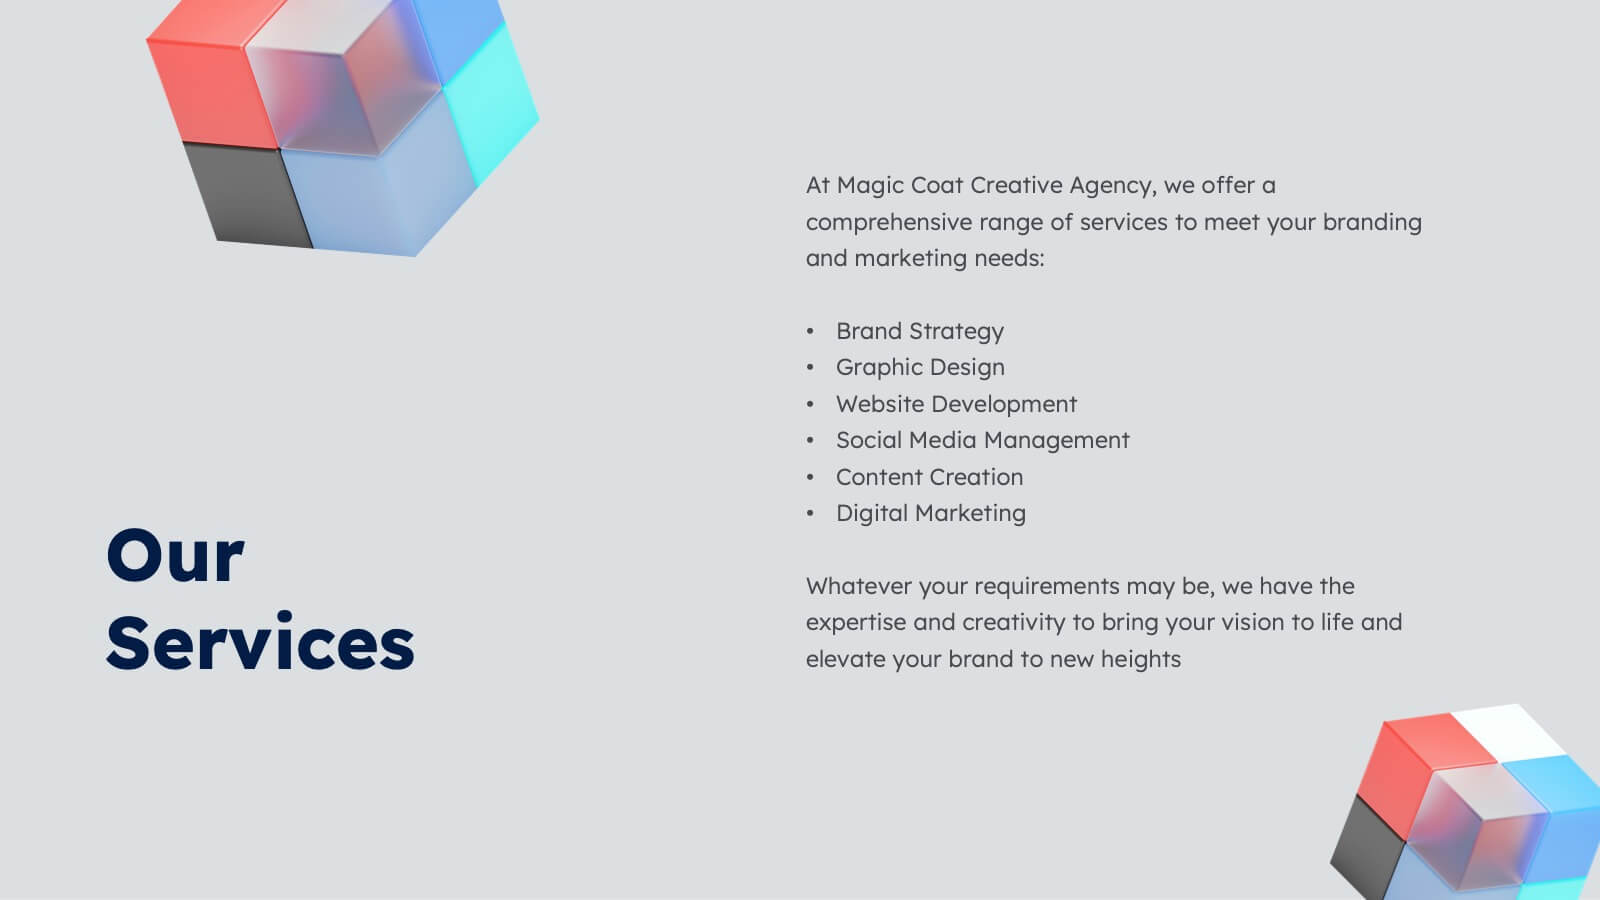
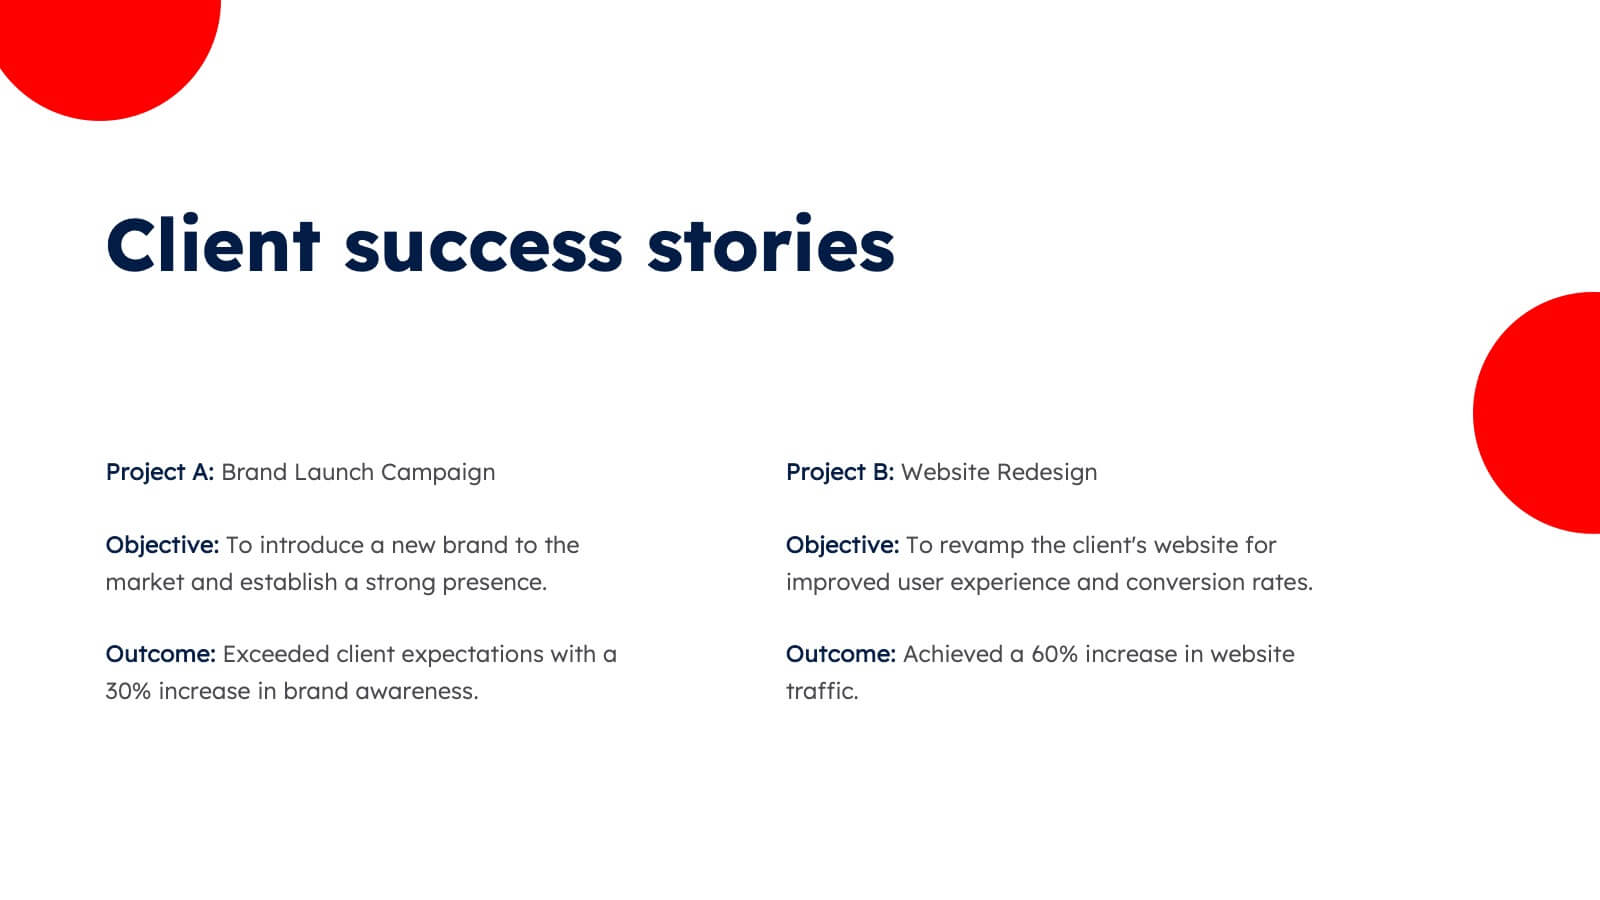
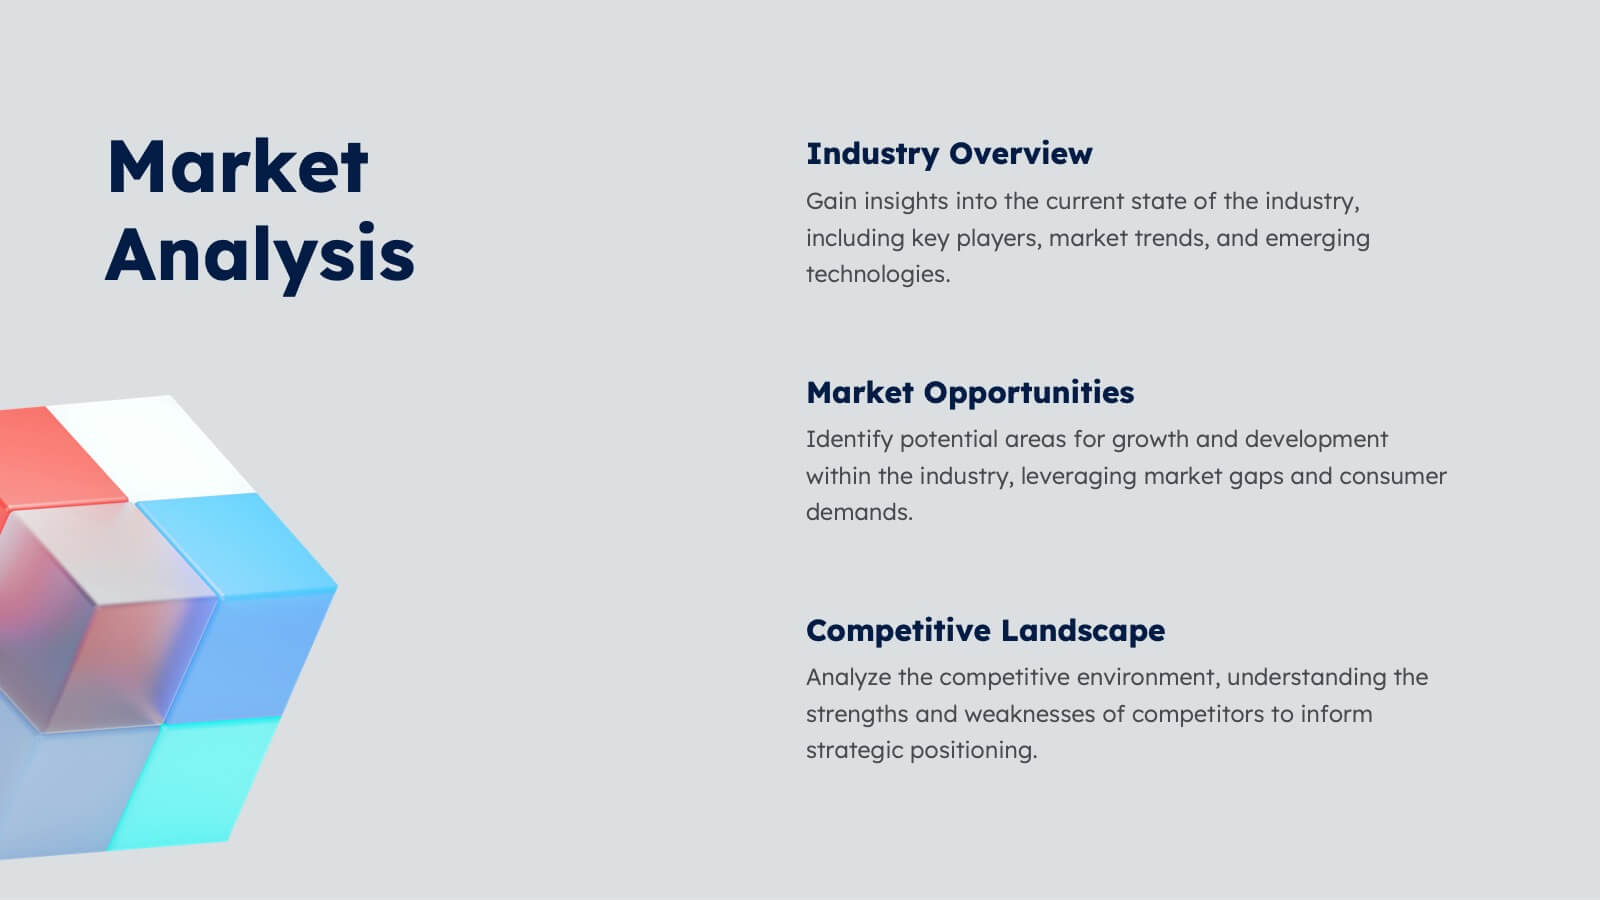
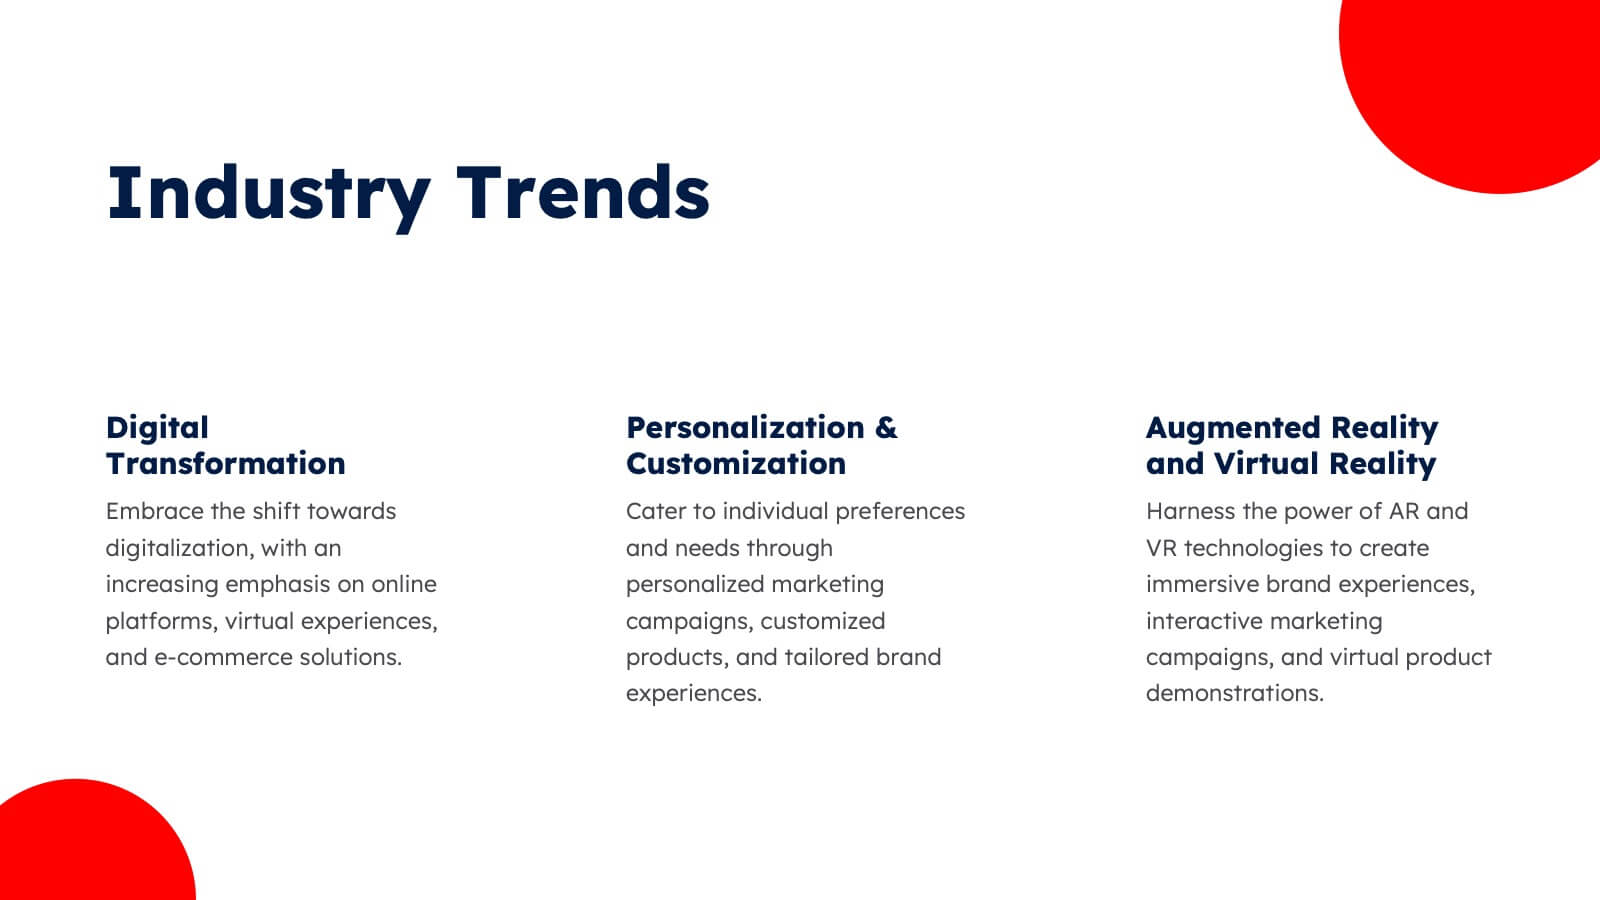
Aura Agency Portfolio Presentation
Showcase your agency's brilliance with this vibrant portfolio presentation template! Ideal for highlighting your mission, vision, case studies, and market analysis, it brings your achievements to life with colorful, engaging slides. Impress clients and partners with a well-structured, visually appealing narrative. Compatible with PowerPoint, Keynote, and Google Slides for easy use on any platform.


5 diapositivas
Corporate Office Life Illustration Scene Presentation
Bring your workplace concepts to life with this modern office scene illustration. Featuring a top-down view of diverse team members in a meeting, this slide is perfect for showcasing collaboration, brainstorming, or teamwork insights. Fully customizable and compatible with PowerPoint, Keynote, and Google Slides for seamless editing.


5 diapositivas
Team and Client Feedback Collection Strategy
Gather actionable insights with the Team and Client Feedback Collection Strategy Presentation. This slide layout uses a balanced circular and rating-star design to showcase four core feedback sources—ideal for presenting survey outcomes, satisfaction metrics, and review strategies. Fully editable in PowerPoint, Keynote, and Google Slides.


5 diapositivas
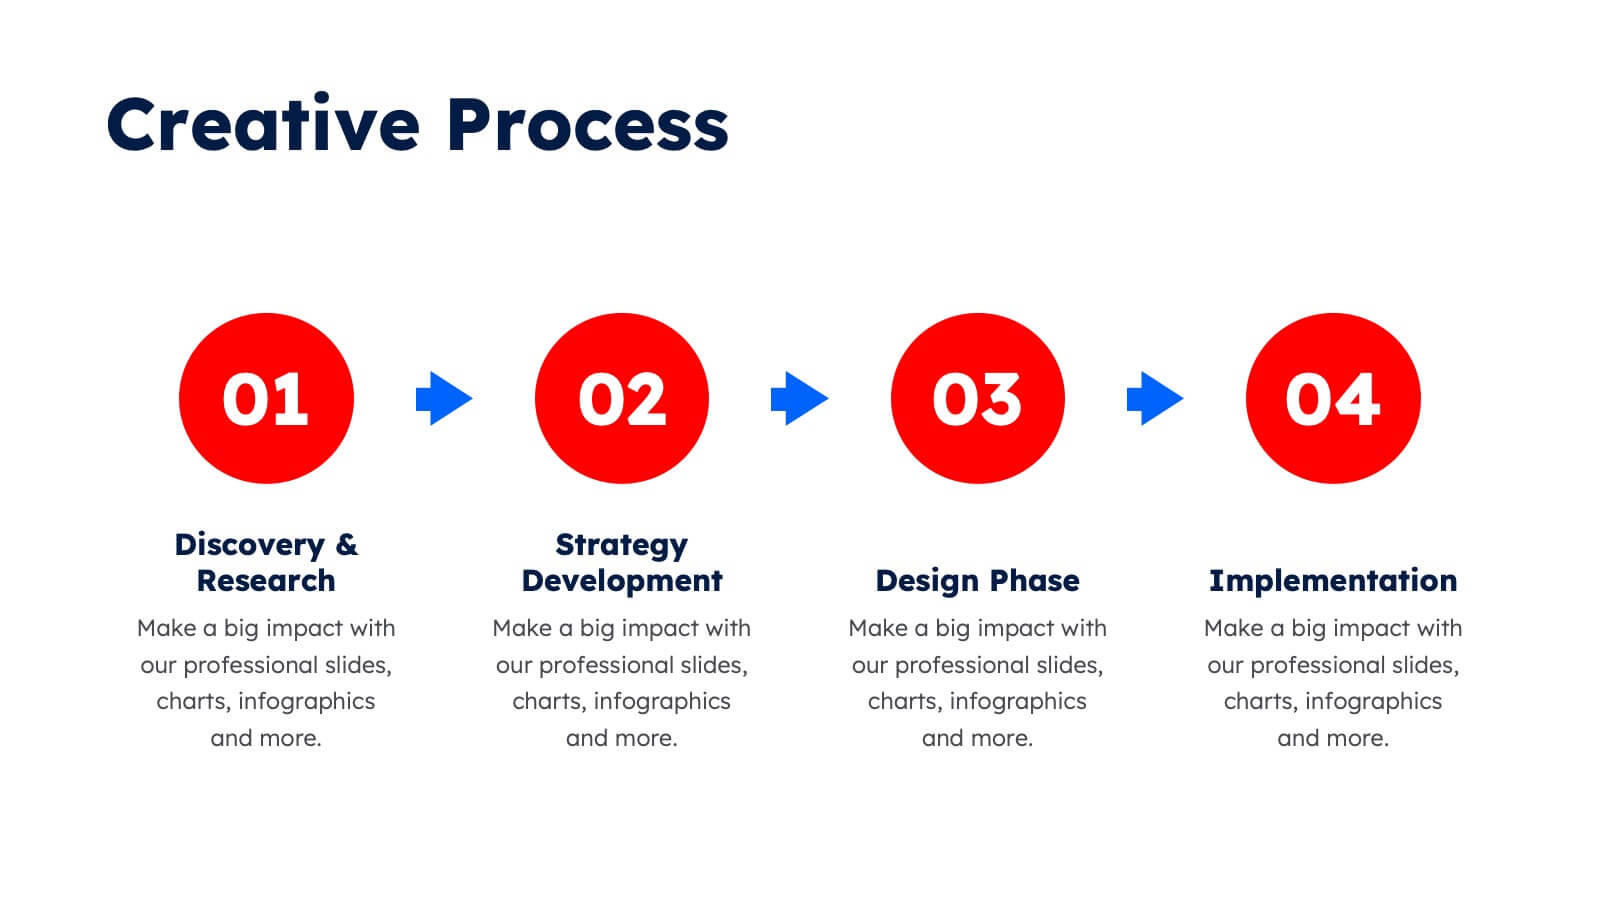
Company Origin and Growth History Presentation
Showcase your company’s journey with the Company Origin and Growth History Presentation. This visual step diagram is ideal for illustrating key milestones, business expansion, or historical achievements. Perfect for pitch decks, annual reports, or investor updates. Fully editable in Canva, PowerPoint, Keynote, and Google Slides for seamless customization.


3 diapositivas
Early Detection and Prevention of Breast Cancer
Promote awareness and proactive care with this “Early Detection and Prevention of Breast Cancer” slide. Designed with an impactful visual of a female silhouette and icon-based health markers, it’s ideal for medical presentations, awareness campaigns, and corporate wellness programs. The infographic layout clearly communicates key statistics, risk factors, or steps for prevention. Fully editable in PowerPoint, Keynote, and Google Slides.


6 diapositivas
Scalable Data Systems and Analytics Presentation
Break down your cloud data architecture with clarity and flow using this visual diagram template. It helps illustrate how your scalable data systems interact—from ingestion to processing and analytics. Perfect for IT teams and tech presentations. Easily editable and compatible with PowerPoint, Keynote, and Google Slides.


21 diapositivas
Solara Business Strategy Presentation
Craft a winning plan with this comprehensive business strategy presentation! It covers essential sections like market analysis, SWOT, strategic initiatives, and performance metrics, helping you align goals and opportunities. Perfect for executive meetings or stakeholder reviews, this template ensures seamless collaboration. Fully compatible with PowerPoint, Keynote, and Google Slides.


7 diapositivas
Objective Infographic Presentation Template
Our Objective Infographic template is designed to visually highlight the key points of a business plan and help you get your message across. With this template's simple layout and bold illustration, you can convey the most important parts of your plan in a way that is straightforward and compelling. This infographic template has been created to help you illustrate the key goal of your project. A clear and attractive infographic, this eye-catching template can be used to create interesting informative content. This will captivate your audience and keep them interested in what you have to say.


4 diapositivas
Current Project Health and Status Report Presentation
Track progress with clarity using the Current Project Health and Status Report presentation slide. Featuring a modern clipboard layout with checkboxes and project tools like a pencil, magnifier, and ruler, this slide is perfect for highlighting task completion, pending issues, and project milestones. Ideal for weekly updates, stakeholder reviews, or status dashboards. Fully editable in PowerPoint, Keynote, and Google Slides.


6 diapositivas
Business Competitive Analysis Presentation
Evaluate your market position with the Business Competitive Analysis Presentation. This structured template provides a clear side-by-side comparison of key business factors like price, quality, features, speed, and service against competitors. Ideal for strategy planning, business development, and market research, it features customizable colors, text, and layouts. Compatible with PowerPoint, Keynote, and Google Slides for seamless editing and presentation.


6 diapositivas
Revenue Projection and Expense Planning
Bring your numbers to life with this clear, visually-driven layout that helps you compare revenue projections and expense plans with ease. This presentation template uses dynamic bar charts to illustrate financial trends over time, making complex data easy to interpret for stakeholders. Fully compatible with PowerPoint, Keynote, and Google Slides.


5 diapositivas
Diabetes Treatments & Symptoms Infographics
Diabetes is a chronic medical condition that affects how the body processes glucose in the blood. There are three main types of diabetes: type 1 diabetes, type 2 diabetes, and gestational diabetes. These infographic templates are comprehensive and visually appealing tools designed to educate and create awareness about diabetes symptoms and treatment options. With its attractive design, concise information, and visually appealing graphics, this template will help individuals understand the importance of diabetes management and make informed decisions regarding their health. This template is completely customizable and compatible with Powerpoint, Keynote, and Google Slides.


7 diapositivas
Stakeholder Strategy Infographic
Empower your organization's approach to its stakeholders with our stakeholder strategy infographic. Colored in a mix of vibrant orange, crisp white, and bold red, this infographic not only informs but also captures attention. Ideal for business strategists, project managers, and team leaders, it visually dissects the intricate layers of stakeholder engagement and strategy. Its design includes specialized graphics, tailored icons, and strategic image placeholders to guide your storytelling. Whether you're presenting in PowerPoint, Keynote, or Google Slides, this template is your key to a well-orchestrated stakeholder communication.


5 diapositivas
4-Level Hierarchy Tree Presentation
Bring your ideas to life with a smooth, layered flow that feels modern and engaging from the very first glance. This presentation helps you break down complex structures into four clear levels, making information easy to follow and visually compelling. Perfect for explaining processes, roles, or systems with clarity. Fully compatible with PowerPoint, Keynote, and Google Slides.


5 diapositivas
Business Model Canvas and Strategy Presentation
Visualize your entire business model in one clean, structured slide. This presentation template breaks down key areas—Partners, Activities, Value Propositions, Customers, Channels, Costs, and Revenue—into a color-coded layout for strategic clarity. Perfect for startups, consultants, or internal strategy teams. Fully editable in PowerPoint, Keynote, and Google Slides.