


Características


¿Tienes alguna pregunta?
Recomendar


6 diapositivas
Marketing Customer Profile Infographics
Our Marketing Customer Profile infographic is a strategic tool crafted for use in Powerpoint, Keynote, and Google Slides. It is ideal for marketers, sales teams, and business strategists looking to present a comprehensive view of customer demographics, preferences, and behaviors. This infographic is designed to segment and illustrate various aspects of customer profiles, helping to paint a detailed picture of target markets. It includes elements such as age range, gender distribution, income levels, purchasing habits, and preferred communication channels, among others. The layout is structured to guide the audience through the data in a logical sequence, ensuring a thorough understanding of the customer base. Incorporating this infographic into your marketing presentations will empower your team to tailor strategies that resonate with your audience, backed by data-driven insights. Whether you’re crafting personalized marketing campaigns, developing new products, or exploring new market opportunities, this infographic will serve as an essential visual aid to support your objectives. Use it to bring clarity and focus to discussions about your customer profiles and market segmentation strategies.


6 diapositivas
Project Timeline Infographic Presentation
Streamline your workflow with this Project Timeline Infographic template. Perfect for visualizing milestones, tracking progress, and organizing tasks, this design is fully editable to suit any project needs. Adjust colors, icons, and text effortlessly. Compatible with PowerPoint, Keynote, and Google Slides for smooth presentations and collaboration.


5 diapositivas
Digital Marketing Agency Infographics
Elevate your agency's presentation game with our digital marketing agency infographics template. Designed in a vibrant palette of pink, white, and blue, this vertical infographic is a powerhouse tool tailored for marketing professionals, digital agencies, and consultants aiming to showcase their services, success stories, and unique strategies effectively. The template is a visual feast, featuring compelling graphics, diverse icons, and designated spaces for images that capture the essence of digital trends and marketing breakthroughs. Its intuitive design aids in breaking down complex information, ensuring your agency's innovative solutions are client-ready.


5 diapositivas
5-Level Risk Management Plan Presentation
Turn complex strategies into clear, visual steps with this sleek layered layout designed for analyzing and mitigating potential risks. Each level helps you outline priorities, assess impact, and communicate safety measures effectively. Fully compatible with PowerPoint, Keynote, and Google Slides, making customization fast, professional, and presentation-ready.


6 diapositivas
Budget Planning Spreadsheet Slide Presentation
Visualize your spending strategy with a clean, circular layout that turns complex financial data into simple, engaging visuals. This modern design helps you outline expenses, track categories, and showcase progress effectively in meetings or reports. Fully editable and compatible with PowerPoint, Keynote, and Google Slides for effortless customization.


10 diapositivas
Logistics and Procurement Supply Chain
Streamline your supply chain narrative with this clean, visual timeline layout. Perfect for operations managers, logistics planners, or procurement leads, this slide breaks down each stage of the supply chain process with color-coded segments and intuitive icons. Fully editable in PowerPoint, Keynote, and Google Slides.


7 diapositivas
Process Flow Chart Infographic
Flowcharts are the best way to get your point across—and this one is no exception. This infographic chart shows the steps that you need to take in order to create a high-energy flow chart. You start with the basic foundation of your chart, then add information about the different parts of it, and finally bring it all together by adding details to each part of the chart. This a great way to organize information, and it makes it easy for your audience to see how things fit together. Compatible with Powerpoint, Keynote, and Google Slides. This templates is fully customizable: you can change colors and fonts as needed, or add your own images to make them unique.


6 diapositivas
Iceberg Business Infographic
Delve beneath the surface with our Iceberg Business Infographic, perfect for Powerpoint, Google Slides, and Keynote. This infographic is designed to illustrate the underlying factors that impact an organization's success. The iceberg metaphor visually represents the concept that only a small part of a company's situation is visible above the surface, while much more is hidden below. The customizable segments can be used to detail various aspects of business operations, risks, and opportunities that are not immediately apparent. By employing this Iceberg Business infographic, you can effectively communicate the complexities of business strategies.


4 diapositivas
Regional Economic Evolution in Asia Map Presentation
Track economic progress across Asia with this regional growth map. Each country is paired with a progress bar for visual comparison of growth indicators. Ideal for data-driven insights, economic reviews, or development updates. Editable in PowerPoint, Keynote, and Google Slides for seamless customization and professional, geography-based presentations.


5 diapositivas
Eco Footprint and Sustainability Presentation
Raise awareness and drive impact with this Eco Footprint and Sustainability Presentation. Featuring a modern footprint visual, this slide is perfect for showcasing key environmental metrics, carbon impact, or green initiatives. Ideal for ESG reports, nonprofit campaigns, or corporate responsibility updates. Compatible with PowerPoint, Keynote, and Google Slides.


6 diapositivas
Strategy Wheel Stocks Infographic
A strategy wheel, also known as a strategic wheel or strategy clock, is a visual tool used in strategic management and marketing to analyze and compare different business strategies based on their market positioning and competitive advantage. This Infographic template visually presents different investment strategies in the stock market, helping investors understand and choose the best approach based on their goals and risk tolerance. Use this template to present various strategic options on a circular diagram, allowing for easy comparison and analysis. In each strategy segment provide a brief description of the key features, goals, and risk level.


20 diapositivas
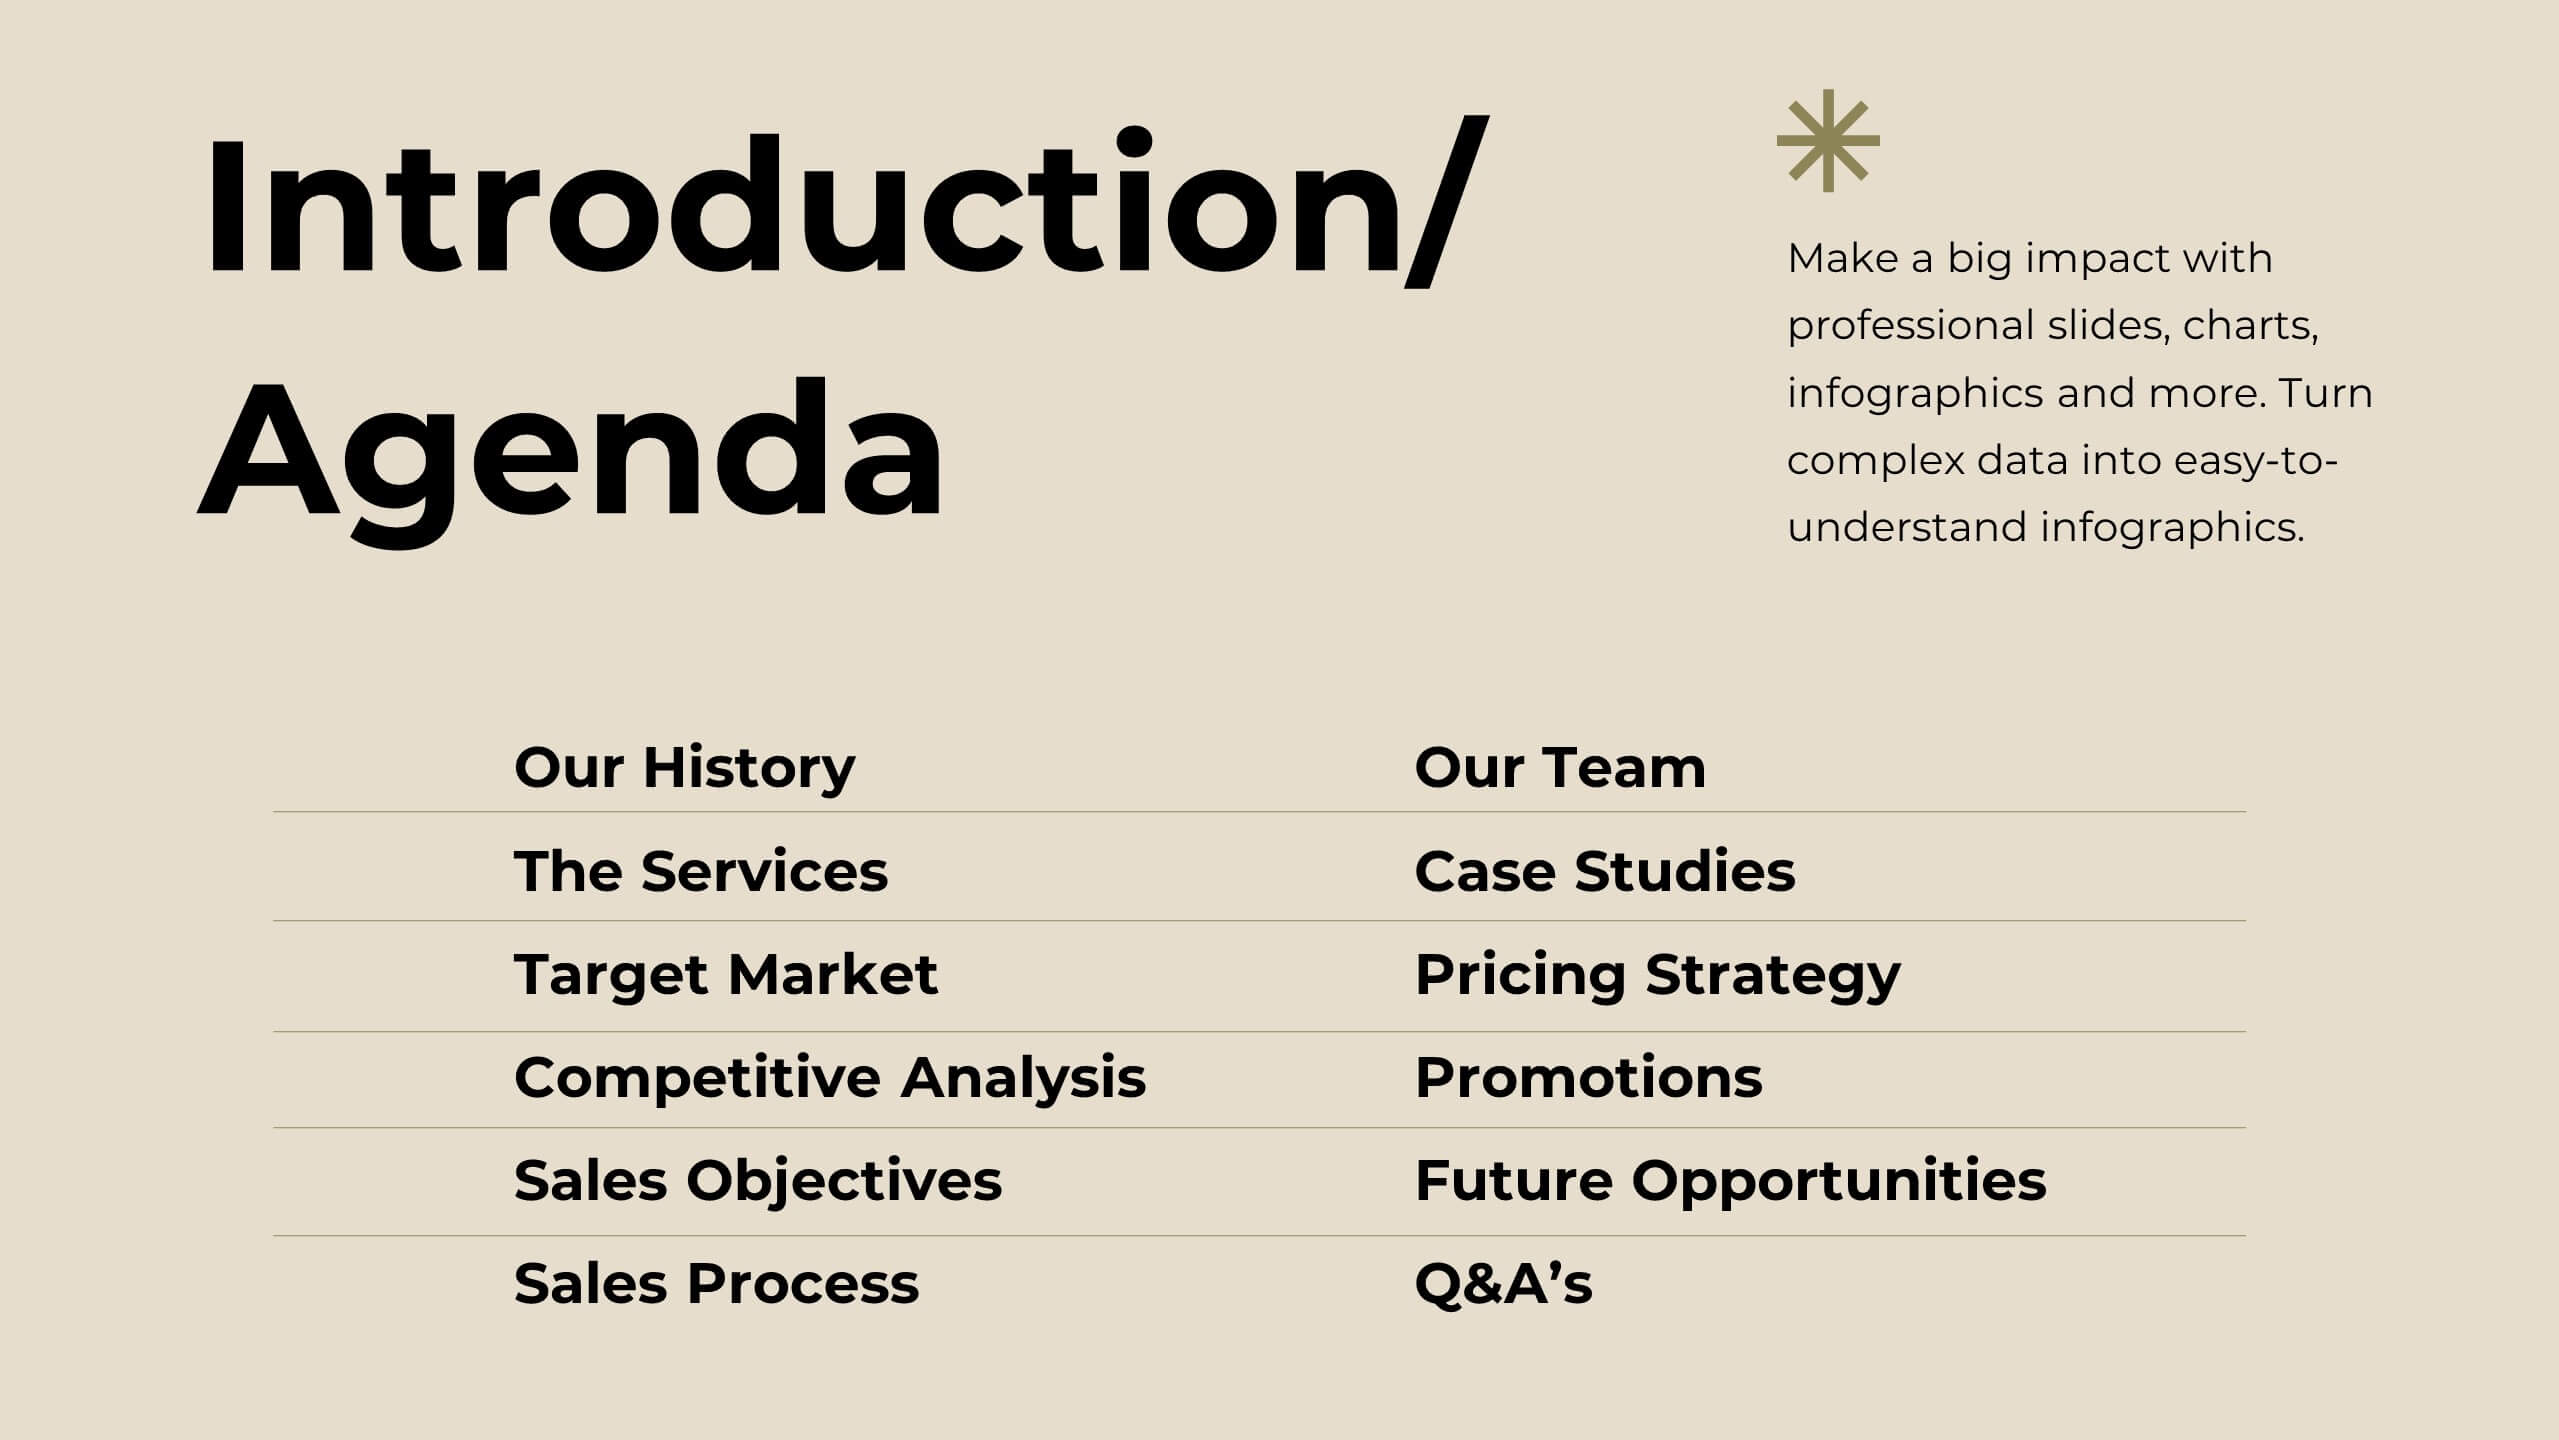
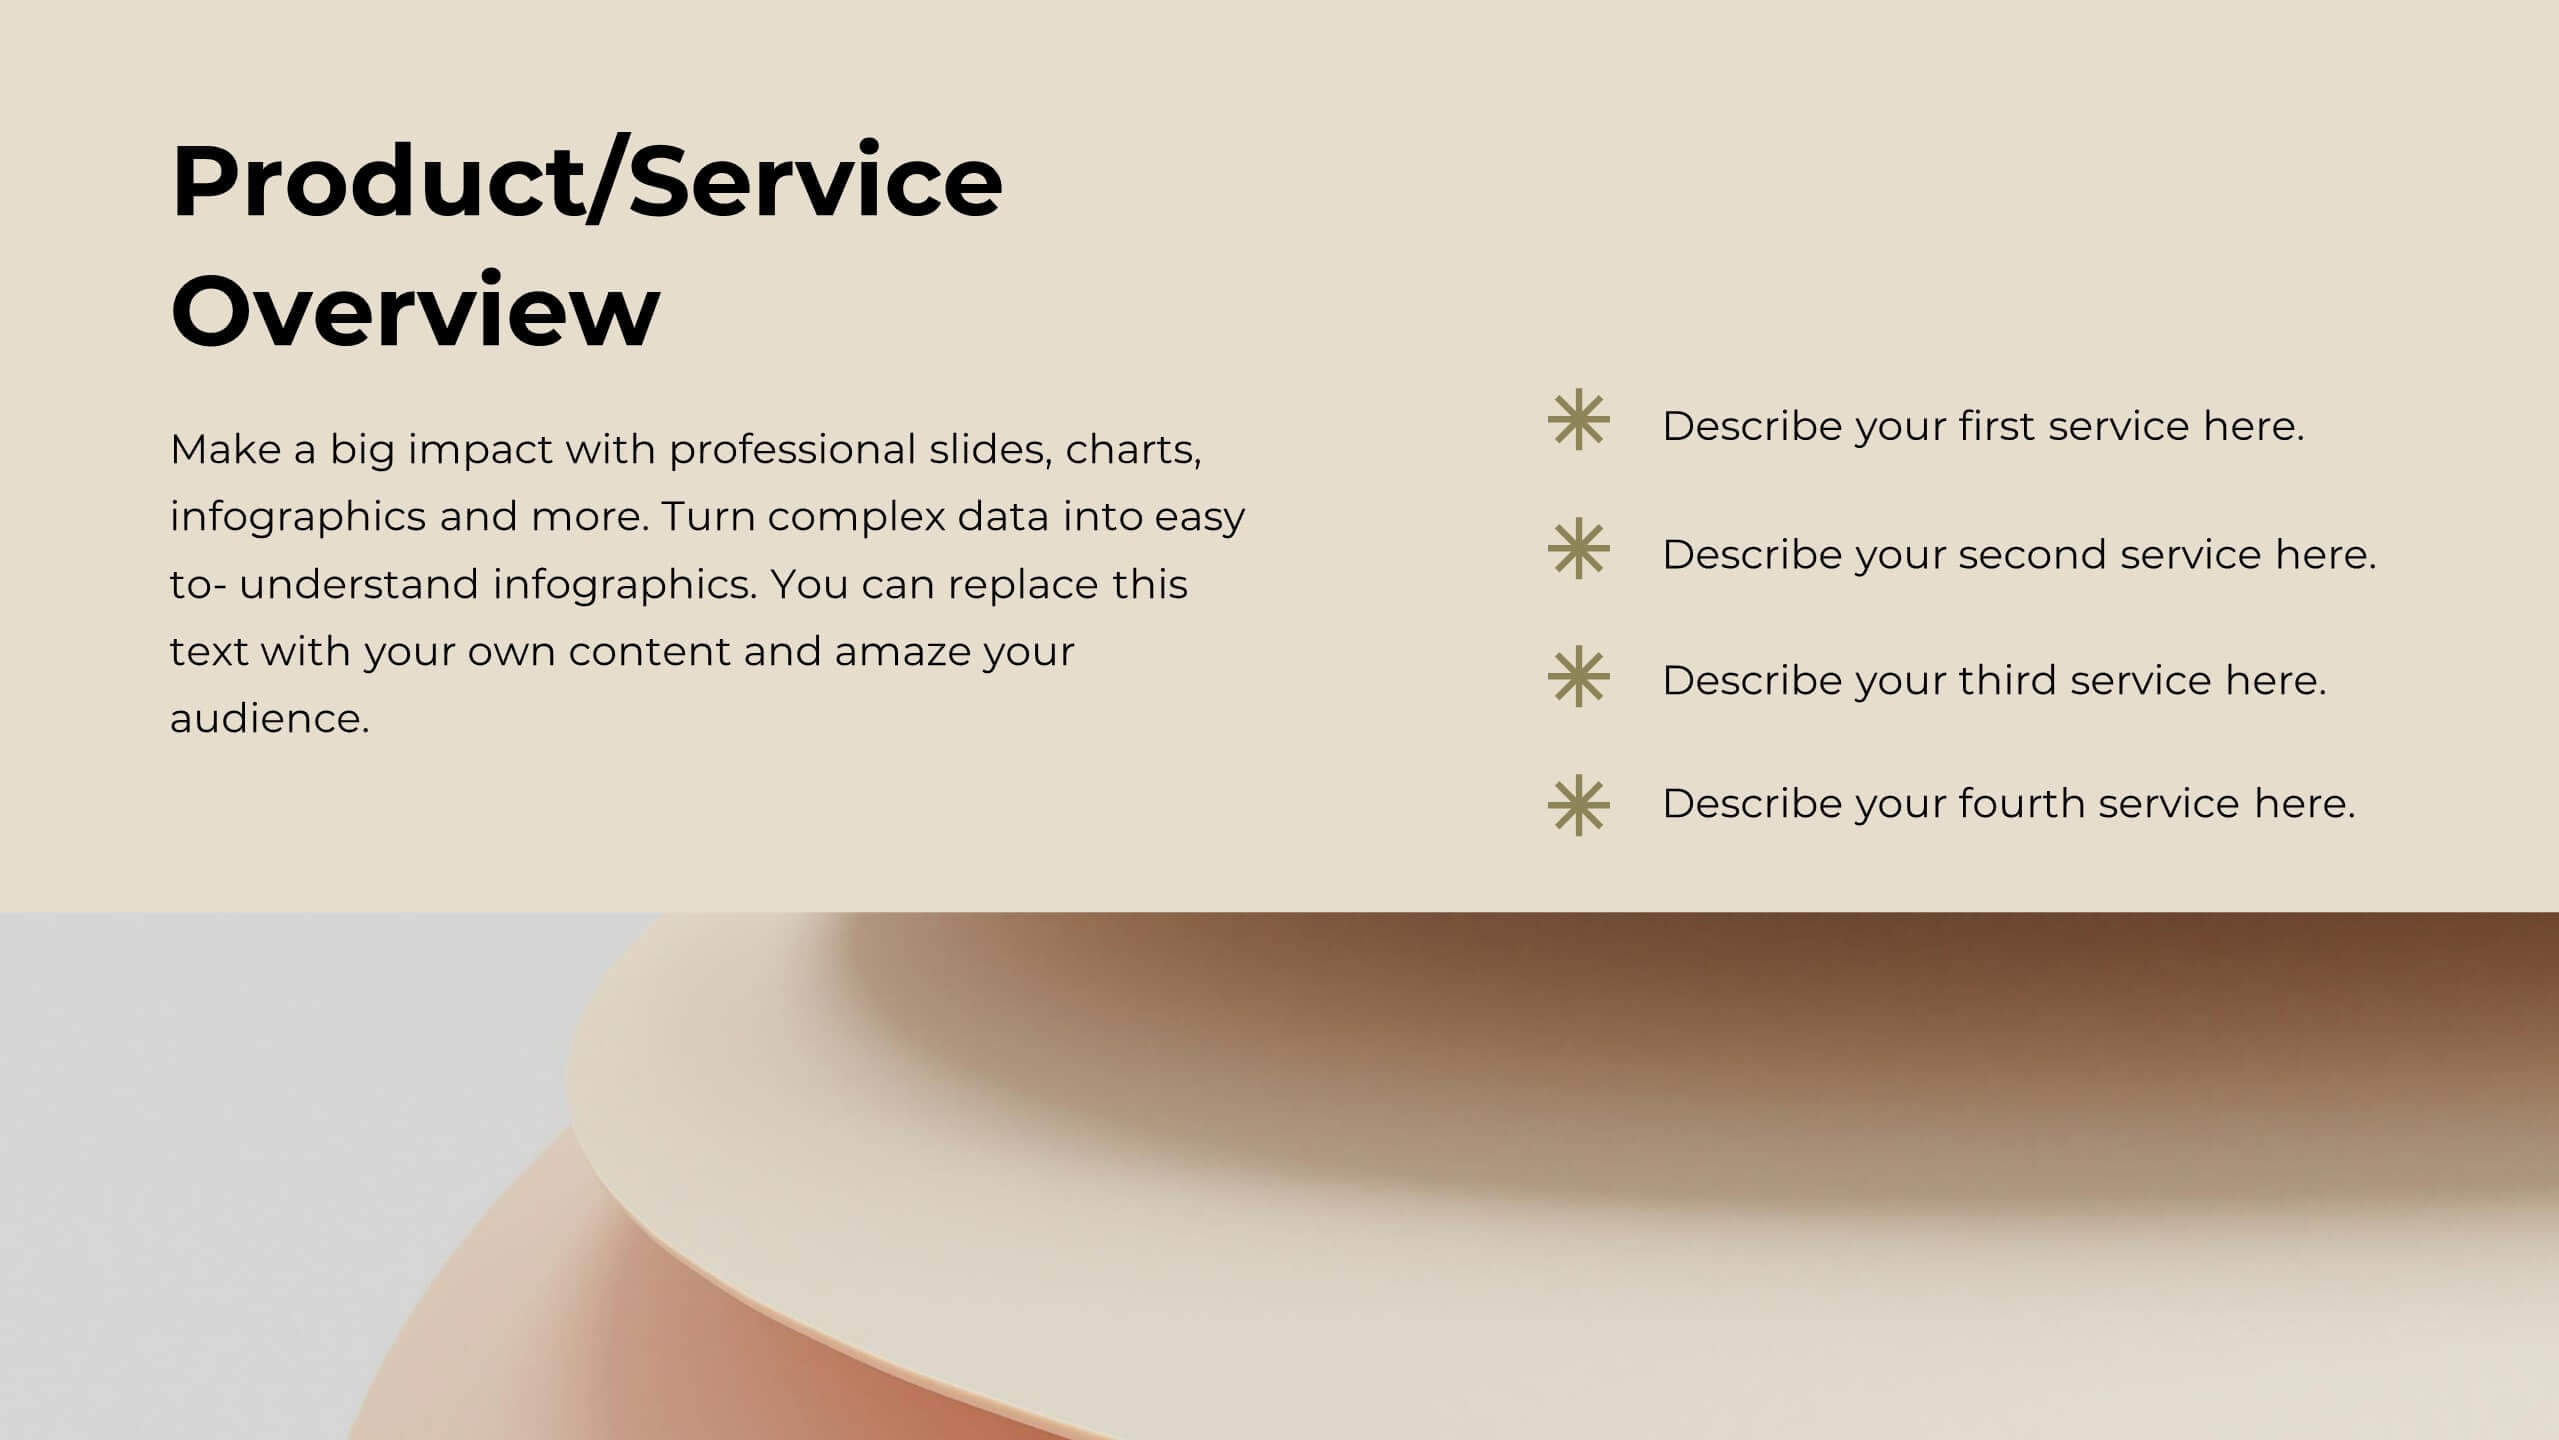
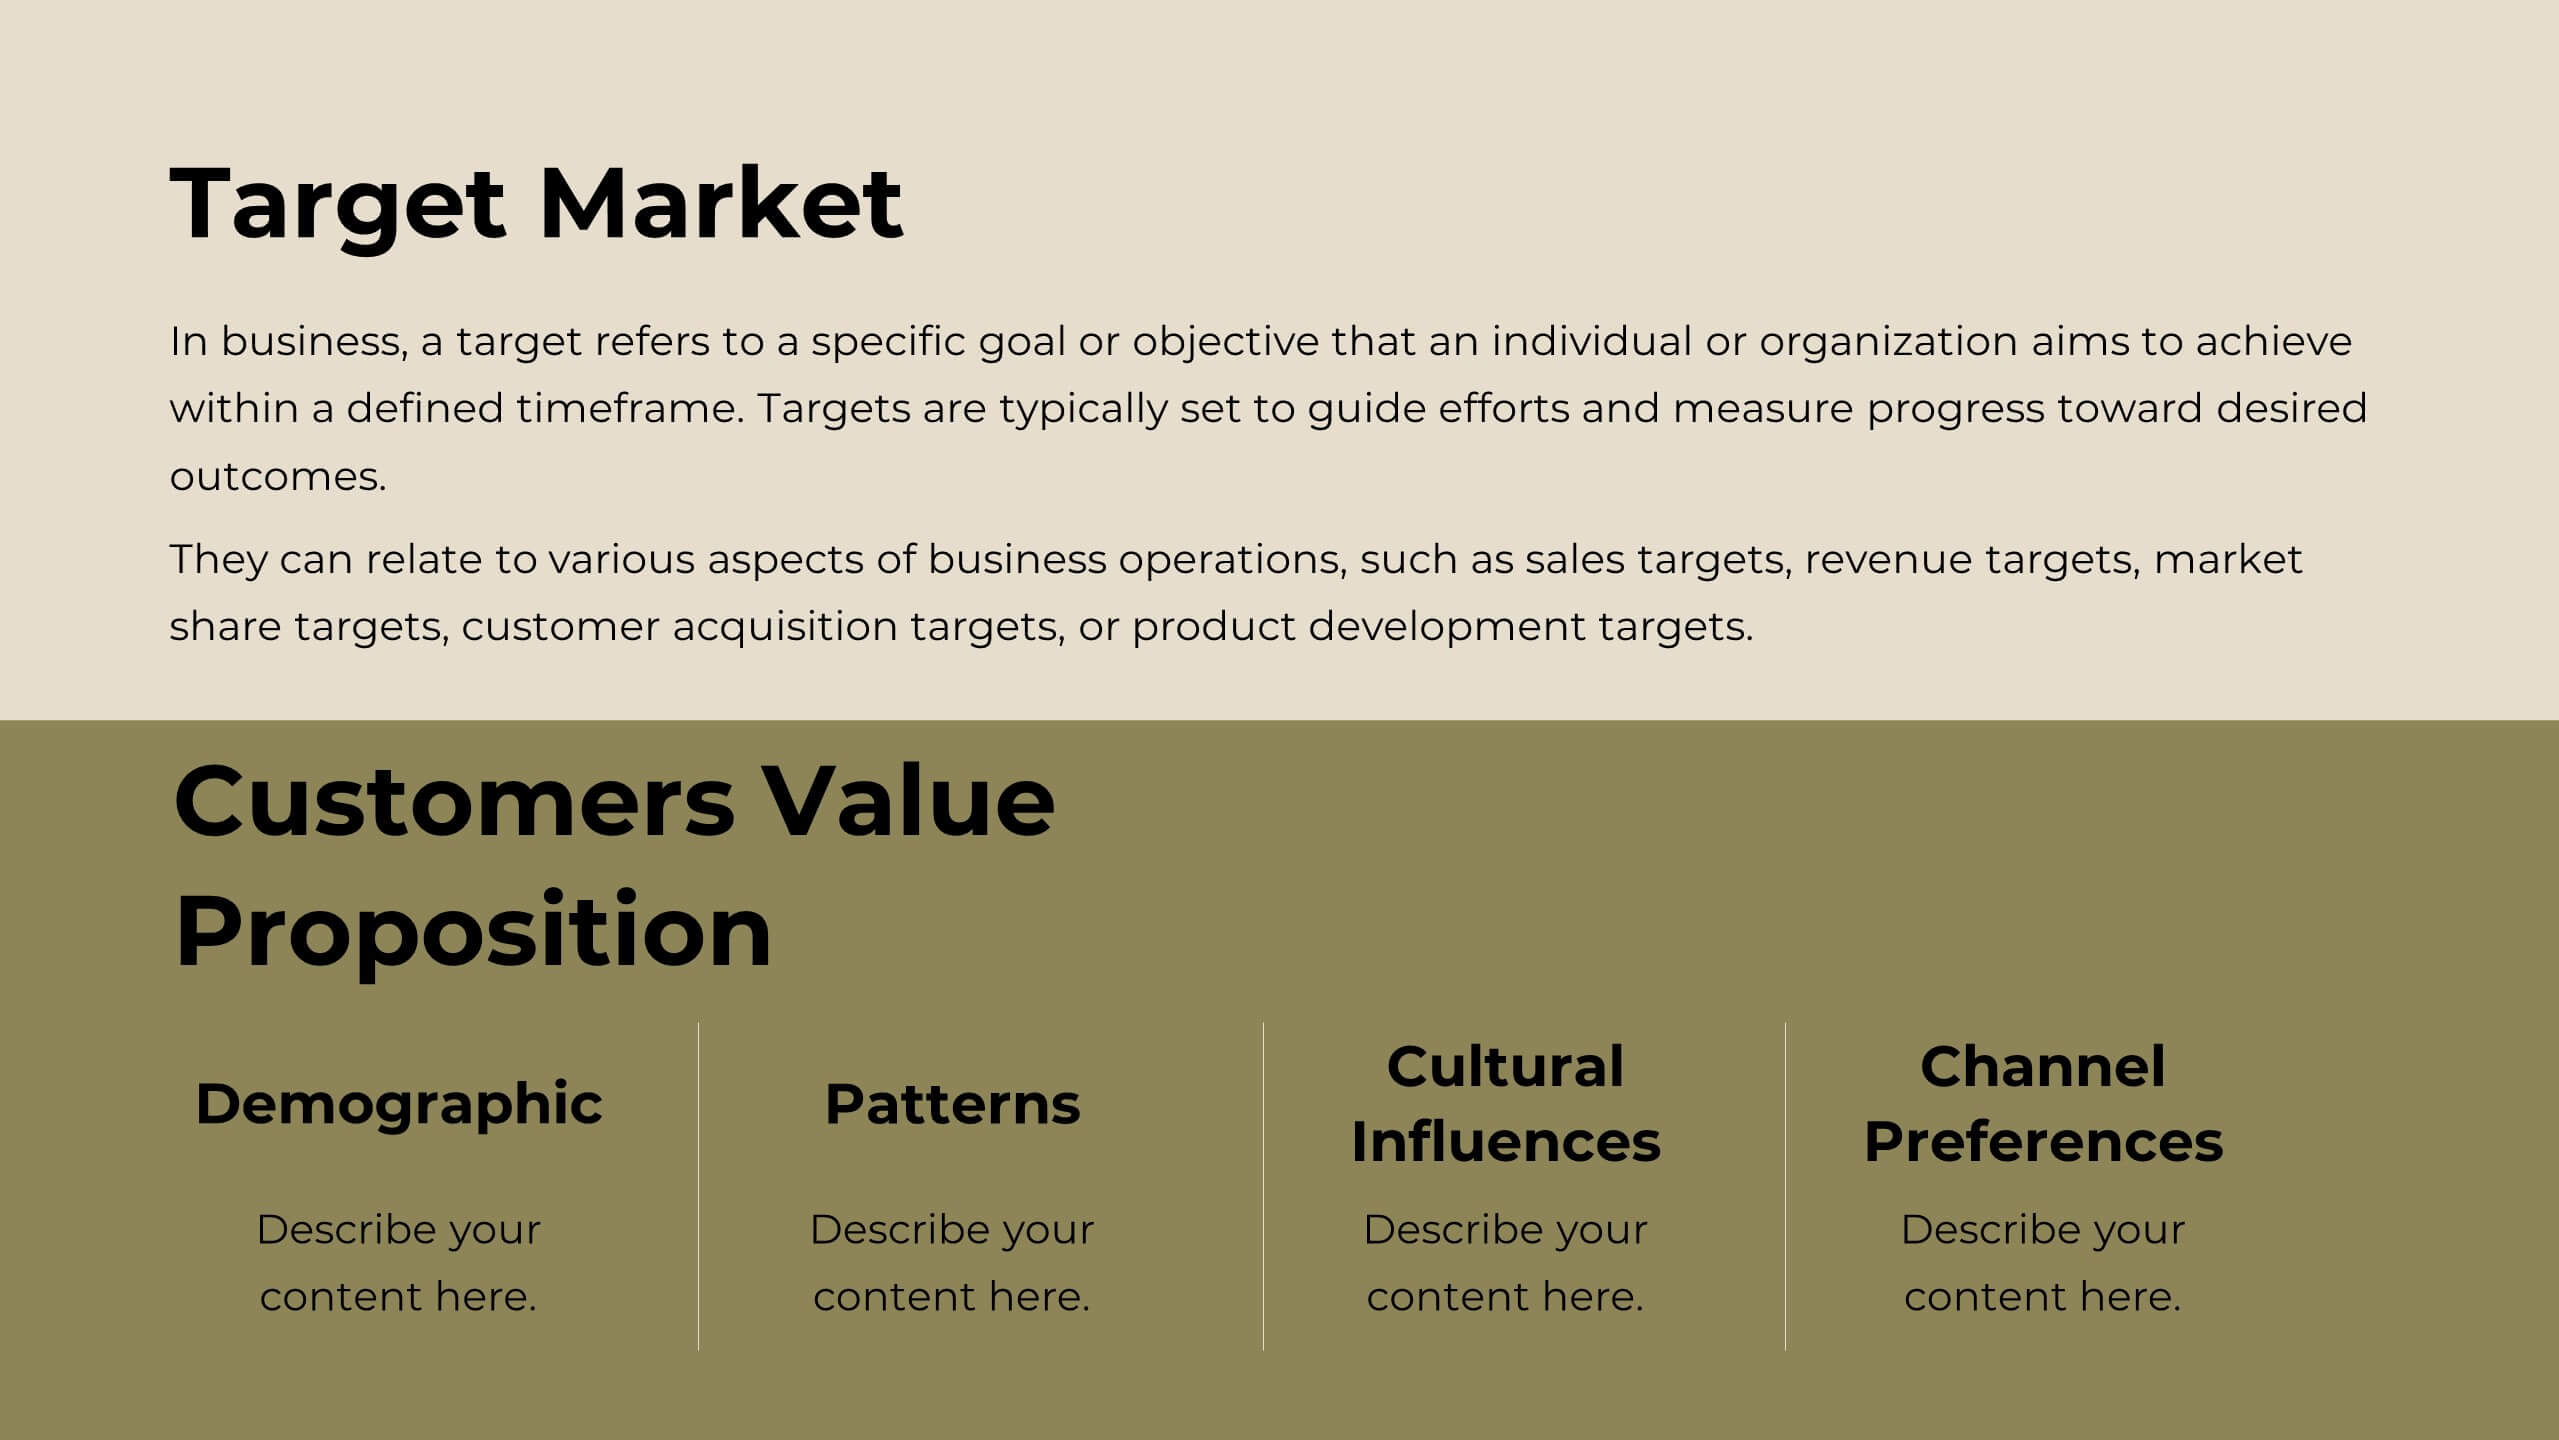
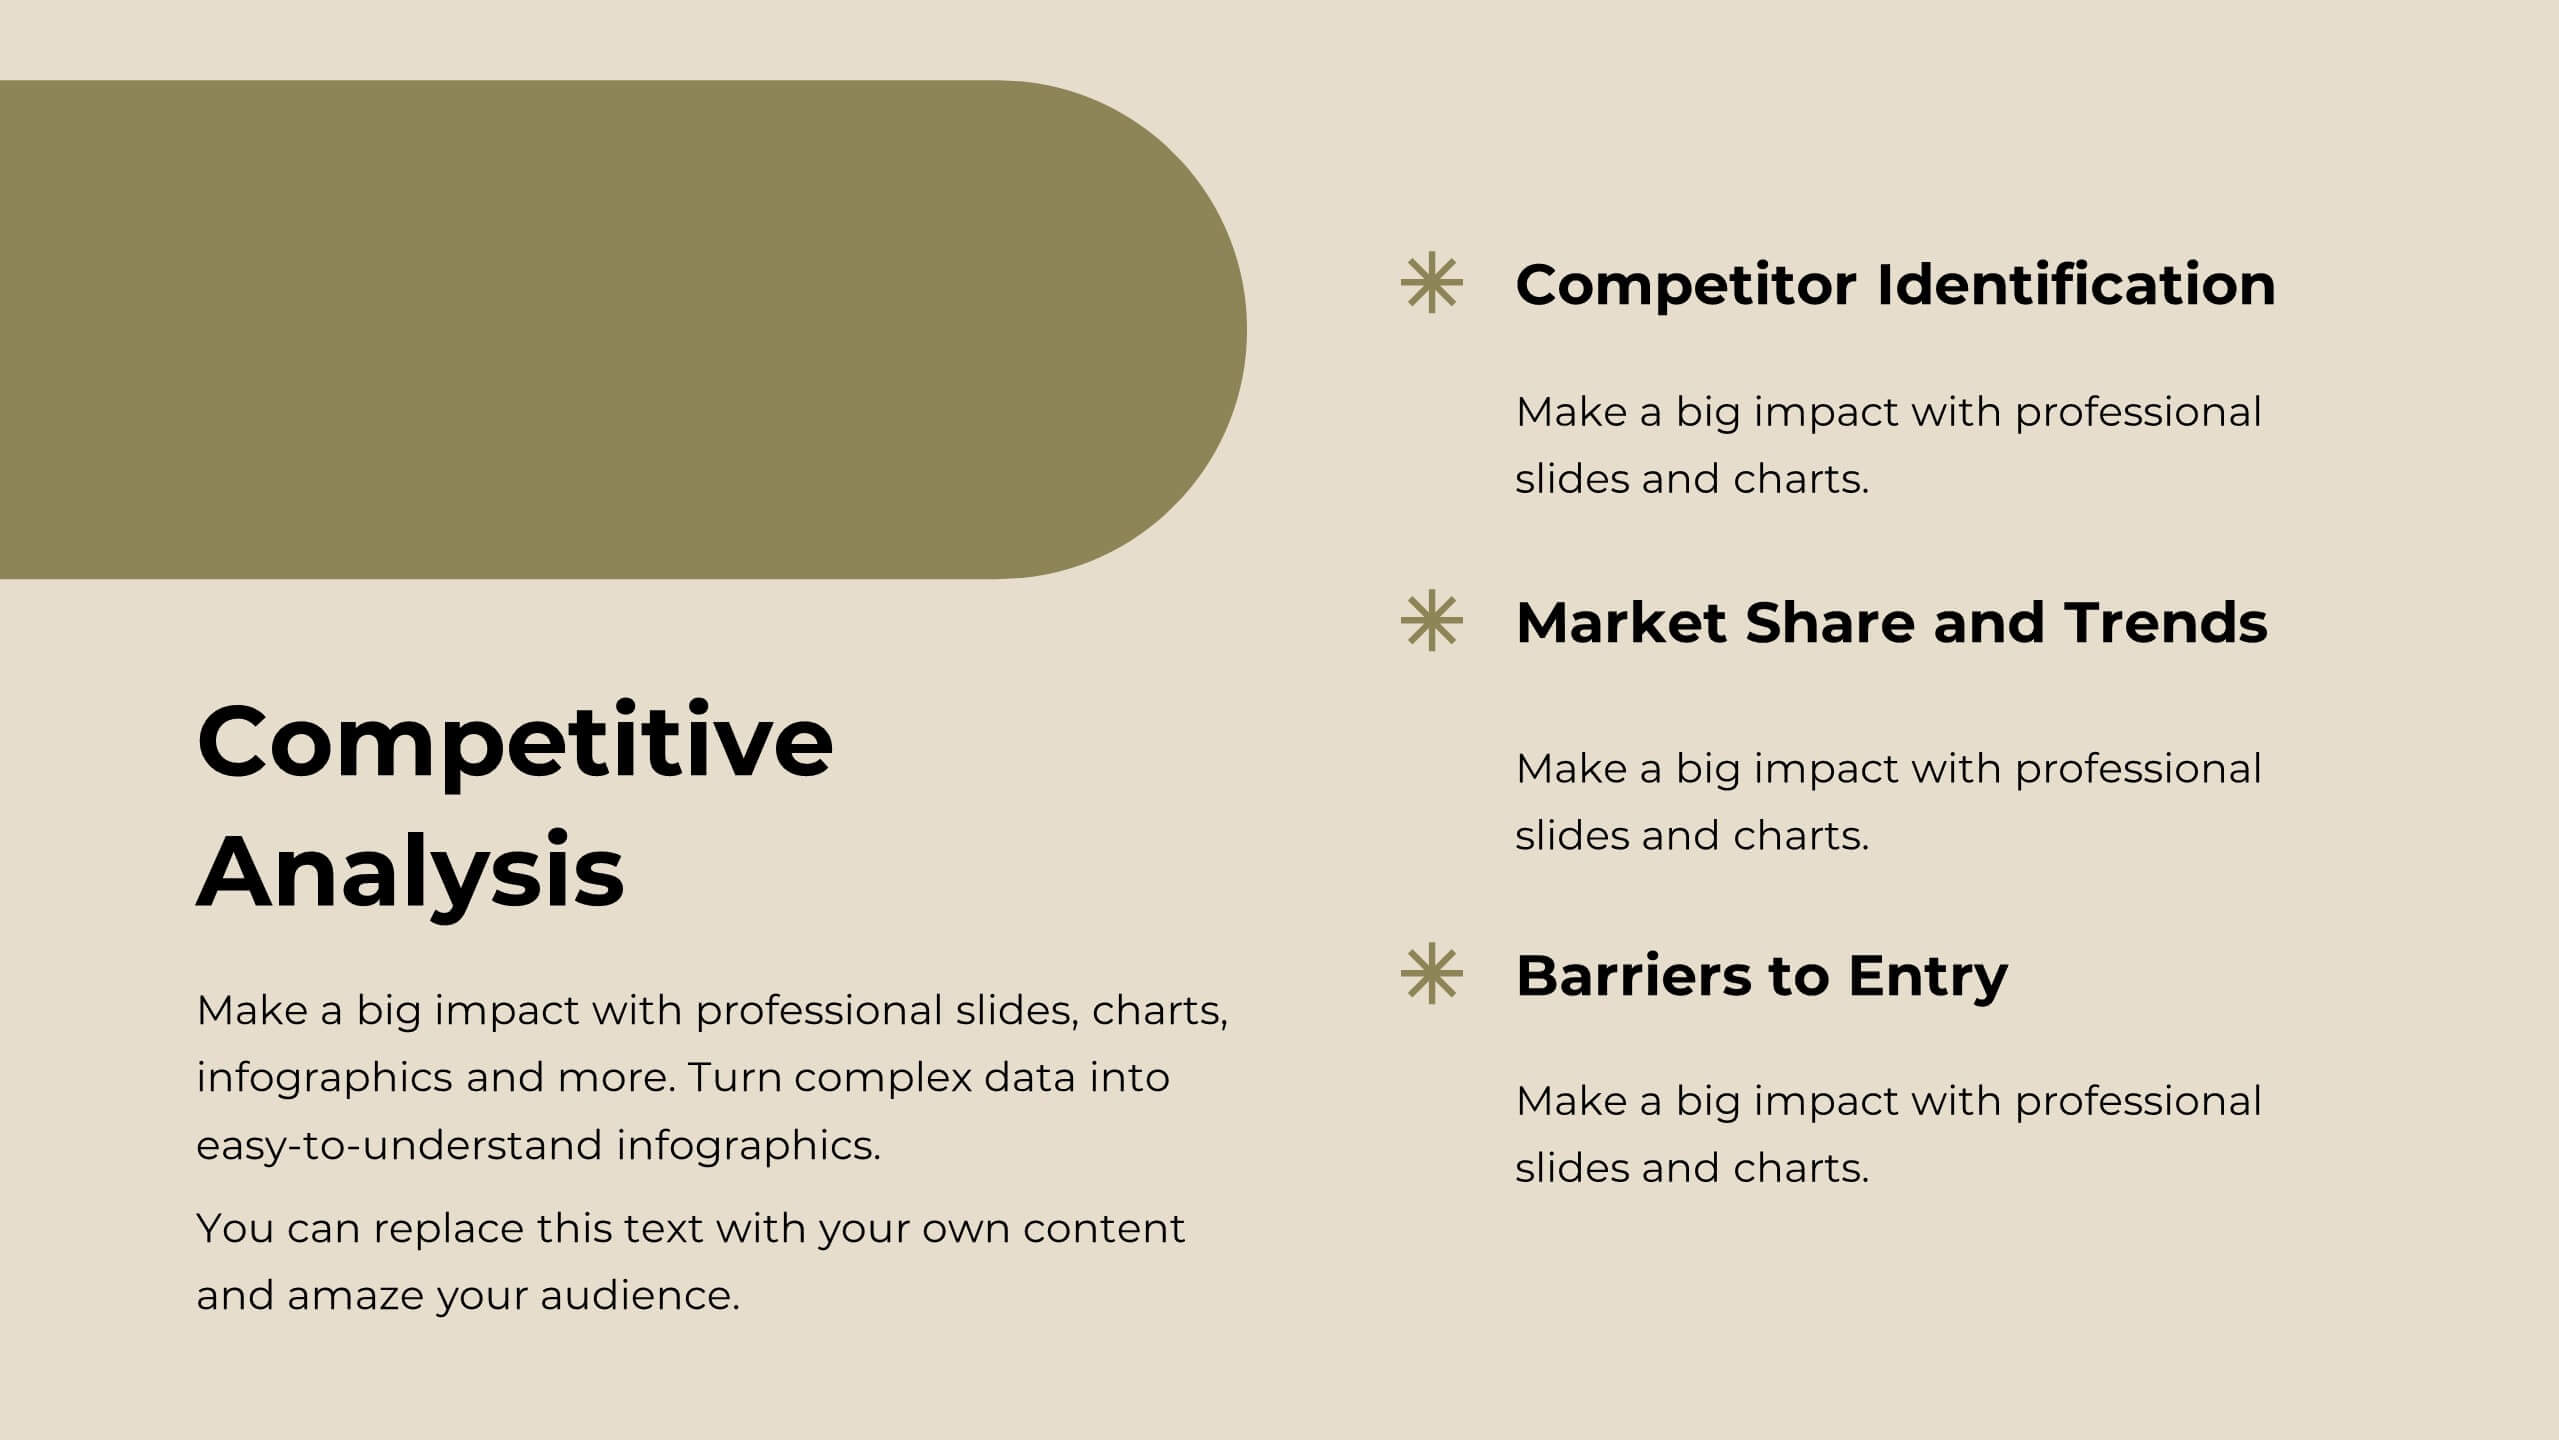
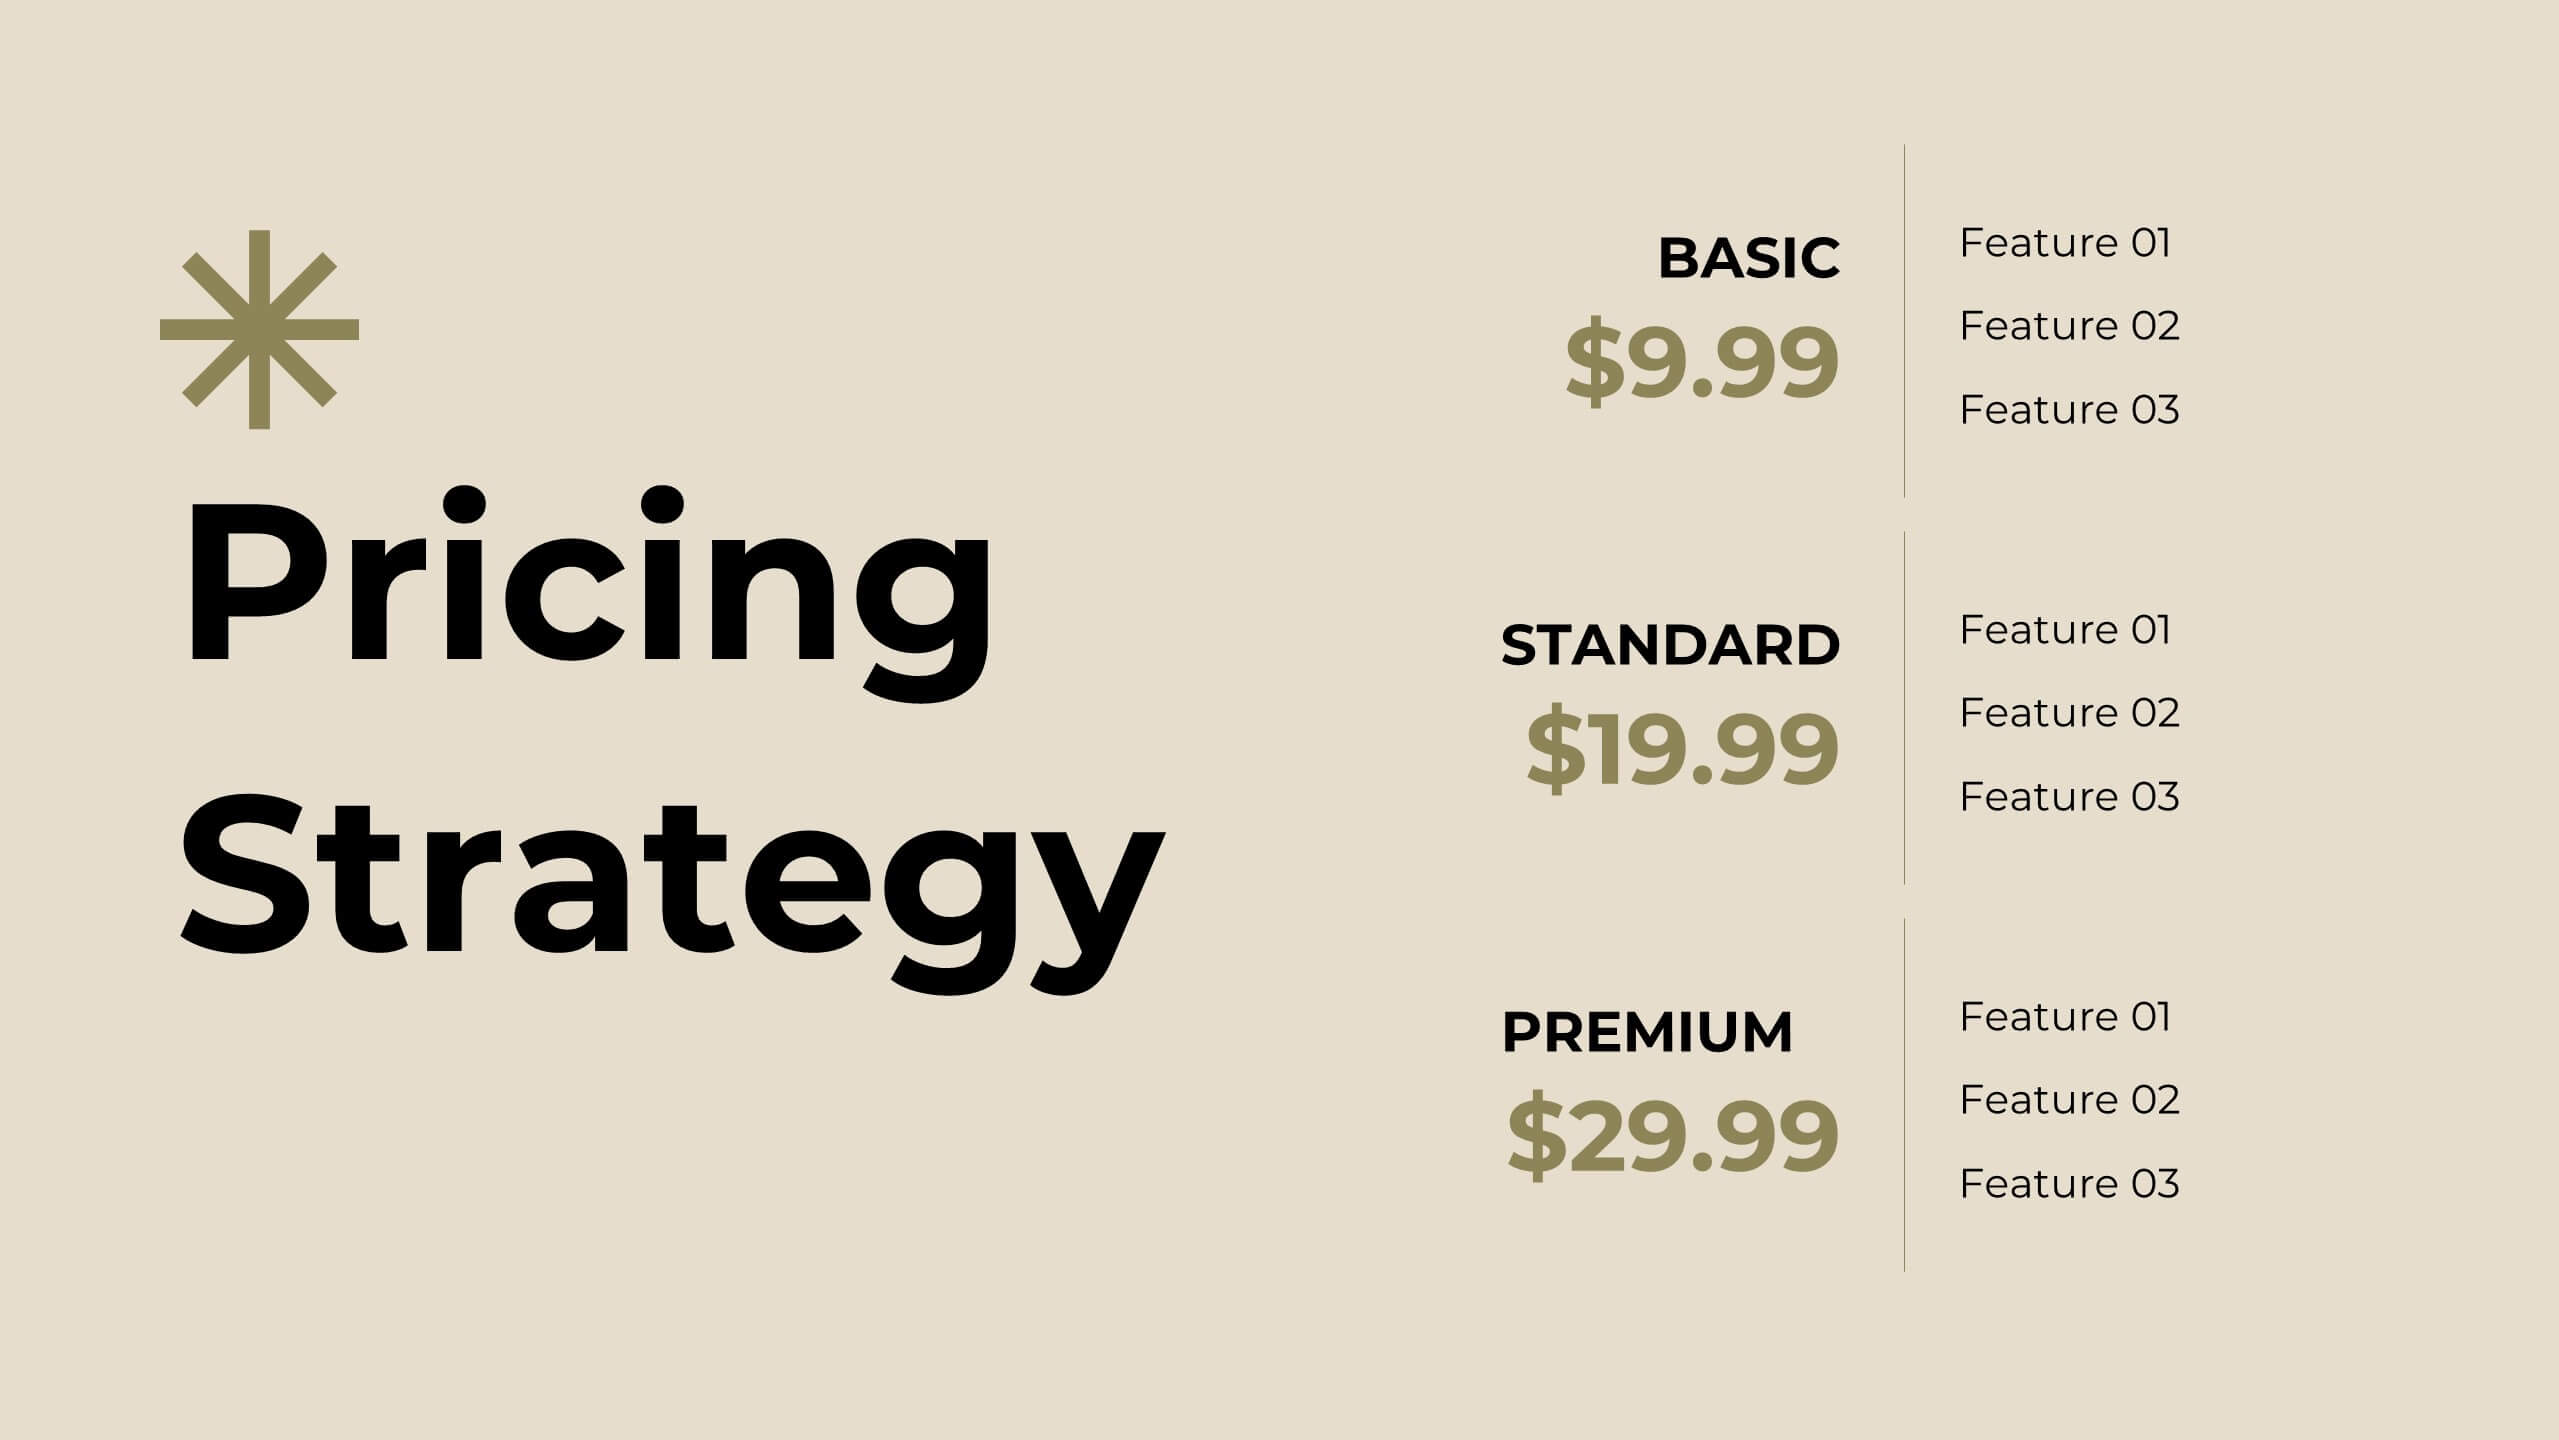
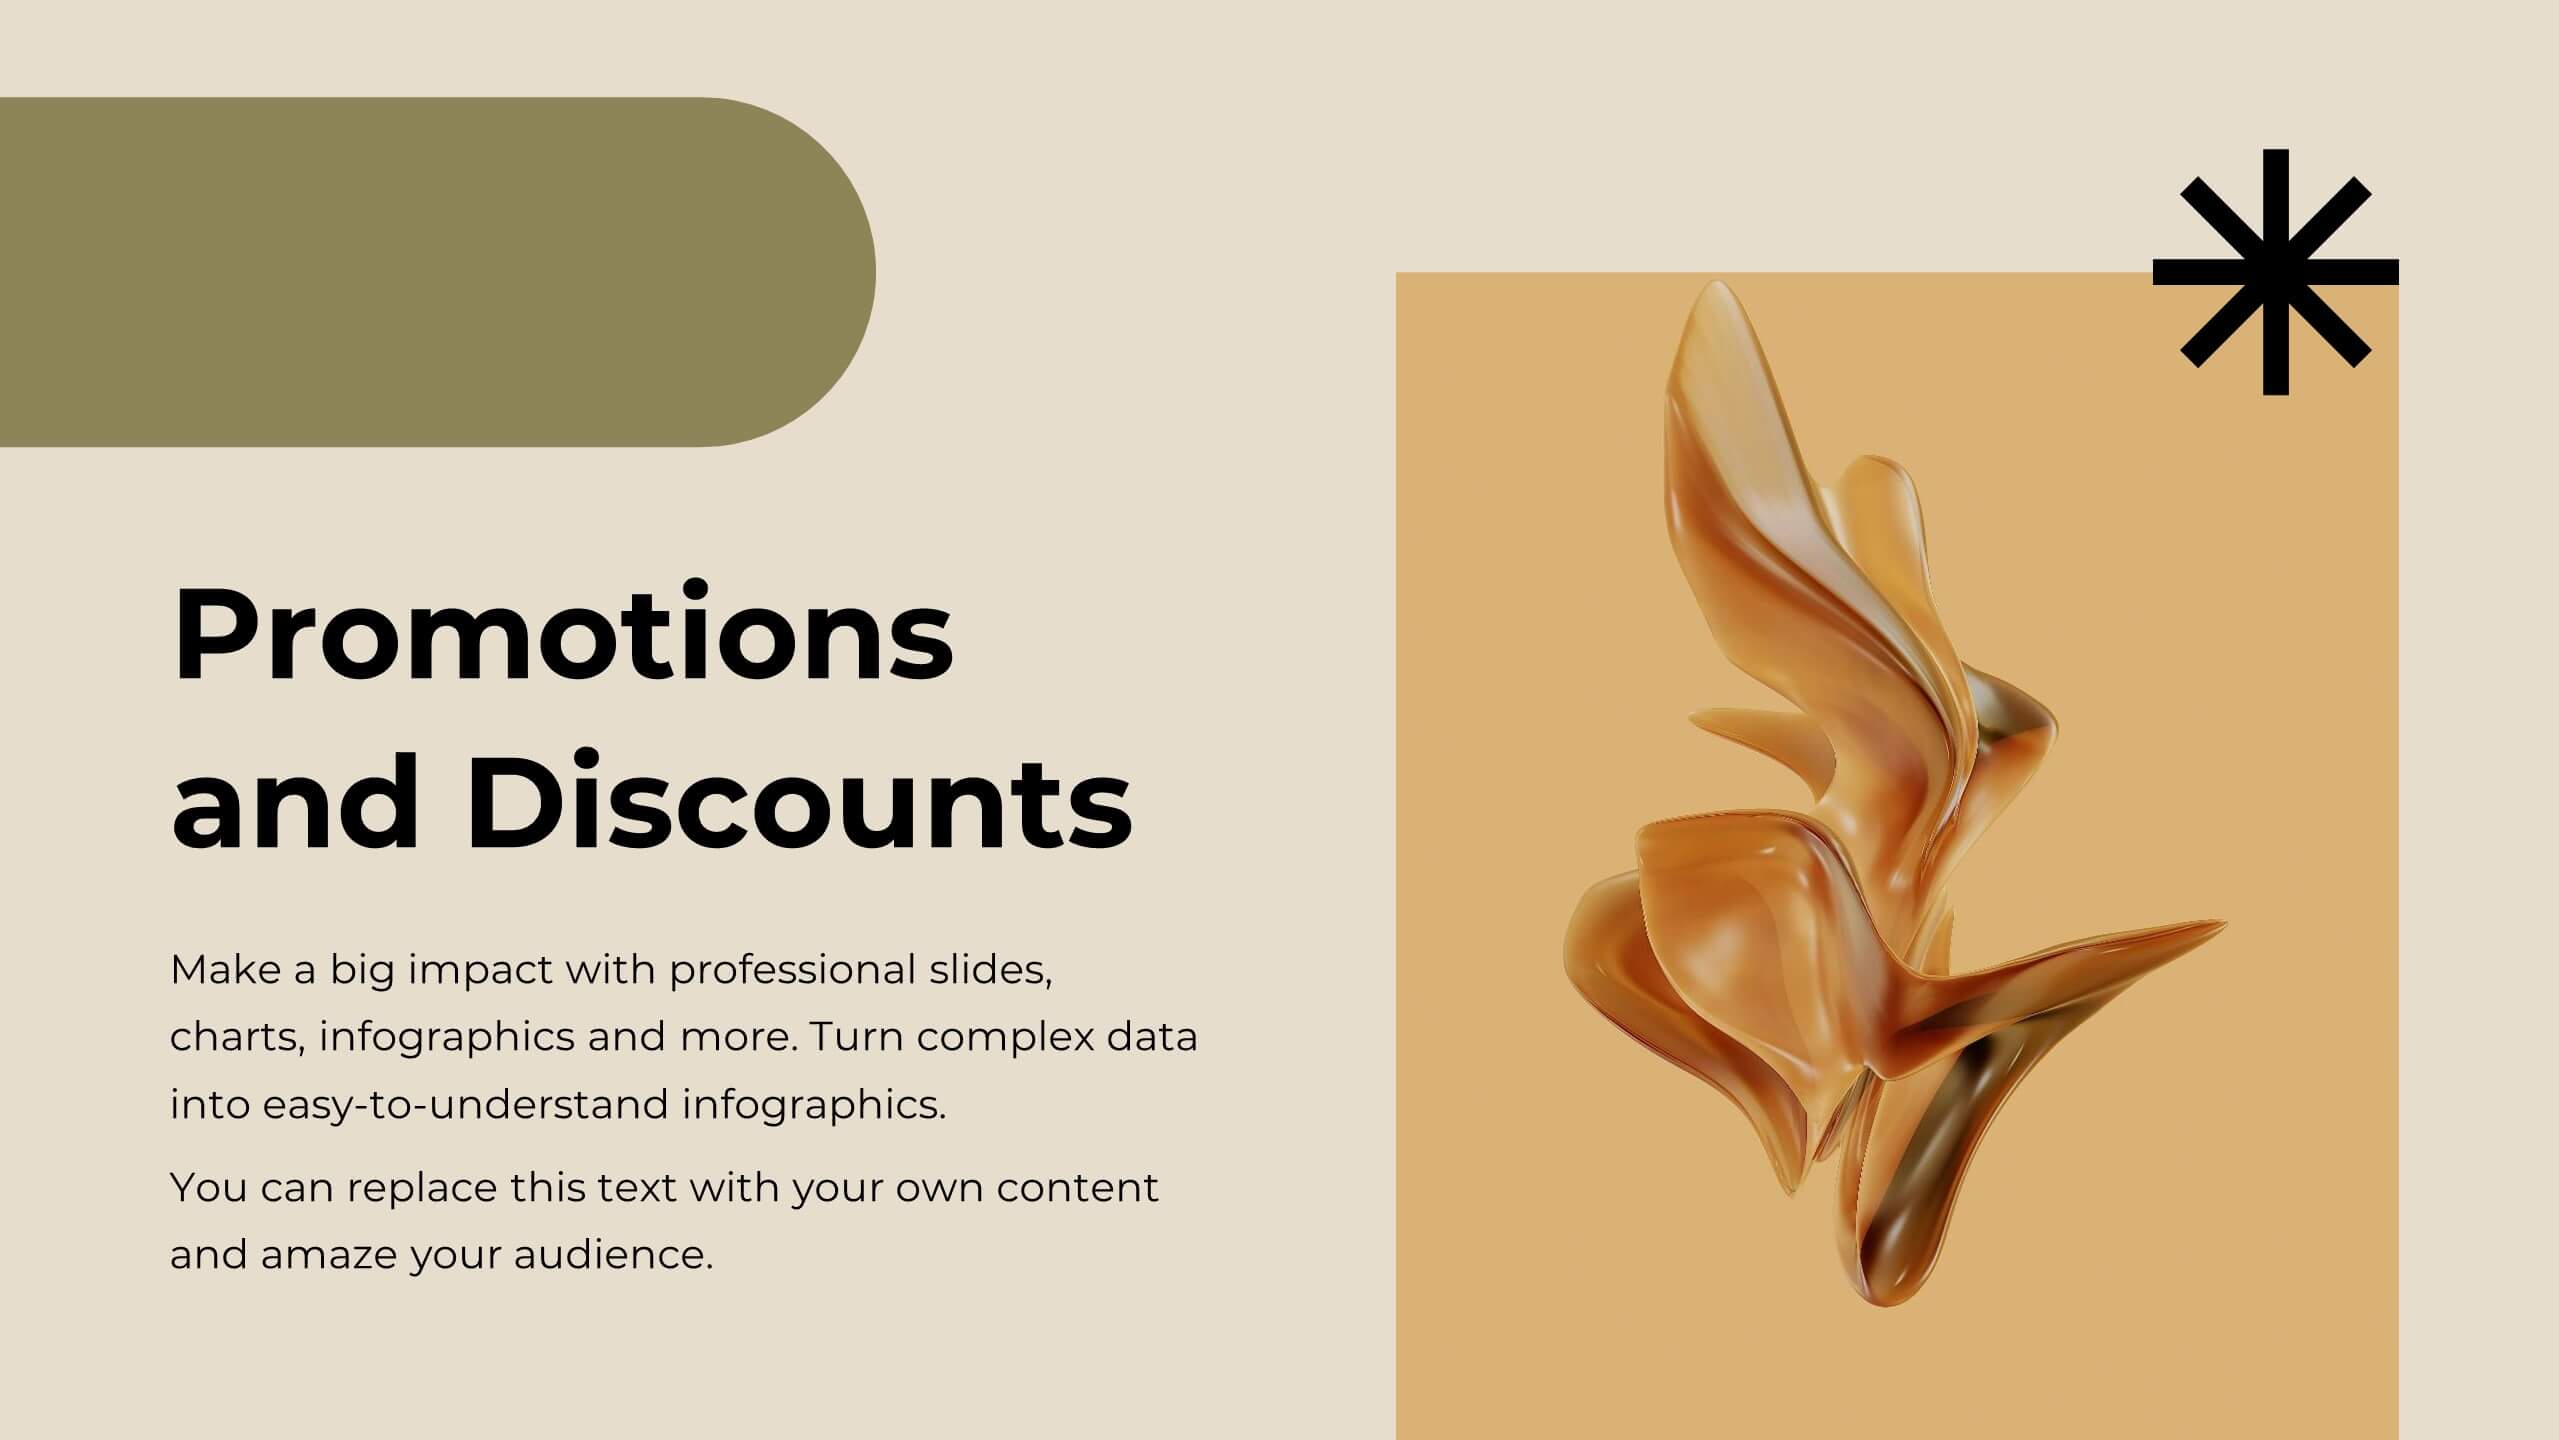
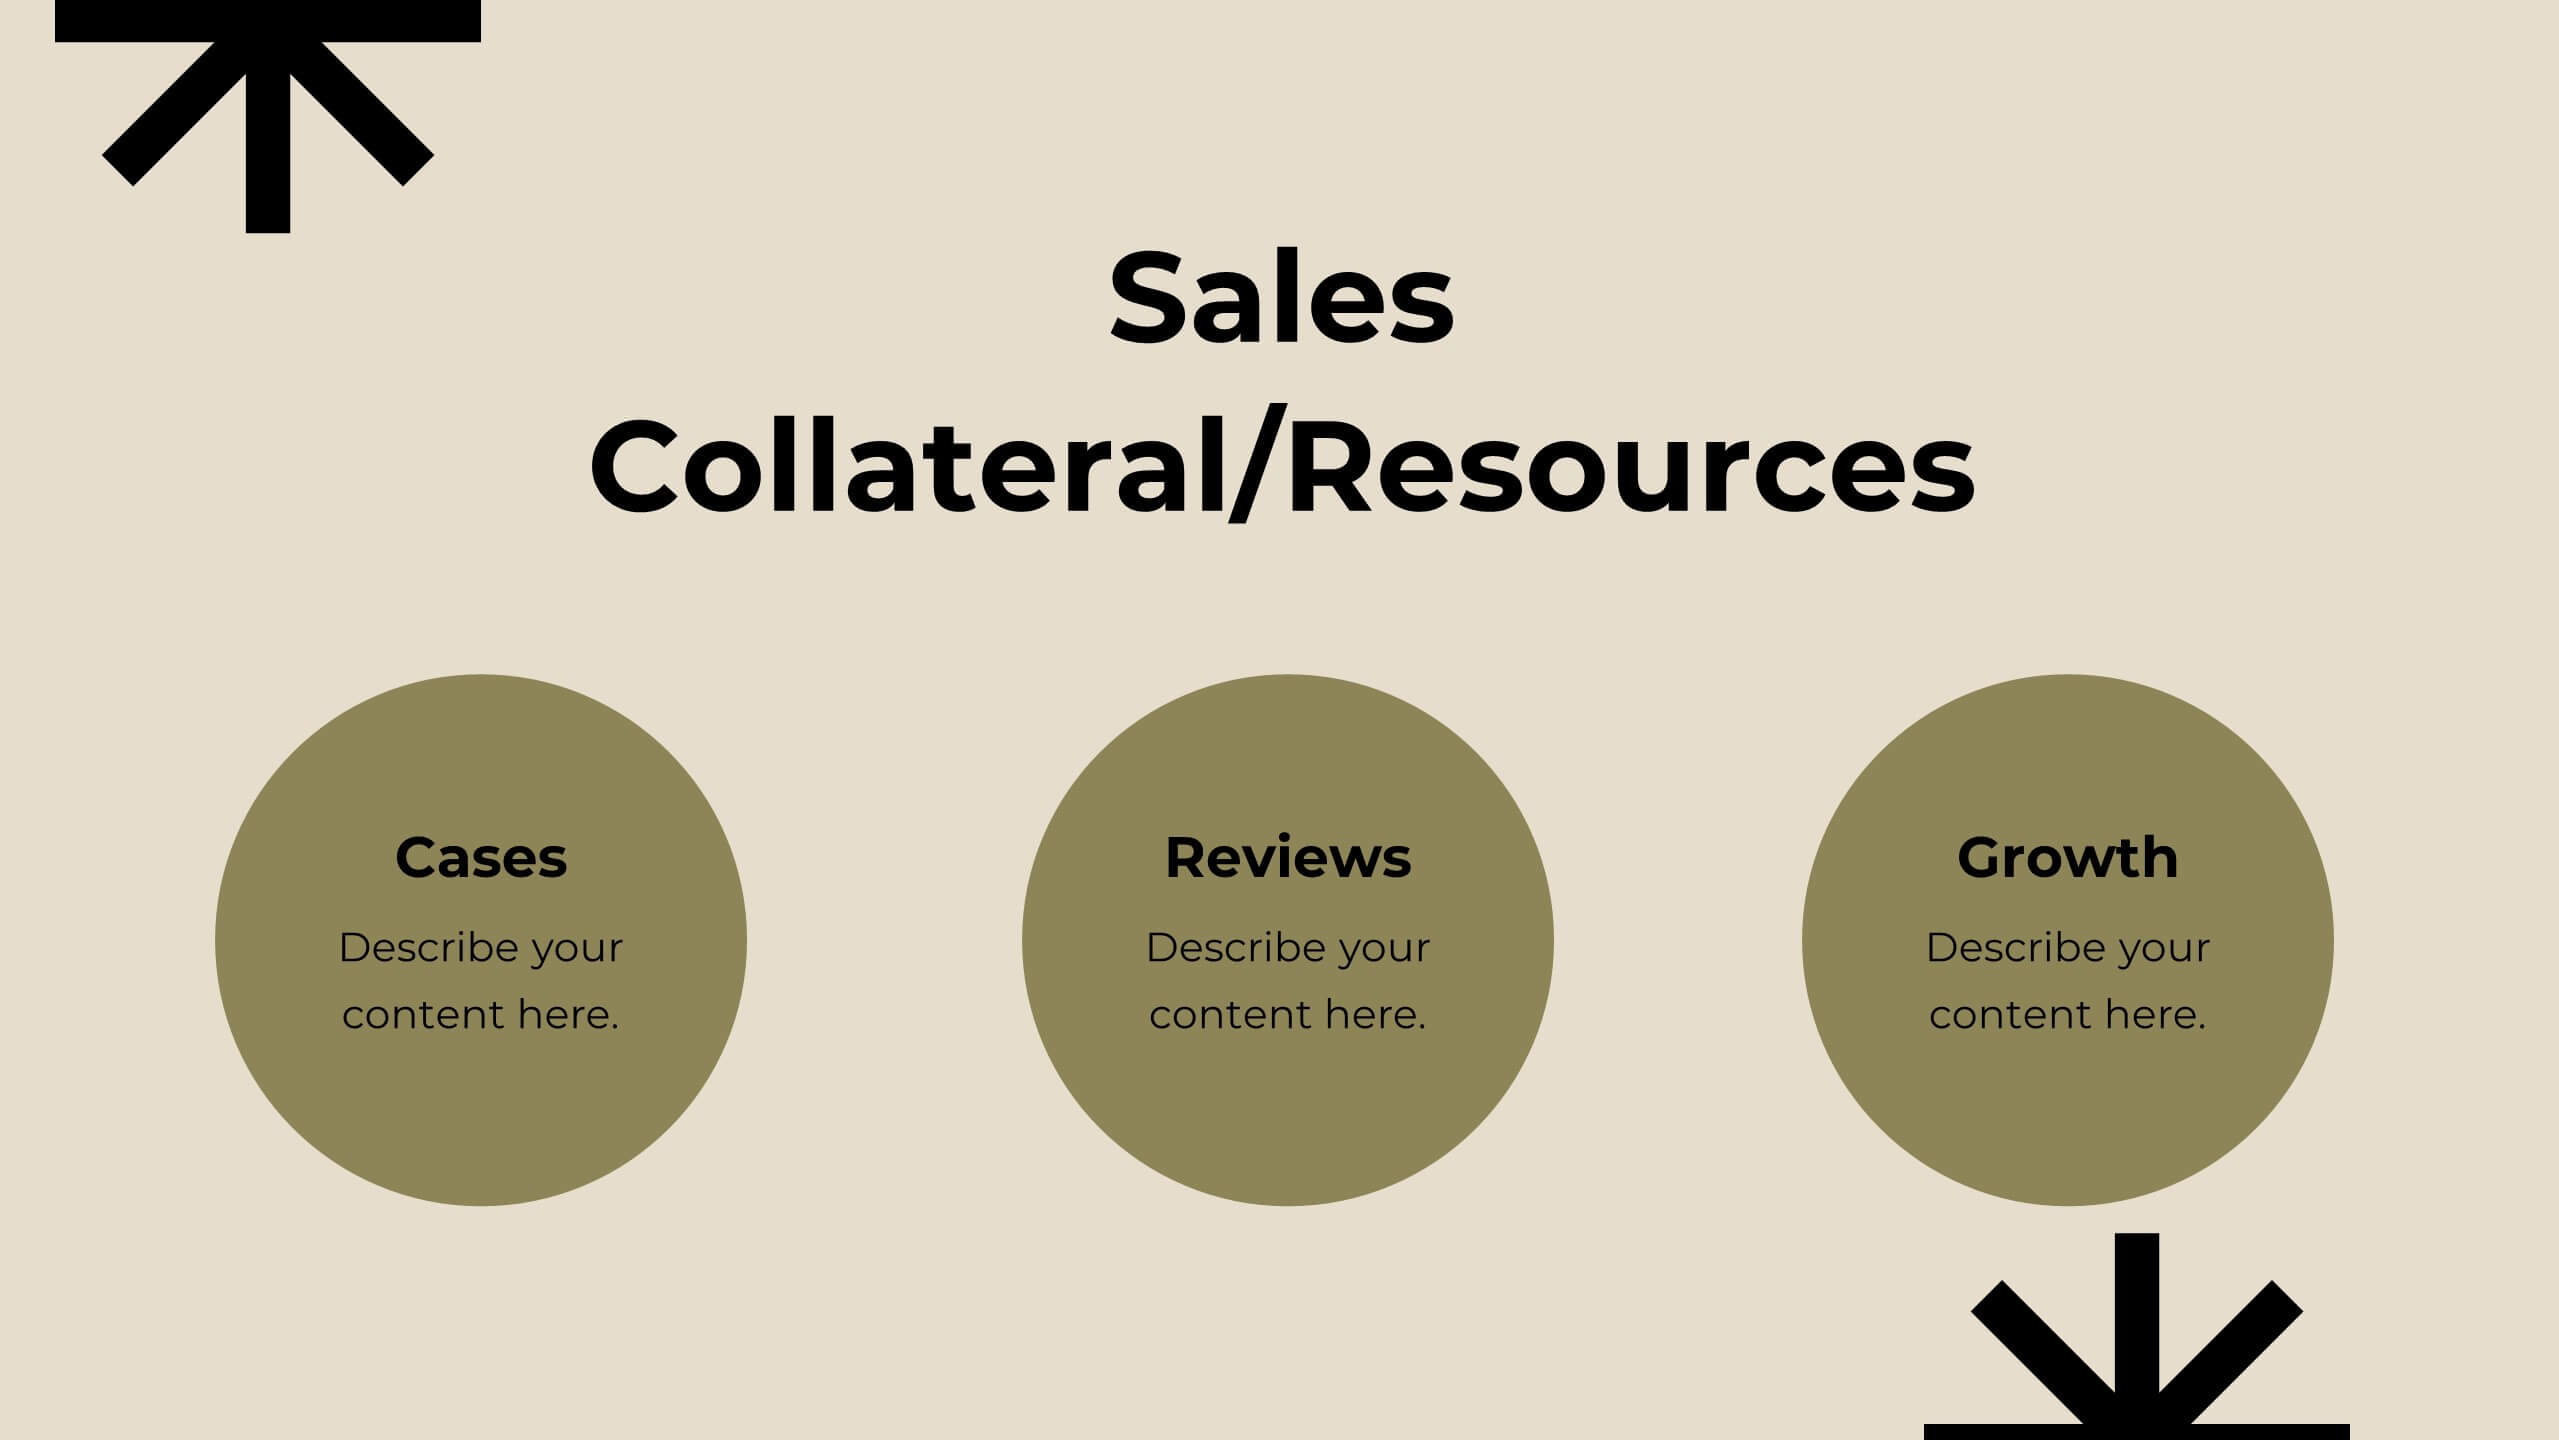
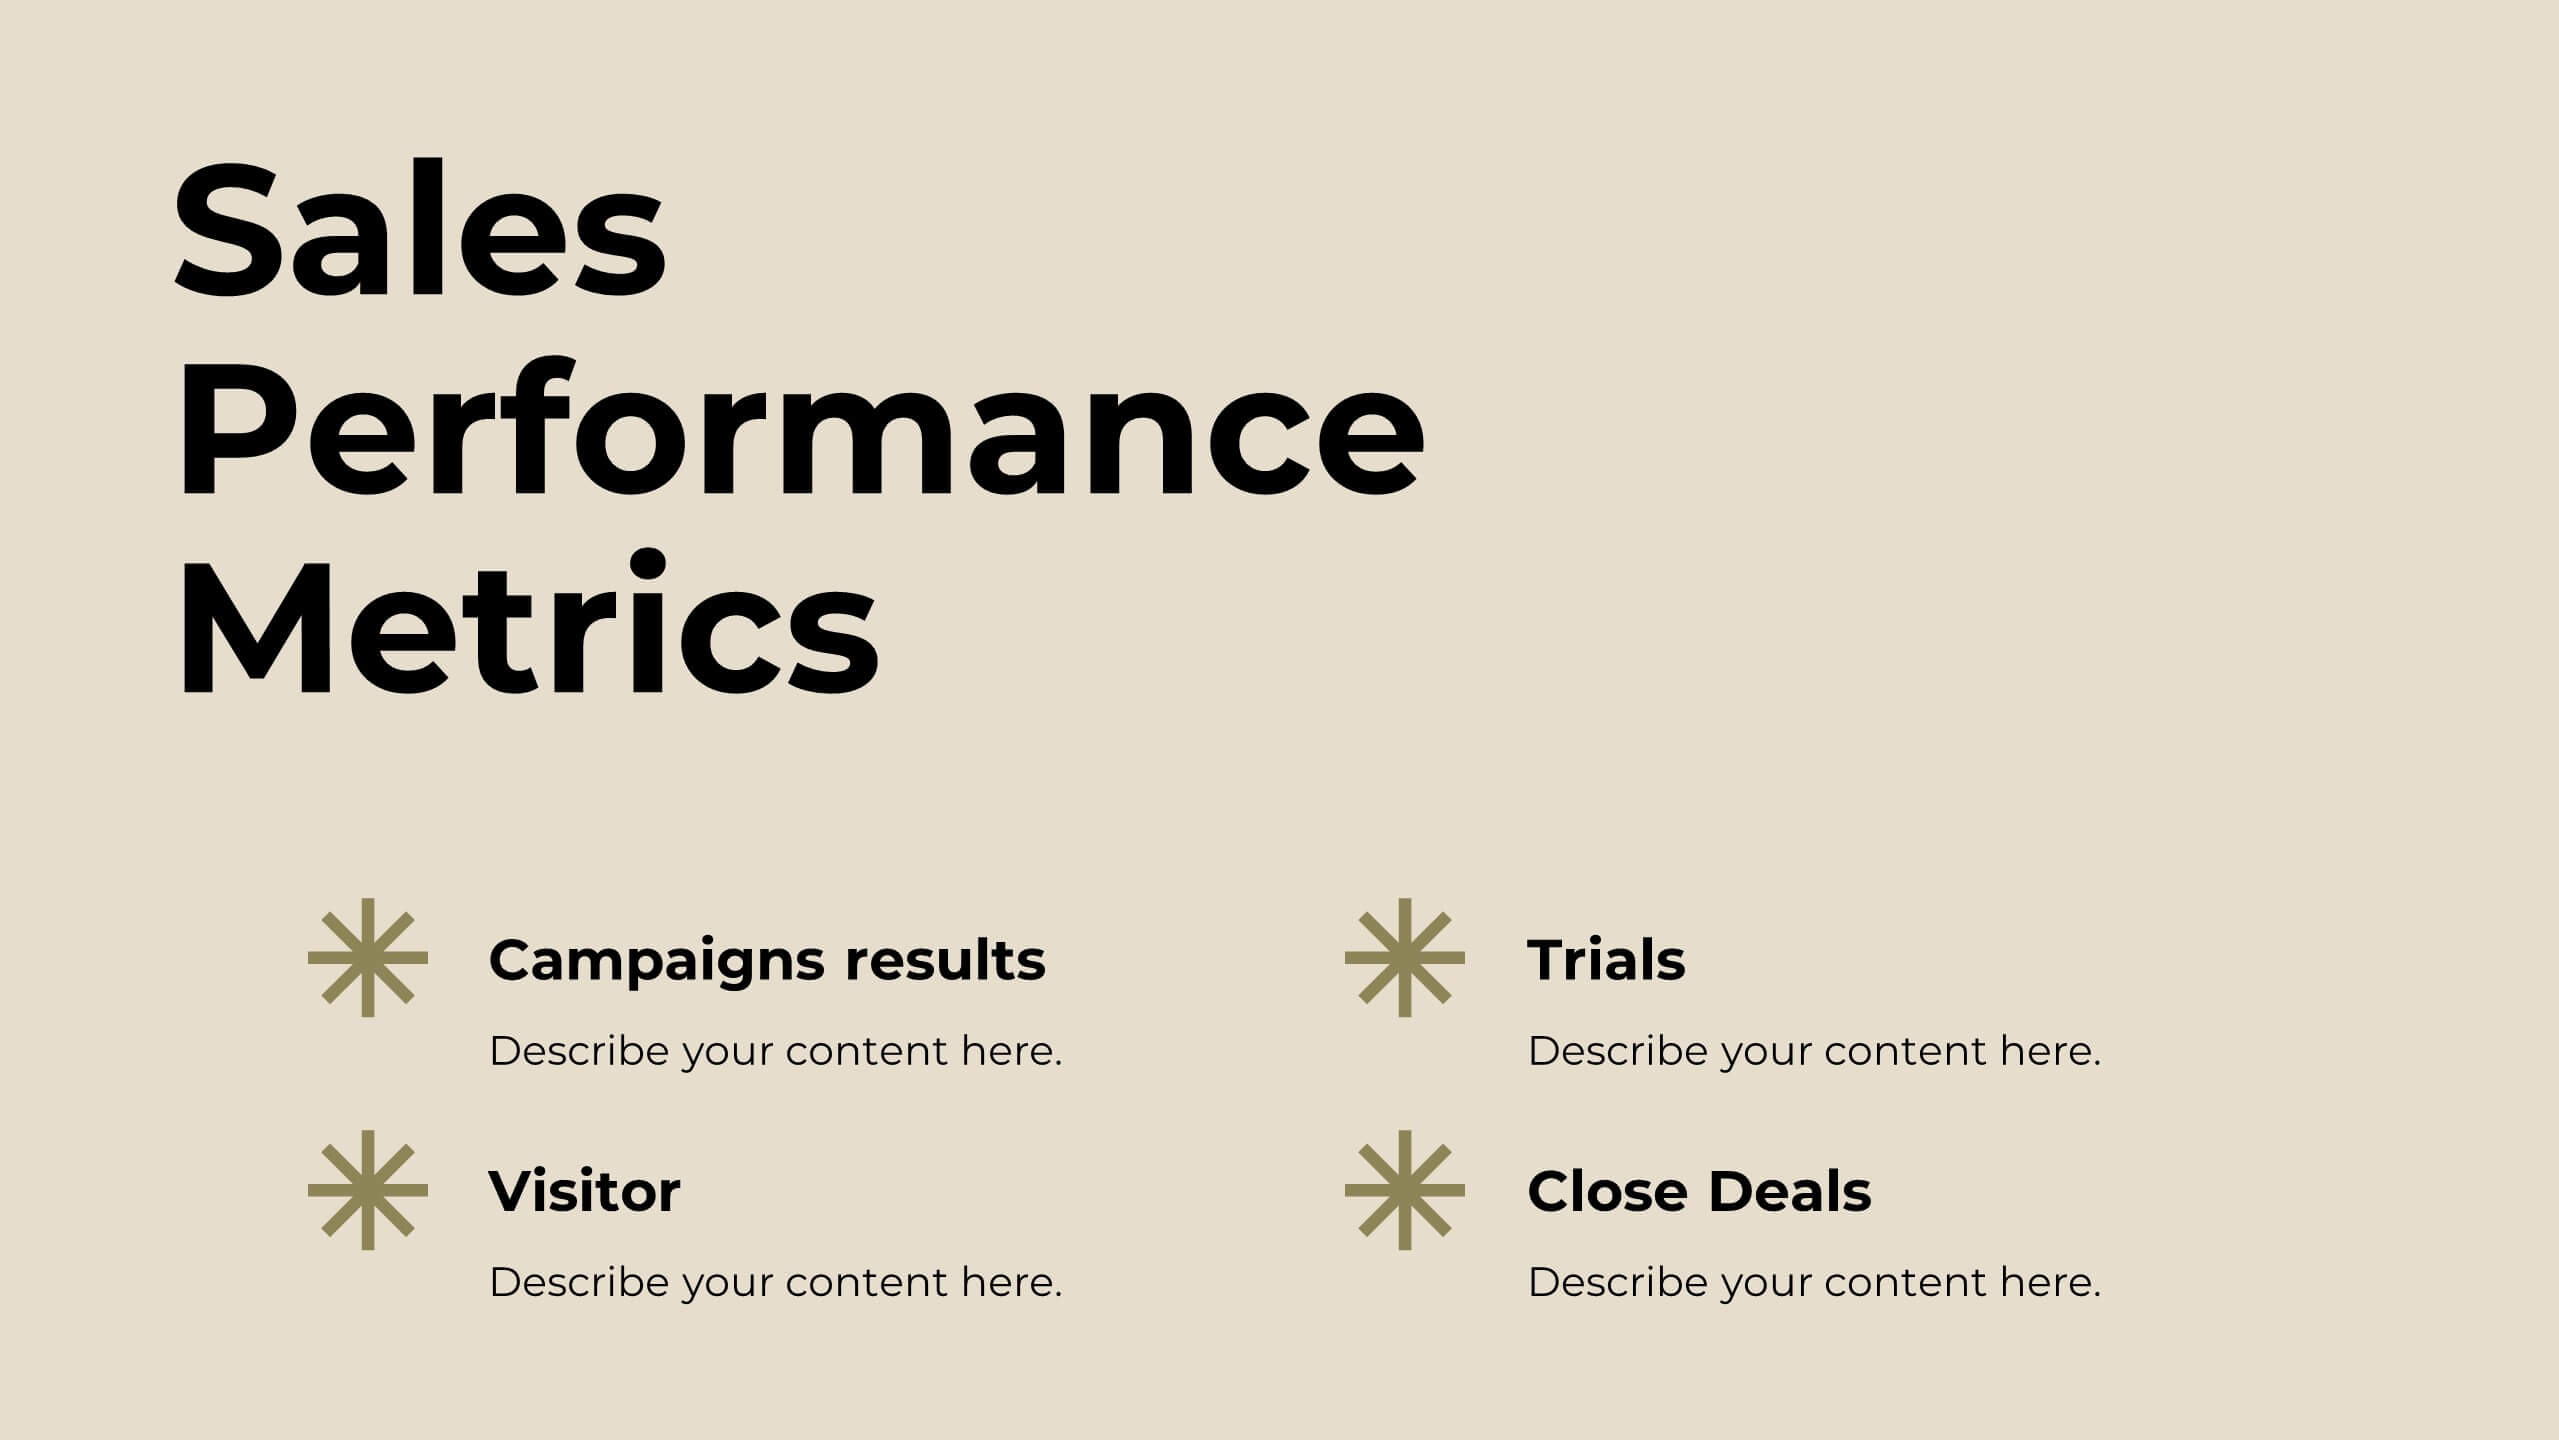
Opal Sales Pitch Deck Presentation
Boost your sales strategy with this sleek pitch deck template! Perfect for detailing your company overview, sales objectives, and pricing strategy, it includes slides for competitive analysis and customer testimonials. Engage your audience with clear, professional visuals and structured content. Compatible with PowerPoint, Keynote, and Google Slides for seamless presentations on any platform.


4 diapositivas
4-Quadrant Empathy Map Presentation
Dive into your audience’s mindset with a clean, structured layout that brings clarity to what they see, feel, hear, and do. This presentation helps teams understand user behavior and motivations with simple quadrant-based insights. Fully compatible with PowerPoint, Keynote, and Google Slides.


4 diapositivas
Banking Products and Credit Overview Presentation
Make your next presentation feel like a swipe of a card—clear, sleek, and purposeful. This layout is perfect for explaining the differences between financial products, highlighting banking services, and breaking down credit-related insights. Fully customizable and professionally designed for PowerPoint, Keynote, and Google Slides, it's ideal for any financial overview presentation.


7 diapositivas
Education Infographic Presentation Template
An education infographic is a visual representation of information related to education. It is used to present information in a clear, concise and easy-to-understand manner. It can be used to show statistics, facts, or data on a variety of educational topics such as student enrollment, graduation rates, test scores, and more. This template has bright and colorful photo designs that make it fun to use and easy to read. You can add your own pictures and customize the colors to make it look just the way you want. This template has many charts and graphs you can use to show all kinds of information.


4 diapositivas
Sales Strategy 30-60-90 Day Plan
Accelerate your sales team’s performance with this 30-60-90 Day Strategy template. Designed with clean circular progress visuals and clear milestone stages, it helps you outline sales goals, track onboarding, and align strategic efforts. Ideal for new hires, quarterly planning, or sales enablement. Fully editable in PowerPoint, Keynote, and Google Slides.


6 diapositivas
Environmental Science Infographics
Our "Environmental Science" infographic template, compatible with PowerPoint, Keynote, and Google Slides, is designed for educators, environmentalists, and scientists. This template effectively communicates important concepts in environmental science, making it a great tool for presentations and educational purposes. The template features key elements such as ecosystems, sustainability practices, and the impacts of climate change. It’s structured to help presenters convey complex environmental information in a way that is both easy to understand and visually engaging. This makes it ideal for educational settings, conferences, or public awareness campaigns about environmental issues. The design is vibrant and engaging, with a color scheme that reflects nature and environmental awareness. Incorporating greens, blues, and earth tones, it not only educates but also inspires the audience to think about the environment. Whether you're discussing conservation strategies, ecological studies, or environmental policies, this template ensures your presentation is both informative and visually striking.