


Características


¿Tienes alguna pregunta?
Recomendar


5 diapositivas
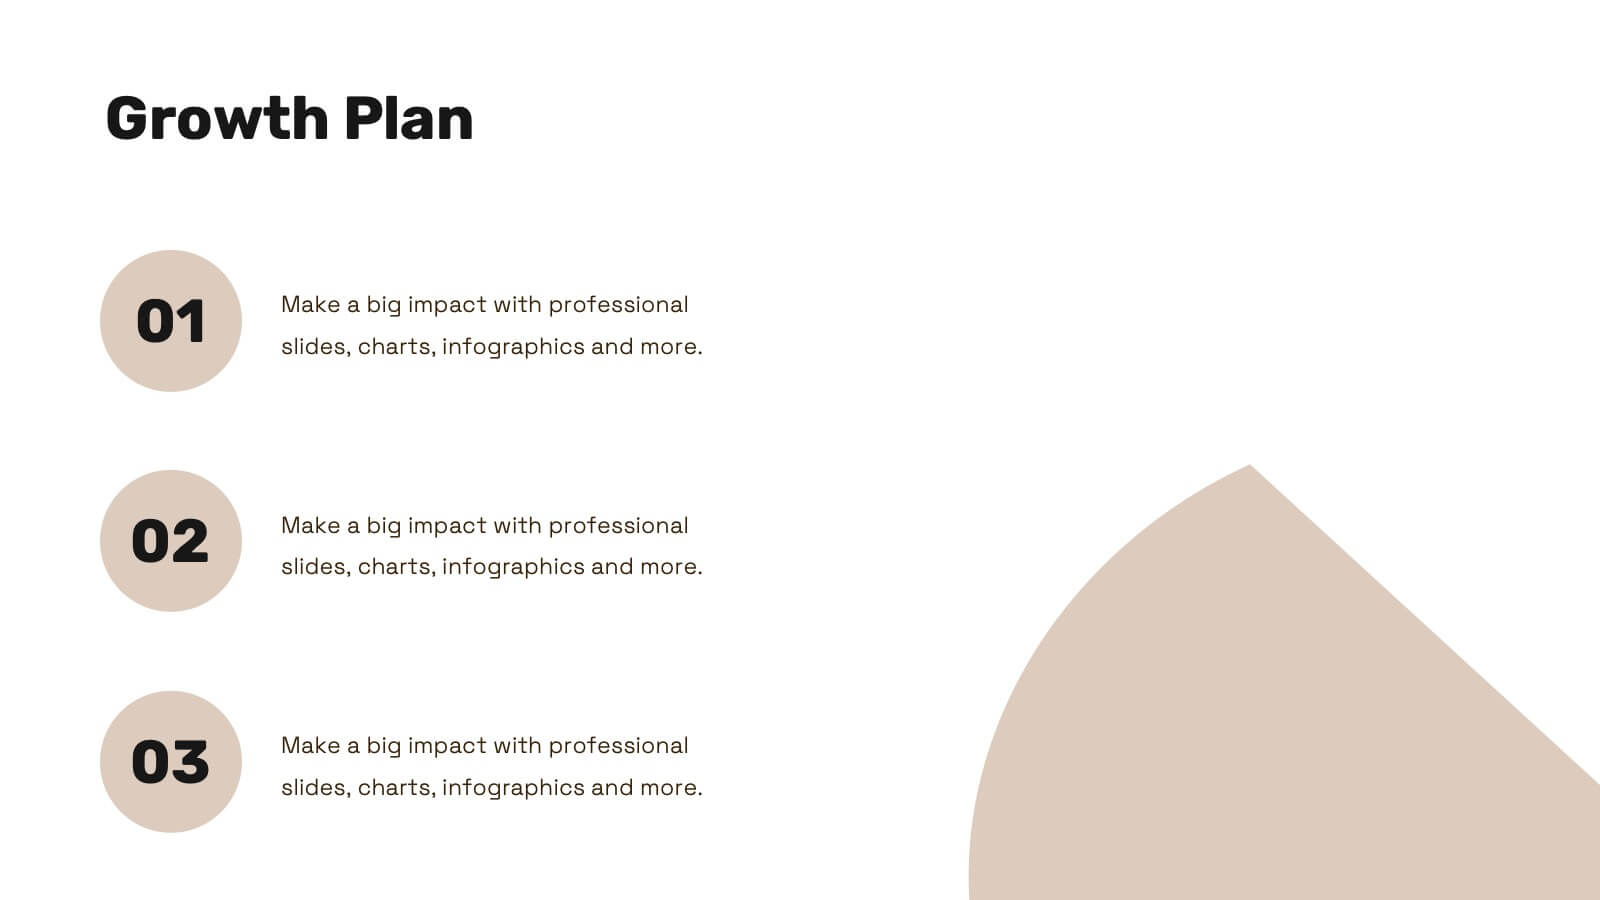
Strategic Growth Next Steps
Highlight your business roadmap with this rocket-themed infographic tailored for strategic growth. Ideal for showcasing step-by-step initiatives or departmental alignment, it features five labeled stages with ample space for insights and icons. Fully editable in PowerPoint, Keynote, and Google Slides—perfect for growth strategy, planning, or vision-setting decks.


6 diapositivas
Managing Product Maturity and Decline Presentation
Explore the critical phases of 'Managing Product Maturity and Decline' with this detailed presentation template. It's designed for professionals in product management, illustrating strategies to handle product lifecycle stages effectively. This template is a must-have for seminars and workshops focusing on prolonging product lifespan and maximizing returns.


6 diapositivas
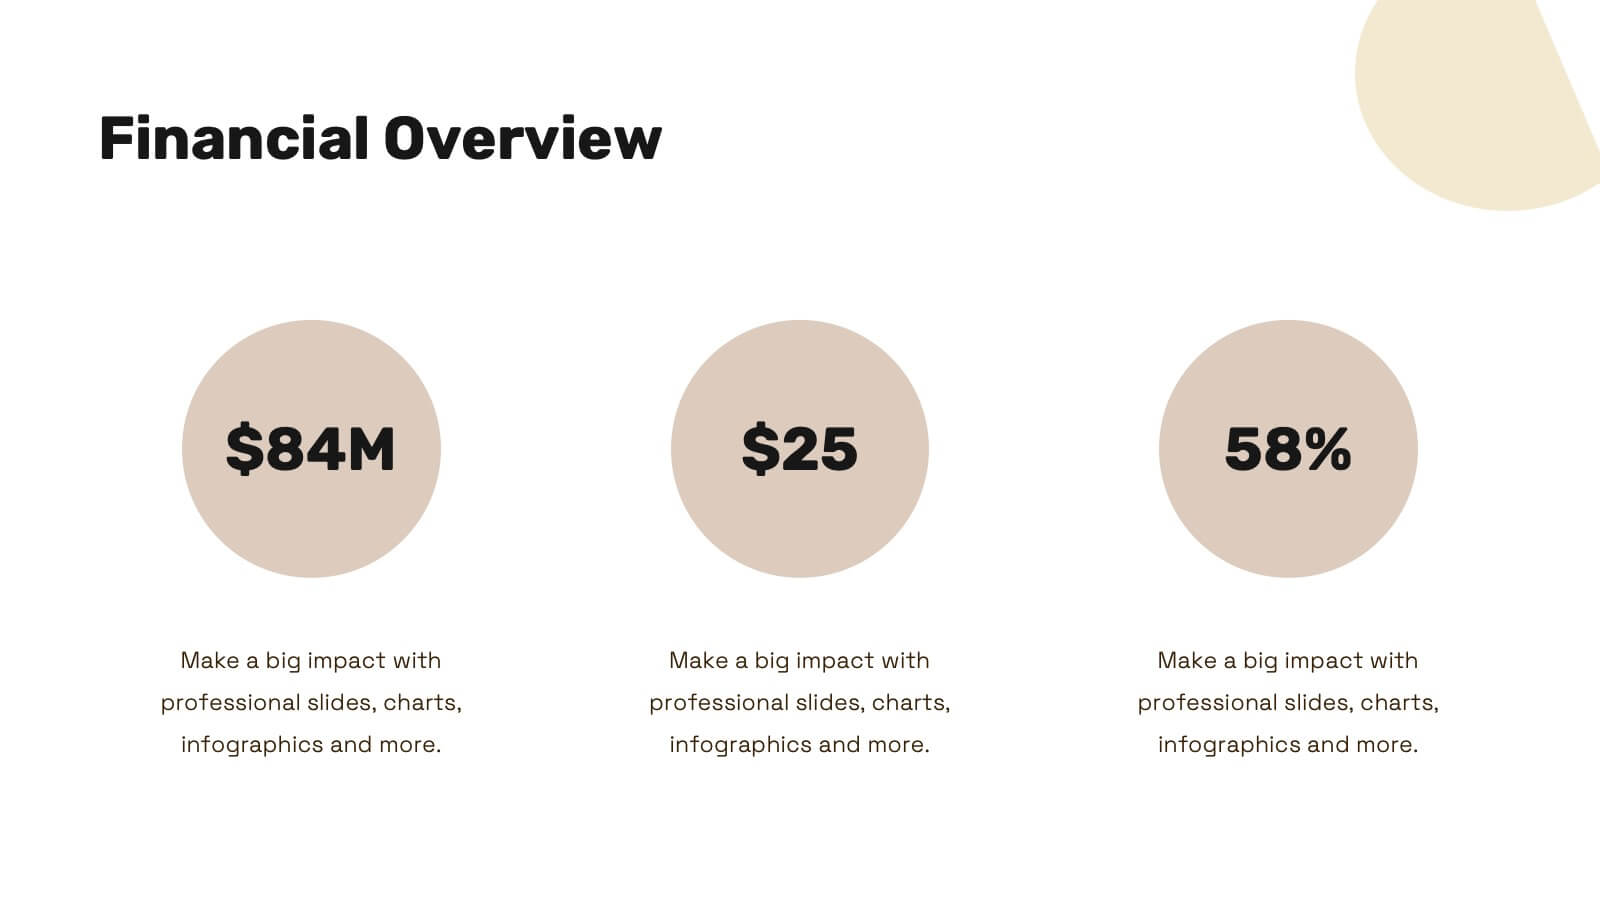
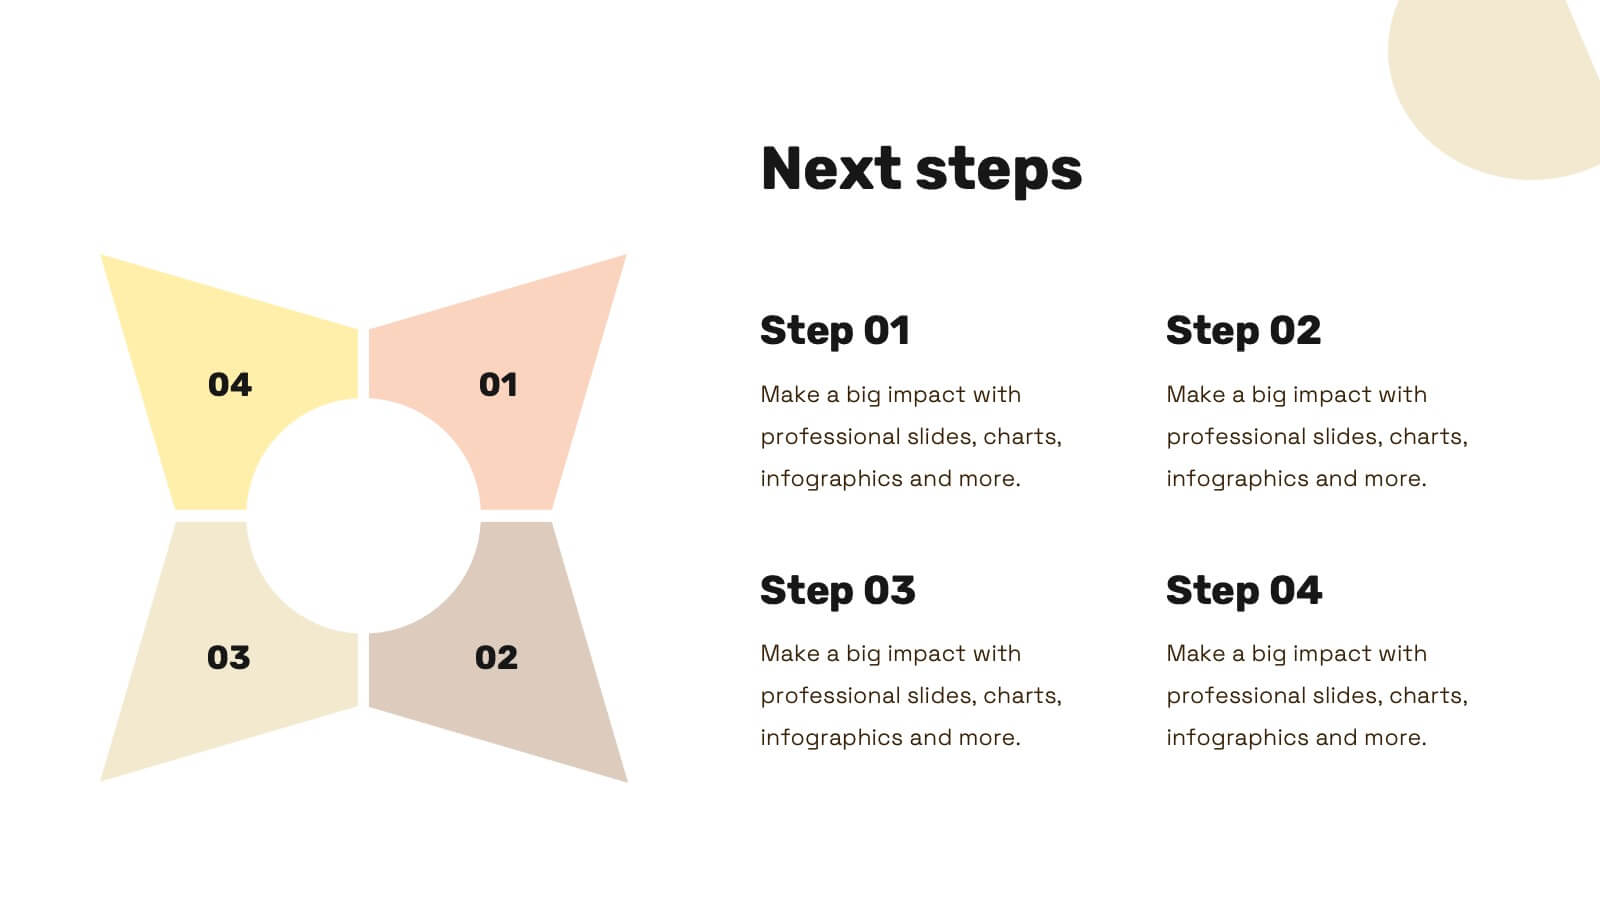
Business Overview Company Profile Presentation
Present Your Business with a Dynamic Overview! The Business Overview Company Profile template features a modern circular flow design, perfect for showcasing company insights, key strategies, and core values. With six structured content sections, this layout helps you present information in a clear and engaging way. Whether you're introducing your business or outlining corporate initiatives, this fully editable template in PowerPoint, Keynote, and Google Slides ensures a polished and professional presentation for any industry.


25 diapositivas
Hollowfern Brand Identity Presentation
Showcase your brand's unique essence with this structured and visually appealing brand identity presentation template. Highlight key elements like brand values, logo design, color palettes, and typography, providing a cohesive foundation for your brand's image. Dive deeper into the brand tone, consumer personas, and competitive positioning to ensure clarity and alignment with your target audience. This template offers dedicated sections for market analysis, unique selling proposition, and brand guidelines, helping you communicate your strategy with professionalism. Whether you're crafting a social media presence, building a website, or refining packaging designs, this template empowers you to stay consistent and compelling. Fully compatible with PowerPoint, Google Slides, and Keynote, it's tailored for seamless customization and presentation across platforms.


7 diapositivas
Time Management Strategies Infographic Presentation
Time management is the process of planning, organizing, and allocating time effectively to achieve specific goals and objectives. This simple and professional template shows you the basics of time management. It uses a combination of bullet points, tables and illustrations to give you the information you need in a practical form. Use this presentation as a step-by-step guide on how you can become more efficient at managing daily business tasks. This infographic template is designed to help you manage your time and prioritize your actions by highlighting the different aspects of a task.


26 diapositivas
Fitness Company Profile Dark Presentation
Dive into the pulsating realm of fitness, where every sweat drop carves the path to chiseled abs. Imbued in shades of black with electrifying neon accents, our template captures the dark, motivating ambiance of late-night gym sessions. Featuring dynamic graphics, empowering icons, and inspiring image placeholders, it's a testament to determination and grit. Flawlessly curated for Powerpoint, Keynote, or Google Slides. The ultimate asset for fitness trainers, gym enthusiasts, health bloggers, or anyone aiming to inspire a journey towards physical excellence. Push your limits; let every rep ignite your passion.


15 diapositivas
Business Proposal Infographic
A business proposal is a formal document that outlines a specific business endeavor, project, or venture, and presents a persuasive argument for why the proposed approach or solution is viable and advantageous. This infographic template is a tool for the business world to communicate business ideas, pitch a product or service, secure funding or partnerships, or enter into a business agreement. Fully customizable and compatible with Powerpoint, Keynote, and Google Slides. Showcase your unique value proposition and unveil how it fuels your journey to success. Energize your business propositions and set the stage for success!

22 diapositivas
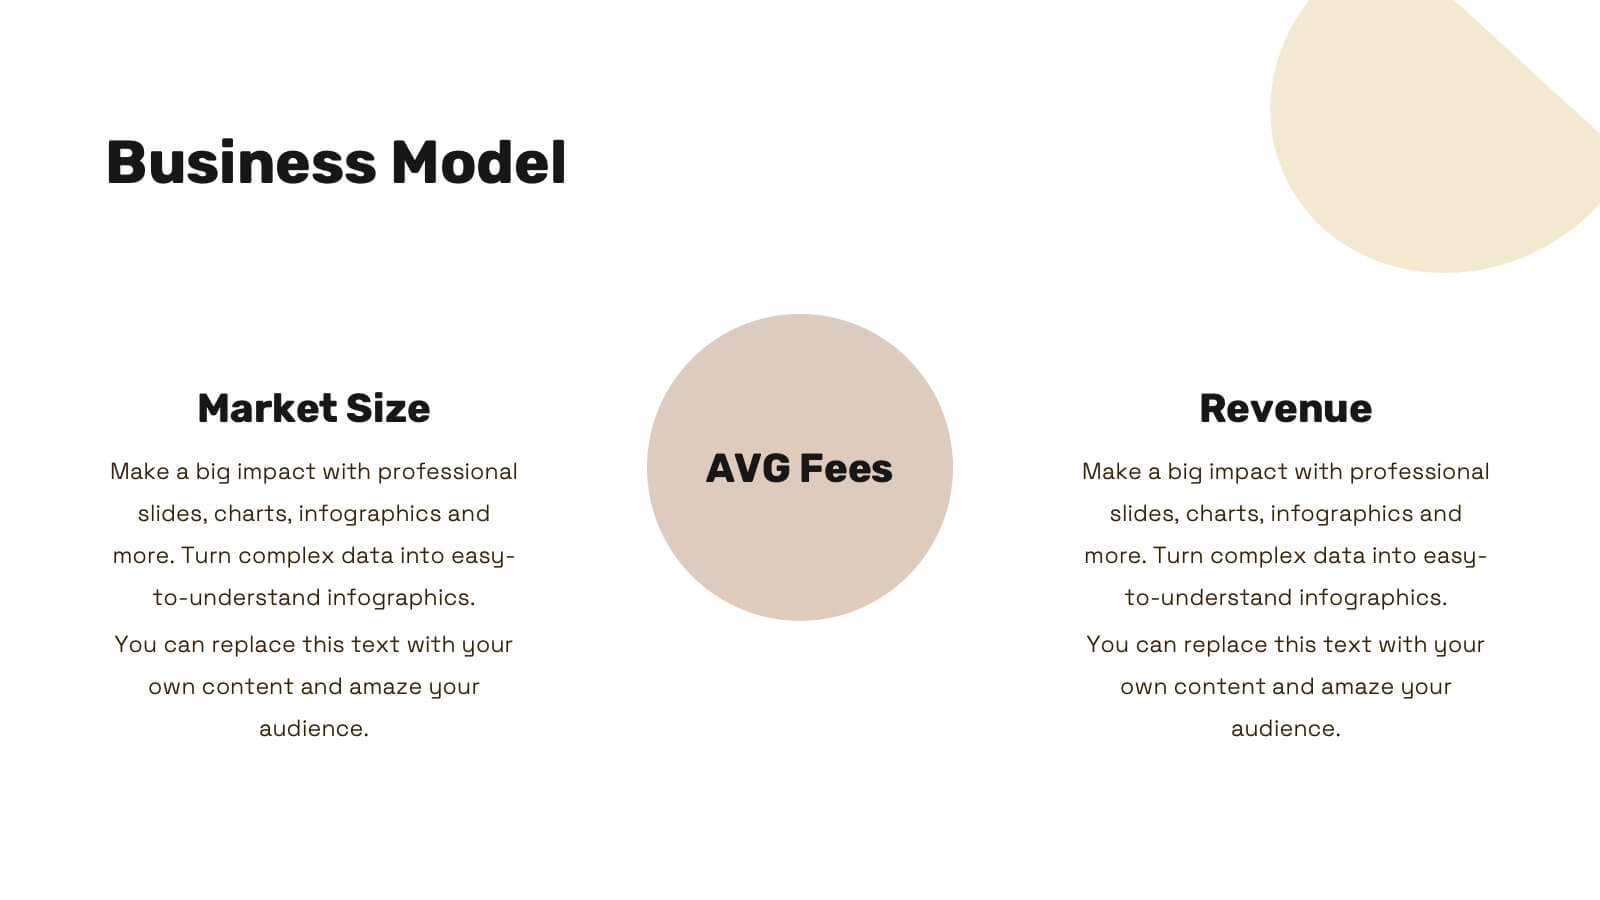
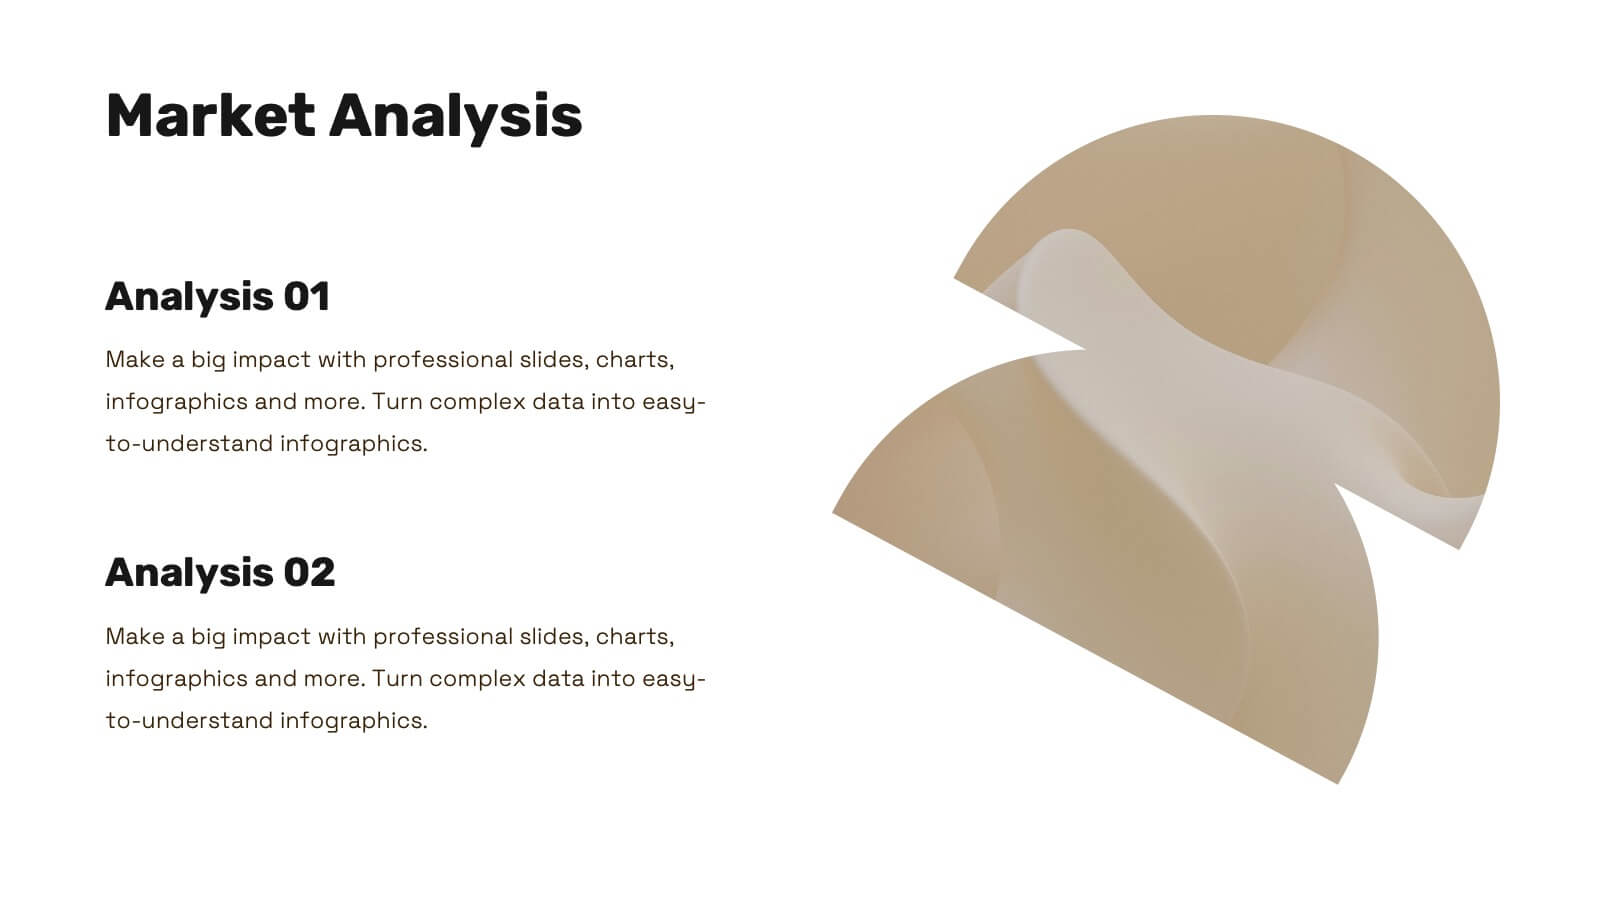
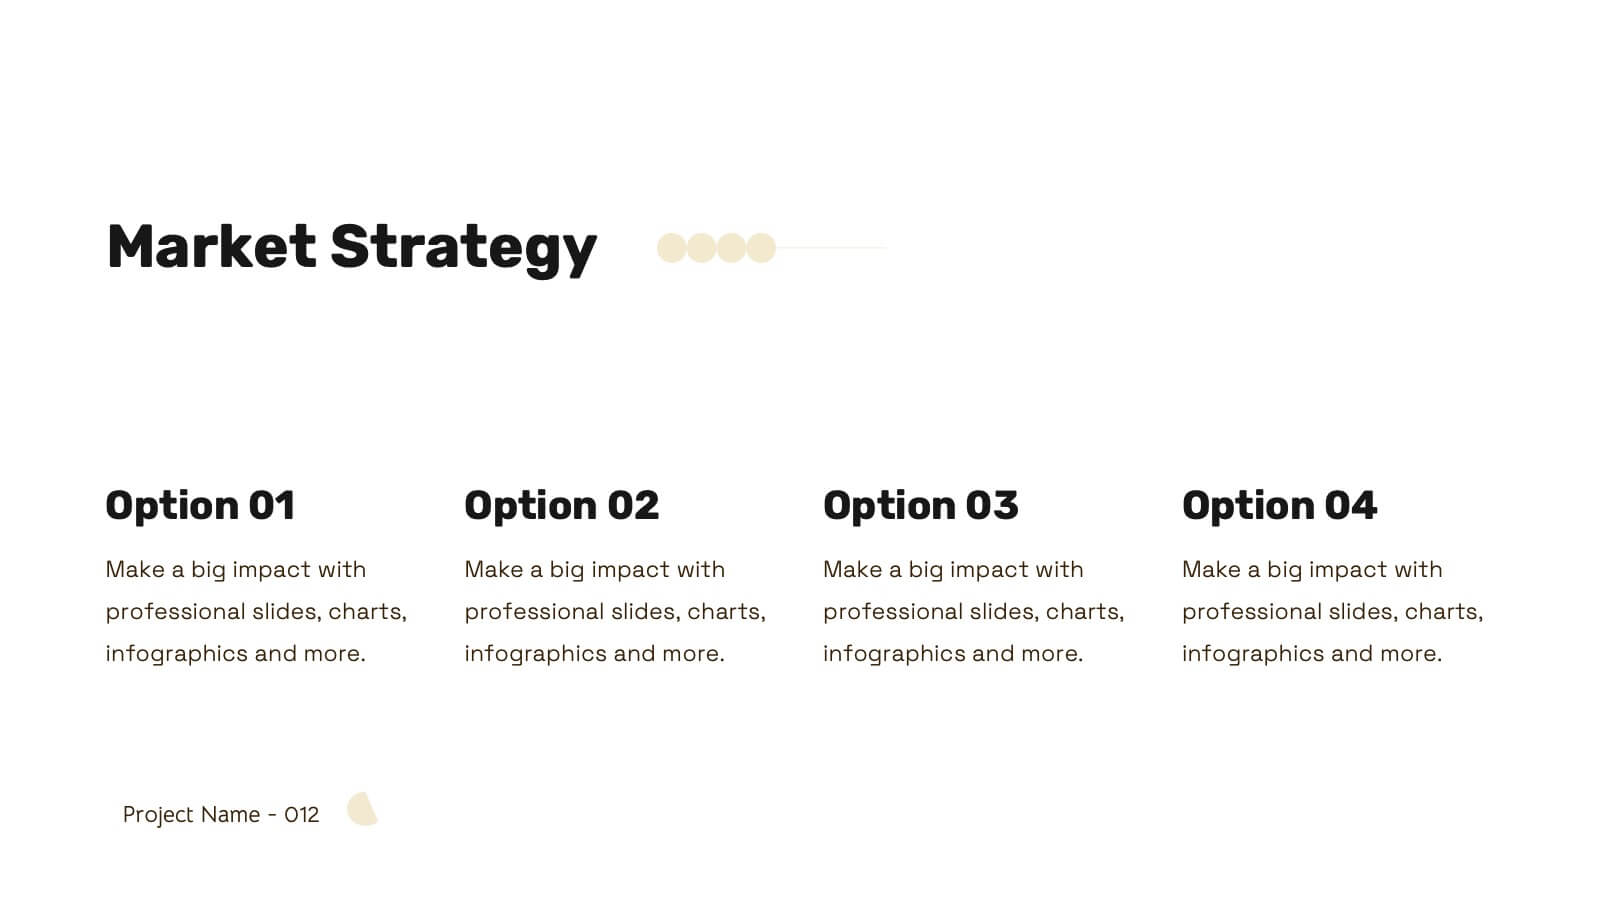
Nova Startup Funding Proposal Presentation
Craft an impressive startup funding proposal with this elegant template. It includes sections for mission, vision, market analysis, business model, and financial overview. Ideal for clear and professional presentations. Fully compatible with PowerPoint, Keynote, and Google Slides for easy customization.


5 diapositivas
Sports Performance Analysis Presentation
Visualize athletic metrics and improvement strategies with this Sports Performance Analysis slide layout. Designed around a dynamic running figure, it uses labeled circular markers (A–D) to clearly break down four key insights or action points. Perfect for sports reviews, training breakdowns, or coaching sessions. Fully editable in PowerPoint, Keynote, and Google Slides.


9 diapositivas
Font Alphabet Infographic
Typography plays a pivotal role in conveying mood, tone, and personality. Our font alphabet infographic is a dazzling blend of red, green, yellow, and blue, providing a vibrant showcase of diverse font styles. Each alphabet letter is uniquely stylized, making it an ideal resource for graphic designers, educators, and marketing professionals looking to make a statement. Whether you're teaching the basics of typography or showcasing a brand's versatility, this infographic serves as a visual treat. Seamless integration with PowerPoint, Keynote, and Google Slides ensures you can weave this colorful font journey into any presentation.


6 diapositivas
Harvey Ball Comparison Chart Presentation
Turn data into insight with this clean and colorful presentation design. Ideal for visualizing comparisons, progress levels, or product evaluations, it makes complex information easy to read and interpret. Fully editable and compatible with PowerPoint, Keynote, and Google Slides, this layout ensures clarity and impact in every presentation.


6 diapositivas
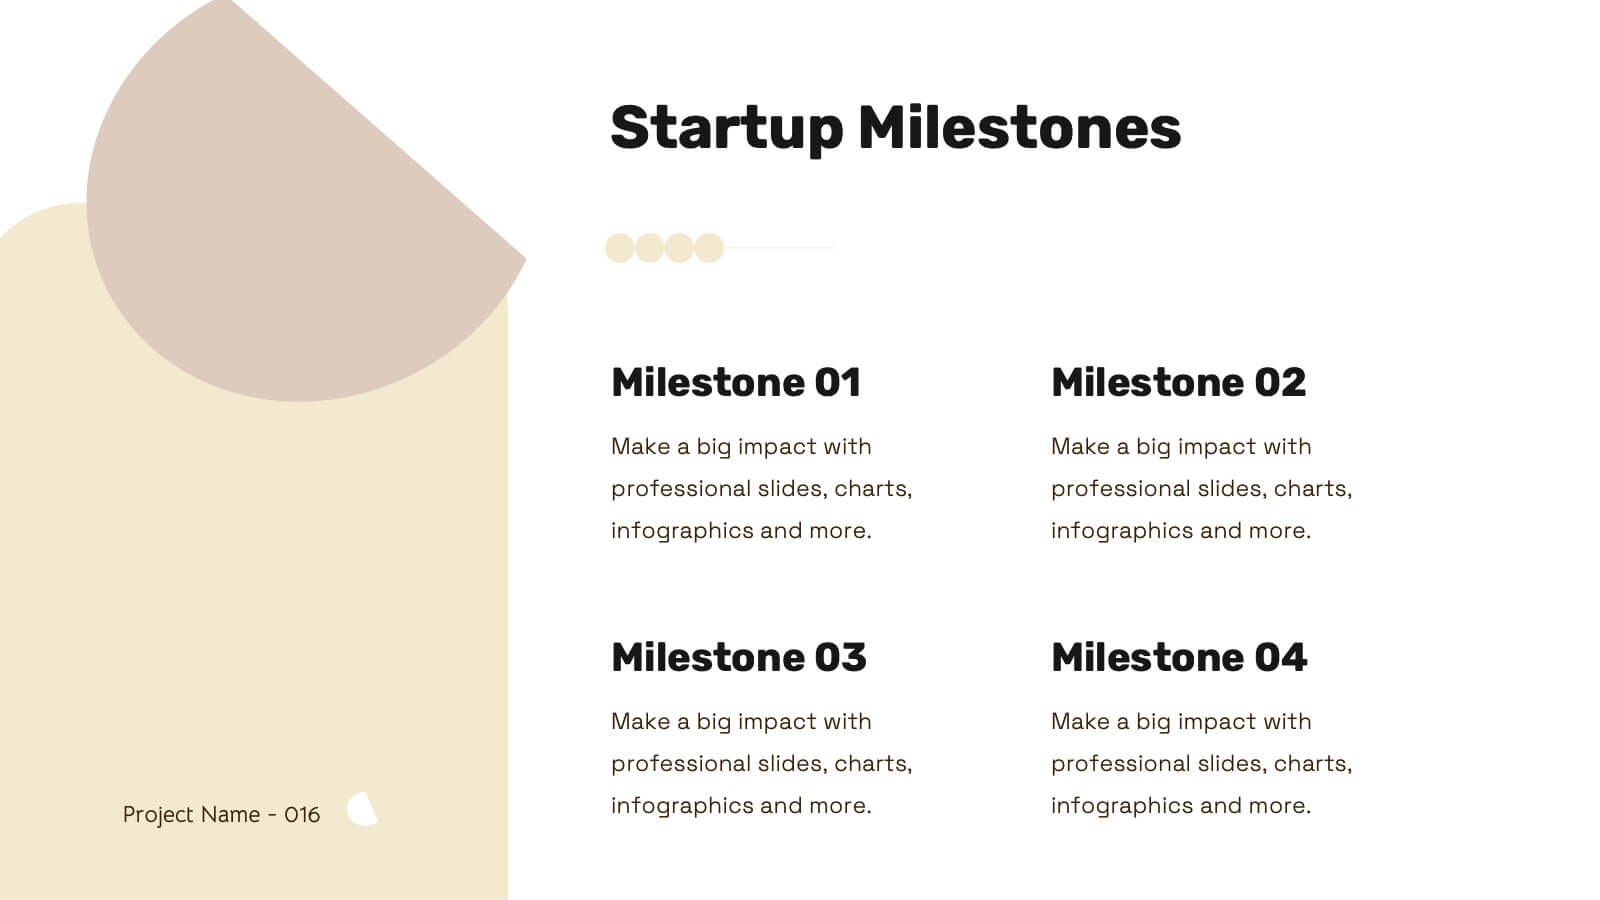
Milestone Roadmap and Deadlines Presentation
Track progress with clarity using the Milestone Roadmap and Deadlines Presentation. This curved timeline layout highlights six key stages or deliverables with color-coded markers and icons. Perfect for visualizing project phases, quarterly goals, or deadline-driven strategies. Fully editable and compatible with PowerPoint, Keynote, and Google Slides.


6 diapositivas
6-Step Circular Process Diagram Presentation
Bring your workflow to life with a clean circular layout that makes every phase feel connected and easy to follow. This presentation breaks complex processes into six intuitive steps, ideal for strategy, planning, or operations. Fully compatible with PowerPoint, Keynote, and Google Slides.


4 diapositivas
Construction Project Planning
Streamline your workflow and improve clarity with this vibrant project planning wheel designed for construction professionals. This slide helps visualize key phases—such as planning, team coordination, and logistics—using color-coded segments and editable icons. Perfect for architects, contractors, and project managers. Fully customizable in PowerPoint, Keynote, and Google Slides.


6 diapositivas
Sales Associate Infographic
A sales associate, also known as a sales representative or salesperson, is an individual who is responsible for selling products or services to customers. This infographic template is designed to highlight the key roles, skills, and responsibilities of a sales associate. It provides an informative and engaging overview of the sales associate's role within a company or organization, showcasing their contribution to sales and customer satisfaction. This template is suitable for various industries and can be customized to fit specific company or organizational contexts. Compatible with Powerpoint, Keynote, and Google Slides, this is easily customizable.


7 diapositivas
Leadership Qualities Infographic
Strengthen your leadership presentations with our Leadership Qualities infographic, fully compatible with Powerpoint, Keynote, and Google Slides. This infographic is meticulously designed for trainers, coaches, and management professionals keen on illustrating the core attributes that define effective leadership. Our Leadership Qualities infographic provides a vivid portrayal of essential leadership traits, from communication and decision-making to empathy and resilience. It's an excellent resource for workshops, seminars, and courses focused on leadership development. The visual elements are crafted to highlight the contrasts between various leadership styles and the impacts of different leadership behaviors on team dynamics. By using this infographic, you'll be able to foster a deeper understanding of what makes a great leader in the eyes of their team and organization. It's a powerful visual aid that can help initiate discussions on personal development and team-building strategies. Incorporate it into your educational materials to underscore the value of strong leadership in achieving organizational success.


6 diapositivas
Performance Evaluation Infographic
Performance evaluation is a process used by organizations to assess and measure the performance of employees, teams, departments, or the overall organization. This infographic template aims to evaluate how well individuals and groups are meeting their goals and objectives, and involves the use of metrics to quantify performance. This template is designed to provide an overview of the employee's strengths, areas for improvement, and overall performance rating. This infographic is perfect for managers, HR professionals, and organizations for performance reviews to communicate feedback and progress to employees.