


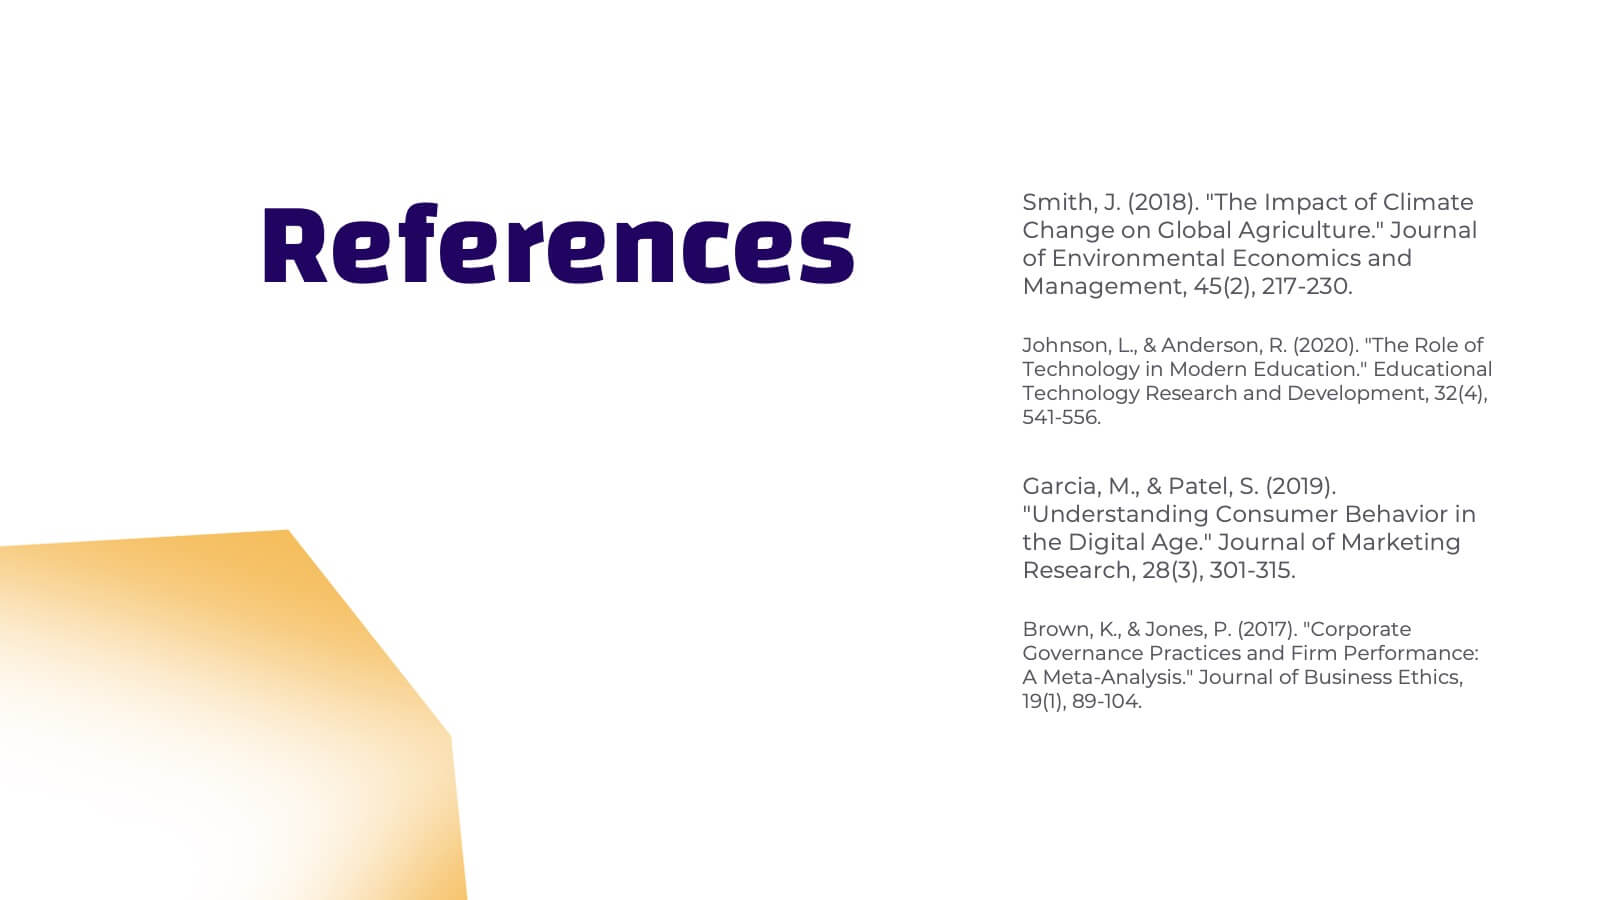
Características


¿Tienes alguna pregunta?
Recomendar


4 diapositivas
Funding & Investor Startup Presentation
Present your investment strategy with clarity and impact using this triangle diagram slide. Ideal for showcasing the relationship between key funding stages, investor types, or business milestones, this layout offers a clean structure with labeled nodes (A, B, C) and supporting icons. Fully editable in PowerPoint, Keynote, and Google Slides for seamless customization.


7 diapositivas
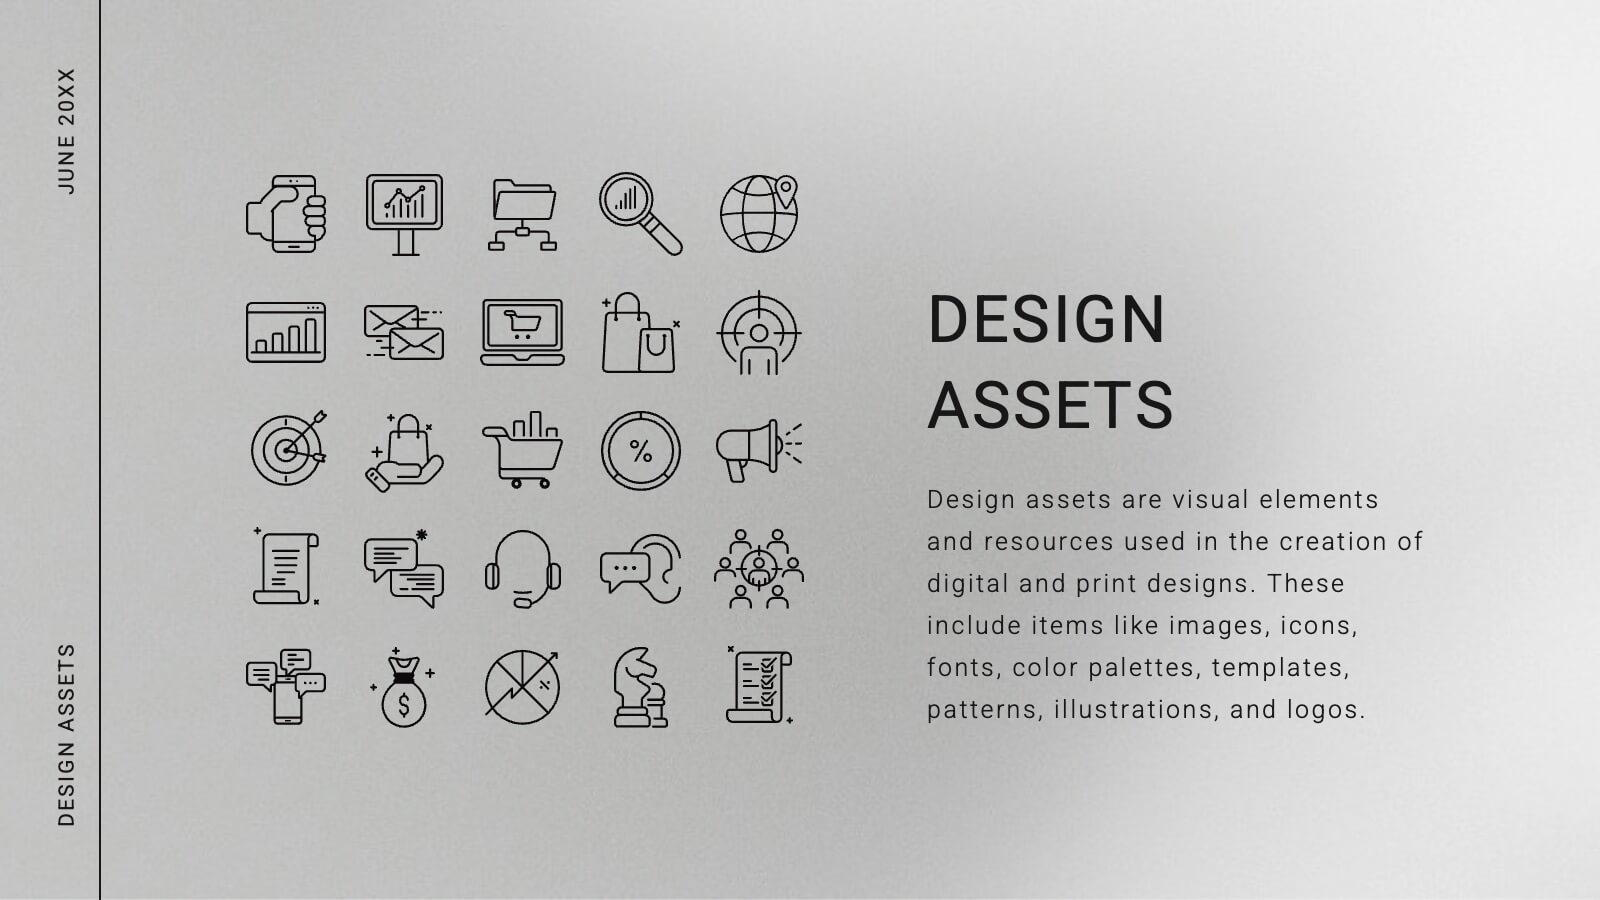
Risk Management Infographic Presentation Template
Risk management is a process used by businesses to identify, understand, and deal with potential risks. It is an important process that empowers a business. Risk management, as part of overall business strategy, helps to keep a company focused on its long-term goals. This template provides you with suggested risk management strategies that can help you in bolstering your business. This template is a great way to introduce and practice risk management skills It is packed with all the necessary information. This template is designed to help you identify, assess and control risks in your project.


6 diapositivas
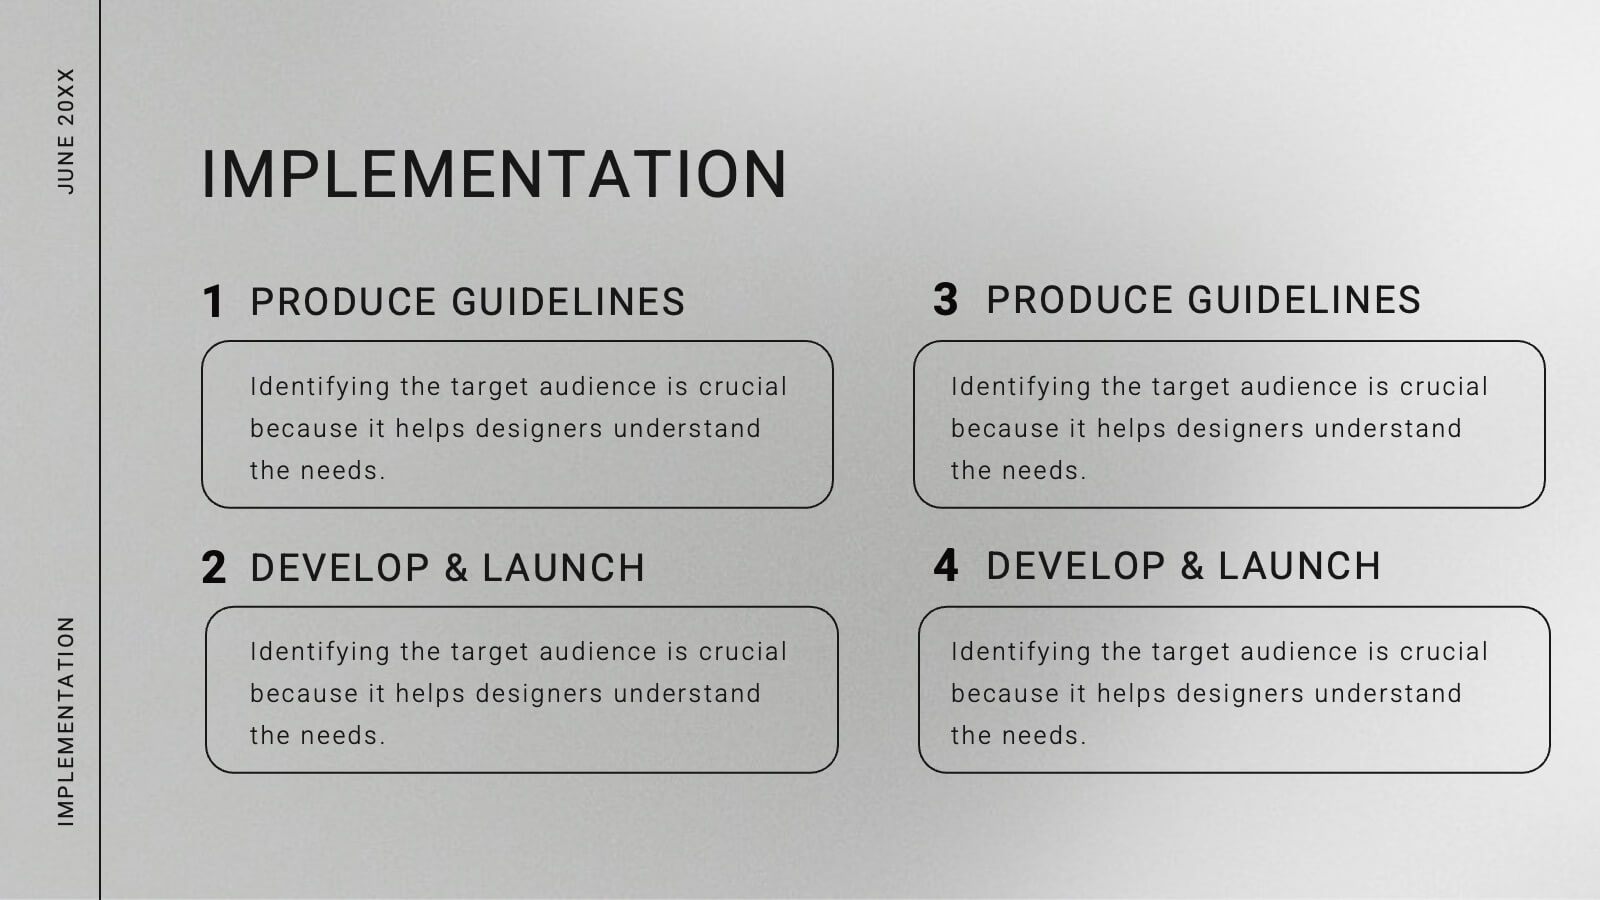
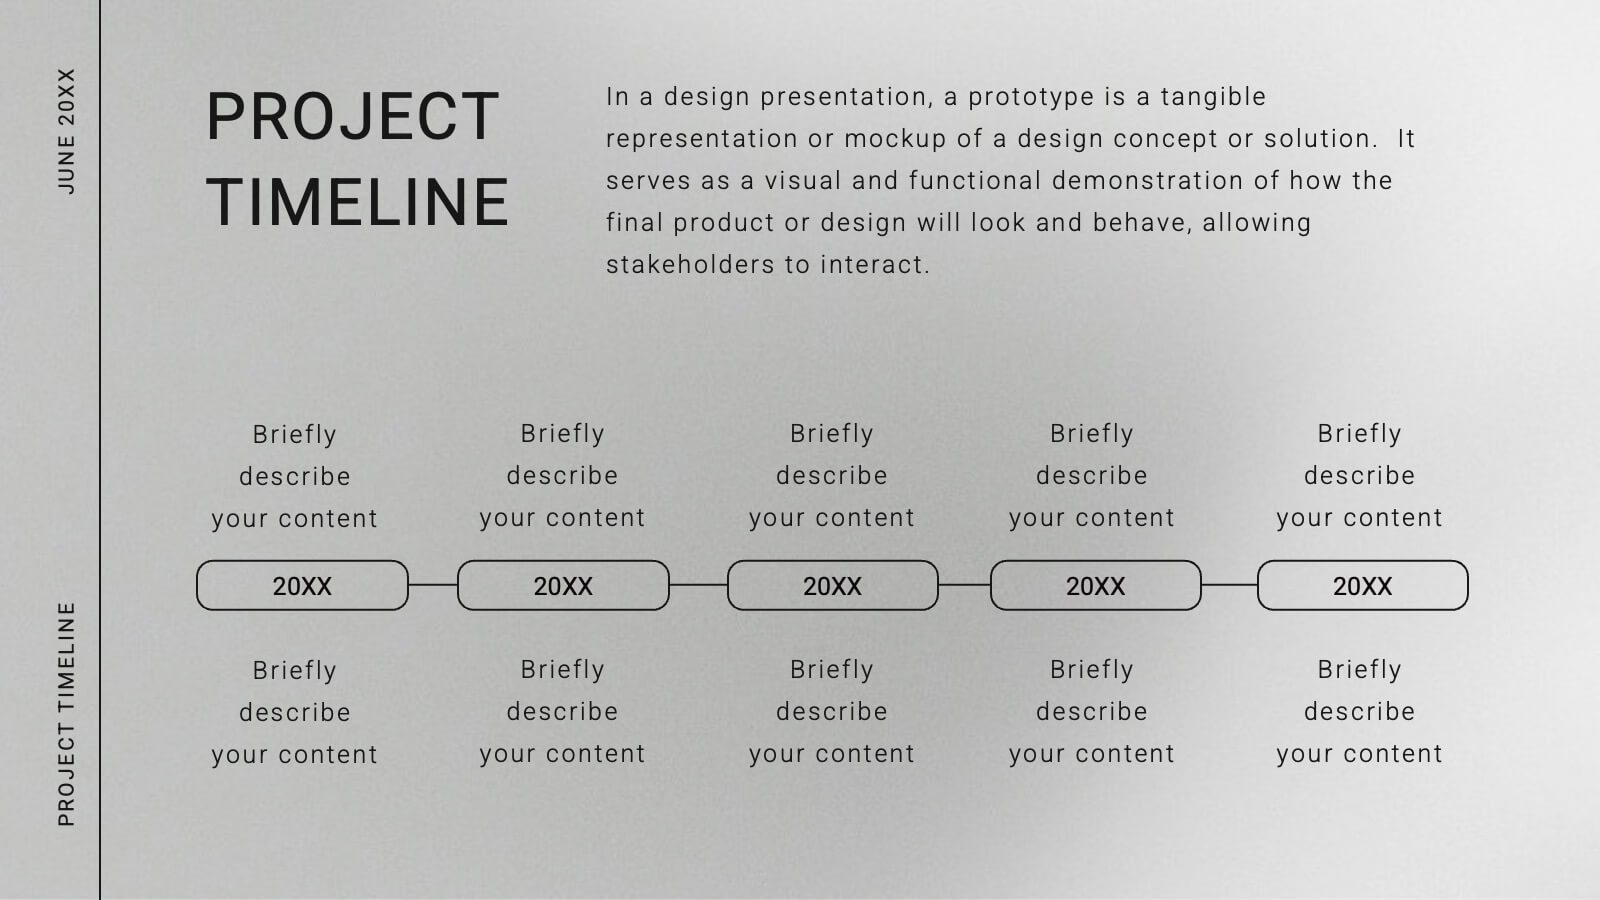
Project Schedule Timeline Presentation
Plan, track, and showcase progress with this sleek timeline layout designed to visualize every milestone with clarity. Ideal for organizing project phases, deadlines, or deliverables, it helps communicate workflows efficiently and professionally. Fully editable and compatible with PowerPoint, Keynote, and Google Slides for easy customization and seamless presentation design.


23 diapositivas
Pomona Business Plan Presentation
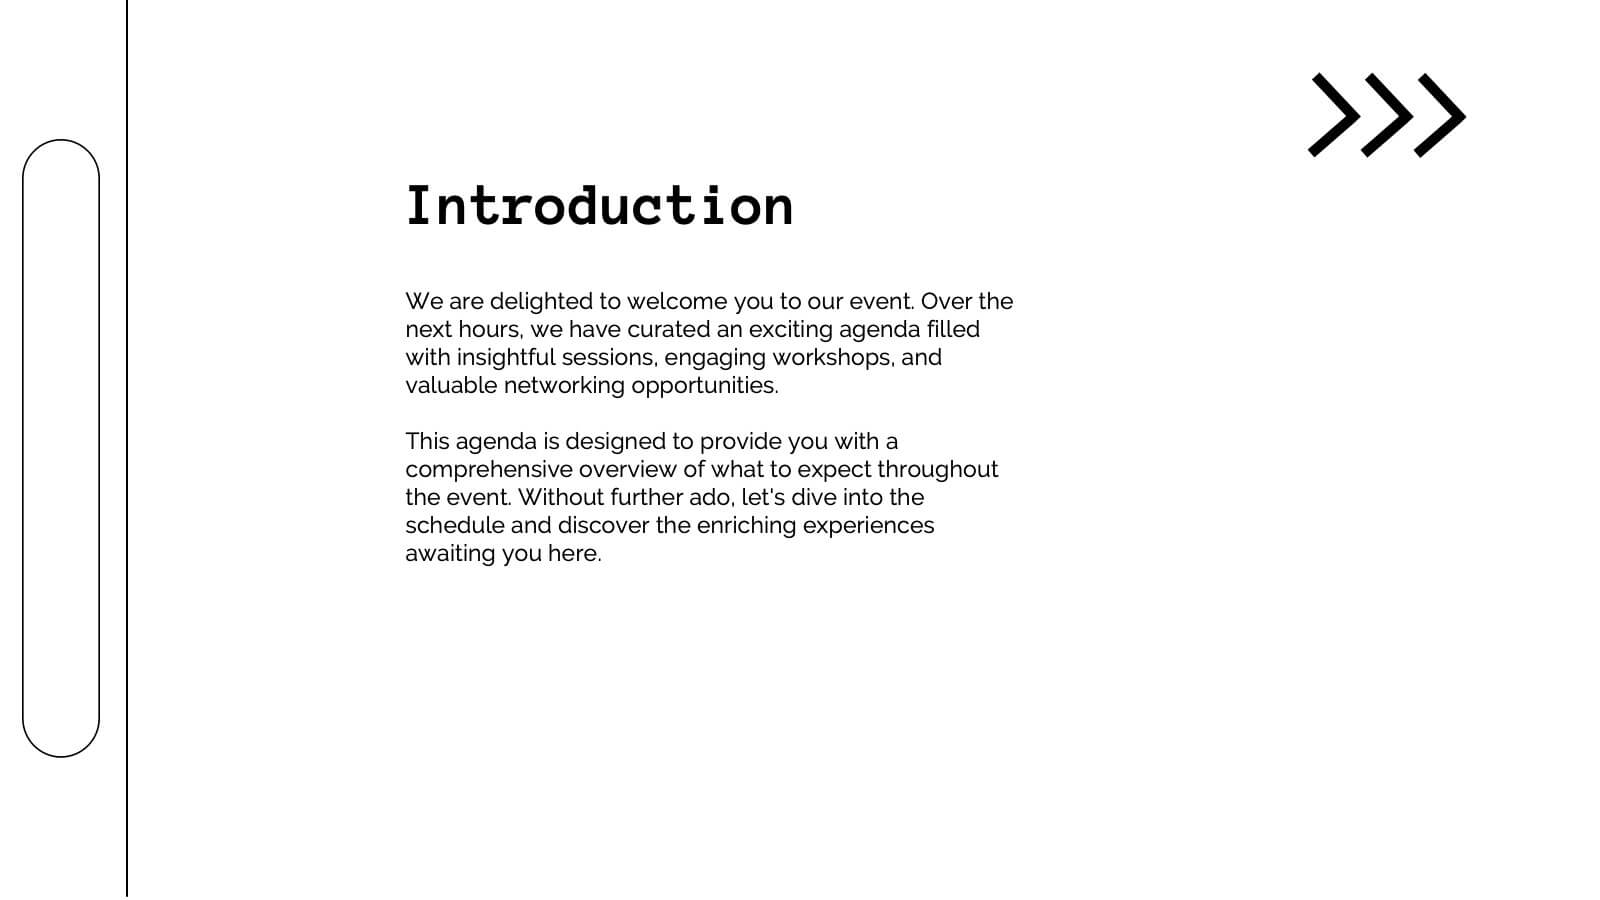
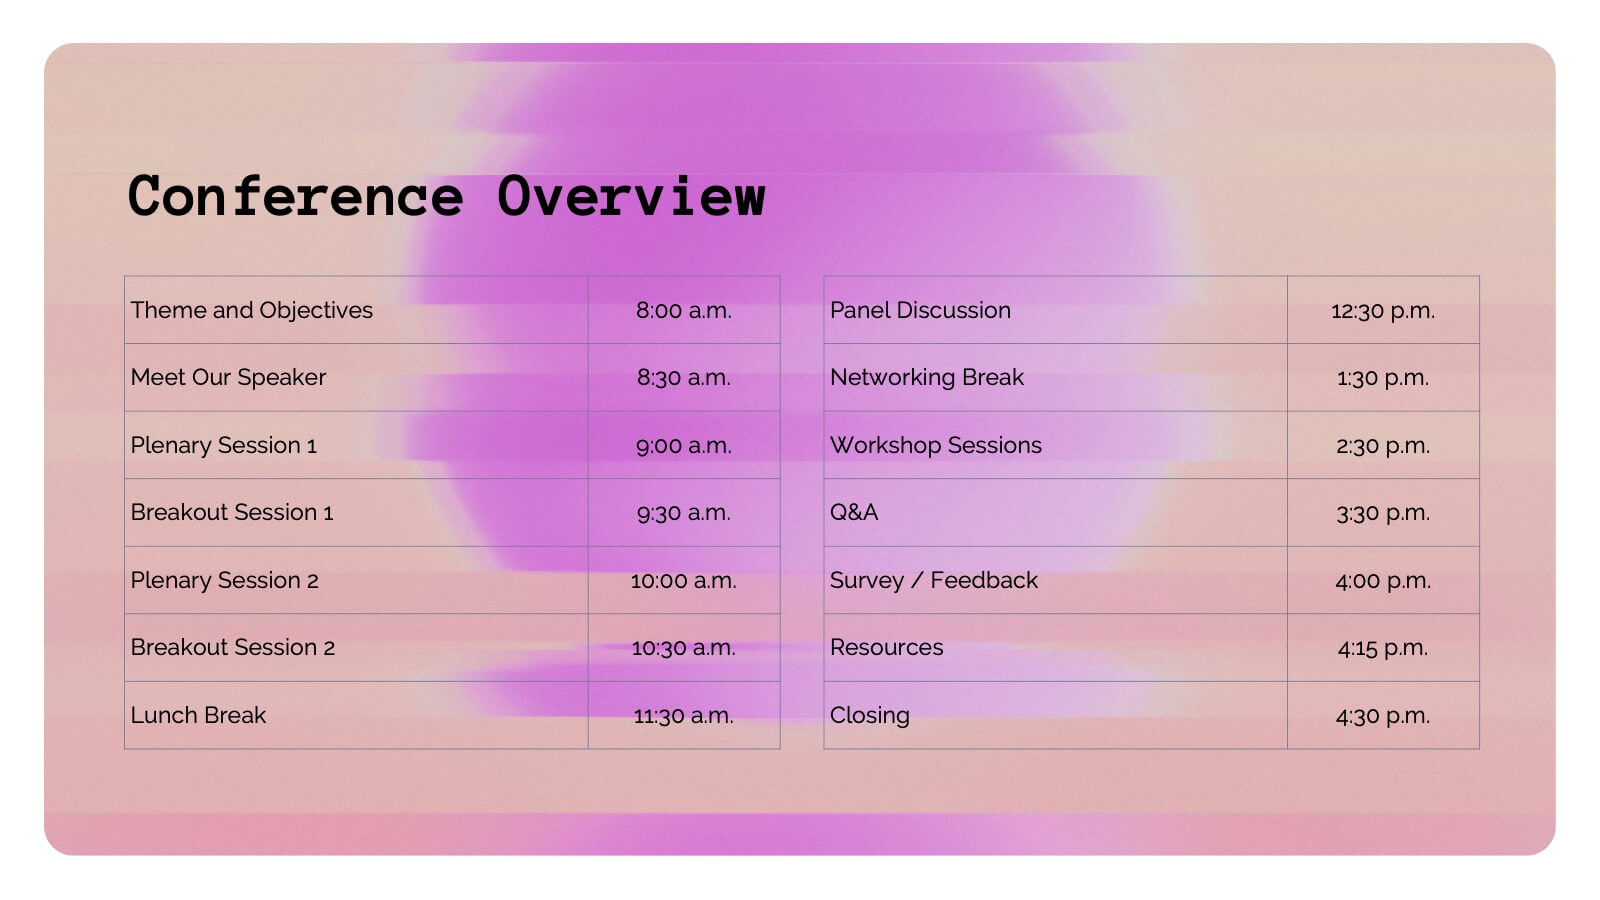
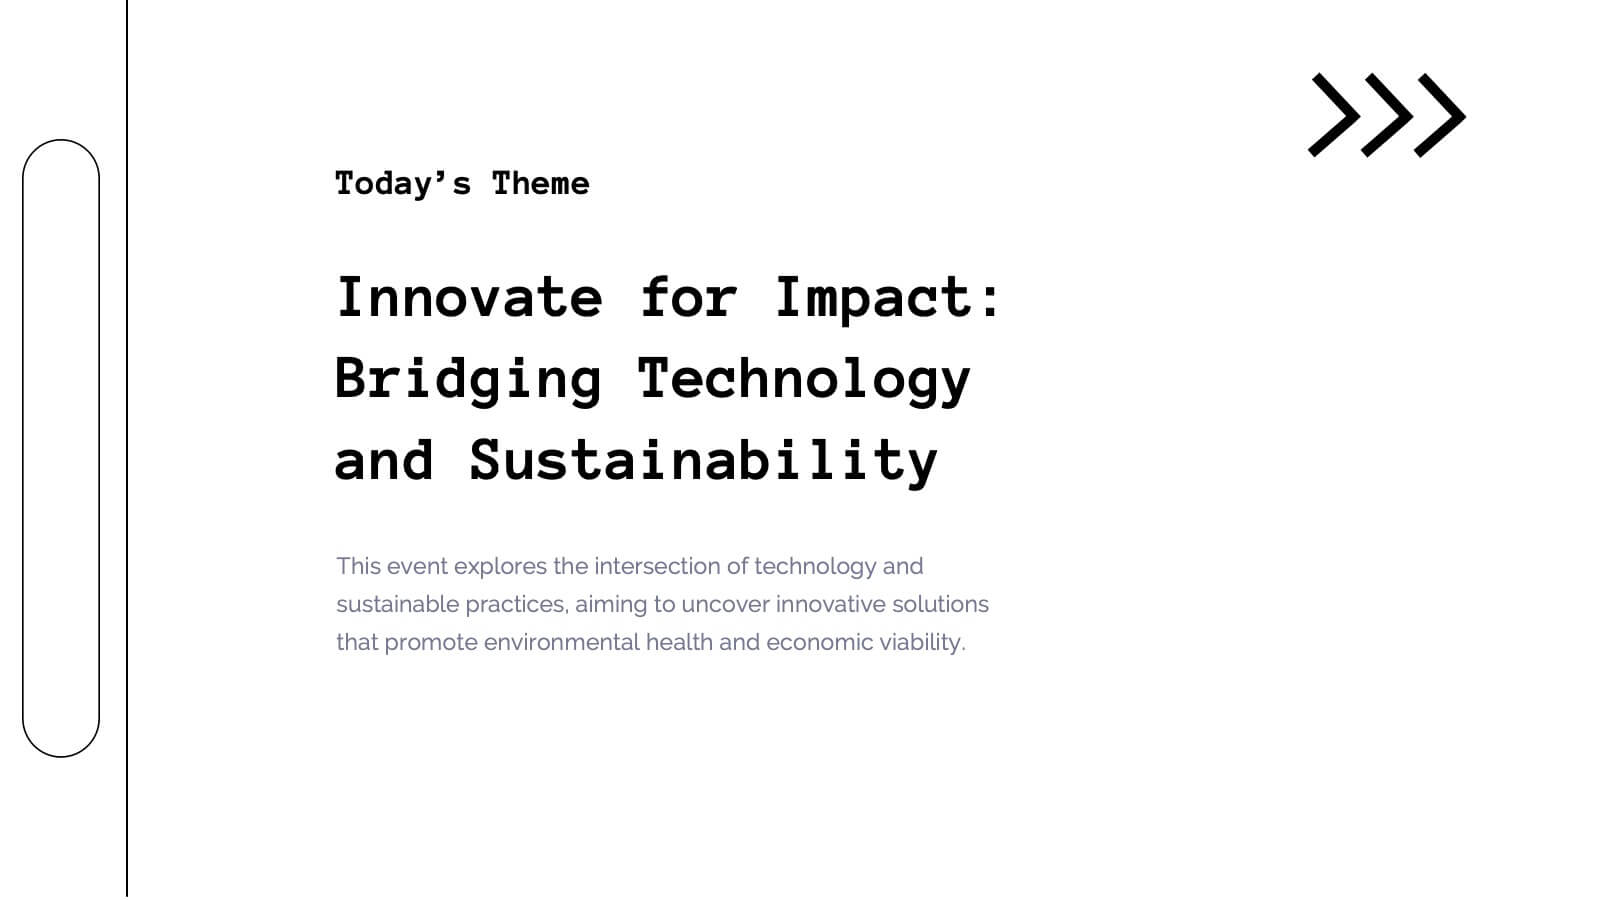
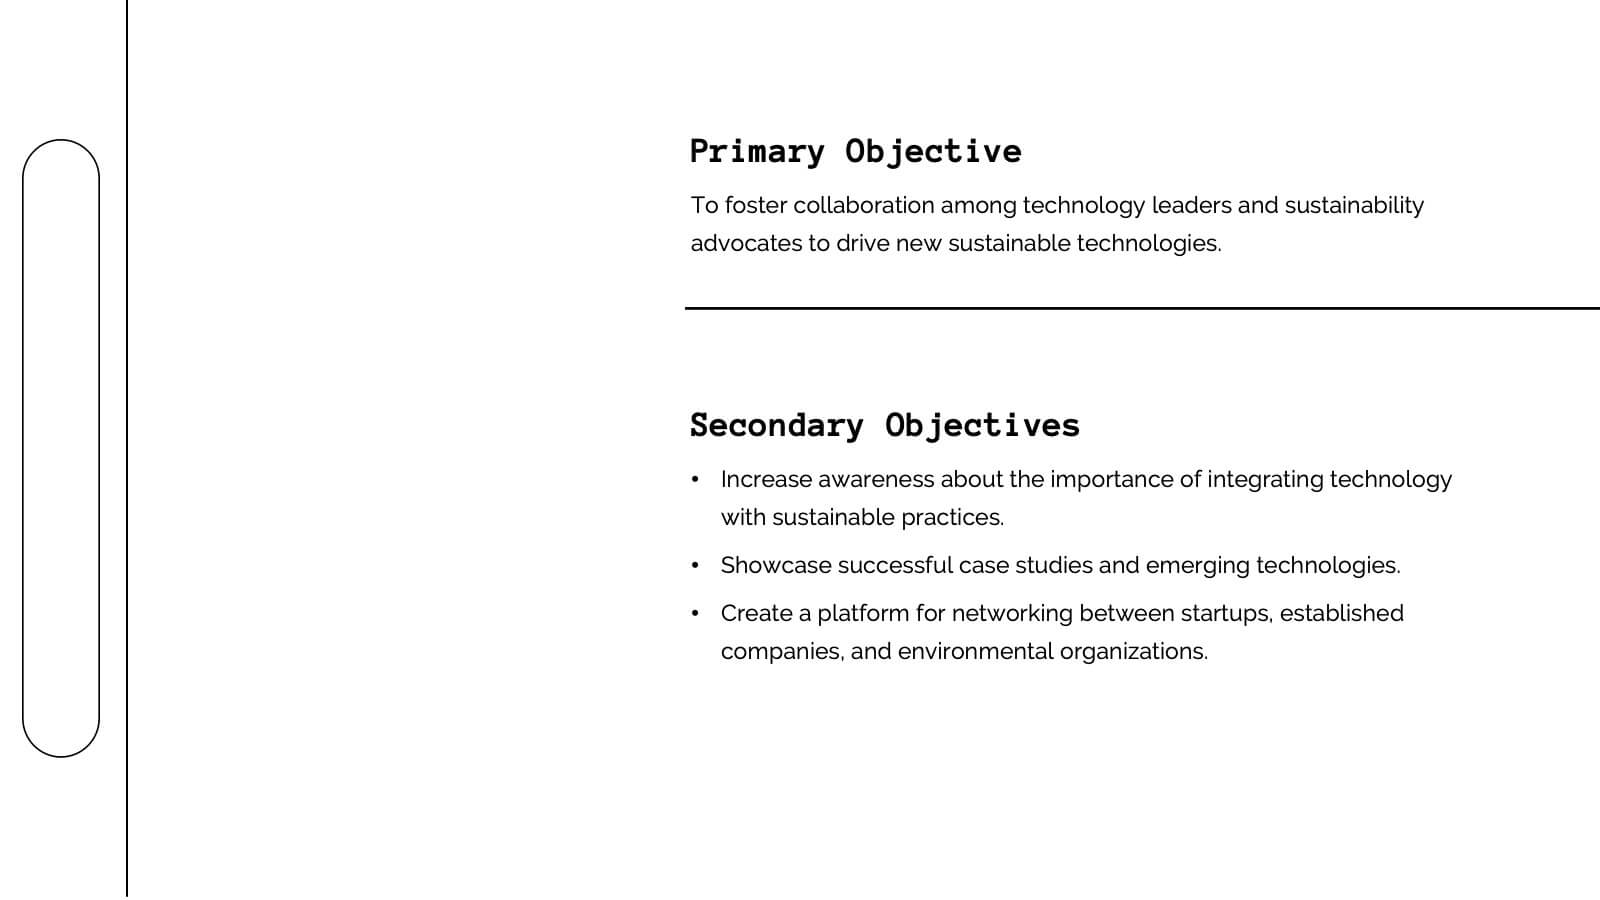
This vibrant and adaptable event agenda template is perfect for organizing your business conference or corporate event. It includes customizable sections for session details, speaker information, and key activities like networking breaks, workshops, and panel discussions. Compatible with PowerPoint, Keynote, and Google Slides, it ensures a smooth and engaging event presentation experience!


6 diapositivas
Information Security Risk Analysis Presentation
Identify weak points before they become real threats. This information security risk analysis template makes it easy to present cybersecurity vulnerabilities, data protection gaps, and action plans in a visual and professional way. Ideal for IT audits or strategy meetings. Fully editable in PowerPoint, Keynote, and Google Slides.


8 diapositivas
4-Quadrant Matrix Presentation
The "4-Quadrant Matrix Presentation" template is meticulously designed for strategic analysis and planning, perfect for visualizing business data across four key areas. Each quadrant highlights a distinct category, allowing for a comprehensive breakdown of information such as performance metrics, risk assessments, market trends, or operational efficiency. The template is color-coded to distinguish between the quadrants, making it visually engaging and easy to understand. Icons within each quadrant can be customized to symbolize different business functions or data points, enhancing the clarity and effectiveness of the presentation. This tool is ideal for executives, managers, and analysts who need to present complex data in a structured and insightful way, enabling informed decision-making and strategic planning in corporate settings.


6 diapositivas
South America Language Map Infographics
South America is located in the Western Hemisphere and is known for its diverse landscapes, cultures, and countries. This infographic template can provide a visual representation of the countries and key information about the continent's geography, culture, economy, and more. This template is designed to help your audience gain insights into the diverse and rich continent, making it a valuable tool for educational, promotional, and informative purposes. This map infographic can be shared on websites, social media platforms, presentations, and marketing materials targeting audiences interested in South America.


4 diapositivas
Corporate Company Profile Overview Presentation
Present your business story with clarity and impact using this sleek company profile layout. Designed for corporate overviews, it highlights key points alongside a modern visual backdrop. Ideal for executive summaries, strategy decks, or investor briefings—fully editable in PowerPoint, Keynote, and Google Slides for effortless customization and professional results.
8 diapositivas
Business Growth and Progress Tracking Presentation
Visualize success with this upward-arrow roadmap template designed to highlight four key stages of business development. Ideal for managers, analysts, and entrepreneurs, this slide uses milestone icons and clean, directional layout to emphasize progress. Fully editable in PowerPoint, Keynote, and Google Slides for seamless customization.


5 diapositivas
Business Overview and Highlights Summary
Summarize your company’s key milestones with this Business Overview and Highlights Summary slide. Featuring a clean layout with a bold briefcase visual and four spotlight areas, it’s ideal for showcasing achievements. Fully editable in PowerPoint, Keynote, and Google Slides.


5 diapositivas
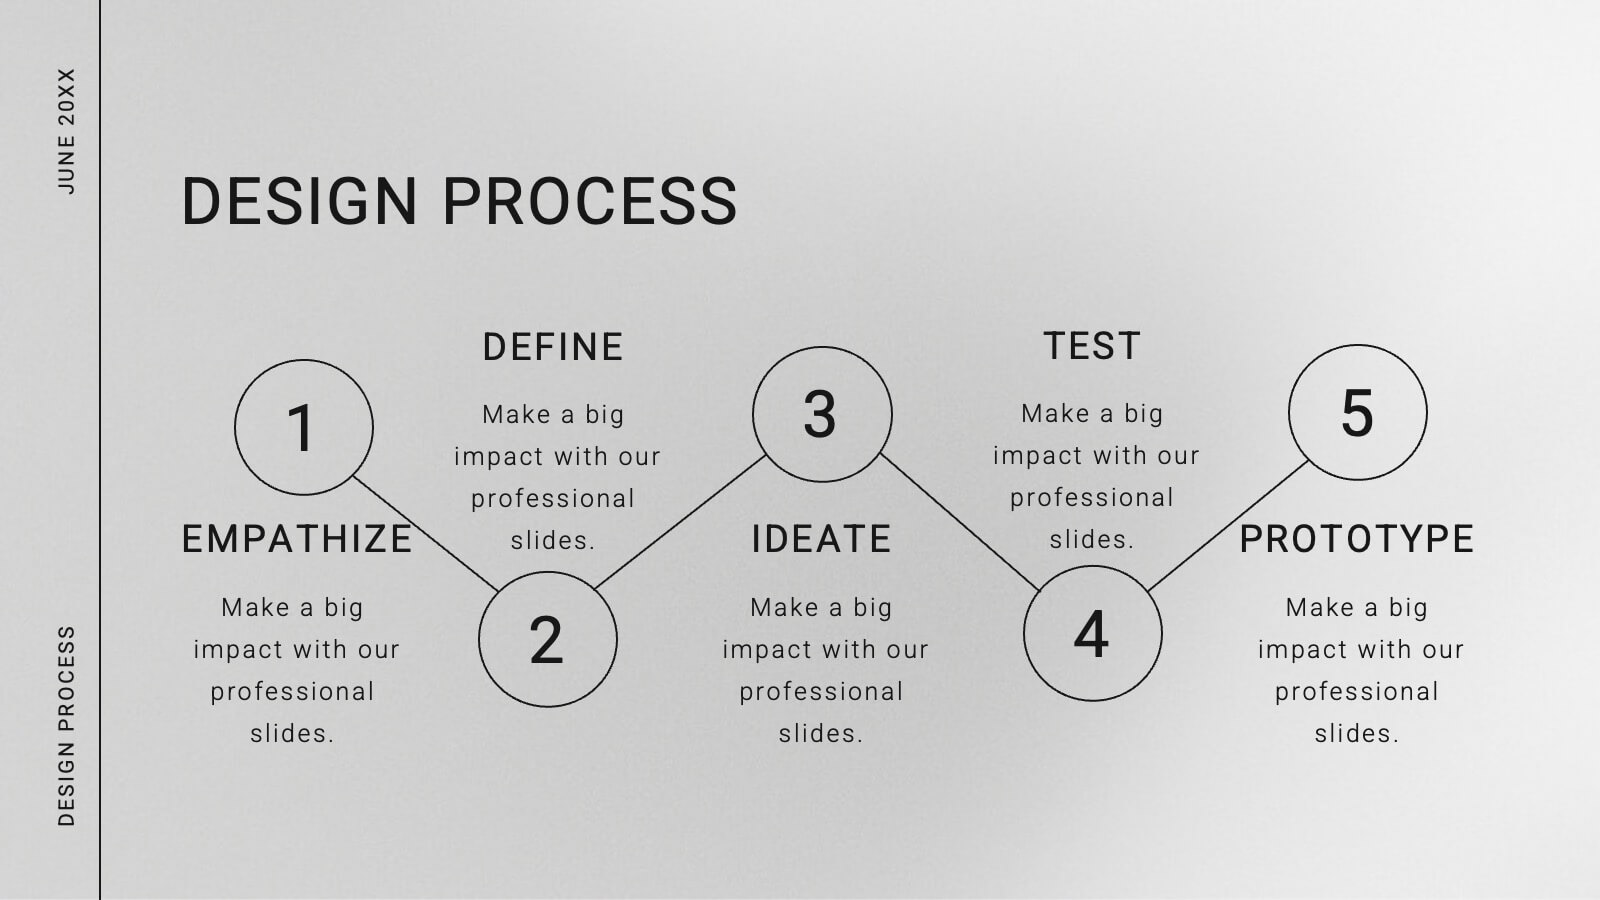
Empathy to Ideation Process Framework Presentation
Visualize the journey from understanding user needs to generating innovative ideas with the Empathy to Ideation Process Framework Presentation. This slide features a side-profile silhouette and five clear, horizontal stages, each representing a key step in design thinking. Ideal for innovation workshops, UX strategy sessions, or educational use. Fully editable in Canva, PowerPoint, Google Slides, and Keynote.


20 diapositivas
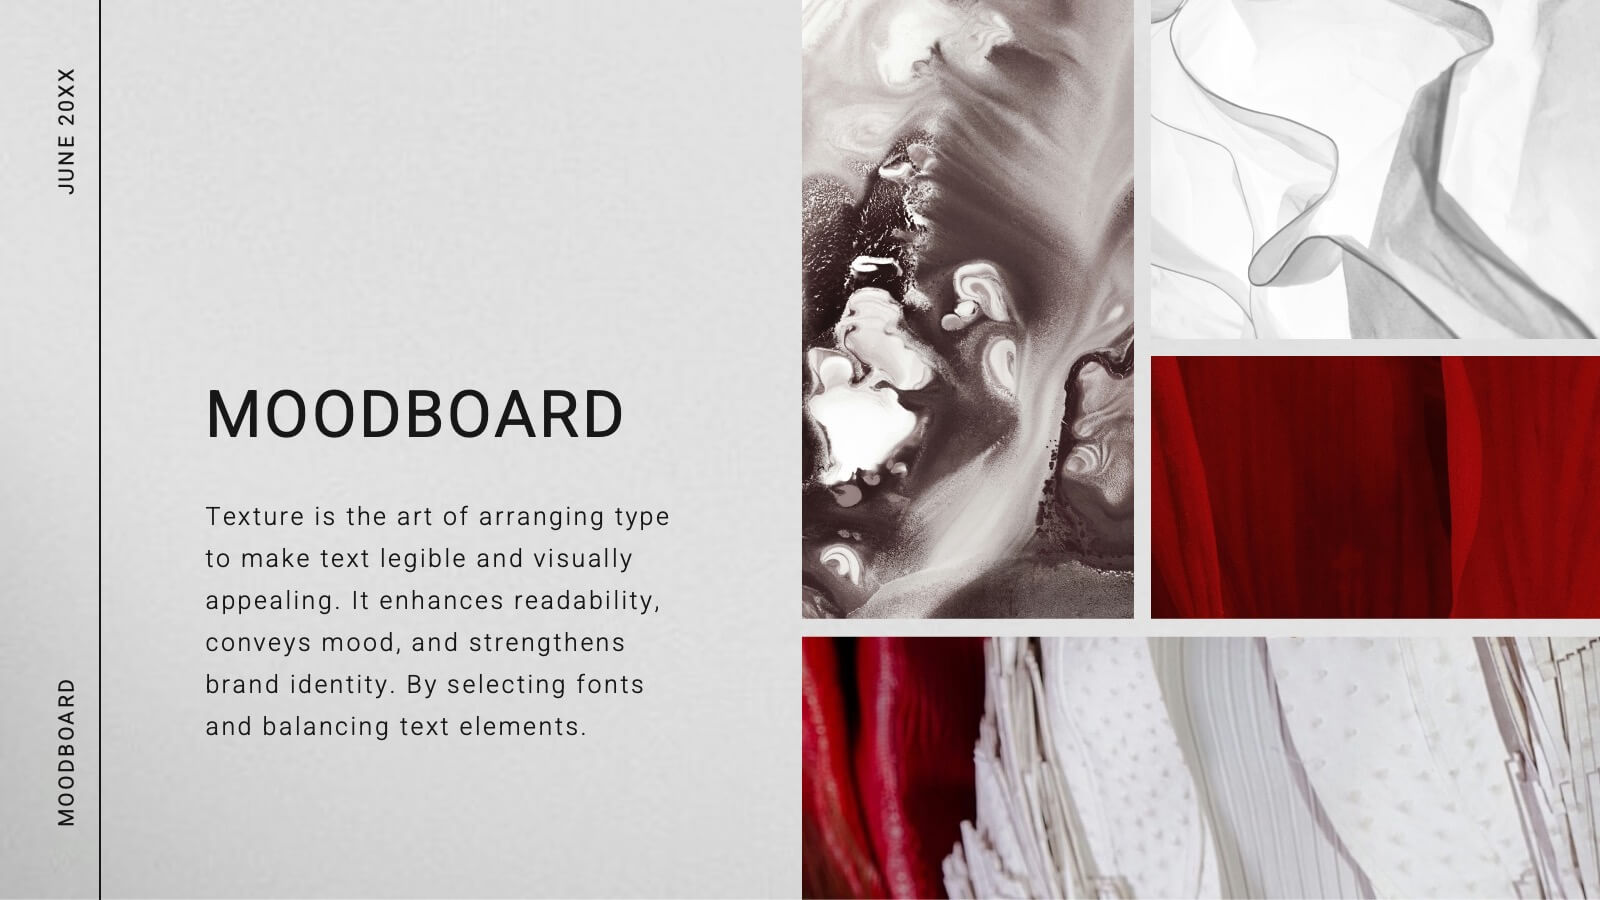
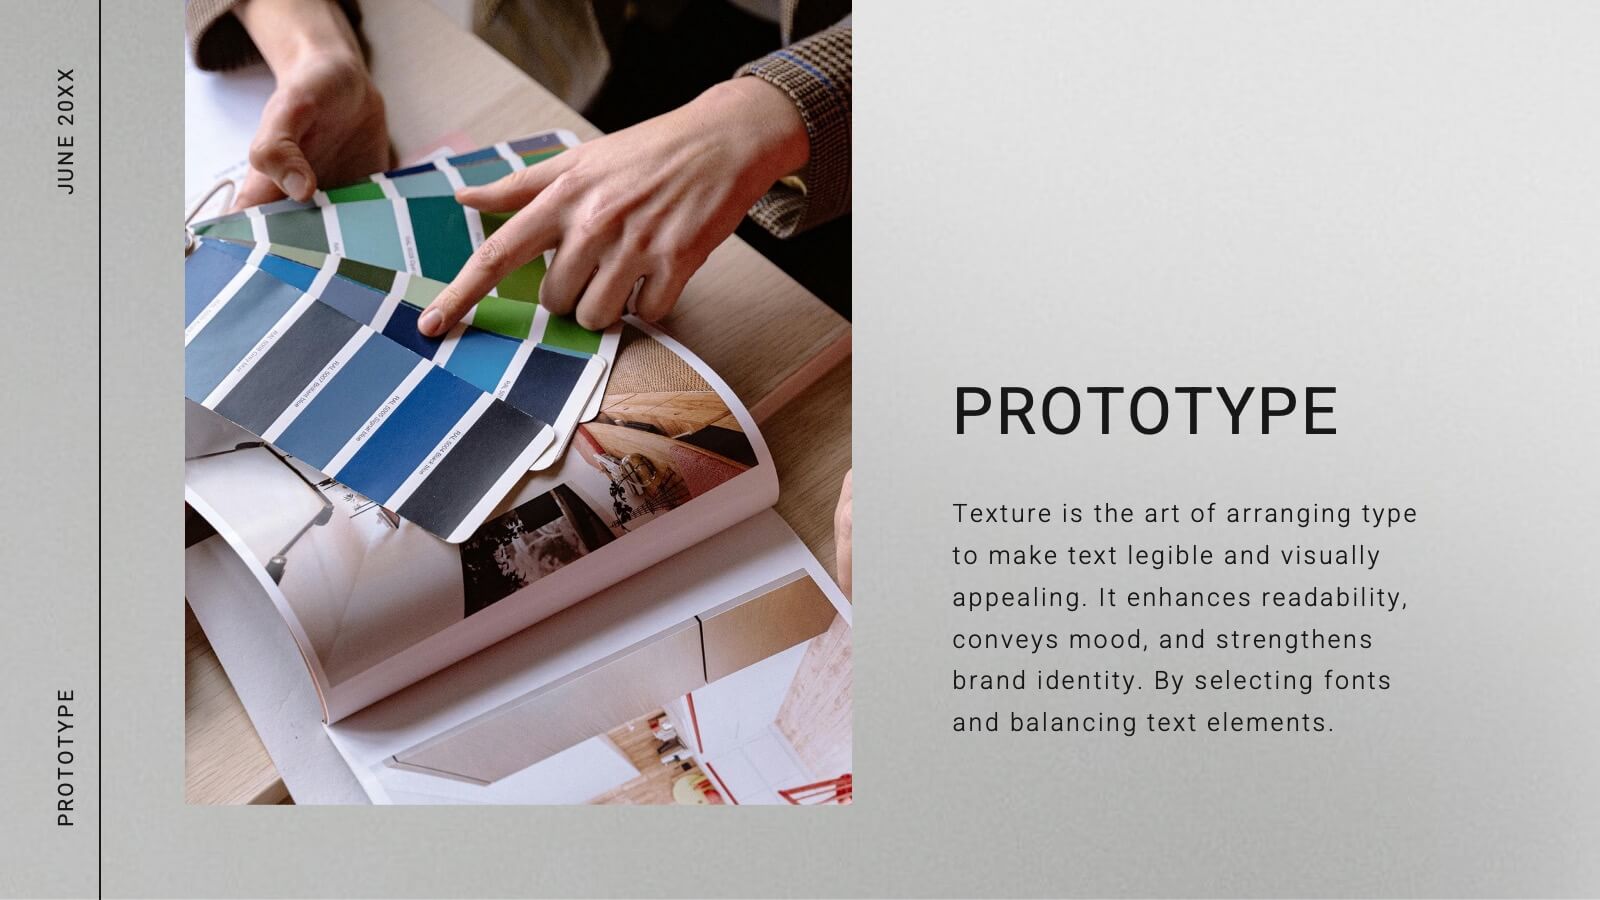
Comet Graphic Design Project Plan Presentation
Craft stunning design project presentations with this elegant template. Showcase objectives, processes, mood boards, and final designs effectively. Ideal for creative teams and clients. Fully compatible with PowerPoint, Keynote, and Google Slides.


10 diapositivas
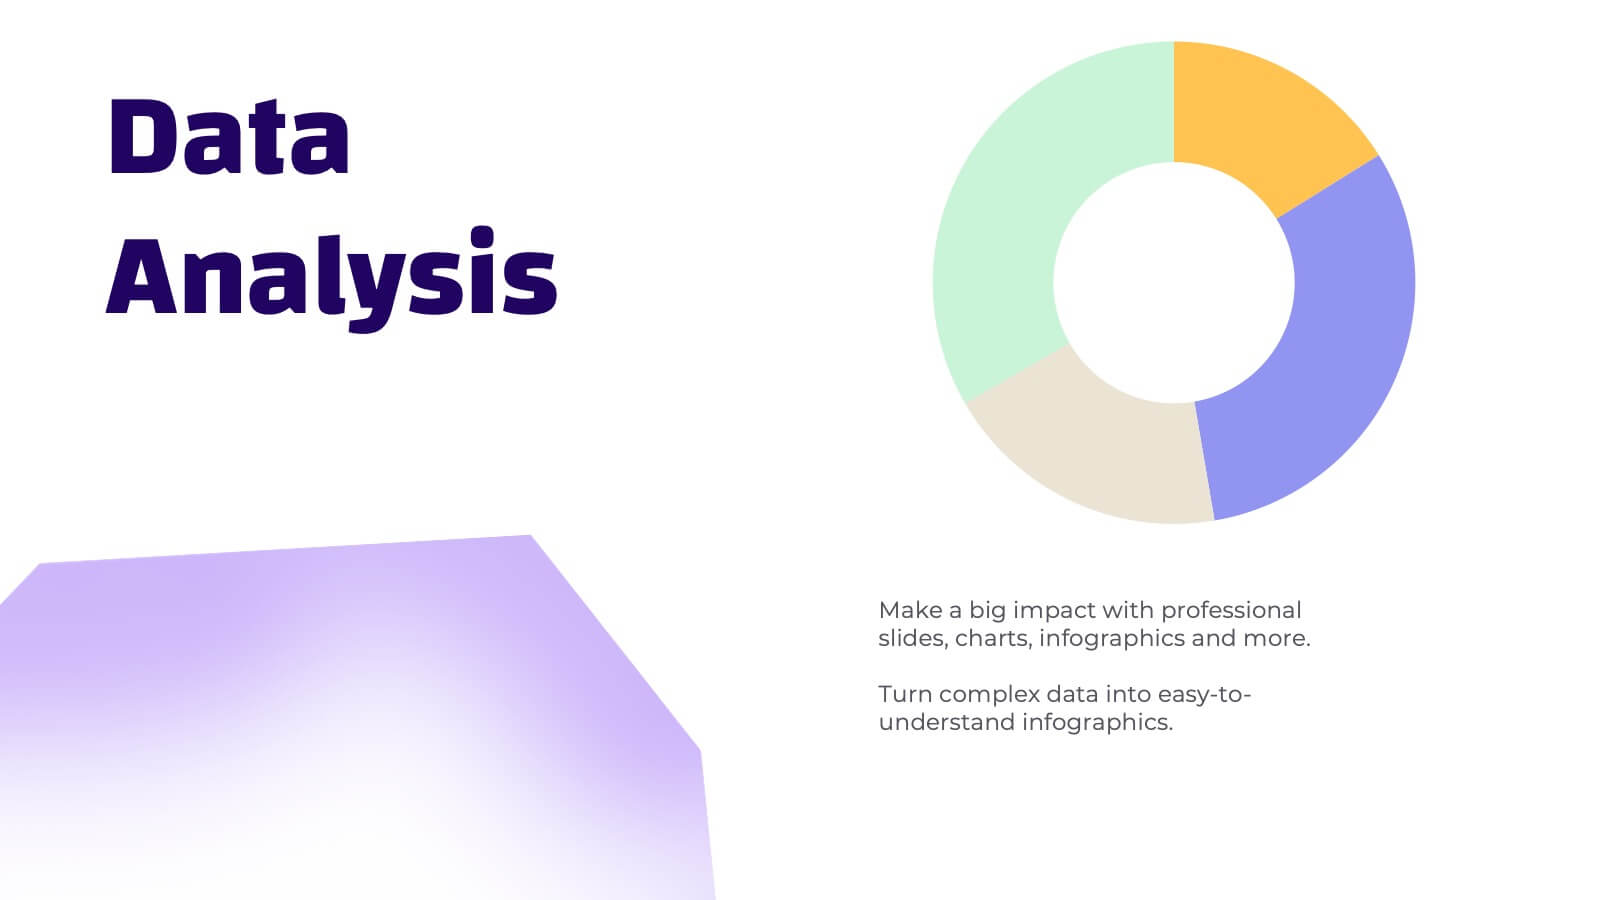
Business Data Charts Presentation
Visualize insights with precision using this Business Data Charts Presentation Template. Featuring clean, colorful doughnut charts and clearly labeled segments, it’s ideal for showcasing survey results, KPI breakdowns, or performance metrics. Designed for professionals who want sleek data visuals, and fully customizable in PowerPoint, Keynote, and Google Slides.


6 diapositivas
Ideal Customer Profile Infographic
A customer profile, also known as a buyer persona, is a detailed and semi-fictional representation of your ideal customer. This infographic template can help businesses visualize and communicate their target audience characteristics and preferences. This template is a valuable tool for educating your team and clients about your ideal customer profile. This customer profile infographic can help your team align their efforts towards effectively targeting and engaging the right audience for your products or services. Compatible with Powerpoint, Keynote, and Google Slides. Incorporate your brand's logo and color scheme to maintain consistency.
5 diapositivas
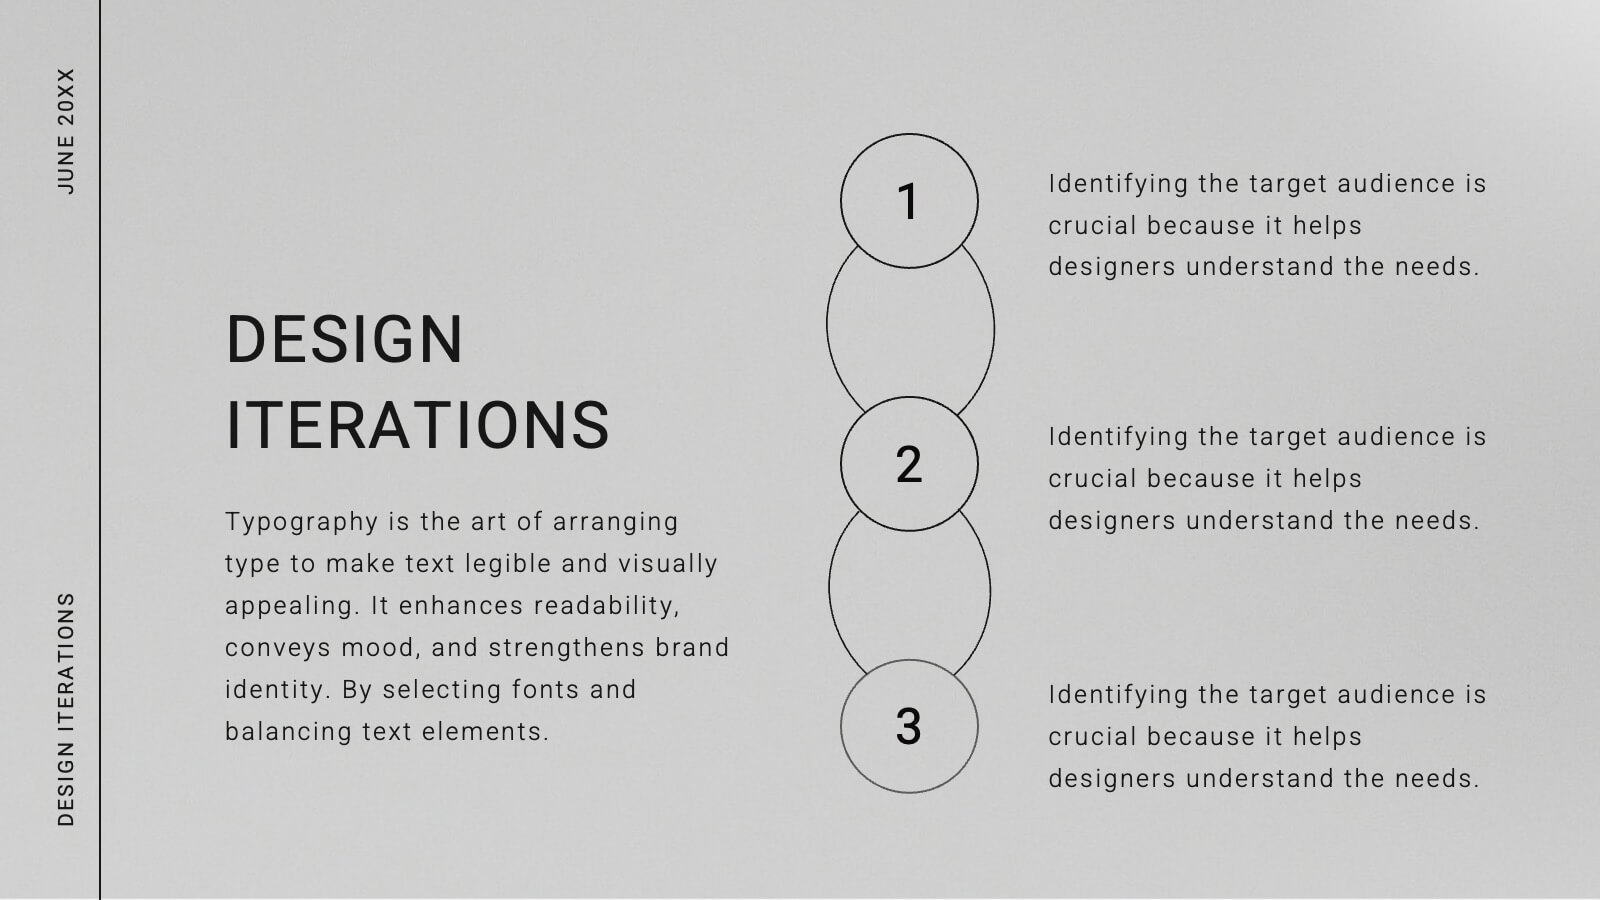
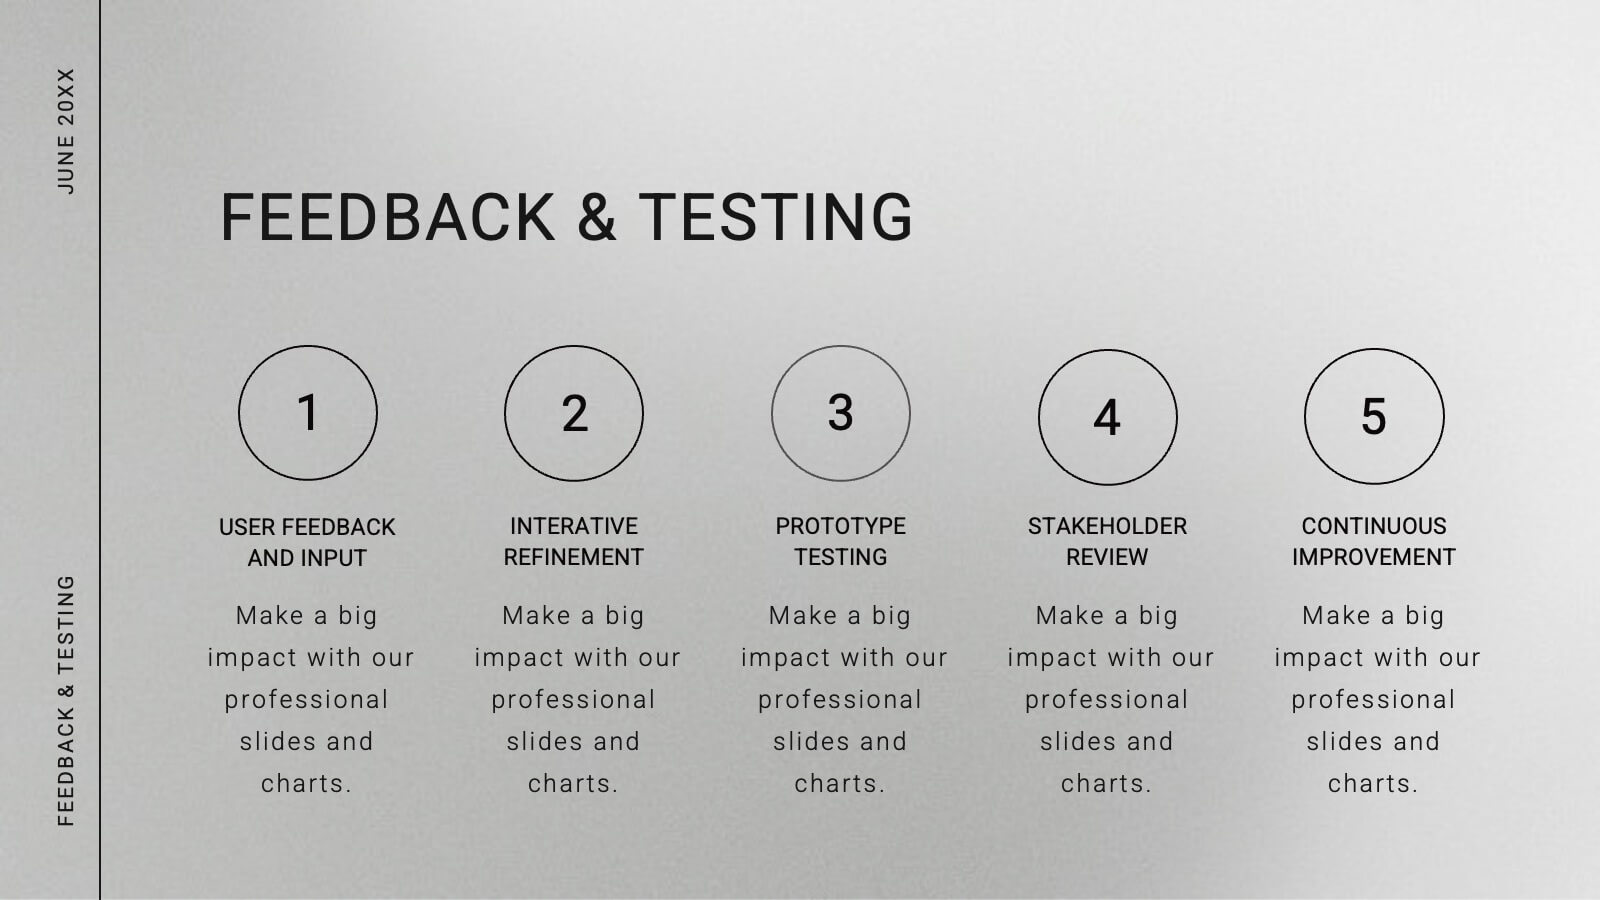
PM Milestone Planning and Tracking Layout Presentation
Track your project progress with clarity using the PM Milestone Planning and Tracking Layout Presentation. This curved arrow timeline visually guides stakeholders through five key stages of your project plan, highlighting each milestone with clear labels. Fully editable in Canva, PowerPoint, Keynote, and Google Slides for flexible use.


23 diapositivas
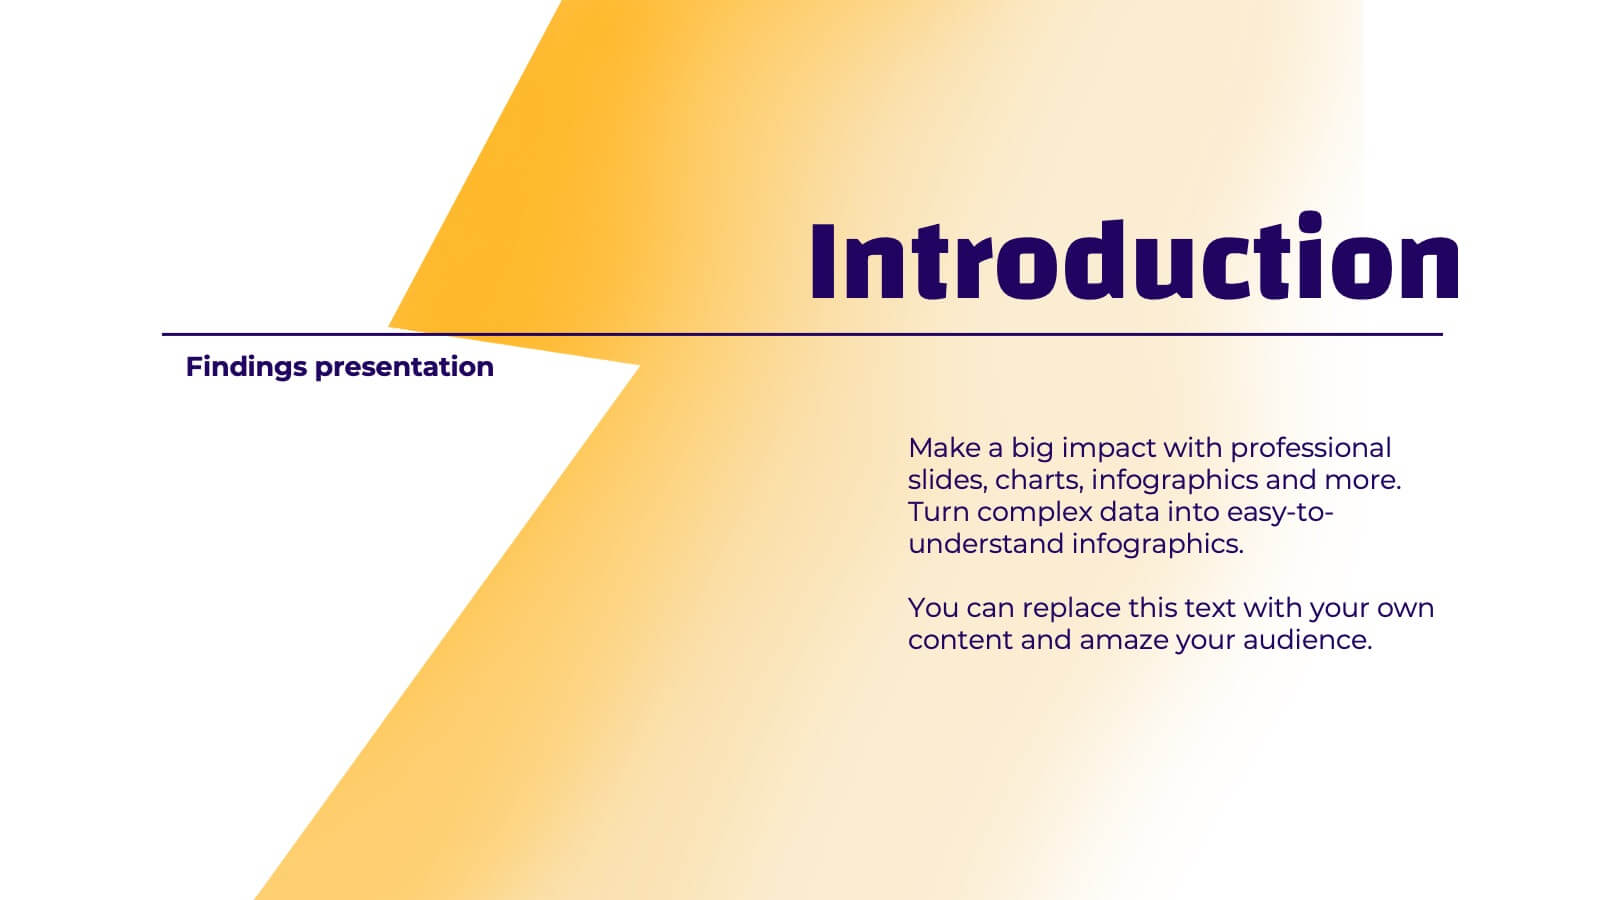
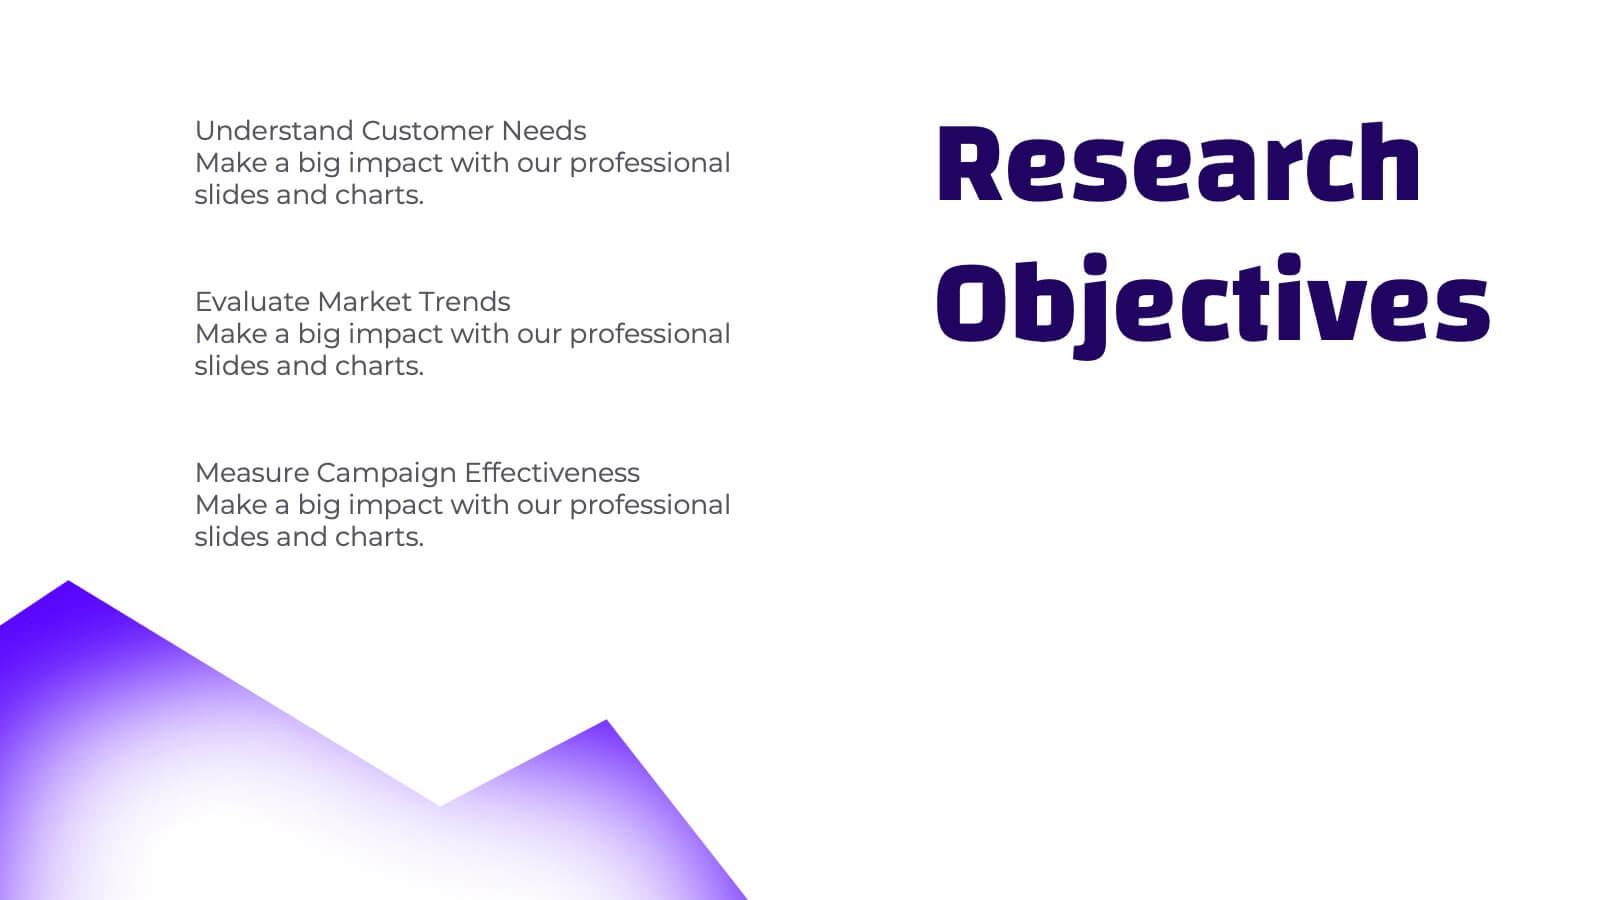
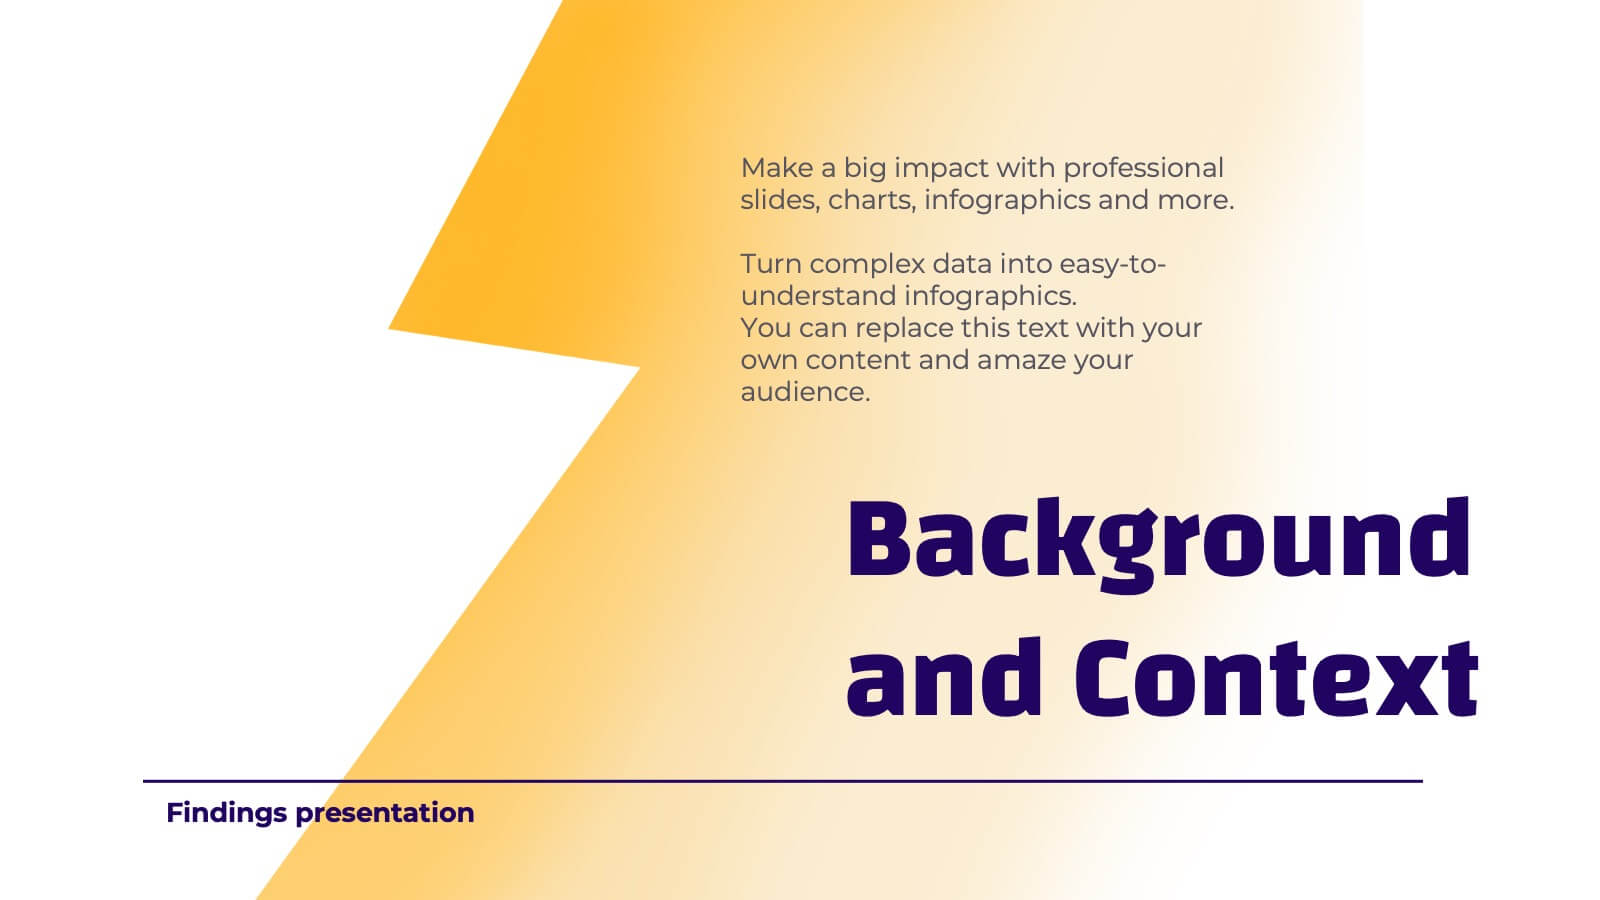
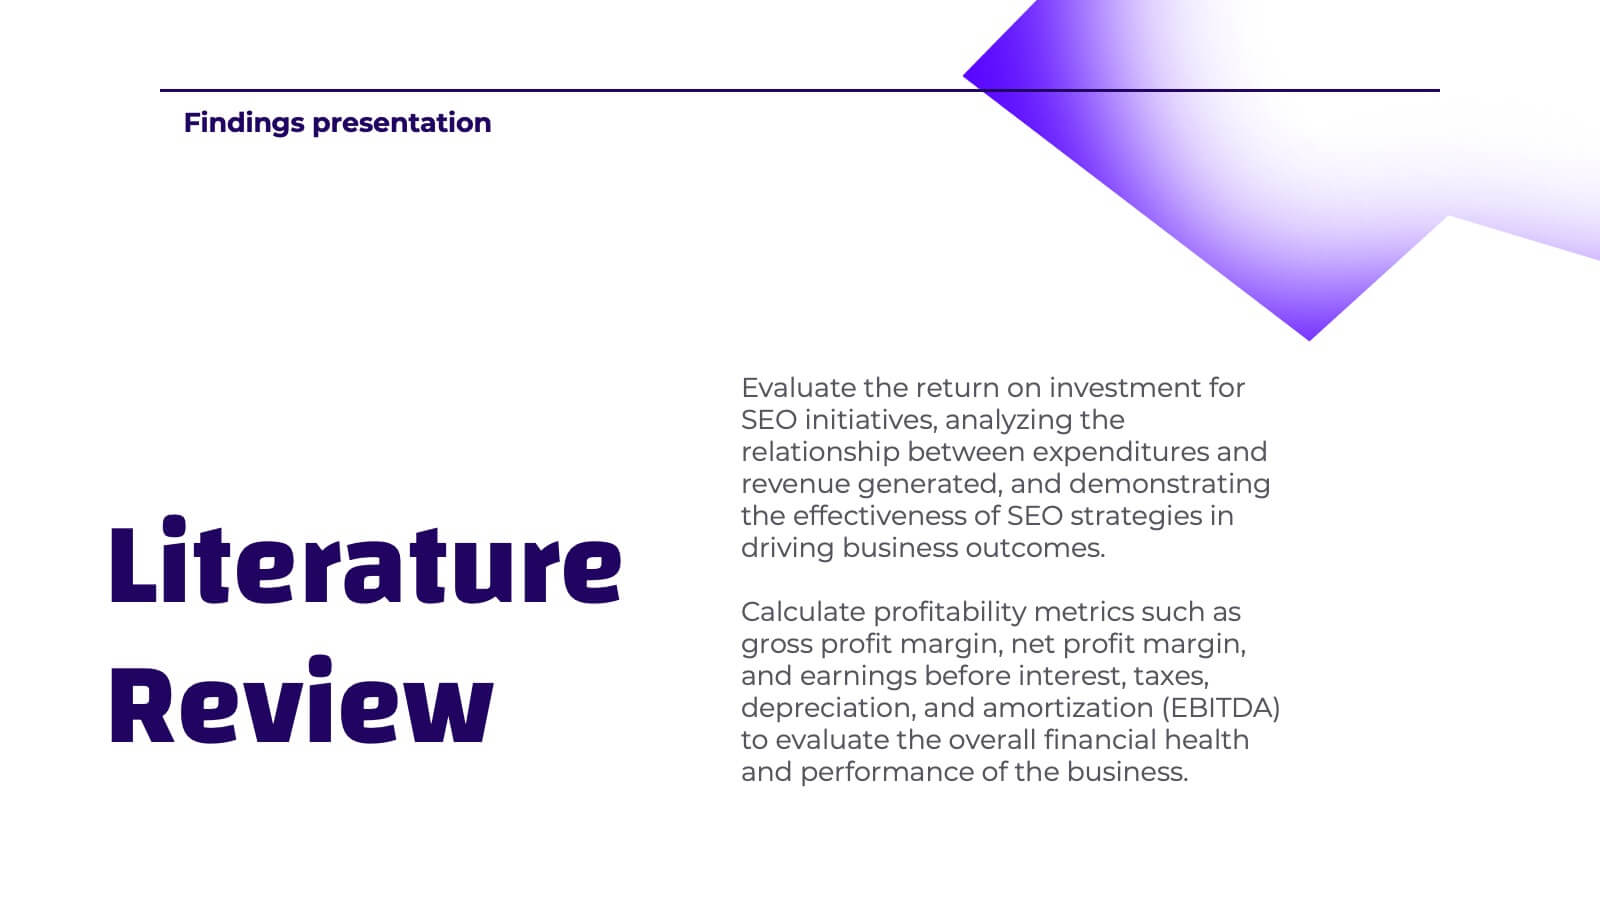
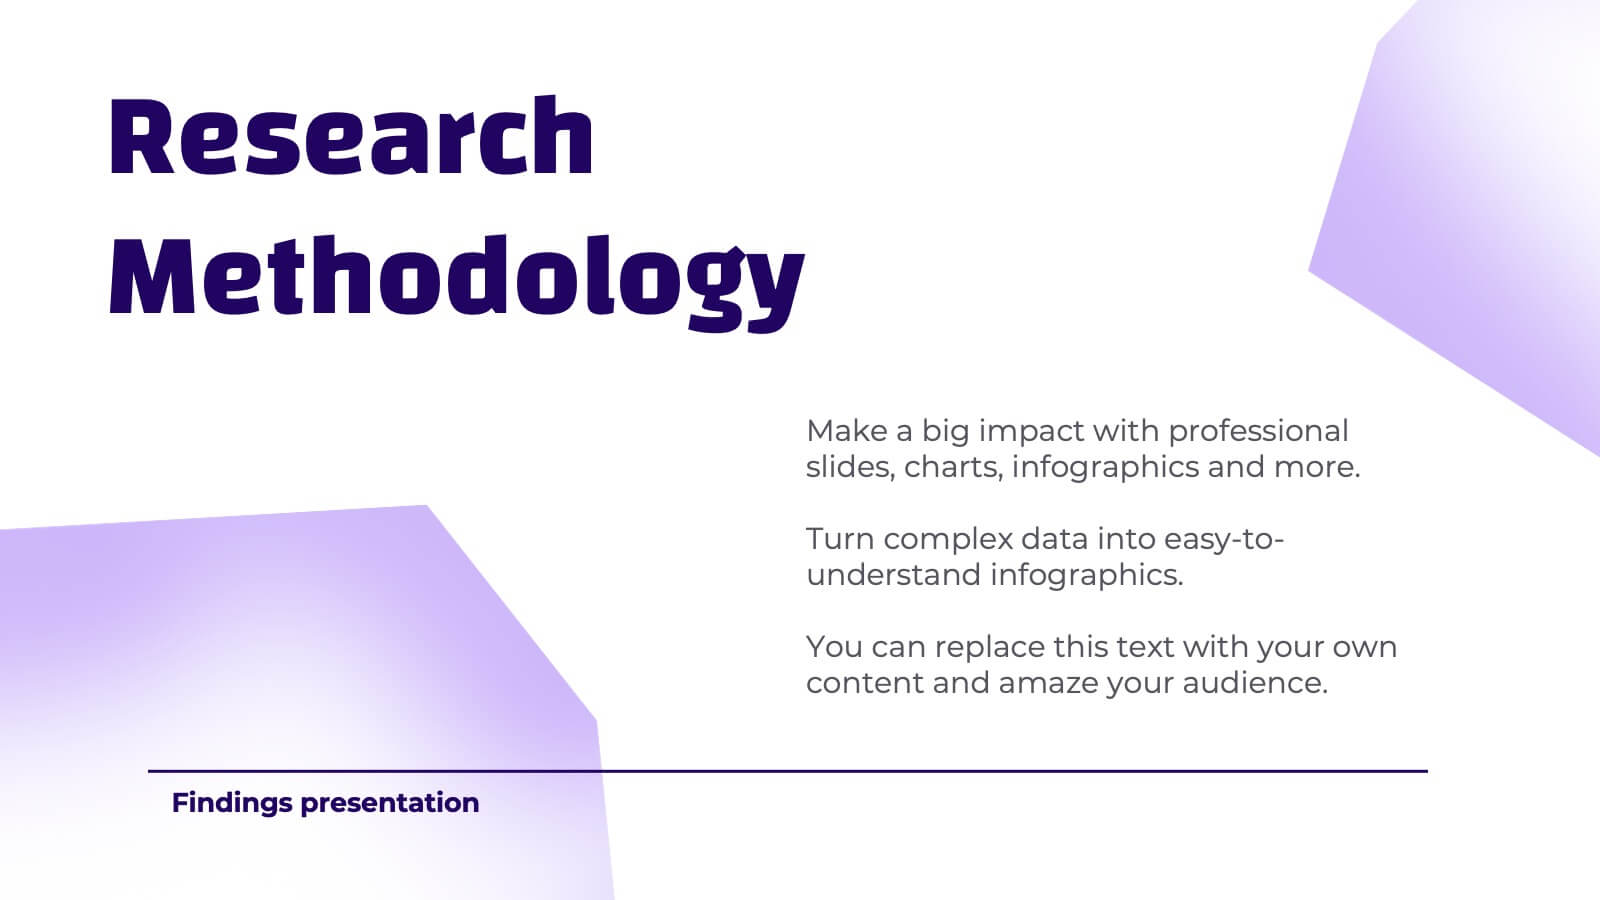
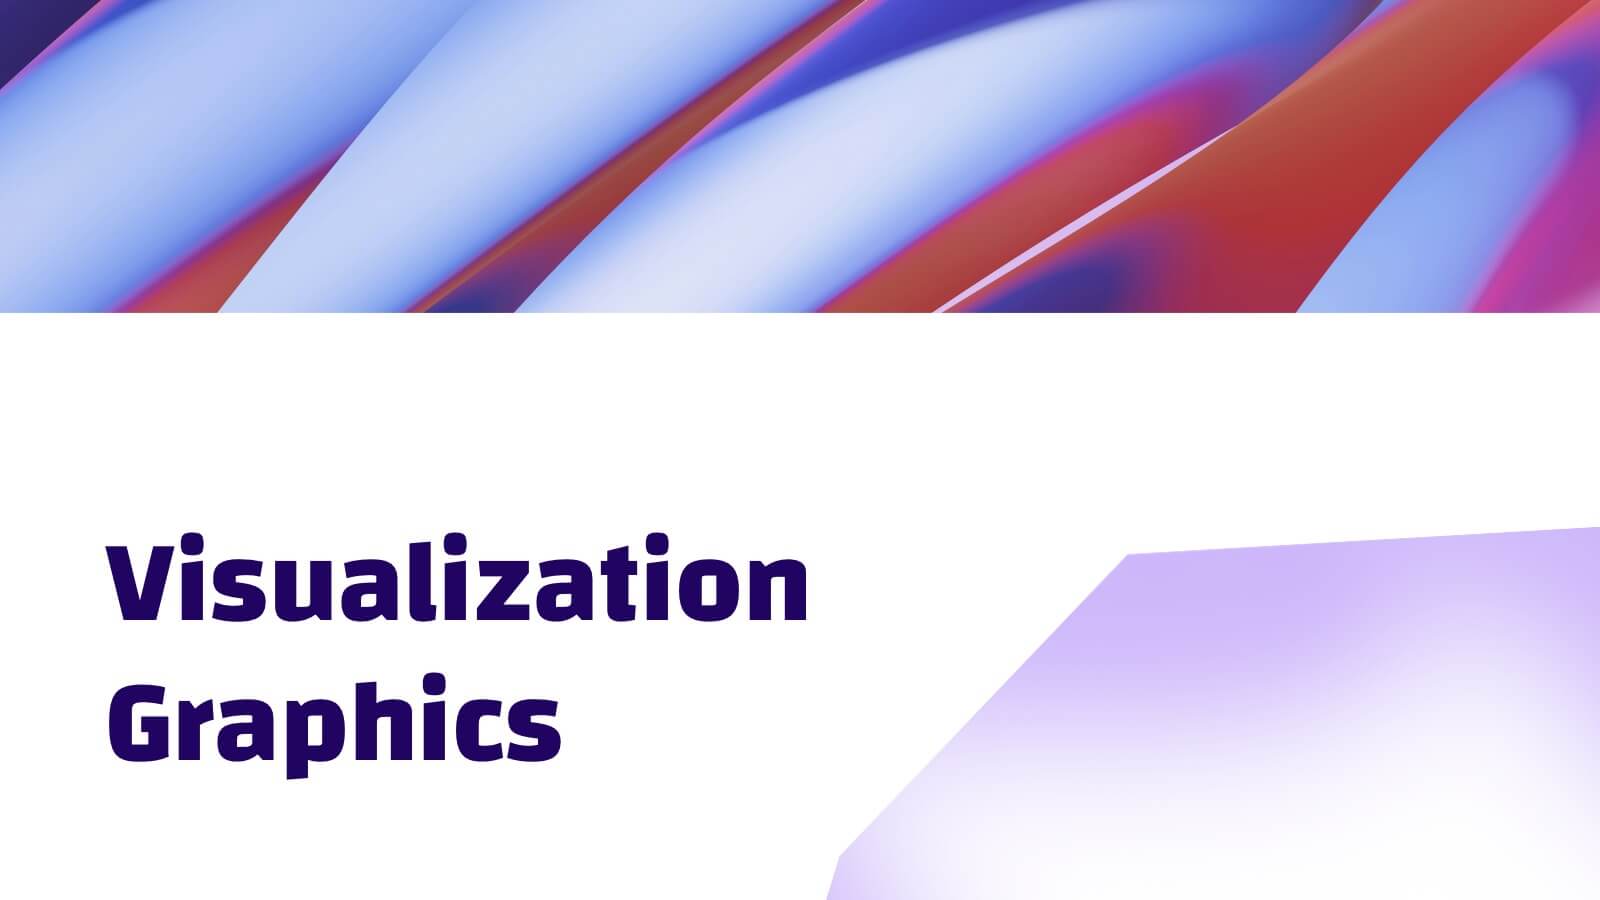
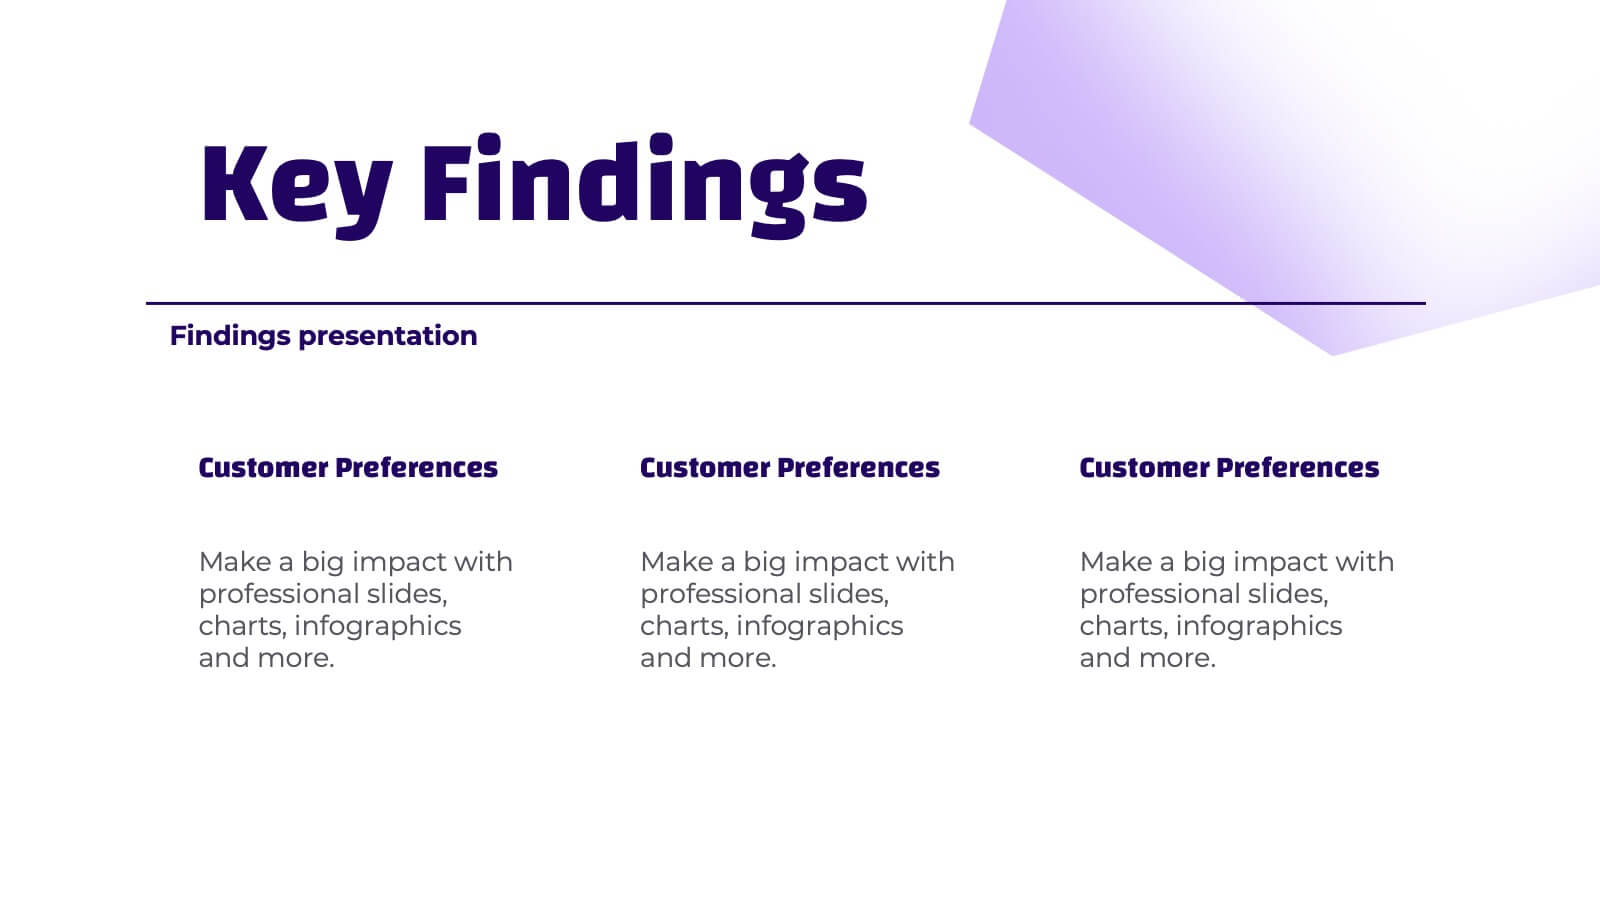
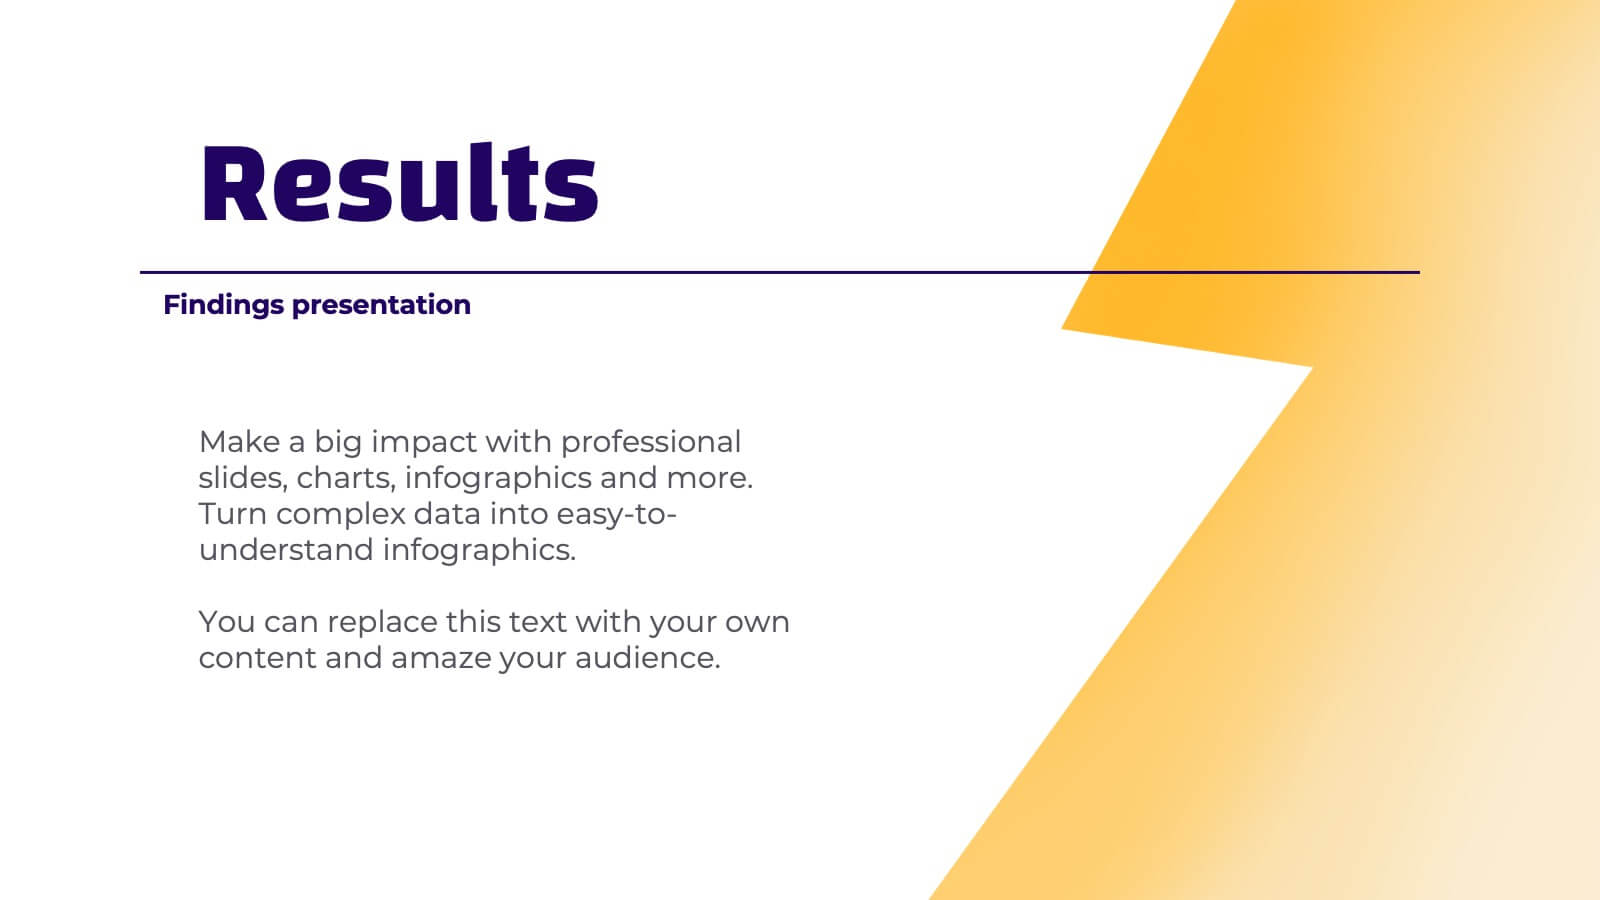
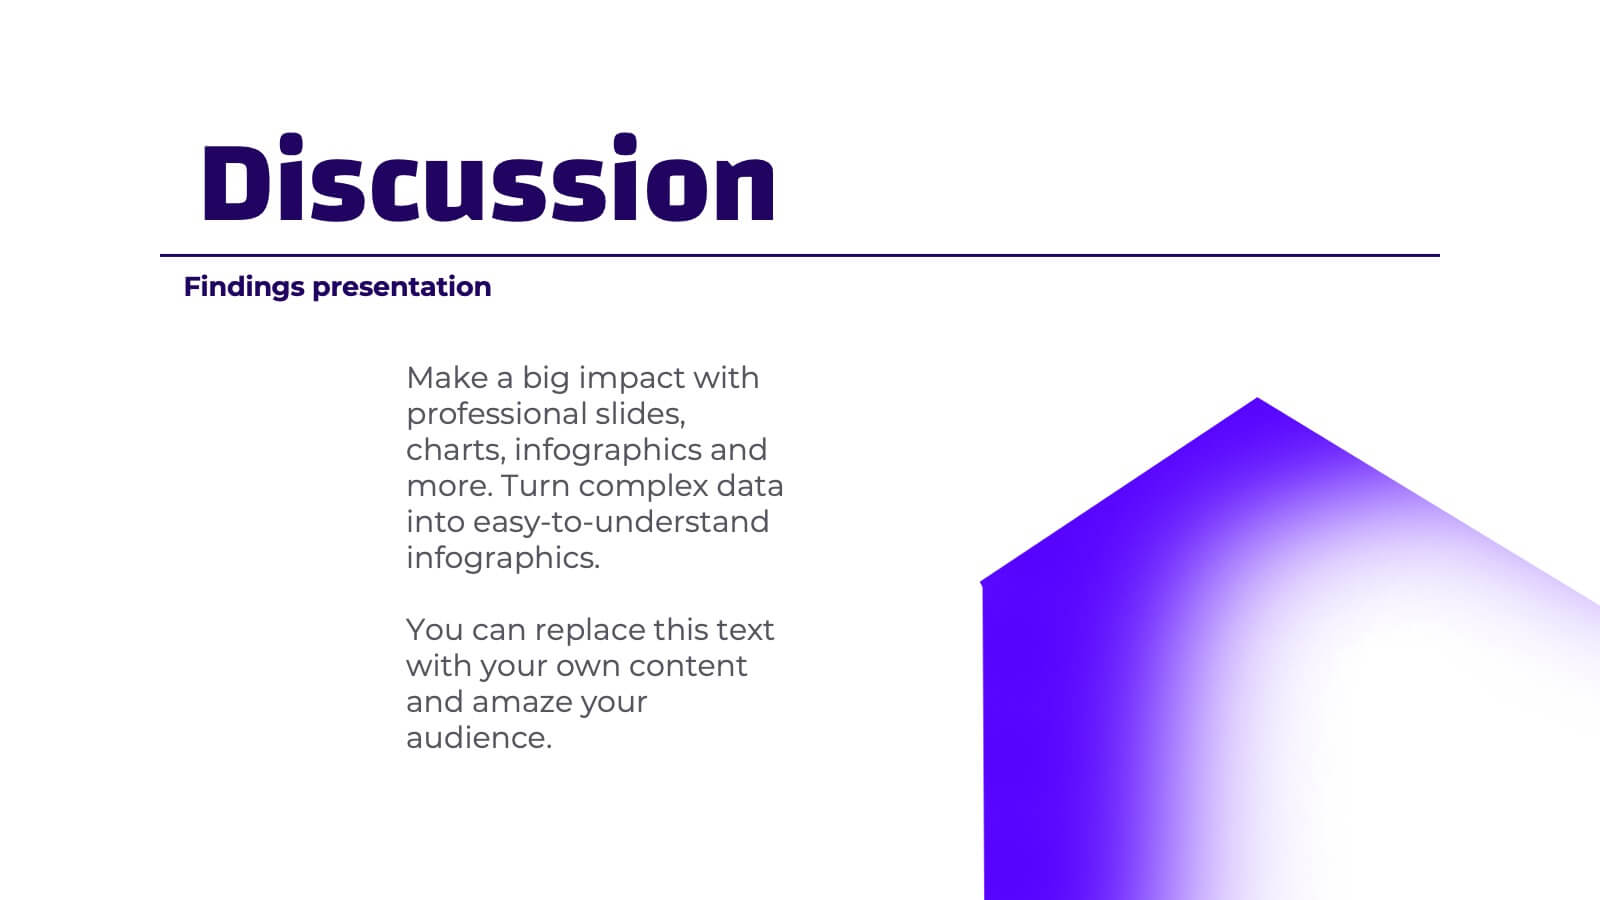
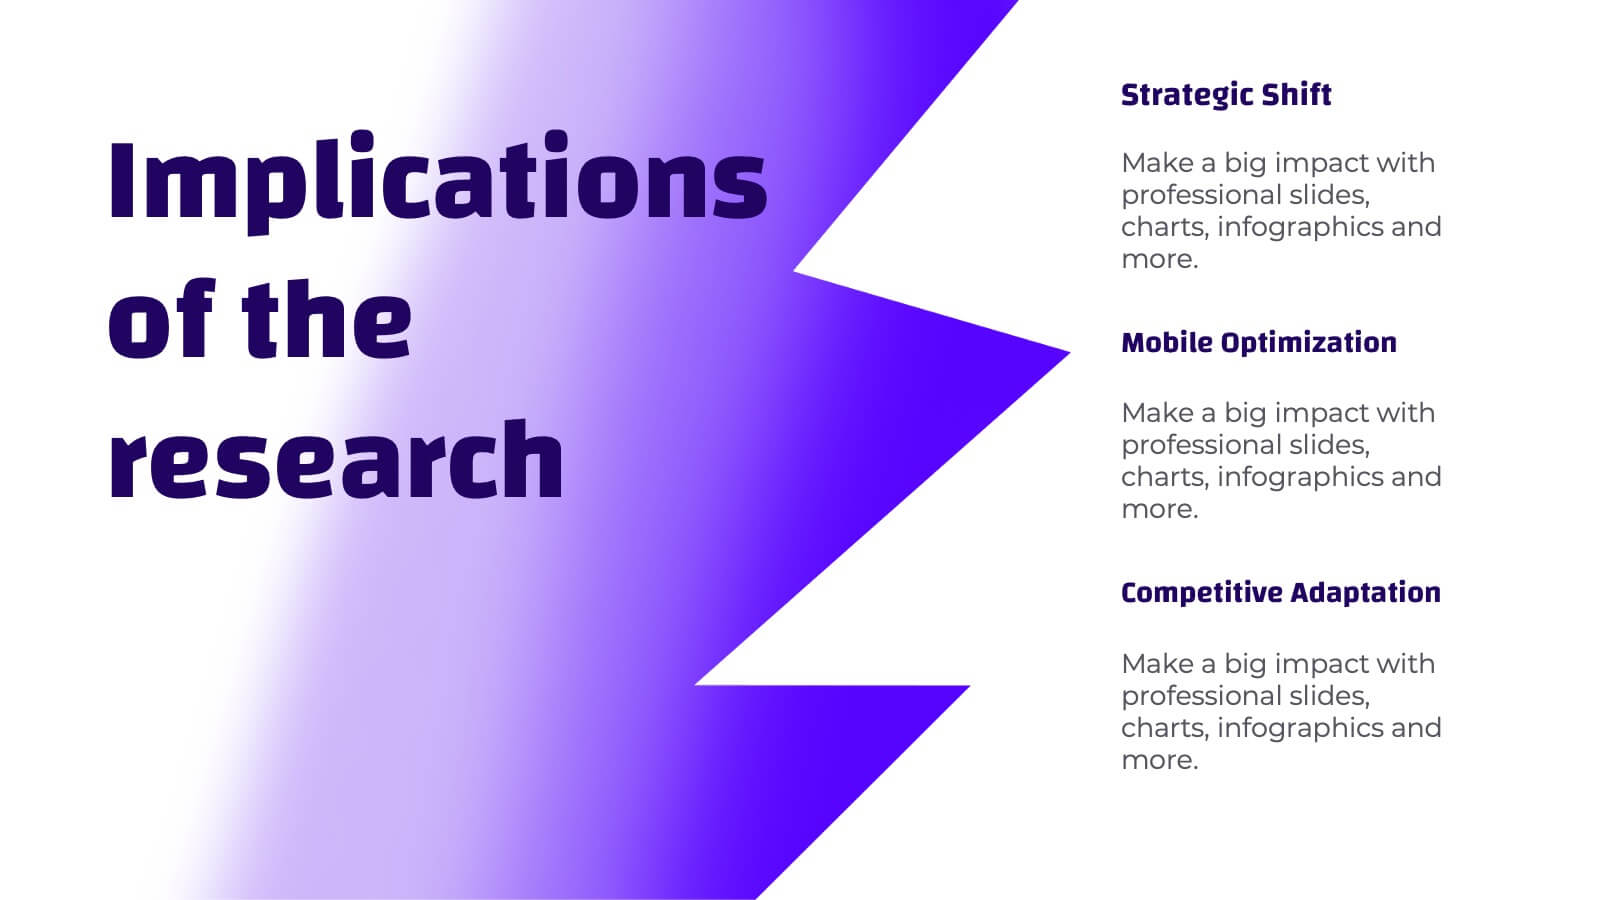
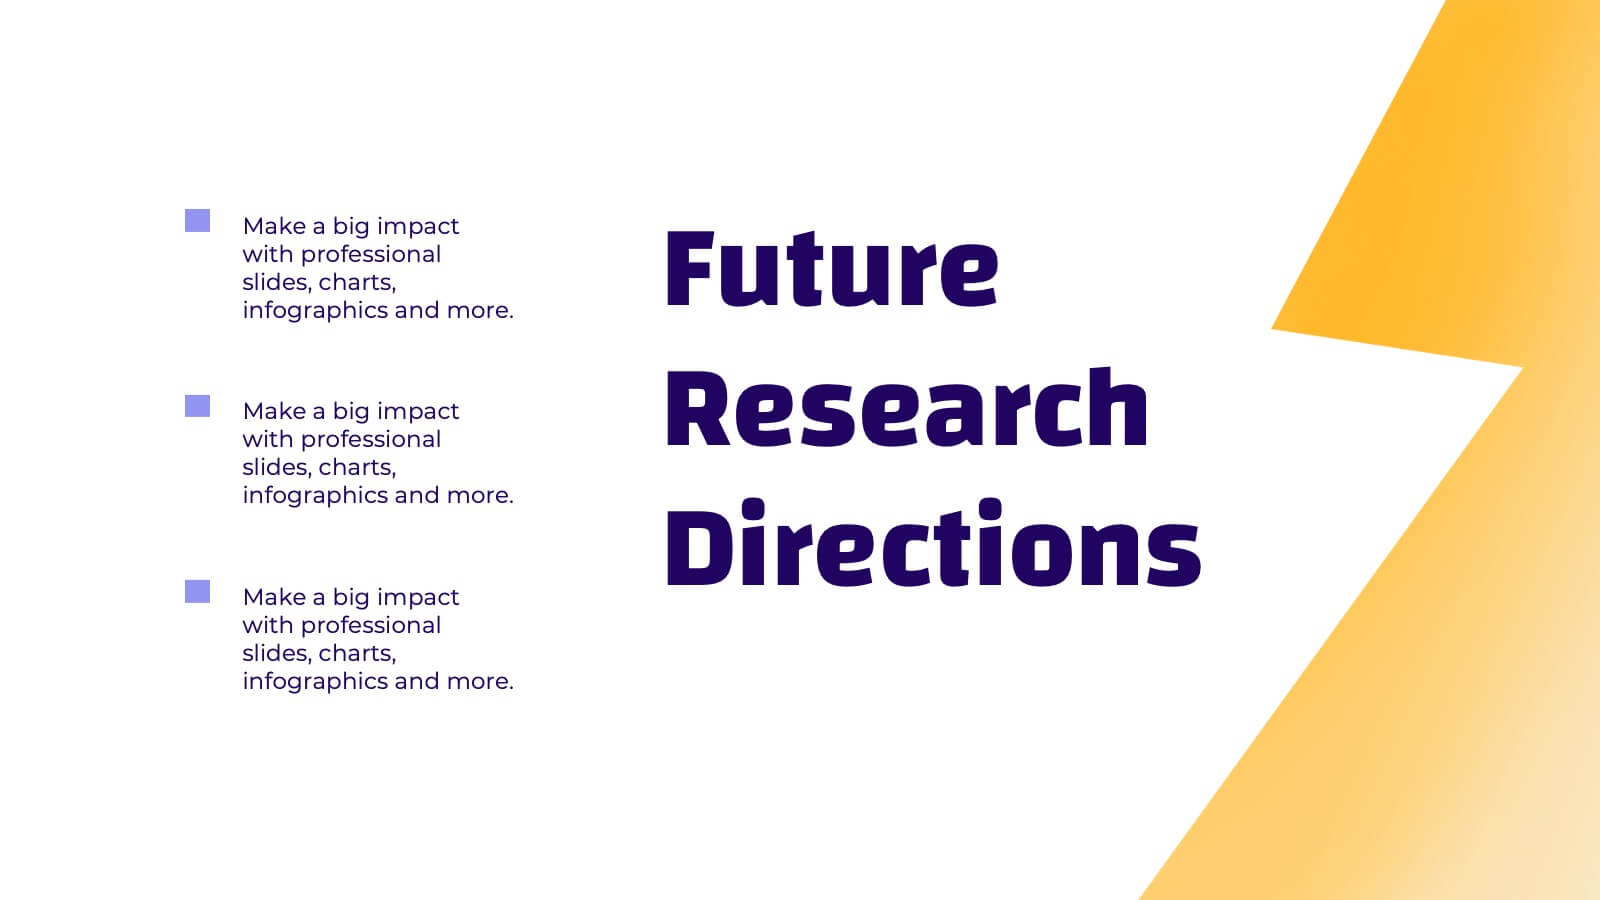
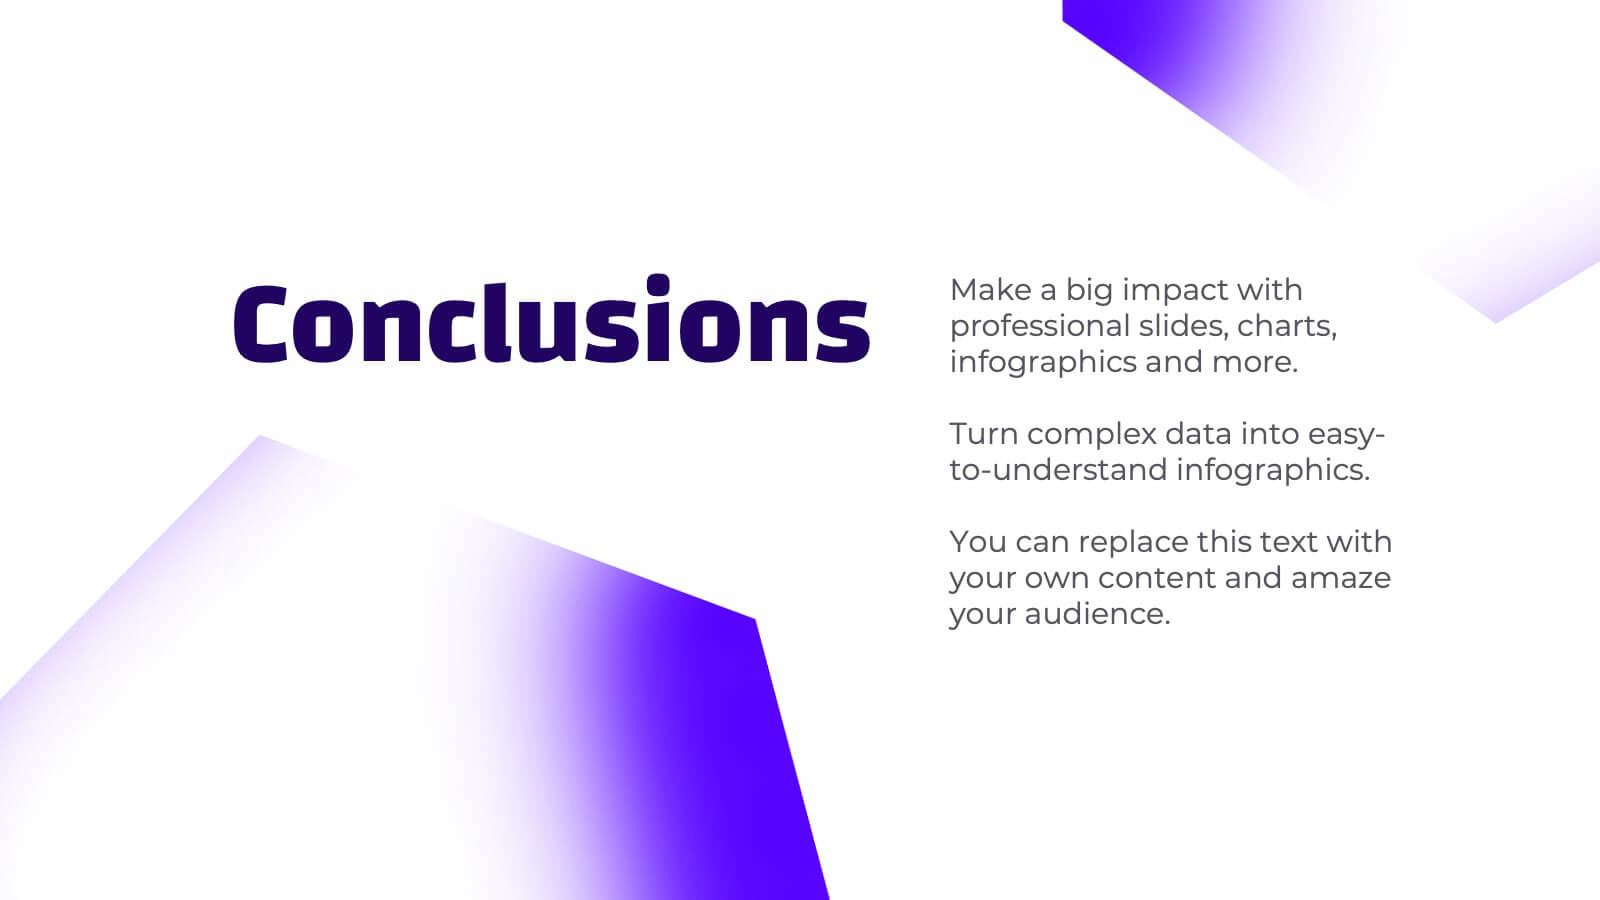
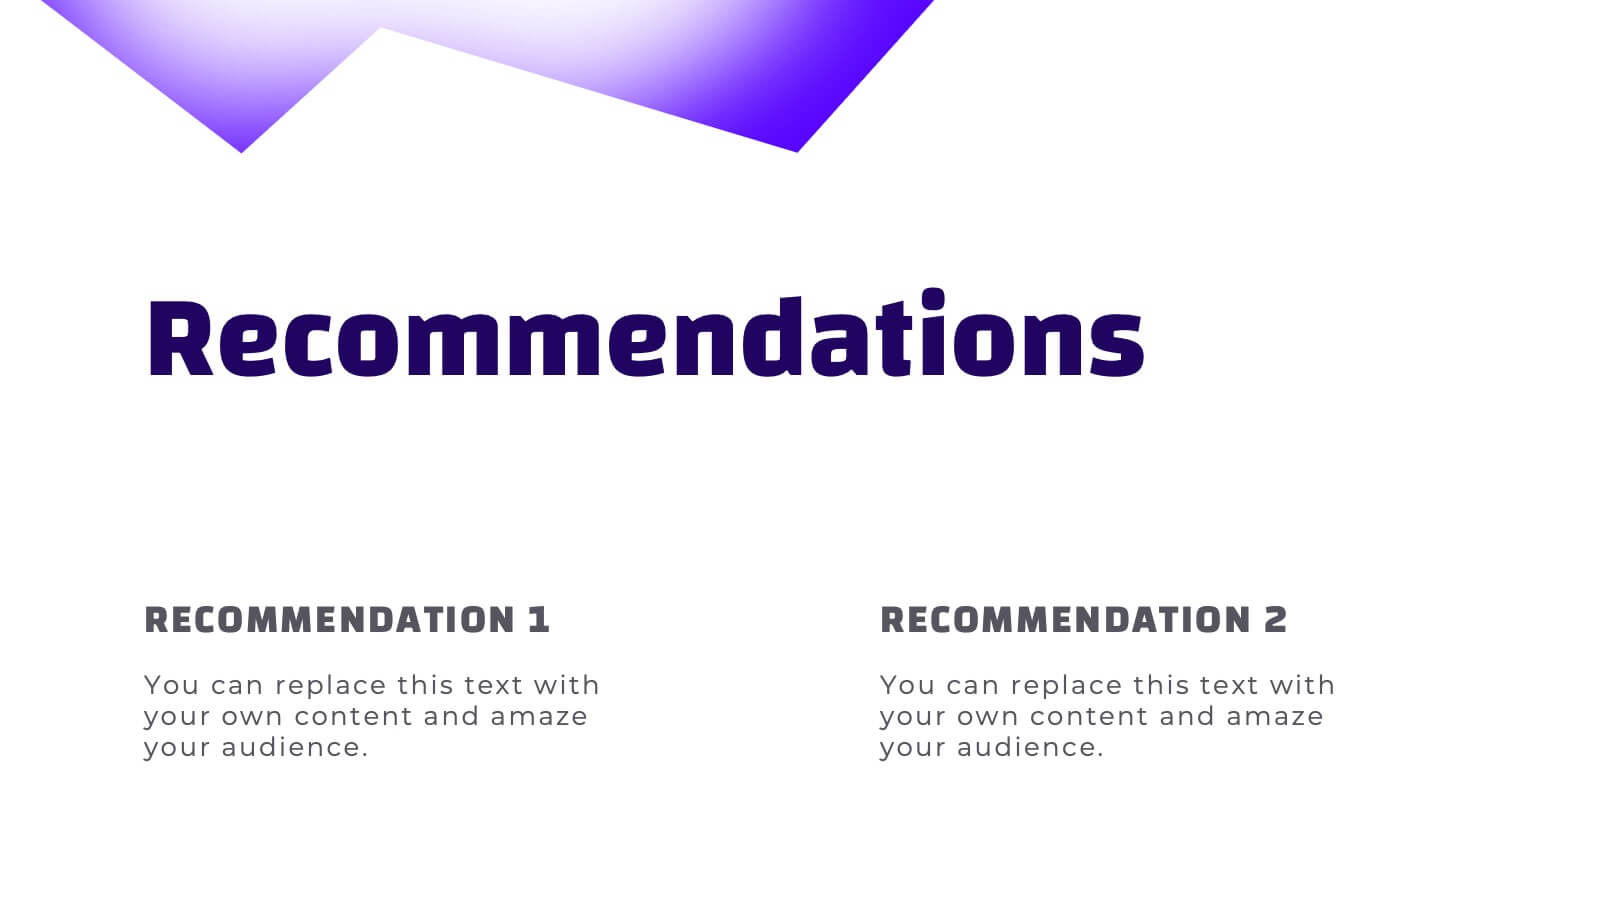
Naiad Qualitative Research Findings Presentation
Dive into your data with this refreshing, Naiad-inspired presentation template, perfect for sharing qualitative research findings! Designed to showcase insights, trends, and key conclusions with clarity, this visually appealing layout ensures your research captivates and informs. Make your data flow effortlessly. Compatible with PowerPoint, Keynote, and Google Slides for easy customization.


6 diapositivas
Environmental Services Infographic
The environment refers to the natural world and the surroundings in which living organisms exist. This infographic template highlights various aspects of environmental services and their importance in promoting sustainability and protecting the environment. The infographic utilizes visually appealing graphics, icons, and illustrations related to the environment, nature, and sustainability. These visuals capture viewers' attention and make the information more engaging. This infographic is designed to educate viewers on the different types of environmental services and their impact on environmental conservation and resource management.