


Características


¿Tienes alguna pregunta?
Recomendar


4 diapositivas
Current Project Health and Status Report Presentation
Track progress with clarity using the Current Project Health and Status Report presentation slide. Featuring a modern clipboard layout with checkboxes and project tools like a pencil, magnifier, and ruler, this slide is perfect for highlighting task completion, pending issues, and project milestones. Ideal for weekly updates, stakeholder reviews, or status dashboards. Fully editable in PowerPoint, Keynote, and Google Slides.


21 diapositivas
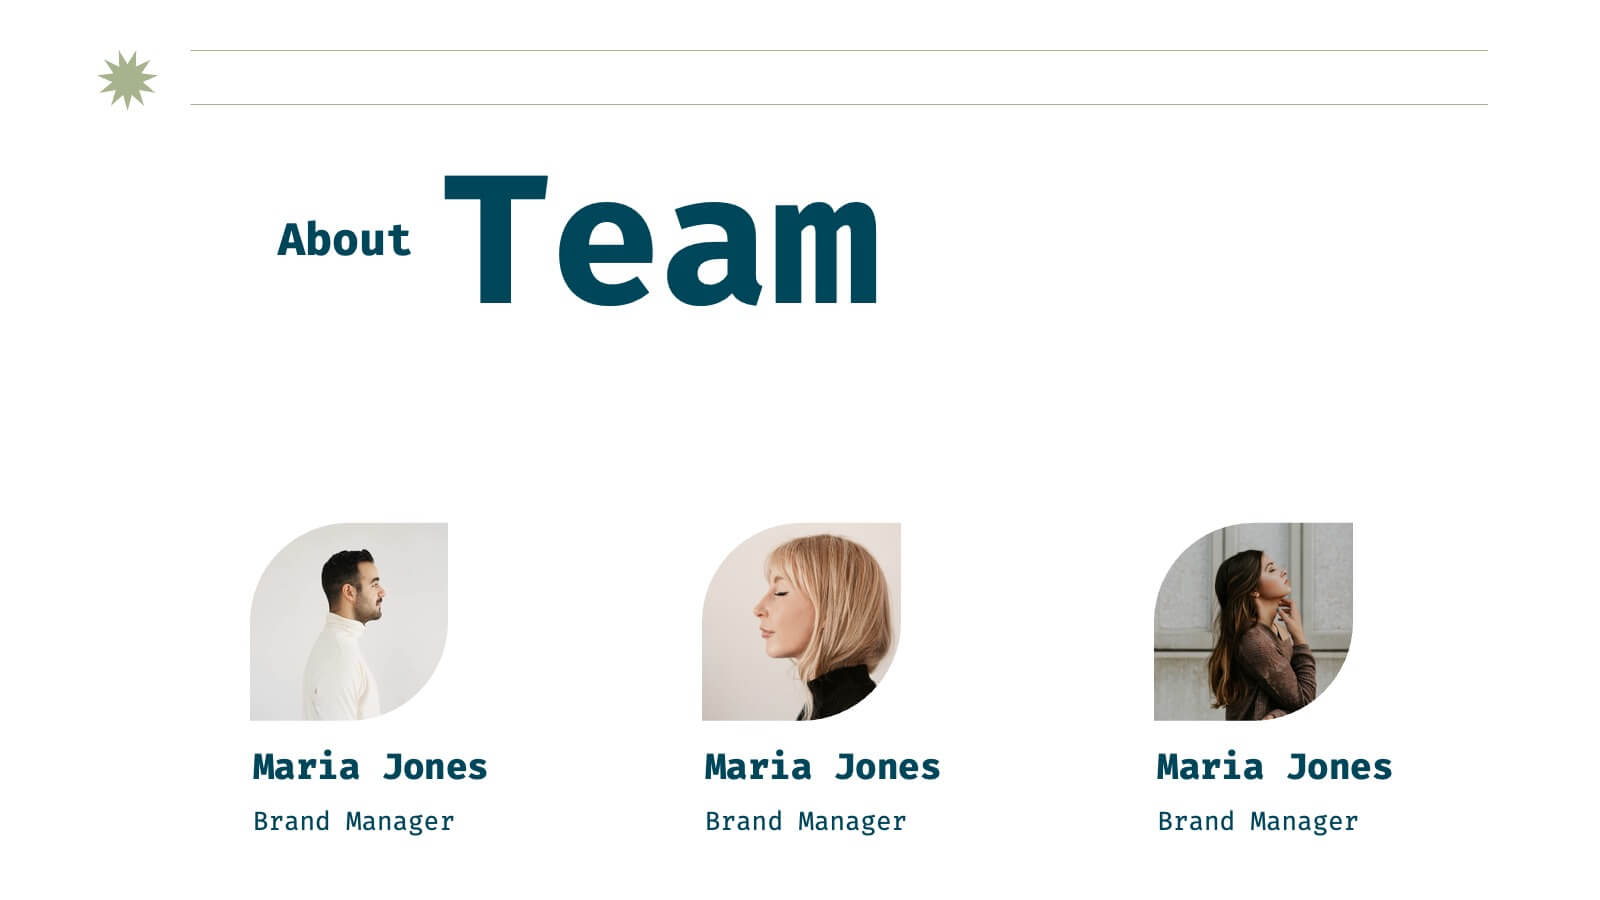
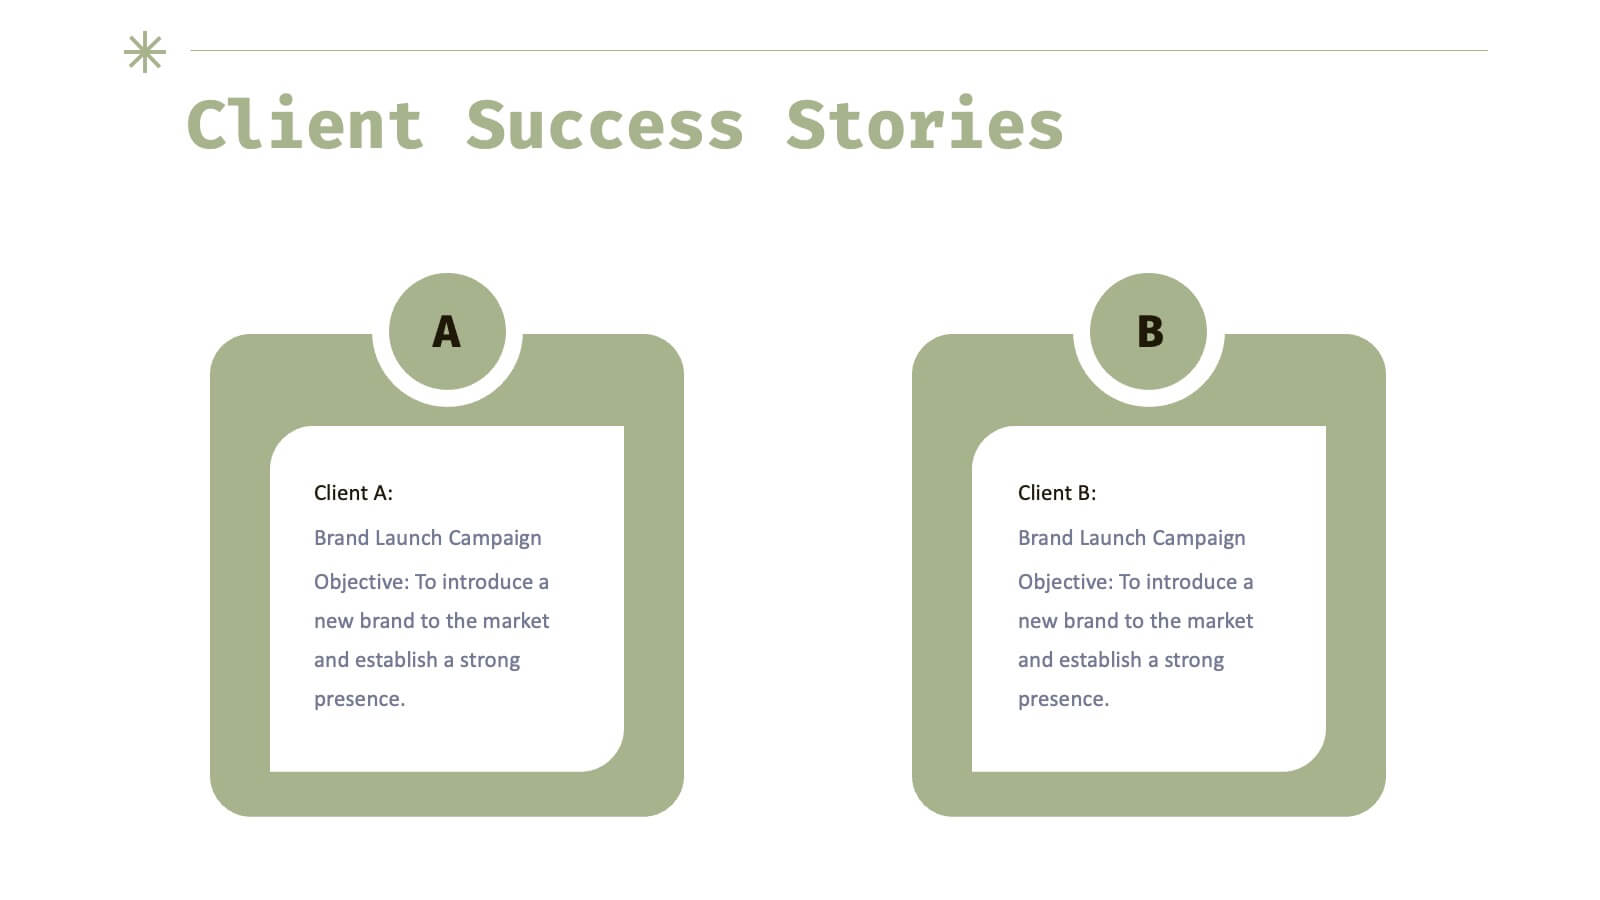
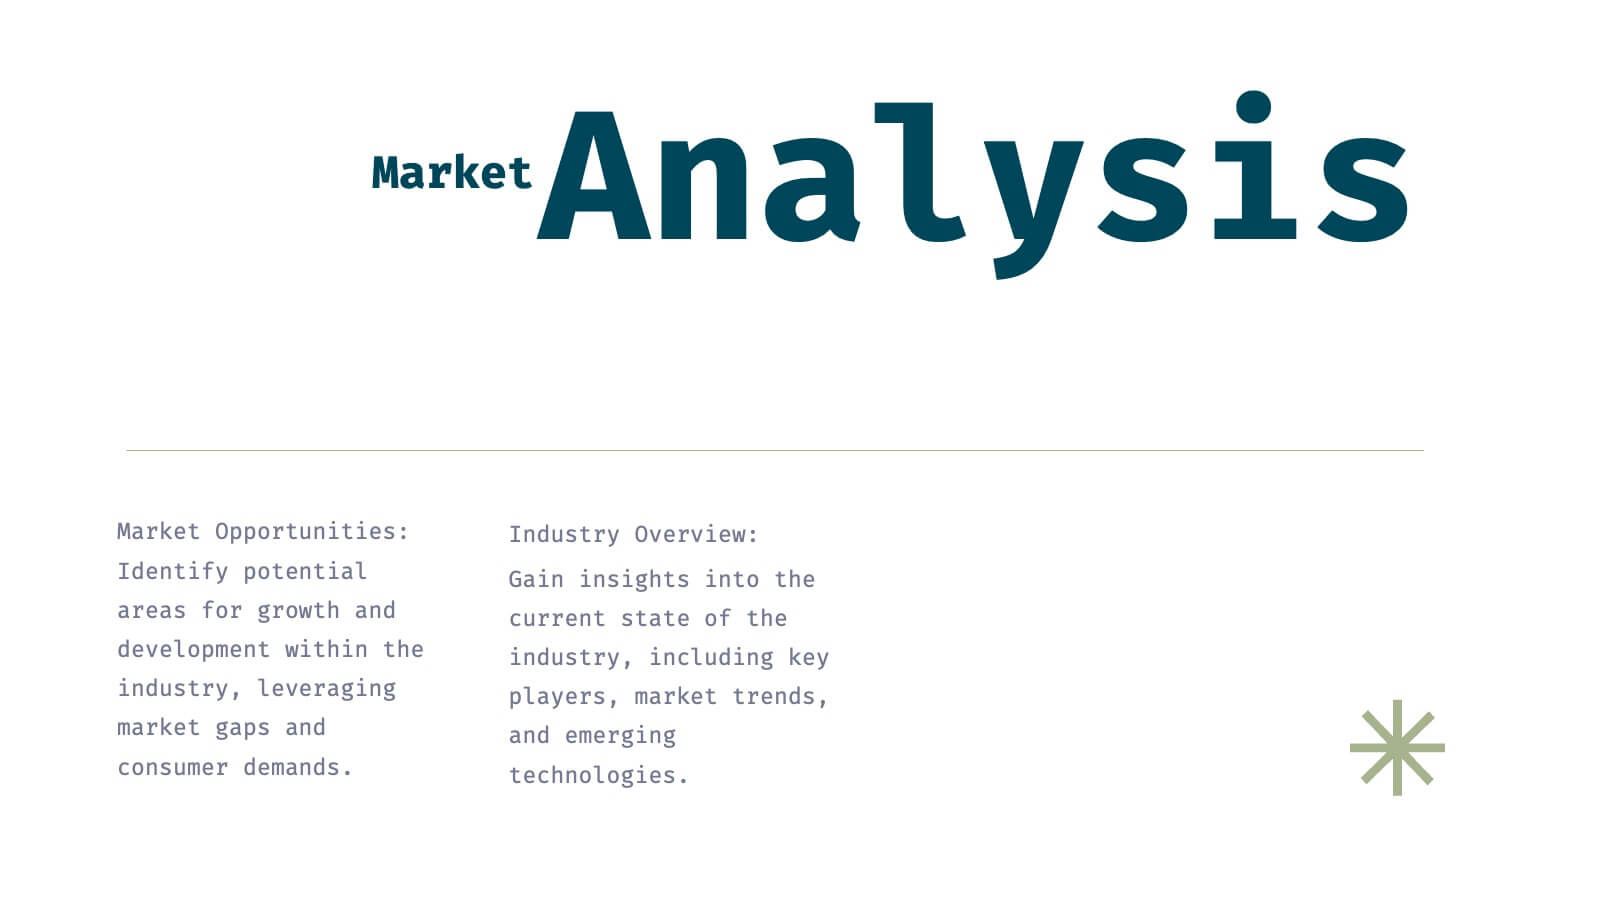
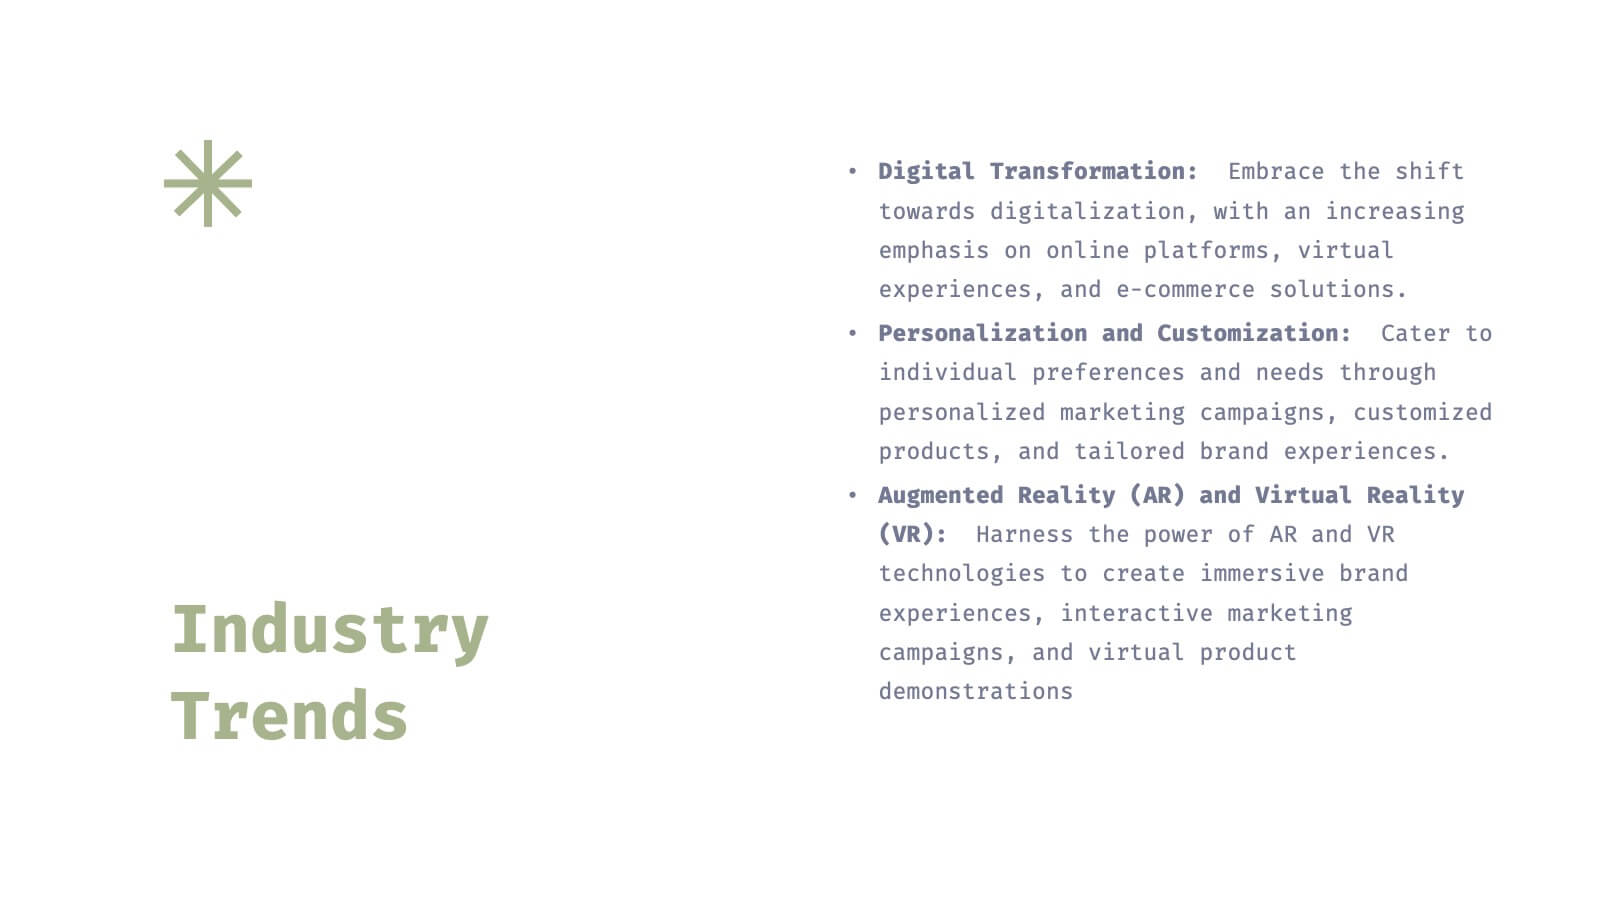
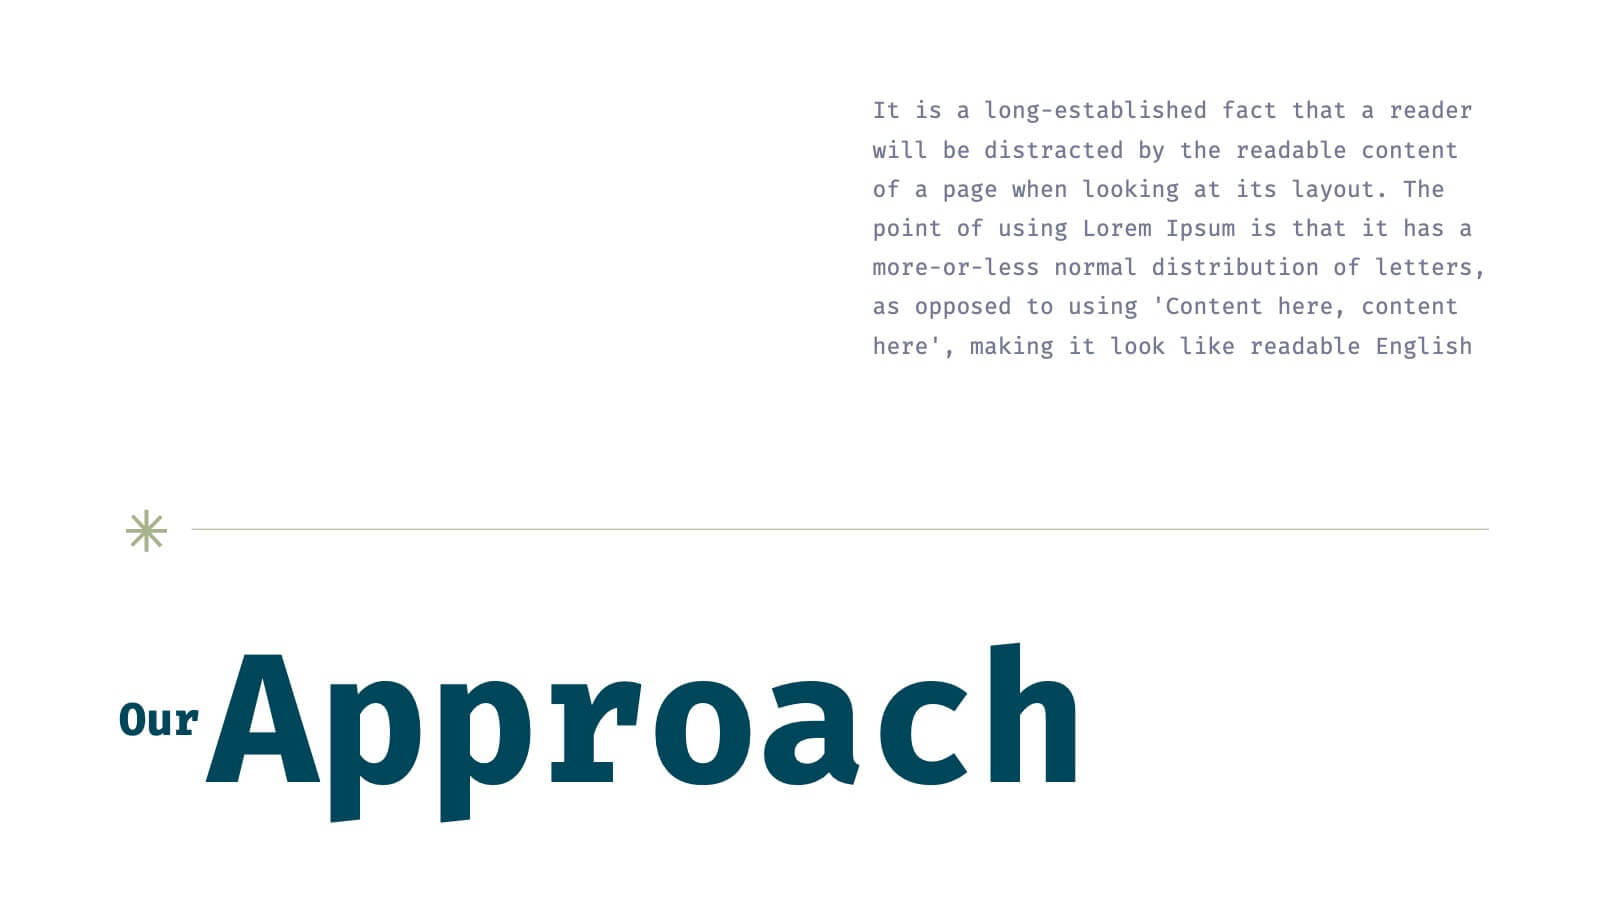
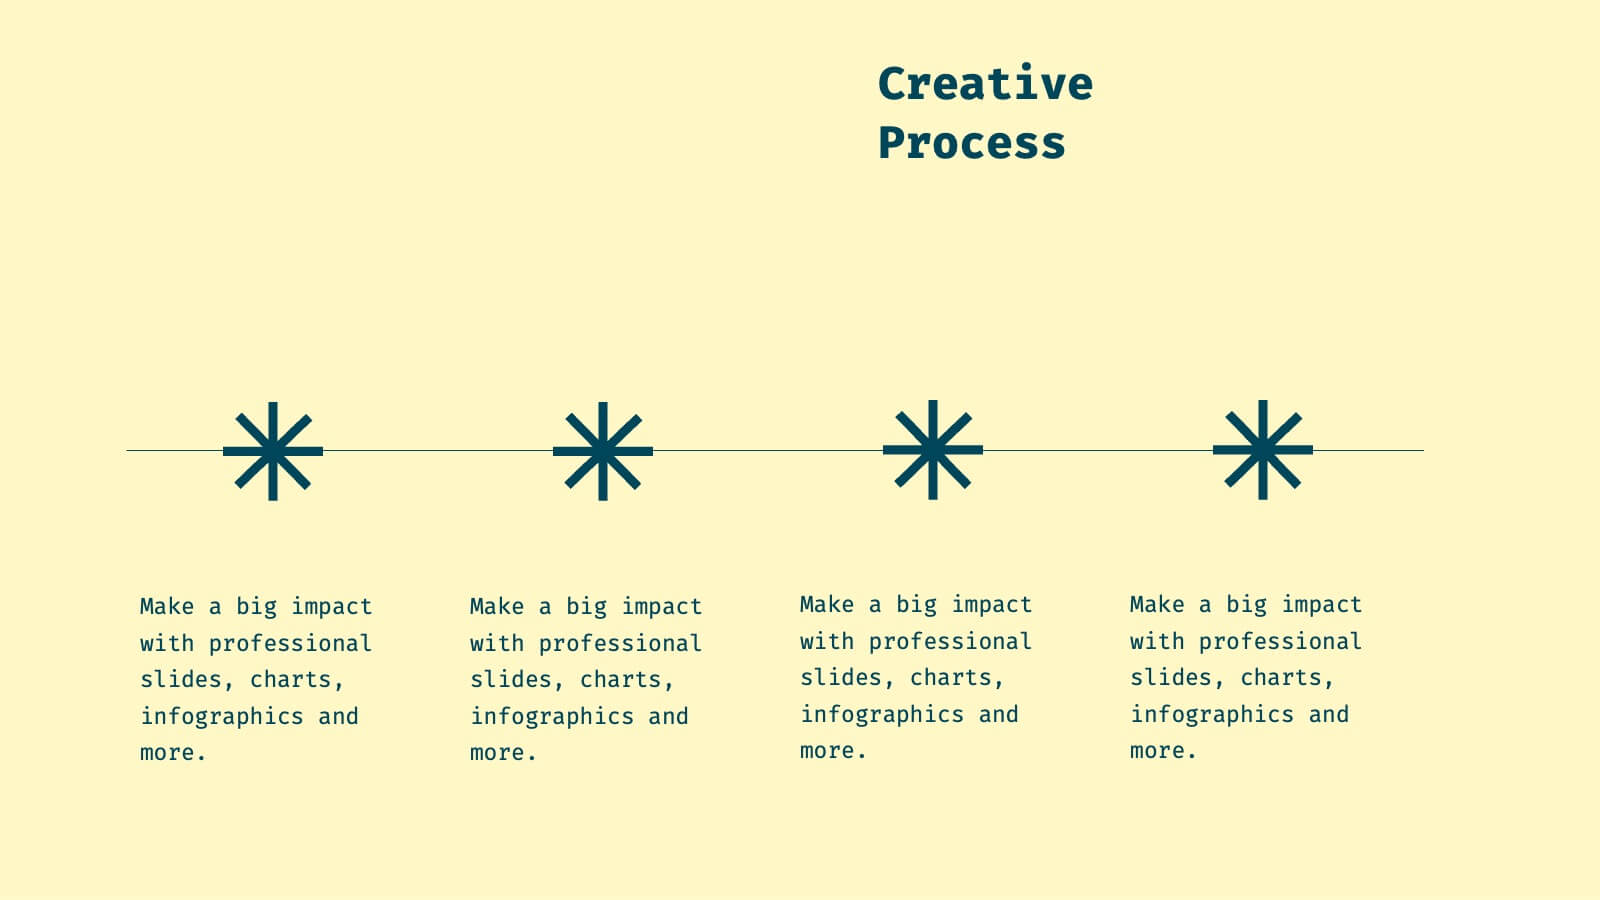
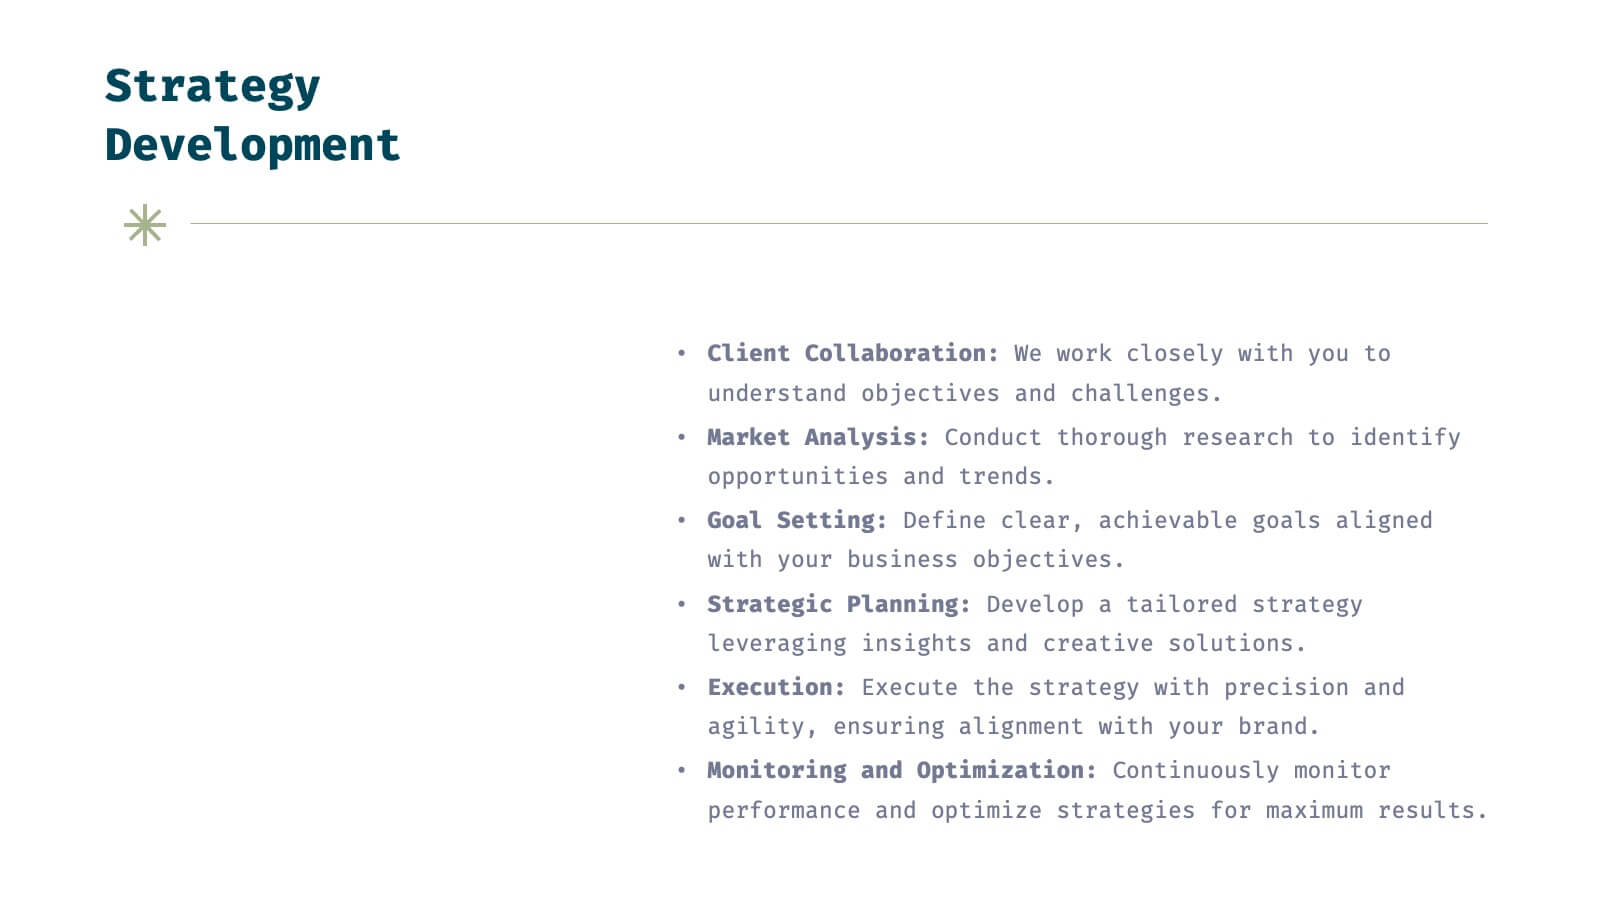
Helix Full-Service Agency Project Plan Presentation
Showcase your agency's expertise with this sophisticated, minimalistic presentation template. Designed to present comprehensive market analysis, strategy development, and client success stories, this template ensures your agency's capabilities are clearly communicated. Its clean design and professional layout make it perfect for building trust and credibility. Compatible with PowerPoint, Keynote, and Google Slides, it's versatile for any platform.


7 diapositivas
Flow Chart Infographic Presentation Template
A Flow Chart Infographic uses shapes and lines to show the flow of information, steps in a process, or the relationship between different ideas. Flow Charts are often used in business, education, and technology to show the steps in a process, decision-making flow, or to illustrate the relationship between different pieces of information. This template is perfect for showing how things work or how to do something step by step. This flowchart infographic includes a variety of different charts and description boxes that you can customize with your information to make it work for you.


8 diapositivas
Annual Business Performance Report Presentation
Visualize your company’s progress with the Annual Business Performance Report Presentation. This sleek, data-driven template combines donut charts and bar graphs to showcase KPIs, milestones, and key achievements. Perfect for year-end summaries and stakeholder updates. Fully editable in Canva, PowerPoint, and Google Slides for easy customization and professional results.


4 diapositivas
Conversion Funnel Stages Presentation
Bring clarity to every step of your customer journey with this clean, visually aligned funnel layout designed for quick understanding. This presentation breaks your process into clear stages, helping you explain performance, drop-offs, and opportunities with ease. Fully compatible with PowerPoint, Keynote, and Google Slides.


8 diapositivas
Business Risk Identification and Management
Simplify complex risk factors with this visually engaging diagram. This template uses overlapping circular segments to categorize and assess risk impact across four business areas—ideal for project managers, analysts, and consultants. Customizable progress bars help communicate risk levels with clarity. Compatible with PowerPoint, Keynote, and Google Slides.


5 diapositivas
Vaccine Myths Infographic
Vaccine Myths are false or misleading claims about vaccines that can contribute to vaccine hesitancy and misinformation. These infographic templates are designed to debunk common misconceptions and myths surrounding vaccines. These visually appealing and informative templates are ideal for healthcare professionals, educators, and organizations aiming to promote accurate information about vaccines and combat vaccine hesitancy. These infographics aim to educate and empower individuals to make informed decisions about vaccination and contribute to public health efforts. Compatible with Powerpoint, Keynote, and Google Slides.


4 diapositivas
Food Business Concept Pitch Presentation
Bring your culinary vision to life with the Food Business Concept Pitch Presentation. This unique avocado-shaped layout helps you outline up to four key ideas—from menu innovation to service strategy. Perfect for chefs, restaurateurs, or food startups. Fully editable in PowerPoint, Canva, and Google Slides for easy customization.


5 diapositivas
Cost Analysis and Budgeting
Visualize financial shifts with clarity using the Cost Analysis and Budgeting Presentation. This slide template uses a dual-stack design to contrast cost reductions against budget increases, supported by percentage change labels and layered visual elements. Ideal for finance teams, operations reviews, or executive summaries, this layout highlights five customizable categories per stack. Compatible with PowerPoint, Keynote, and Google Slides, it's fully editable to match your company branding and color palette.


5 diapositivas
Studio Photography Infographics
Studio Photography is the practice of capturing photographs in a controlled environment, typically a dedicated photography studio. These infographic templates highlight the key aspects of studio photography with examples of fashion photography, photojournalism, and photography terminology. These are designed to assist photographers, photography studios, and enthusiasts in showcasing the essential elements and techniques involved in capturing stunning images in a studio setting. Use these to provides valuable insights and techniques to help your audience create stunning images in a studio environment. Compatible with Powerpoint, Keynote, and Google Slides.


5 diapositivas
Business Executive Summary Report Presentation
Simplify your executive reporting with this 'Business Executive Summary Report' template, designed to present critical insights at a glance. This template streamlines complex data into digestible parts, ensuring clarity and impact in every slide. Perfect for executives and managers using PowerPoint, Keynote, and Google Slides.


5 diapositivas
Planning and Delivery in Five Phases Presentation
Guide your audience through each step of your execution plan using the Planning and Delivery in Five Phases Presentation. This clean, drop-pin style layout highlights five essential milestones for structured delivery and progress tracking. Each phase is color-coded for easy reference. Fully editable in PowerPoint, Keynote, Google Slides, and Canva.


26 diapositivas
Market Growth Tactics Presentation
Chart a path to success with our Market Growth Tactics presentation template, designed for seamless use in PowerPoint, Keynote, and Google Slides. This template is a vital asset for business strategists, marketing professionals, and consultants who aim to drive growth and capture market share. Our Market Growth Tactics template lays out a strategic framework for identifying and leveraging growth opportunities. It provides a comprehensive array of slides to showcase market analysis, competitive landscape, growth strategies, and execution plans. With customizable elements, you can tailor your presentation to reflect specific market insights and growth targets relevant to your audience. The template is crafted to facilitate clear communication of complex growth strategies, breaking them down into actionable steps with the aid of charts, graphs, and infographics. This helps to convey your message effectively, ensuring that your audience can visualize the growth journey and understand the tactics involved. Elevate your market growth presentations and become an authoritative voice in your industry with our SEO-optimized template, designed to engage, inform, and inspire action towards market expansion.


7 diapositivas
Harvey Ball Infographics Presentation Template
Featuring our Harvey Ball Infographic template, this is best used for presenting data from a variety of sources in an interactive way, showing charts and graphs, with the main point highlighted by using a bullet-pointed list at the bottom of the slide. This presentation template was designed to help you put your data into a visual representation that will capture the attention of your audience. This is great for business presentations and data visualizations, it is simple to create a professional looking presentations that will showcase your data in the most effective way possible.


23 diapositivas
Ionian Corporate Strategy Report Presentation
The Ionian Corporate Strategy Report template offers a modern and dynamic approach to corporate presentations, designed to keep your audience engaged throughout. With a sleek, contemporary design in black, white, and purple tones, this template is perfect for presenting strategic plans, conference overviews, session breakdowns, and more. Each slide is crafted to facilitate a seamless flow of information, whether you're introducing a keynote speaker, discussing key objectives, or outlining conference agendas. The template includes placeholders for breakout sessions, networking breaks, Q&A sessions, and more, making it versatile and adaptable for various corporate events. It's fully compatible with PowerPoint, Keynote, and Google Slides, ensuring easy customization and a professional presentation experience. Use the Ionian Corporate Strategy Report template to make your next corporate presentation both impactful and memorable.


5 diapositivas
Clear Business Objectives Slide Presentation
Spark clarity and direction with a slide built to showcase key objectives in a straightforward, visually engaging way. This presentation helps teams define priorities, outline expected outcomes, and communicate strategic intent with ease. Perfect for planning, reporting, and leadership updates. Fully compatible with PowerPoint, Keynote, and Google Slides.


4 diapositivas
Customer Market Segmentation Analysis Presentation
Understand your audience with clear and effective segmentation analysis. This Customer Market Segmentation Analysis template provides a professional visual representation of audience groups, helping businesses target the right demographics. Ideal for marketers, business strategists, and sales teams. Fully editable and compatible with PowerPoint, Keynote, and Google Slides for seamless customization.