


Características


¿Tienes alguna pregunta?
Recomendar


8 diapositivas
Credit Card Benefits and Features Presentation
The "Credit Card Benefits and Features" presentation template effectively outlines the various advantages and key features of credit cards. This template uses vibrant icons and a clear layout to differentiate each benefit, making it easier for audiences to understand the unique selling points of each card. The color-coded elements guide viewers through essential data points such as cash back, rewards programs, security features, and interest rates, making it ideal for financial seminars, customer education, or internal training. Each section is customizable, allowing for detailed descriptions and the addition of specific benefits tailored to different credit card offers.


6 diapositivas
Logistic Growth Infographics
Explore the concept of Logistic Growth with our customizable infographic template. This template is fully compatible with popular presentation software like PowerPoint, Keynote, and Google Slides, allowing you to easily customize it to illustrate and communicate the key principles of logistic growth. The Logistic Growth infographic template offers a visually engaging platform to explain the concept of population growth, including the phases of exponential growth and leveling off. Whether you're a student, educator, or researcher, this template provides a user-friendly canvas to create informative presentations and educational materials on logistic growth. Deepen your understanding of Logistic Growth with this SEO-optimized infographic template, thoughtfully designed for clarity and ease of use. Customize it to showcase the growth curve, carrying capacity, and factors affecting population dynamics, ensuring that your audience gains a comprehensive grasp of this important ecological concept. Start crafting your personalized infographic today to explore the dynamics of Logistic Growth.


5 diapositivas
Corporate Goal Alignment and Execution Presentation
Drive strategic clarity with this streamlined Corporate Goal Alignment and Execution slide. This template visually connects key initiatives with execution pathways and end goals, using a funnel-style layout that highlights the flow from strategic inputs to measurable outcomes. Perfect for aligning teams, reporting progress, or visualizing OKRs. Fully customizable in PowerPoint, Keynote, and Google Slides.


7 diapositivas
Pyramid Analytics Infographic
Pyramid Infographics are the best way to show off your data in a visually appealing way that's easy to understand. They're fast, they're fun, and they're flexible enough to work with all sorts of data sets. This infographic template is the perfect way to bring your data to life. Designed with a hierarchical structure, the information is organized into groups of related items. This is perfect to showcase numbers, facts, and figures in an engaging way. Fully compatible with Powerpoint, Keynote, and Google Slides. This customizable template allows you to choose the color scheme, size, and orientation of the graphic, so you can pick what looks best for your presentation.


5 diapositivas
Business Problem Statement Presentation
Clarify challenges and drive solutions with this business problem statement template! Designed for strategic planning, this structured layout helps you define key issues, analyze root causes, and communicate insights effectively. Ideal for business leaders, consultants, and project managers. Fully customizable and compatible with PowerPoint, Keynote, and Google Slides for seamless use.


6 diapositivas
Future Trends in 5G Connectivity Presentation
Showcase the evolving landscape of mobile innovation with this modern 5G trends infographic. Featuring a central smartphone graphic and five vertically aligned icons, this slide is perfect for highlighting connectivity advancements, industry shifts, and upcoming opportunities. Color-coded markers enhance clarity for presentations on telecom, IoT, smart cities, and emerging tech. Fully editable in PowerPoint, Keynote, and Google Slides.


23 diapositivas
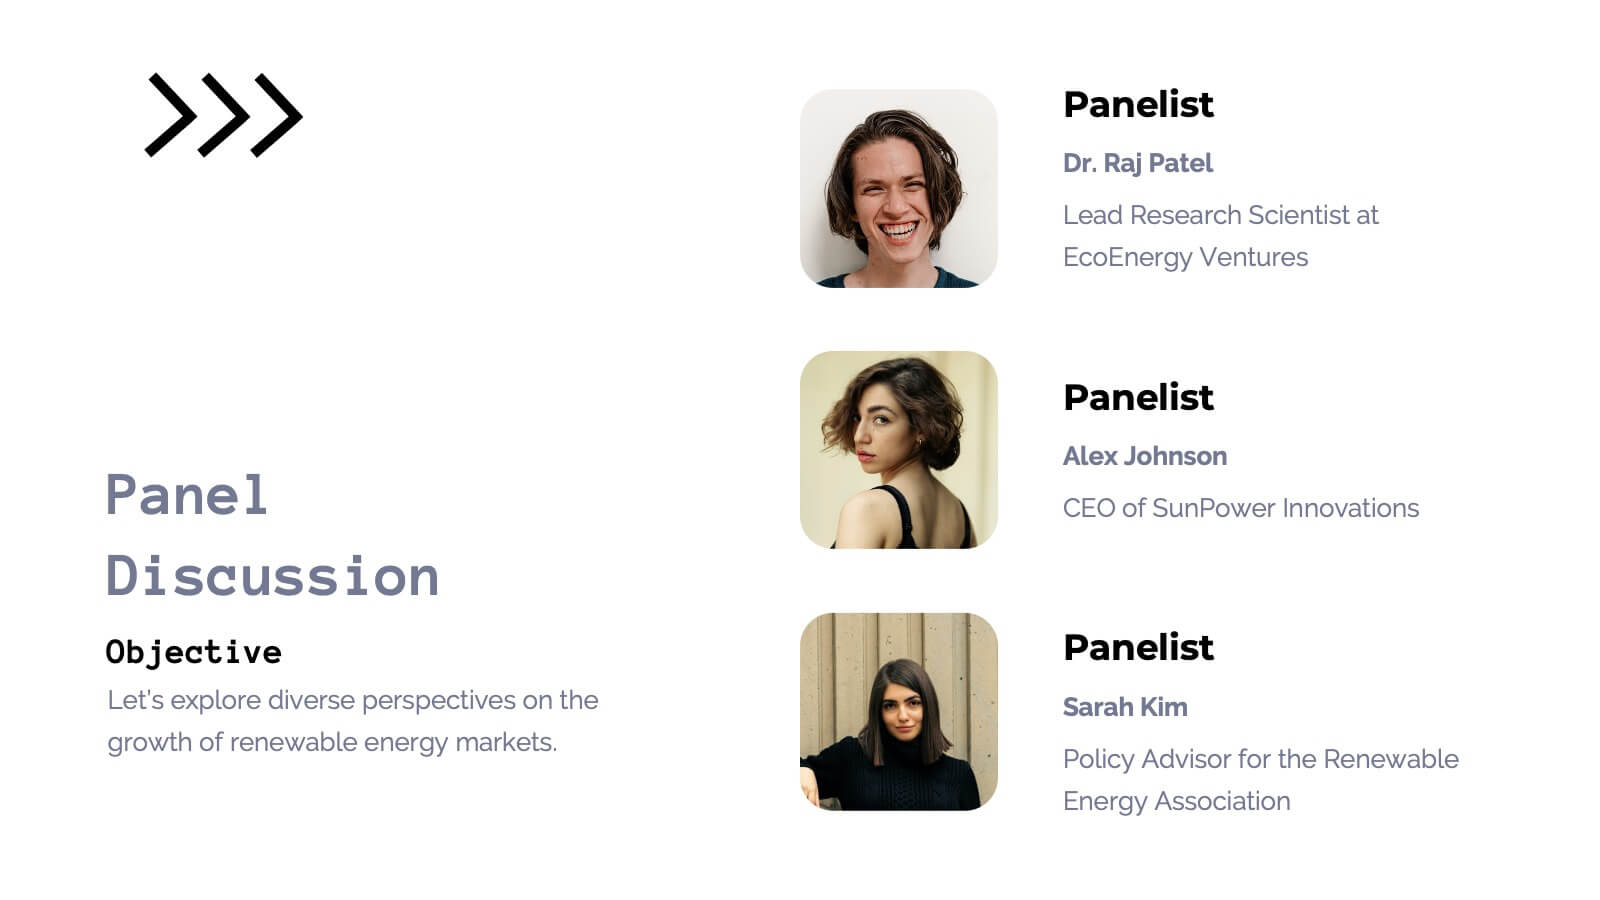
Pomona Business Plan Presentation
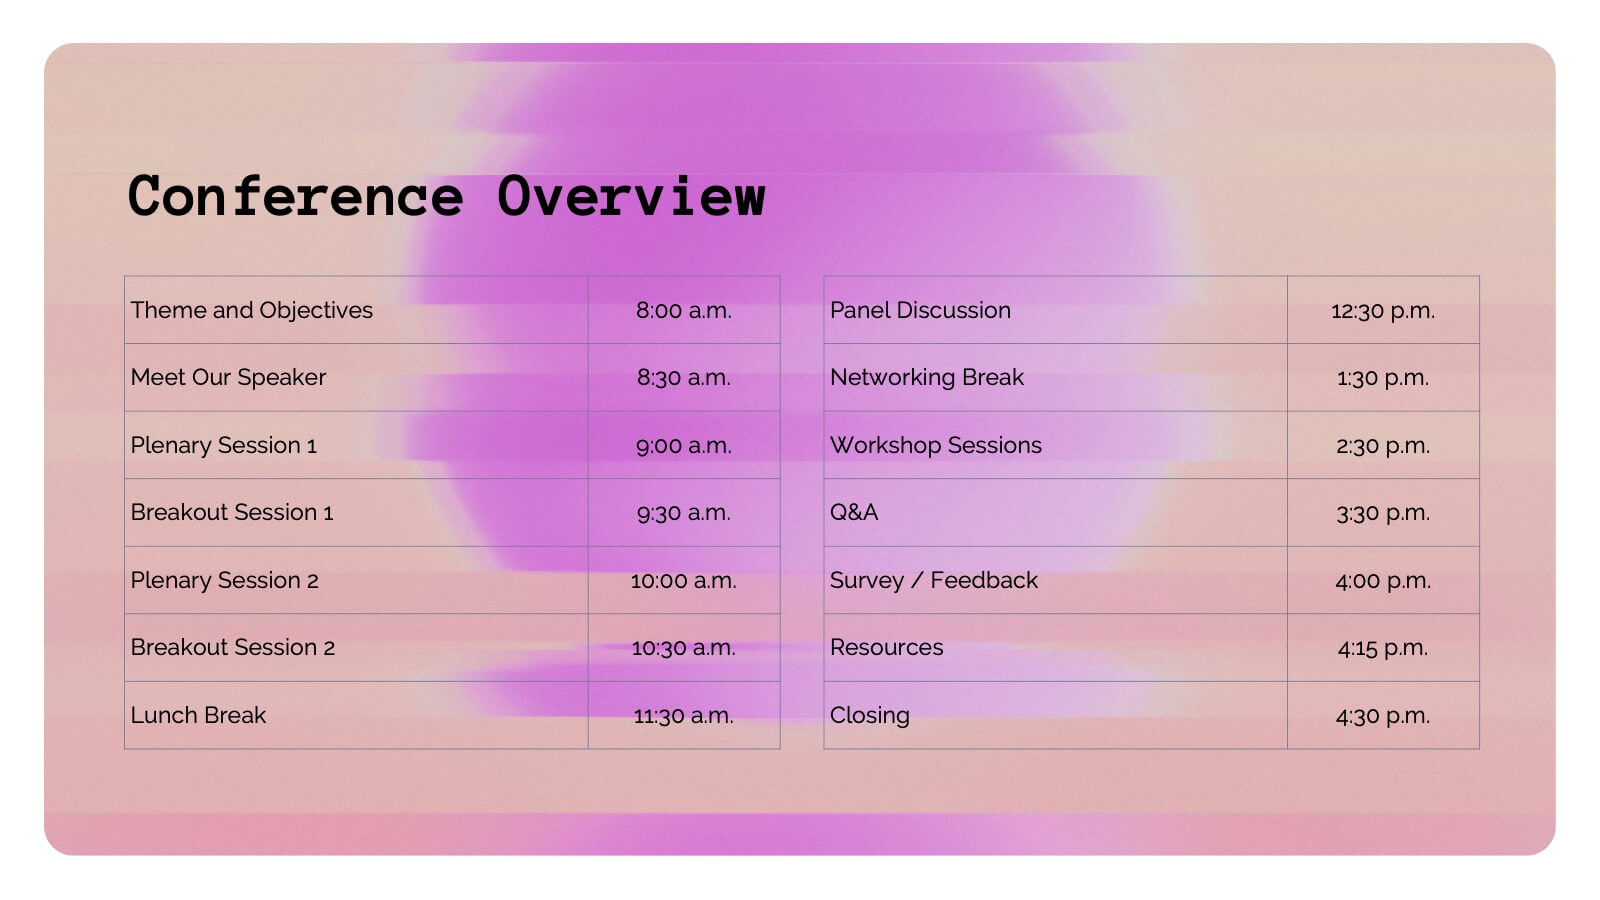
This vibrant and adaptable event agenda template is perfect for organizing your business conference or corporate event. It includes customizable sections for session details, speaker information, and key activities like networking breaks, workshops, and panel discussions. Compatible with PowerPoint, Keynote, and Google Slides, it ensures a smooth and engaging event presentation experience!


6 diapositivas
Numbered Steps Diagram Presentation
Watch your workflow come to life as each step rises in a clean, structured path that makes progress easy to follow. This presentation guides audiences through sequential actions with clarity, helping simplify processes, plans, or instructions. Perfect for business, training, or project teams. Fully compatible with PowerPoint, Keynote, and Google Slides.


7 diapositivas
Bubble Map Infographics Presentation Template
Our Bubble Map Infographic is an easy-to-create, visually appealing way to display your data. This template is perfect for educators looking to engage their audience, and for anyone wanting to share information in an interesting way. The graphics are easy to customize by adding your own text or images and there are PowerPoint versions available. This template features a lot of animated bubbles that will help illustrate your points, making them easier to understand than ever before. The color-coded categories make it easy to navigate through the dots and find whatever you need with ease.


6 diapositivas
Blue Ocean Trade Infographic
The Blue Ocean strategy is a concept that focuses on creating uncontested market spaces rather than competing in existing market segments. This captivating infographic template showcases the concept of blue ocean trade and its impact on business growth and innovation. It provides an engaging and informative overview of the blue ocean strategy, highlighting its key principles and benefits for businesses. This template provides a comprehensive overview of blue ocean trade and serves as an inspiring resource for those seeking innovative business strategies. Fully compatible with Powerpoint, keynote, and Google Slides.


6 diapositivas
Scope Planning Template for Project Teams Presentation
Turn teamwork into strategy with a clear, circular layout that maps every phase of your project plan. This modern presentation helps teams define objectives, assign roles, and visualize scope effortlessly. Easy to edit and fully compatible with PowerPoint, Keynote, and Google Slides for seamless collaboration and customization.


26 diapositivas
Venture Capital Dark Presentation
Present your investment vision with confidence using our Venture Capital presentation template, ideal for PowerPoint, Keynote, and Google Slides. This template is expertly crafted for venture capitalists, startup founders, and financial advisors looking to create persuasive and engaging presentations that attract investment. Our Venture Capital template is designed to showcase the potential of innovative startups to savvy investors. It includes a range of slides that detail market analysis, growth potential, business strategies, and investment opportunities, all laid out in an easy-to-understand format. With this template, you can effectively communicate complex financial data and investment propositions through clear visuals and concise text. Featuring customizable charts, graphs, and diagrams, the template allows for a personalized touch, making it easier to highlight the unique selling points of investment opportunities. Whether you're presenting to angel investors, venture capital firms, or at a funding pitch, this template will help you to articulate your message with clarity and impact. Increase the visibility of your venture capital presentations with our SEO-optimized template and position yourself as a thought leader in the field of investment and startup growth.


7 diapositivas
Digital Marketing Course Infographic
Dive into the dynamic realm of digital marketing with our Digital Marketing Course Infographic. Bathed in a clean white canvas, accentuated with the depth of blue, the optimism of yellow, and the innovation of green, our template captures the multifaceted nature of online marketing. Equipped with sharp infographics, relevant icons, and customizable image placeholders, it provides a comprehensive overview of digital marketing modules and strategies. Perfectly tailored for Powerpoint, Keynote, or Google Slides. An invaluable resource for marketing trainers, course instructors, students, or any organization aiming to upskill in the digital domain.


5 diapositivas
Corporate Staff Introduction and Bios Presentation
Introduce your team with clarity using the Corporate Staff Introduction and Bios Presentation. This layout is perfect for showcasing employee names, titles, photos, and brief bios in a professional format. Ideal for company overviews, internal communications, or onboarding decks. Fully editable in PowerPoint, Canva, and Google Slides.


26 diapositivas
Coffee Shop Warm Company Profile Presentation
Coffee shops have become an important part of modern culture, especially in urban areas, and they come in various styles and themes. This presentation template is designed to bring the essence of your coffee haven to life. From the first sip to the last drop, let this presentation showcase the soul-warming experience your coffee shop provides. Fully customizable and compatible with Powerpoint, Keynote, and Google Slides. Utilize warm colors like browns, oranges, and yellows to evoke a cozy, comforting atmosphere. The template integrates coffee cup icons, latte art, and coffee bean graphics for a coffee-centric theme.


5 diapositivas
Smart Agriculture and Sustainability Trends
Highlight the future of farming with the Smart Agriculture and Sustainability Trends Presentation. This slide features a sleek visual progression of plant growth stages, symbolizing innovation, eco-conscious development, and data-driven agricultural trends. Ideal for sustainability reports, agritech proposals, and environmental briefings. Fully editable and compatible with PowerPoint, Keynote, and Google Slides.


7 diapositivas
Venn Diagram Infographic Presentation Template
A Venn diagram is a type of chart that uses circles to show the similarities and differences between two or more sets of items. The circles overlap in the areas where the items have something in common, and the non-overlapping areas show the items that are unique to each set. This template is perfect for showing how different things are alike and different. This template includes lots of diagrams with circles that you can customize to show all the similarities between your different information. You can also add pictures and charts to make it look more appealing with your personal data.