


Características


¿Tienes alguna pregunta?
Recomendar


11 diapositivas
Sales Dashboards Infographic
A sales dashboard is a visual representation of sales data and key performance indicators (KPIs) that provides a quick and comprehensive view of a company's sales performance and related metrics. Step into the fast-paced world of sales with our sales dashboards infographic template. It's your compass for charting the course to success in the dynamic realm of sales, providing a visual guide that transforms data into actionable insights. This infographic is designed to to track progress towards sales goals, identify trends, and optimize strategies to improve sales performance. Compatible with Powerpoint, Keynote, and Google Slides.


5 diapositivas
Corporate Messaging Strategy Presentation
Clarify your company’s voice with this corporate messaging strategy slide. Designed to outline your core communication pillars, this layout helps you present messaging priorities across different channels or audiences. Perfect for marketing teams, branding sessions, or executive briefings. Fully editable in Canva, PowerPoint, and Google Slides for quick customization.


5 diapositivas
Editable Mind Mapping Presentation
Clarify complex thoughts with the Editable Mind Mapping Presentation. This sleek template features a central profile design with five branching points to visualize ideas, processes, or strategies. It's perfect for brainstorming sessions, team collaboration, or project planning. Fully customizable and compatible with PowerPoint, Keynote, and Google Slides.


21 diapositivas
Goldenshadow Professional Portfolio Showcase Presentation
A refined portfolio presentation template crafted to highlight professional achievements and expertise. Showcase featured projects, collaborations, and client testimonials with a sleek, modern design. Includes sections for services offered, awards, pricing, and contact information. Fully customizable and compatible with PowerPoint, Keynote, and Google Slides for impactful portfolio presentations.


6 diapositivas
Project Scope and Expansion Scale Presentation
Display growth areas and operational coverage with this segmented radial chart. Ideal for showcasing project reach, departmental impact, or phase distributions, each section includes editable icons and labels. Perfect for strategy updates, expansion pitches, or status reporting. Fully customizable in PowerPoint, Keynote, and Google Slides for professional presentations.


3 diapositivas
Digital Course Planning and LMS Strategy Presentation
Design your online courses like a pro with this clean, easy-to-follow visual. Ideal for mapping course flow, LMS strategy, and learner journeys, this presentation template breaks down complex processes into digestible steps. Fully customizable and compatible with PowerPoint, Keynote, and Google Slides for flexible e-learning presentation creation.


5 diapositivas
Business Vision Statement Presentation
Focus on the future with our "Business Vision Statement" presentation template, ideal for outlining your company's aspirations. This visually engaging template helps you present your business's core values and long-term goals, ensuring alignment across the organization. Perfect for strategic meetings and stakeholder presentations, it is compatible with PowerPoint, Keynote, and Google Slides. This template is a crucial tool for leaders looking to inspire and direct their teams towards common objectives.


5 diapositivas
Benefits of Good Nutrition Infographics
Good Nutrition is crucial for overall health, disease prevention, weight management, mental well-being, energy levels, and various other aspects of our physical and mental health. These vertical infographic templates can be used to present the importance and advantages of maintaining a healthy and balanced diet. These are designed to educate and inspire individuals to make informed choices about their nutrition and overall well-being. Perfect for educational presentations, nutrition workshops, wellness programs, or health-related websites, these templates provide valuable information and visual aids to promote better nutrition choices.


12 diapositivas
Understanding Digital Currencies Presentation
Simplify the complexity of crypto ecosystems with the Understanding Digital Currencies presentation template. Designed around a wallet-style visual, this layout highlights key features of various cryptocurrencies using six labeled touchpoints. Perfect for introducing Bitcoin, Ethereum, altcoins, and digital wallets in educational, financial, or blockchain-related presentations. Ideal for crypto educators, fintech startups, and investment analysts. Compatible with PowerPoint, Keynote, and Google Slides.


6 diapositivas
Company Profile Growth Infographic
The collection of templates presented offers a valuable resource for businesses aiming to articulate their growth and current market standing comprehensively. These templates are designed to deliver essential information through a well-structured and visually appealing format, ideal for engaging stakeholders effectively. Each design is tailored to showcase various aspects of company progress, including detailed financial growth, strategic direction, and key achievements. Features such as timelines, growth charts, and key performance indicators are seamlessly integrated, providing a clear snapshot of the company's journey and ambitions. The templates are adaptable to various corporate needs, making them suitable for annual reports, investor presentations, and internal reviews across different industries. The chosen color schemes and layouts ensure that information is presented clearly and attractively, enhancing readability and projecting a professional corporate image. By facilitating customization to reflect the unique characteristics of any business, these templates serve as indispensable tools for companies eager to communicate their success stories and future prospects in a compelling manner.


7 diapositivas
McKinsey 7S Model Infographic Presentation Template
The McKinsey 7S model is a management framework developed by the consulting firm McKinsey & Company. The model consists of seven interdependent factors that are important for an organization's success: strategy, structure, systems, shared values, skills, staff, and style. The template can be used to visualize the 7S model hierarchy and the importance of each component to your business. This inventive presentation is designed to take an economic approach, If you’re interested in taking this strategic step to evaluating your processes and measuring performance, this presentation is for you.


6 diapositivas
AIDA Communication Model Infographics
Embark on a journey through the AIDA Communication Model, a fundamental concept in marketing and advertising! This infographic serves as your guide to understanding how this powerful model can elevate your communication strategy. From capturing Attention and holding Interest to sparking Desire and driving Action, we unveil the secrets that make the AIDA model an indispensable tool. Delve into the art of holding the audience's interest. Discover methods to maintain engagement and curiosity as you convey your message. Learn how to keep your audience captivated and eager to learn more. With this engaging infographic, compatible with PowerPoint, Keynote, and Google Slides, sharing your understanding of the AIDA Communication Model becomes effortless. Empower yourself with the knowledge to enhance your marketing and advertising efforts. Dive into the world of AIDA and embark on a journey of effective communication and persuasion.


2 diapositivas
Office Interview Scenes Illustrations
Elevate your Interview experience with our office interview scenes illustrations pack! This is a burst of high-energy and lightheartedness that infuses the often nerve-wracking interview process with a touch of excitement and fun. These illustrations seamlessly fit into PowerPoint, Google Slides, and Keynote. Add a splash of color and playfulness to the serious nature of interviews, creating an environment where both interviewers and candidates can feel at ease!


6 diapositivas
Demographic Information Infographic
Demographic information refers to data that describes the characteristics of a population or specific groups within a population. This infographic template is essential for understanding the composition and dynamics of a population, as well as for making informed decisions in various fields, such as market research, healthcare, and education. This infographic is designed to provide an overview of key demographic indicators and trends, offering insights into the characteristics of the target audience. This infographic includes key insights about the demographic data presented, providing context and interpretation for the audience.


6 diapositivas
Child Development Psychology Presentation
Bright colors and geometric birds bring this slide to life, making complex concepts easy to follow. This presentation template simplifies the key stages of emotional and psychological growth in children, helping you explain theories and behaviors clearly. Compatible with PowerPoint, Keynote, and Google Slides for seamless use across platforms.


4 diapositivas
Marketing Plan Overview
Visualize your marketing cycle with this clean, three-stage arrow diagram. Each segment—labeled A, B, and C—represents a key phase in your marketing strategy, making it ideal for campaign planning, product launches, or promotional timelines. Fully editable in PowerPoint, Keynote, and Google Slides for effortless customization.


20 diapositivas
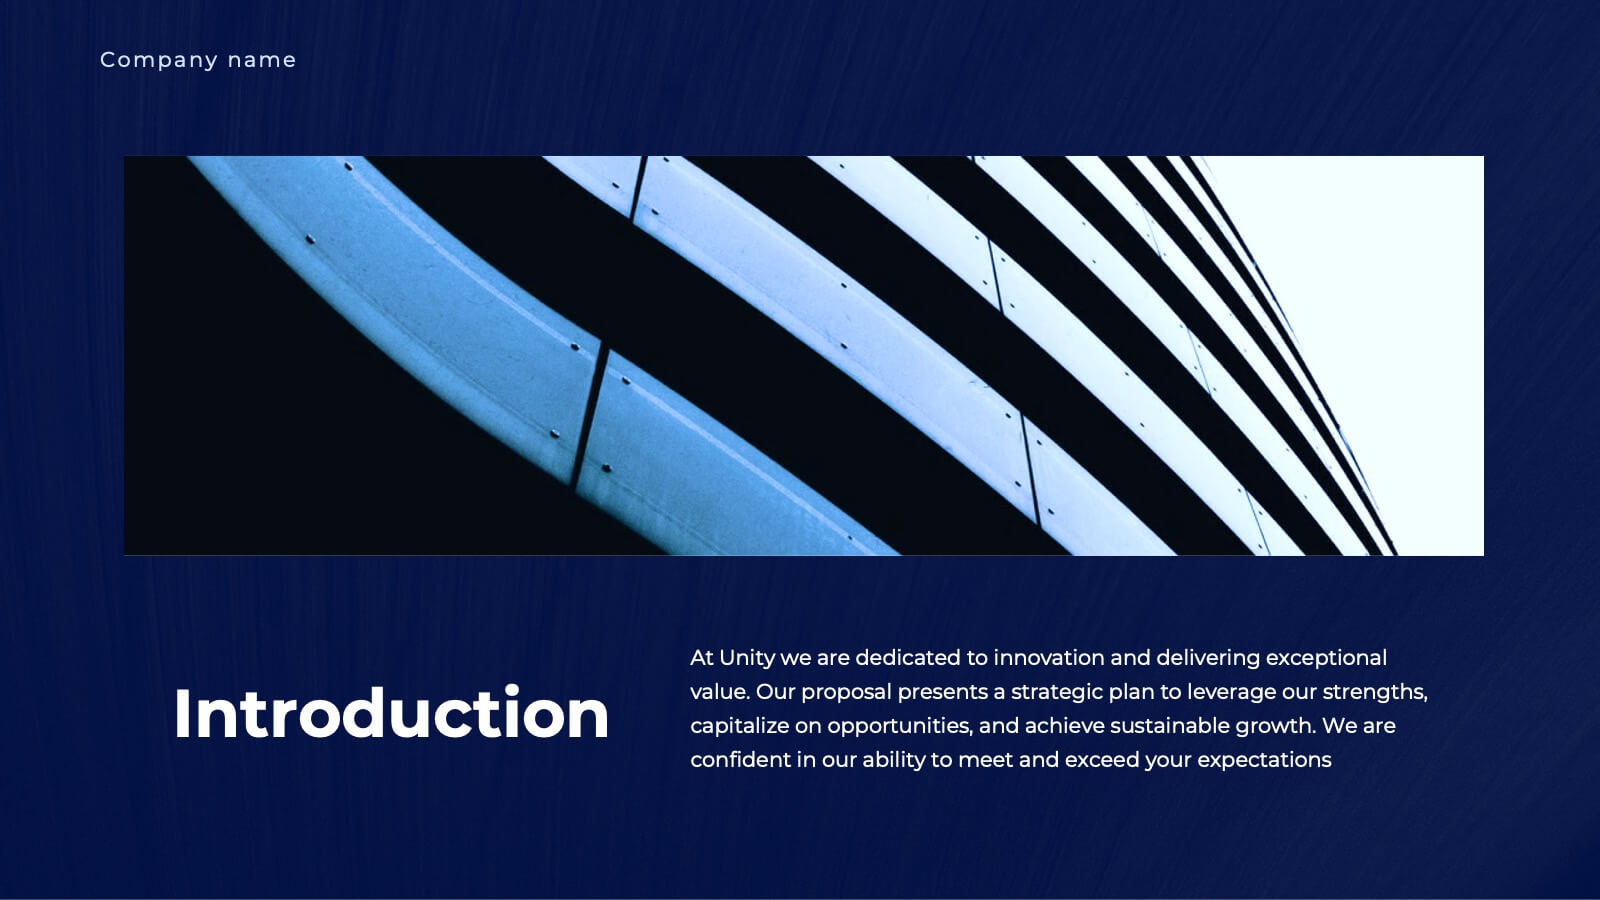
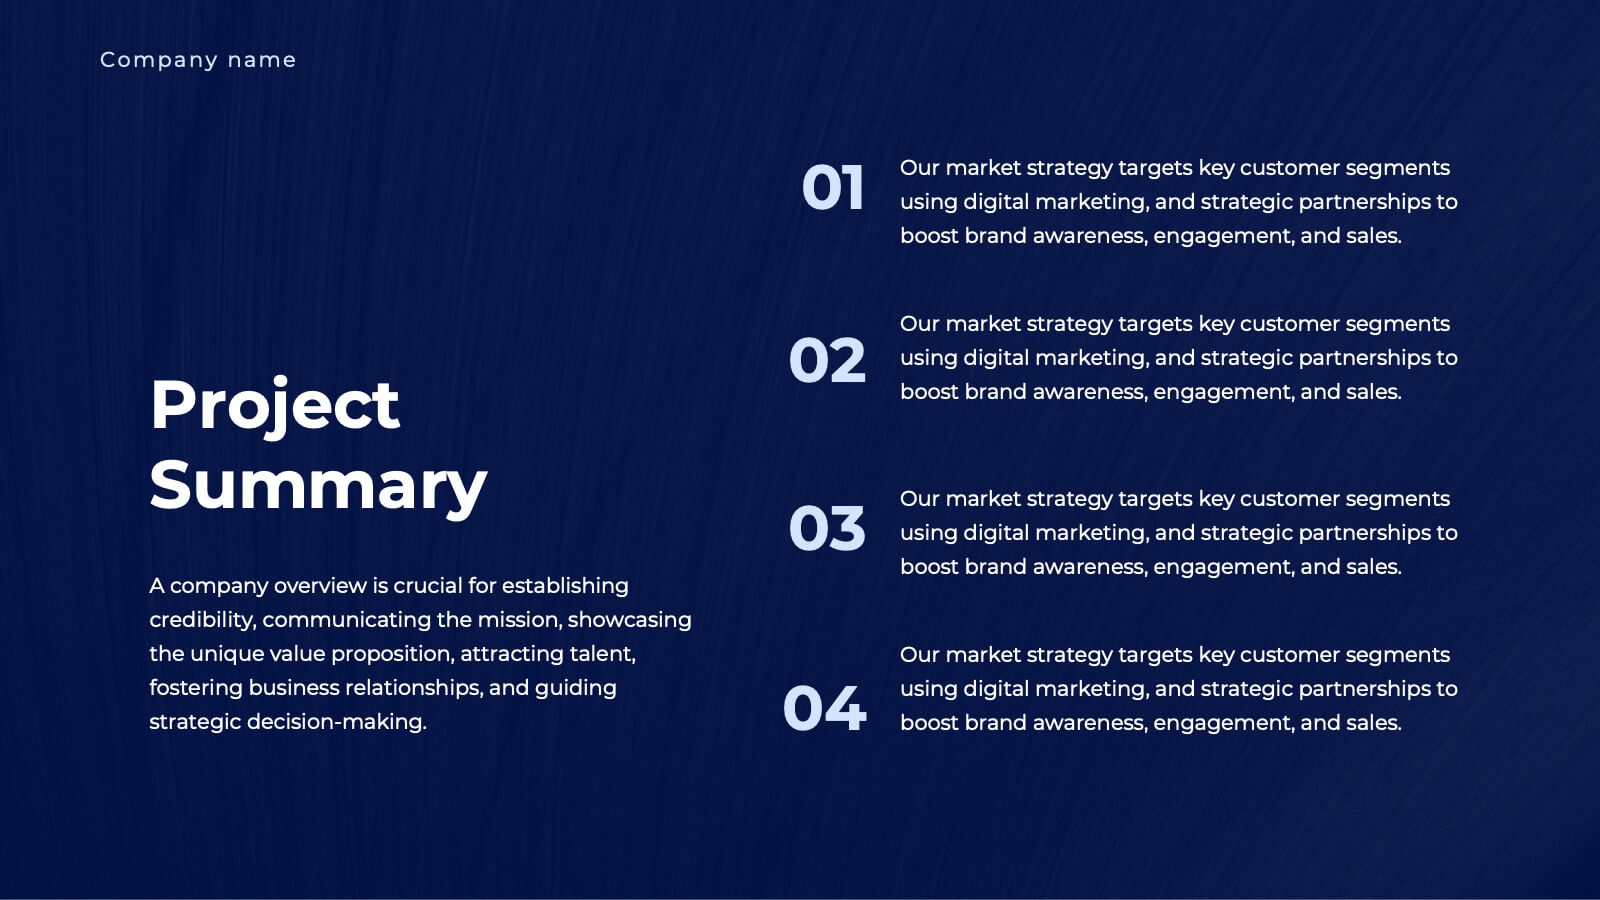
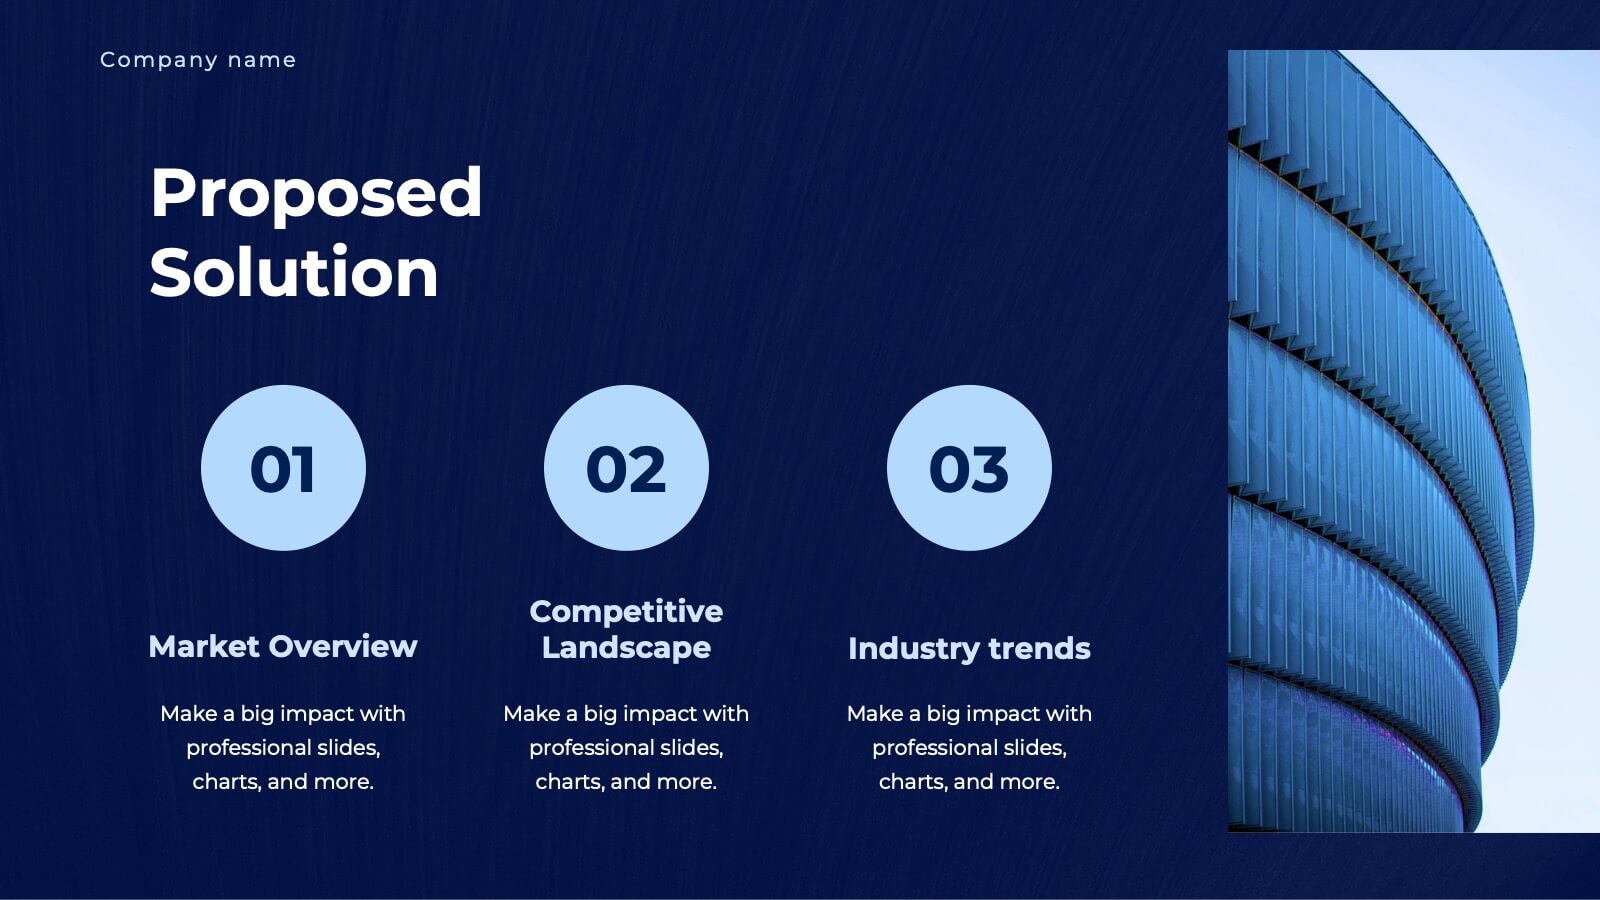
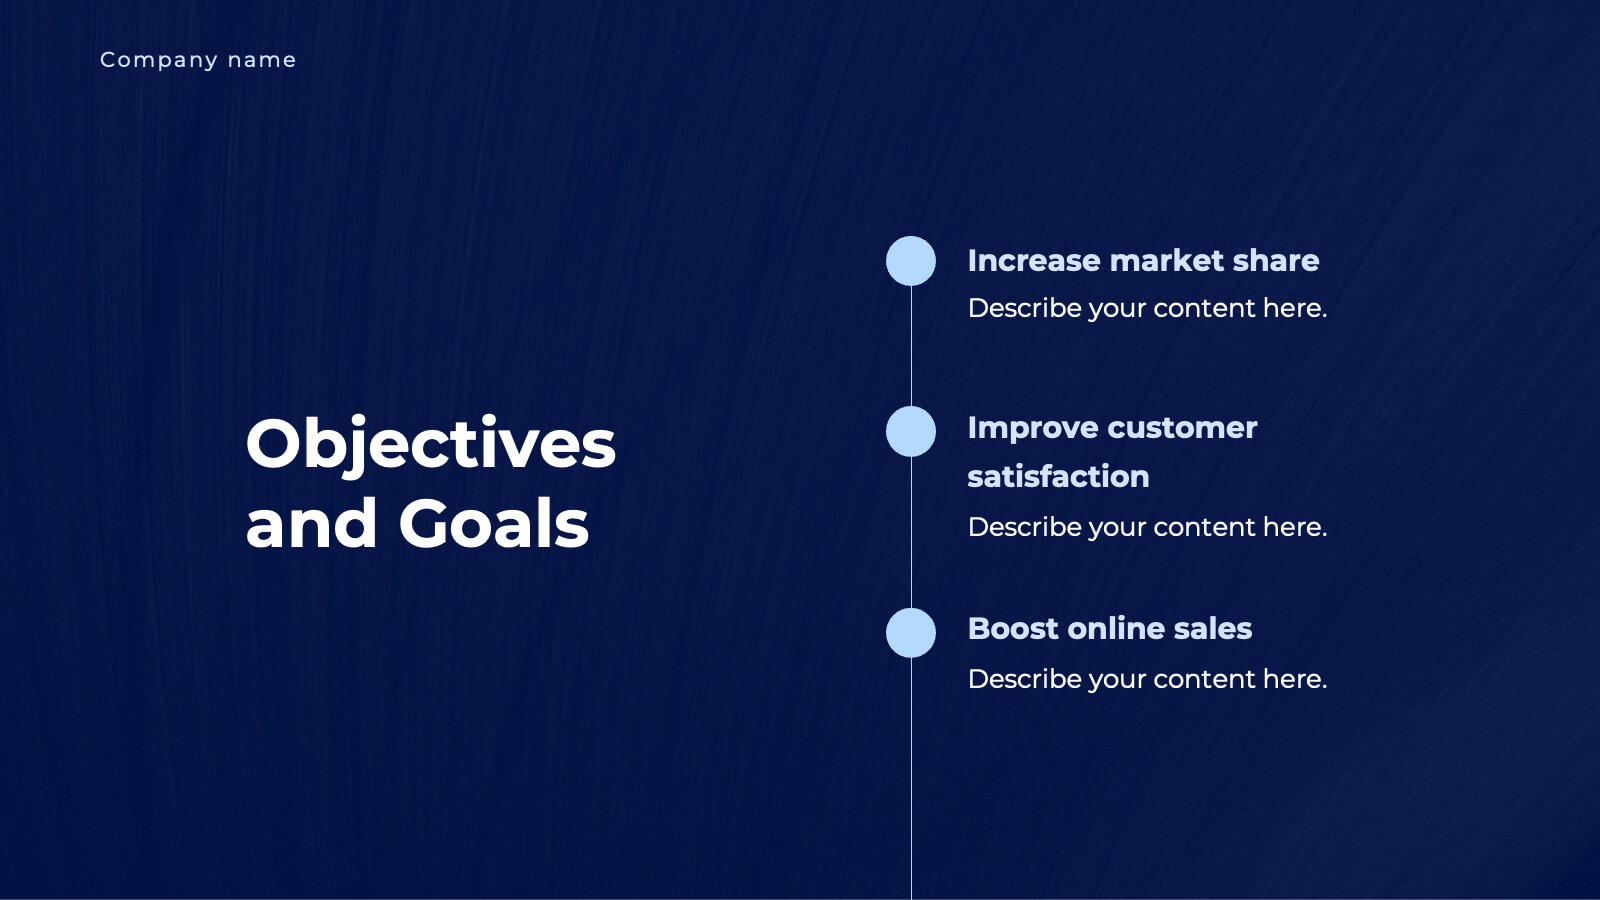
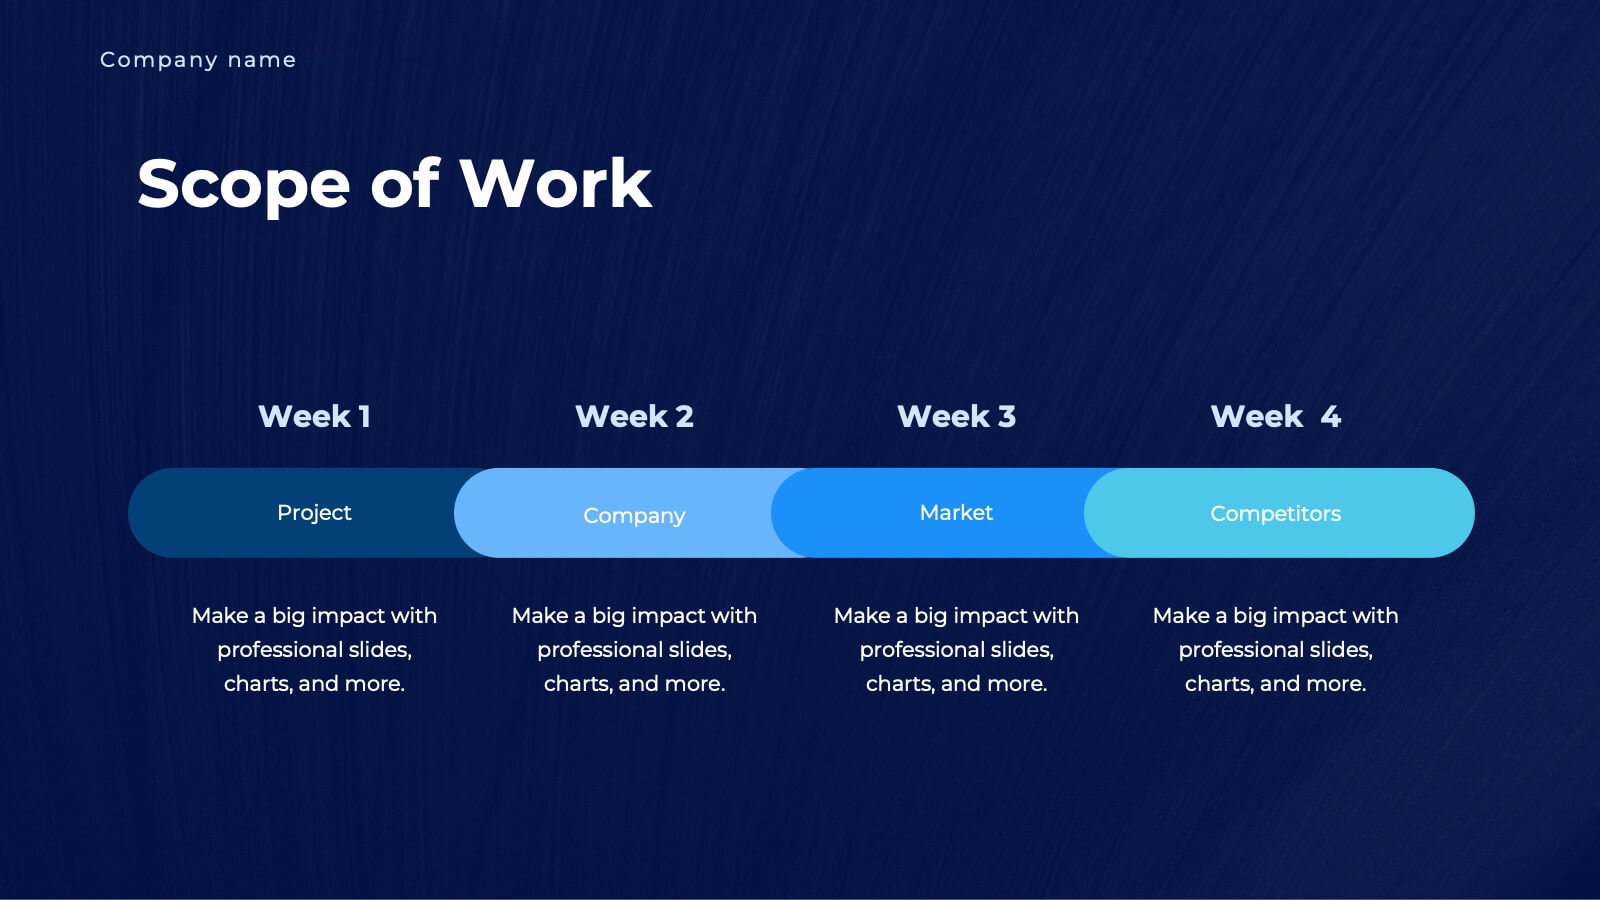
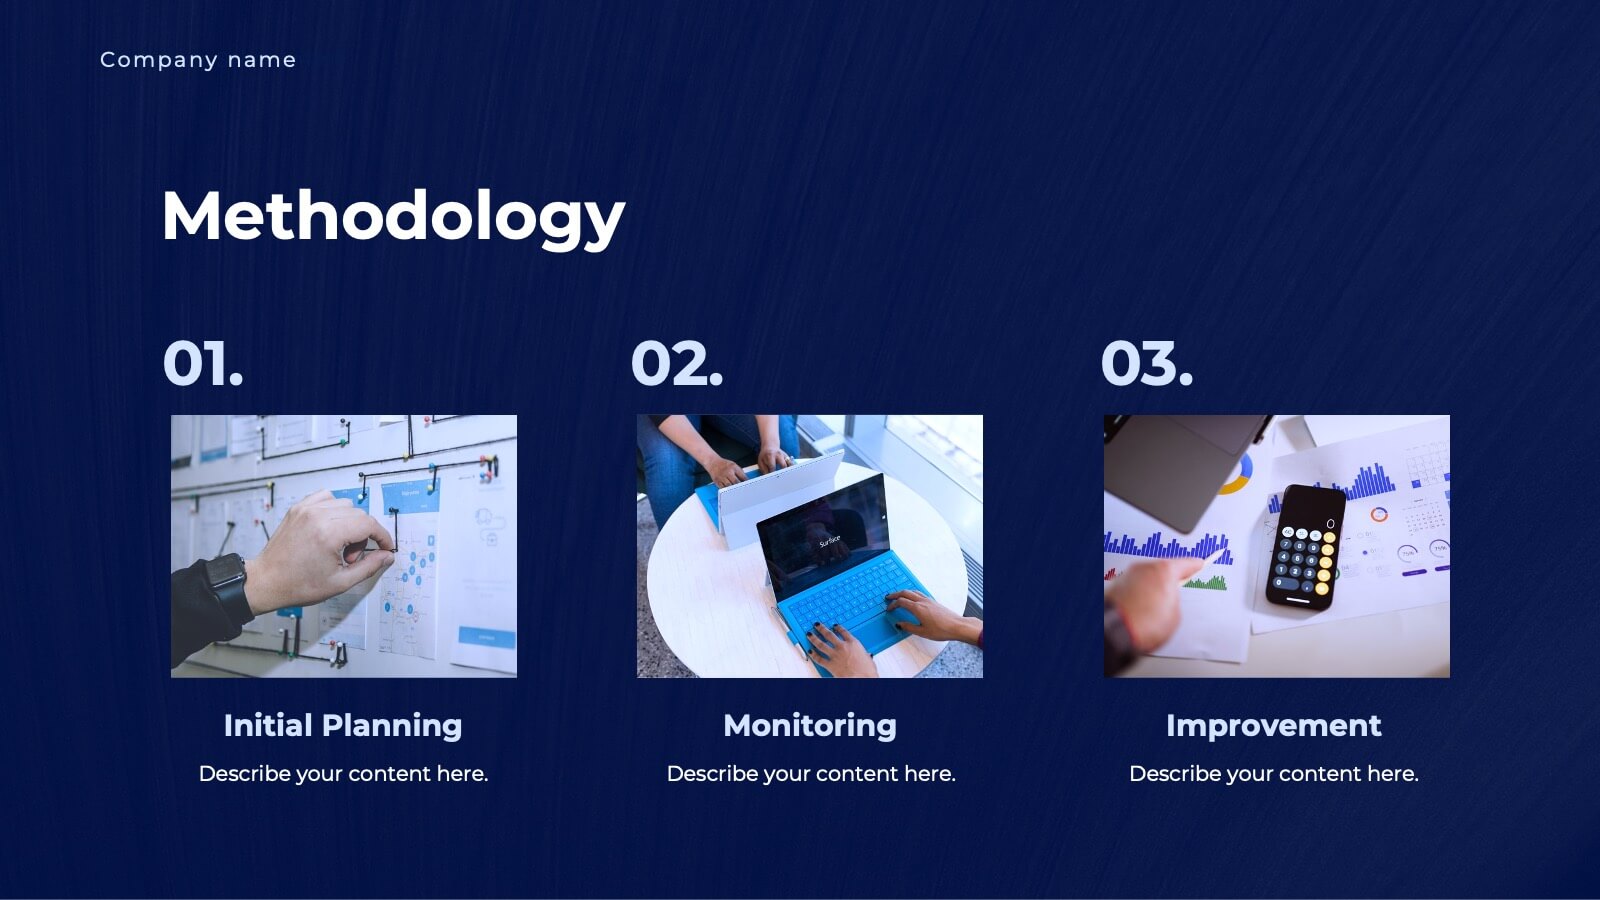
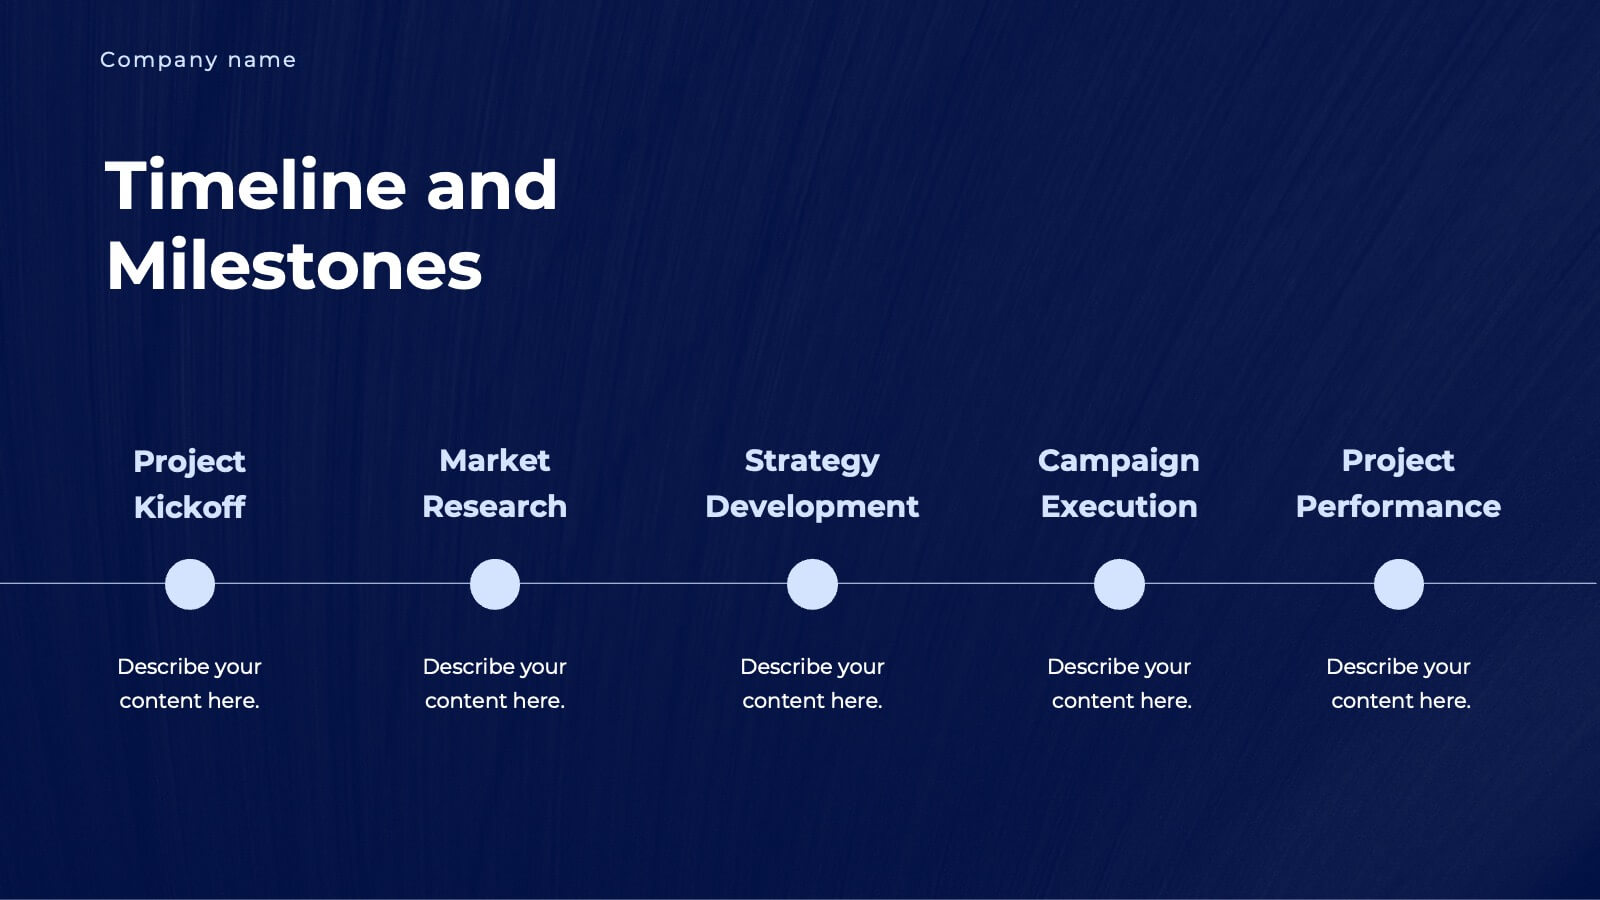
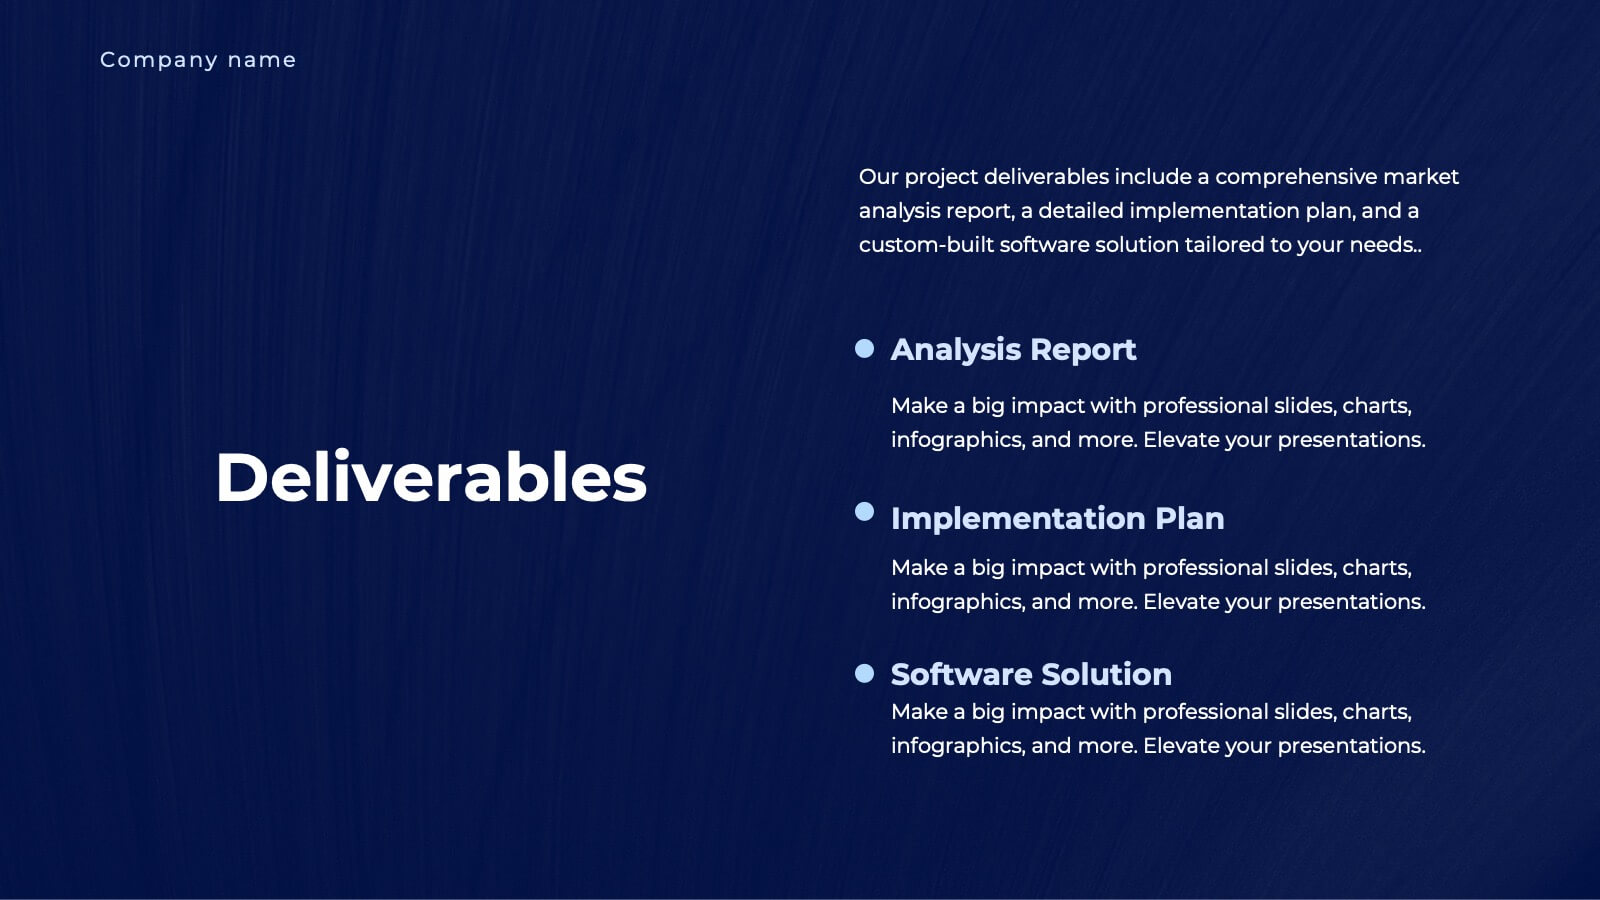
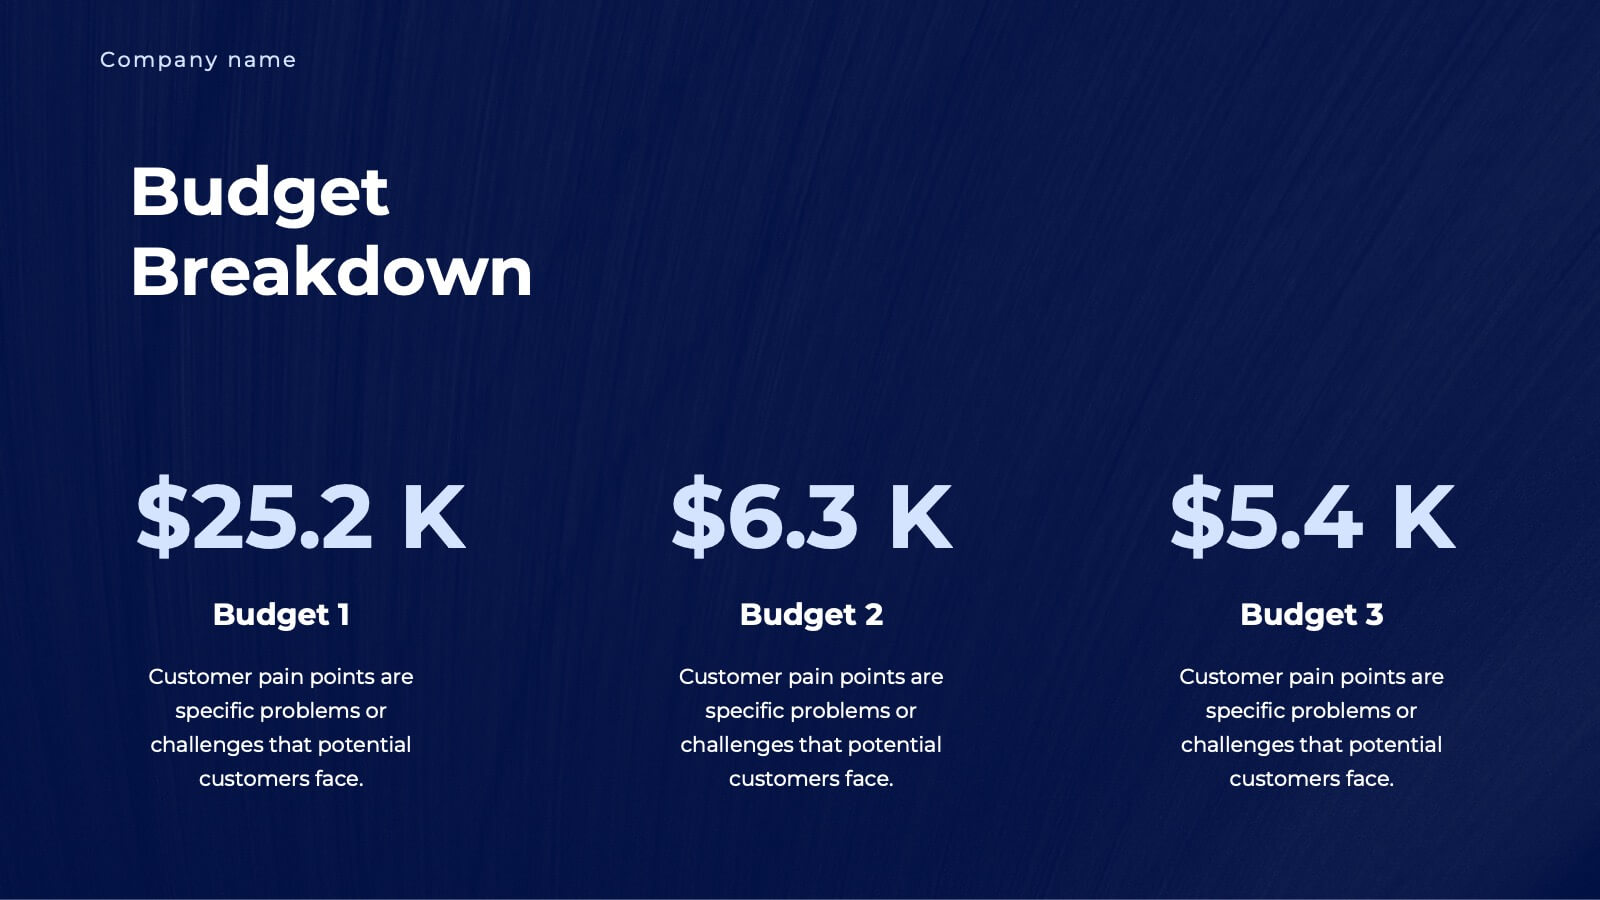
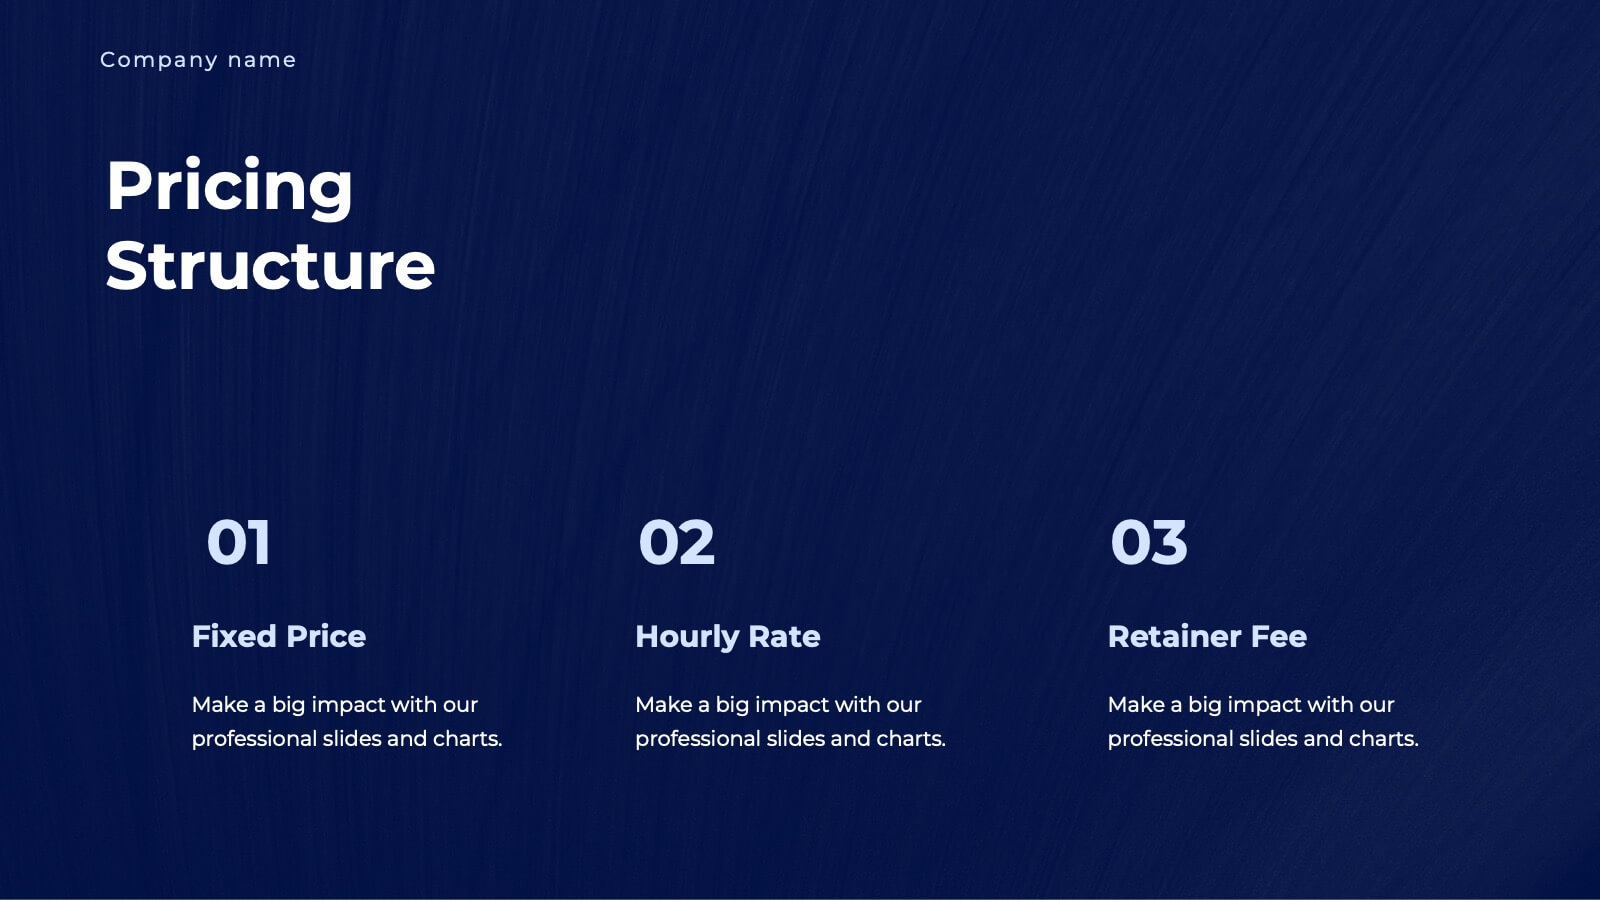
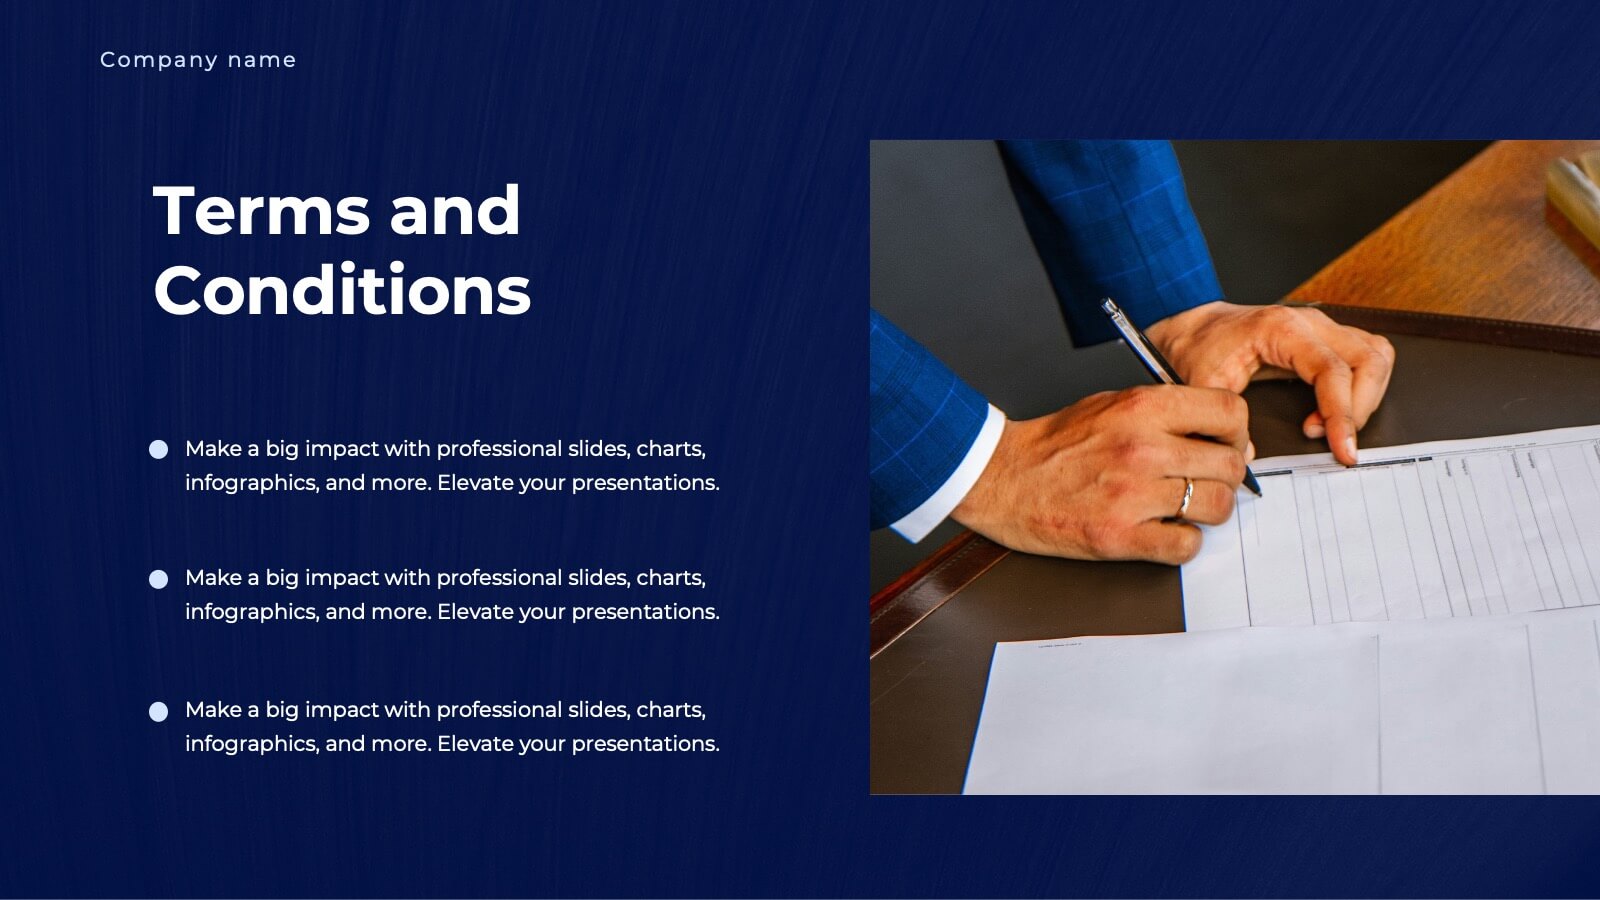
Unity Business Proposal Presentation
Take your business proposals to the next level with this elegant and comprehensive template! Perfect for presenting company overviews, project summaries, and detailed solutions. Ideal for business professionals looking to impress clients and stakeholders. Compatible with PowerPoint, Keynote, and Google Slides, this template ensures your proposals are impactful and professional.