


Características


¿Tienes alguna pregunta?
Recomendar


5 diapositivas
End-to-End Value Chain Map Presentation
Bring clarity to complex operations with a smooth, visual flow that makes every stage of your process easy to follow. This presentation maps activities from start to finish, helping teams understand dependencies, improve efficiency, and spot opportunities for optimization. Fully compatible with PowerPoint, Keynote, and Google Slides.


4 diapositivas
Task and Role Allocation Matrix
Clarify team responsibilities with this modern Task and Role Allocation Matrix. Easily visualize who is Responsible, Accountable, Contributing, and Informed for each task. Ideal for team leaders, HR planners, and project coordinators. Fully customizable in PowerPoint, Keynote, and Google Slides.


21 diapositivas
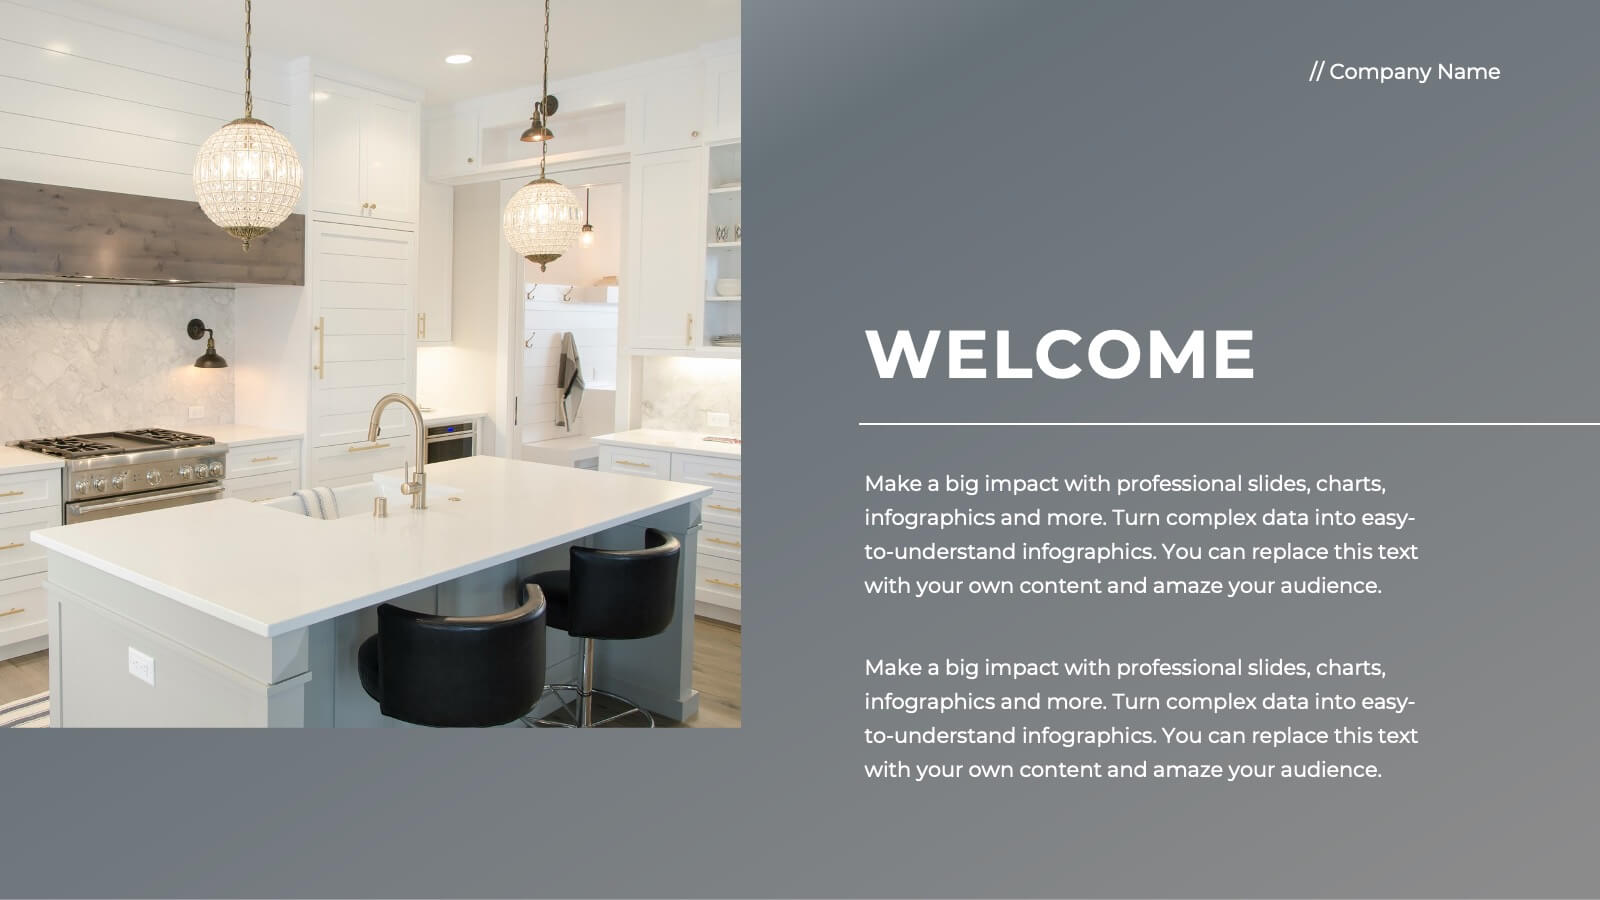
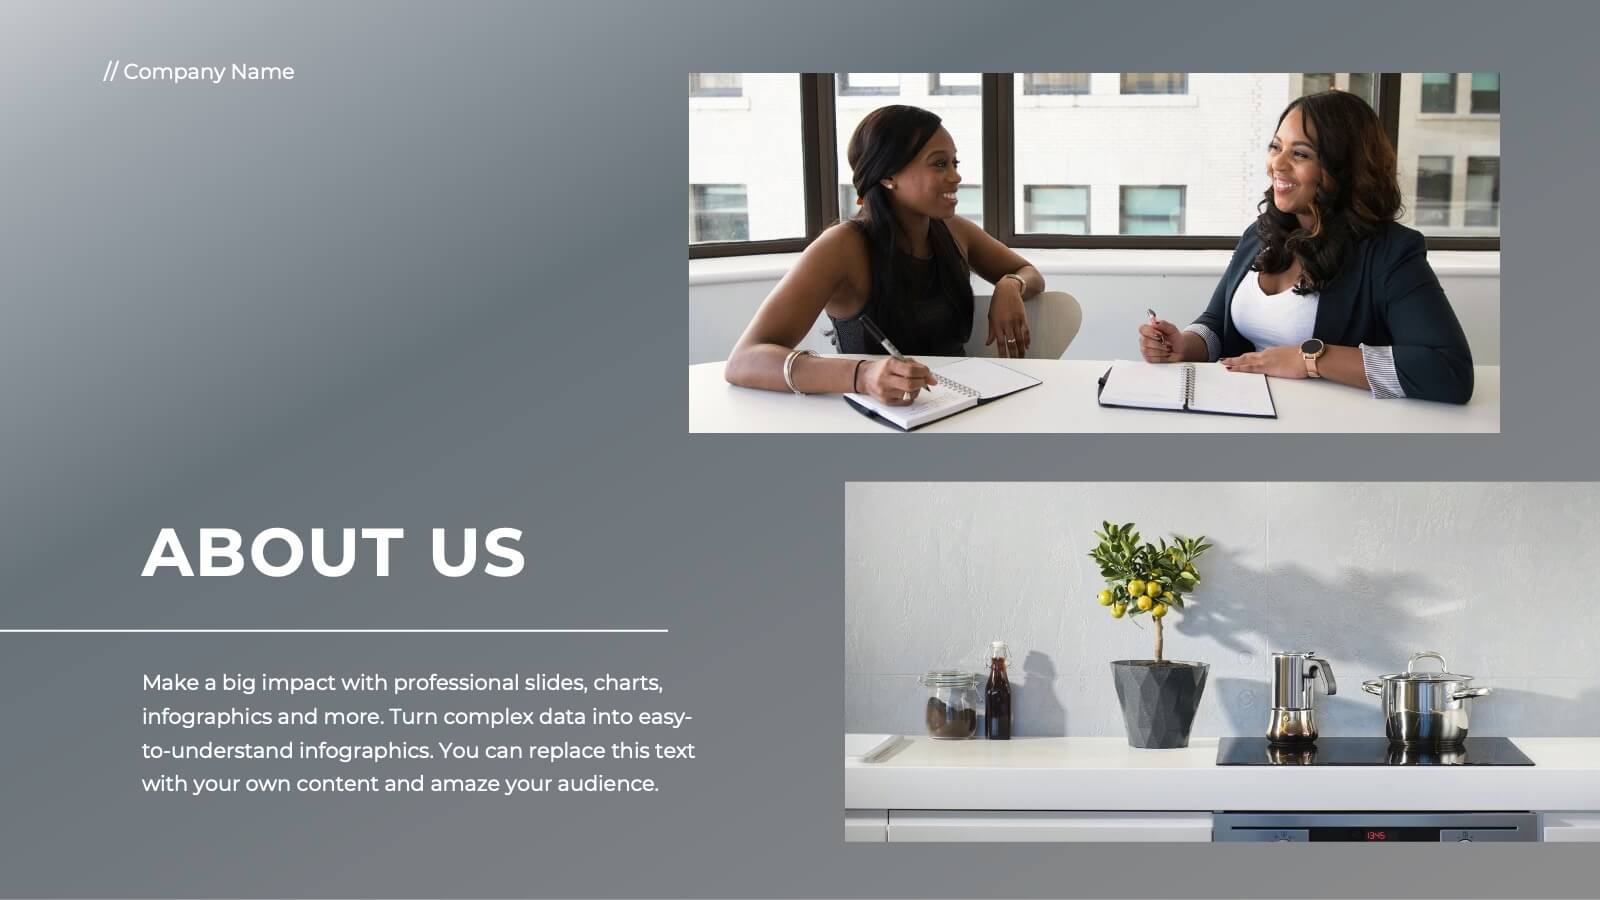
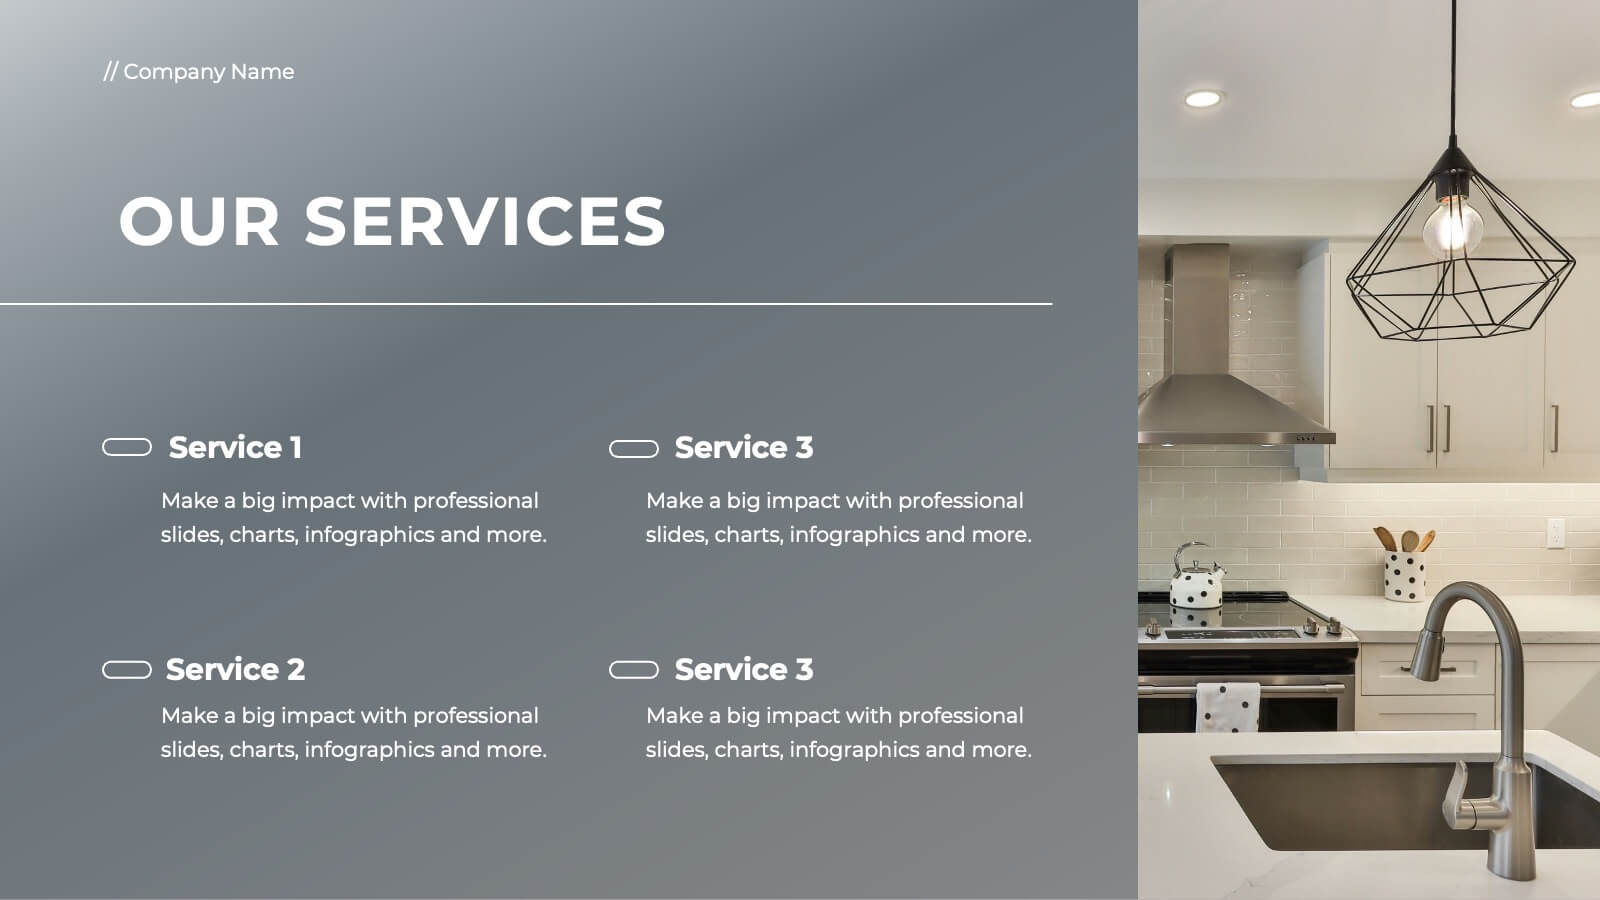
Flare Project Management Plan Presentation
Unleash the full potential of your projects with a dynamic plan template that makes every detail shine! This vibrant and clear design is built to guide your team and stakeholders through every phase of your project with confidence and clarity. Starting with a compelling introduction and project overview, this template captures attention and sets the stage for success. Dive deep into problem statements, objectives, and the scope of work, all presented in a visually appealing and easy-to-digest format. With sections dedicated to timelines, milestones, budget breakdowns, and resource allocation, this template ensures every aspect of your project is meticulously planned and communicated. The inclusion of stakeholder analysis, risk management, and quality assurance plans showcases your thorough approach to project management. Perfectly compatible with PowerPoint, Keynote, and Google Slides, this template is your go-to tool for creating project plans that are both inspiring and effective. Get ready to impress and lead your projects to success!


6 diapositivas
System Maintenance and Support Presentation
Streamline your technical processes with the System Maintenance and Support Presentation. This slide features a clean alphabetical list layout (A–E) paired with icons and concise text areas—ideal for illustrating maintenance protocols, support categories, or troubleshooting stages. The right-side wrench graphic adds a visual metaphor for IT upkeep. Fully editable in PowerPoint, Keynote, and Google Slides.


6 diapositivas
Product Launch Milestone Plan Presentation
Turn your big idea into a successful launch with this bold and structured presentation design. Perfect for outlining goals, tracking phases, and measuring progress, it keeps your product roadmap clear and engaging. Easily editable and compatible with PowerPoint, Keynote, and Google Slides for seamless presentation creation.


4 diapositivas
Options Comparison Chart Presentation
Make every decision crystal clear with a dynamic, easy-to-follow layout designed to compare options side by side. Perfect for presenting business strategies, pricing plans, or feature breakdowns, this presentation helps your audience see the value instantly. Fully compatible with PowerPoint, Keynote, and Google Slides for effortless editing.


10 diapositivas
Work-Life Balance and Time Planning Presentation
Showcase strategies for harmony and productivity with this scale-themed presentation template. Designed to highlight balance, prioritization, and goal-setting, this visual layout divides your content into four clear parts—perfect for wellness initiatives, HR planning, or personal productivity talks. Fully editable in PowerPoint, Keynote, and Google Slides.


5 diapositivas
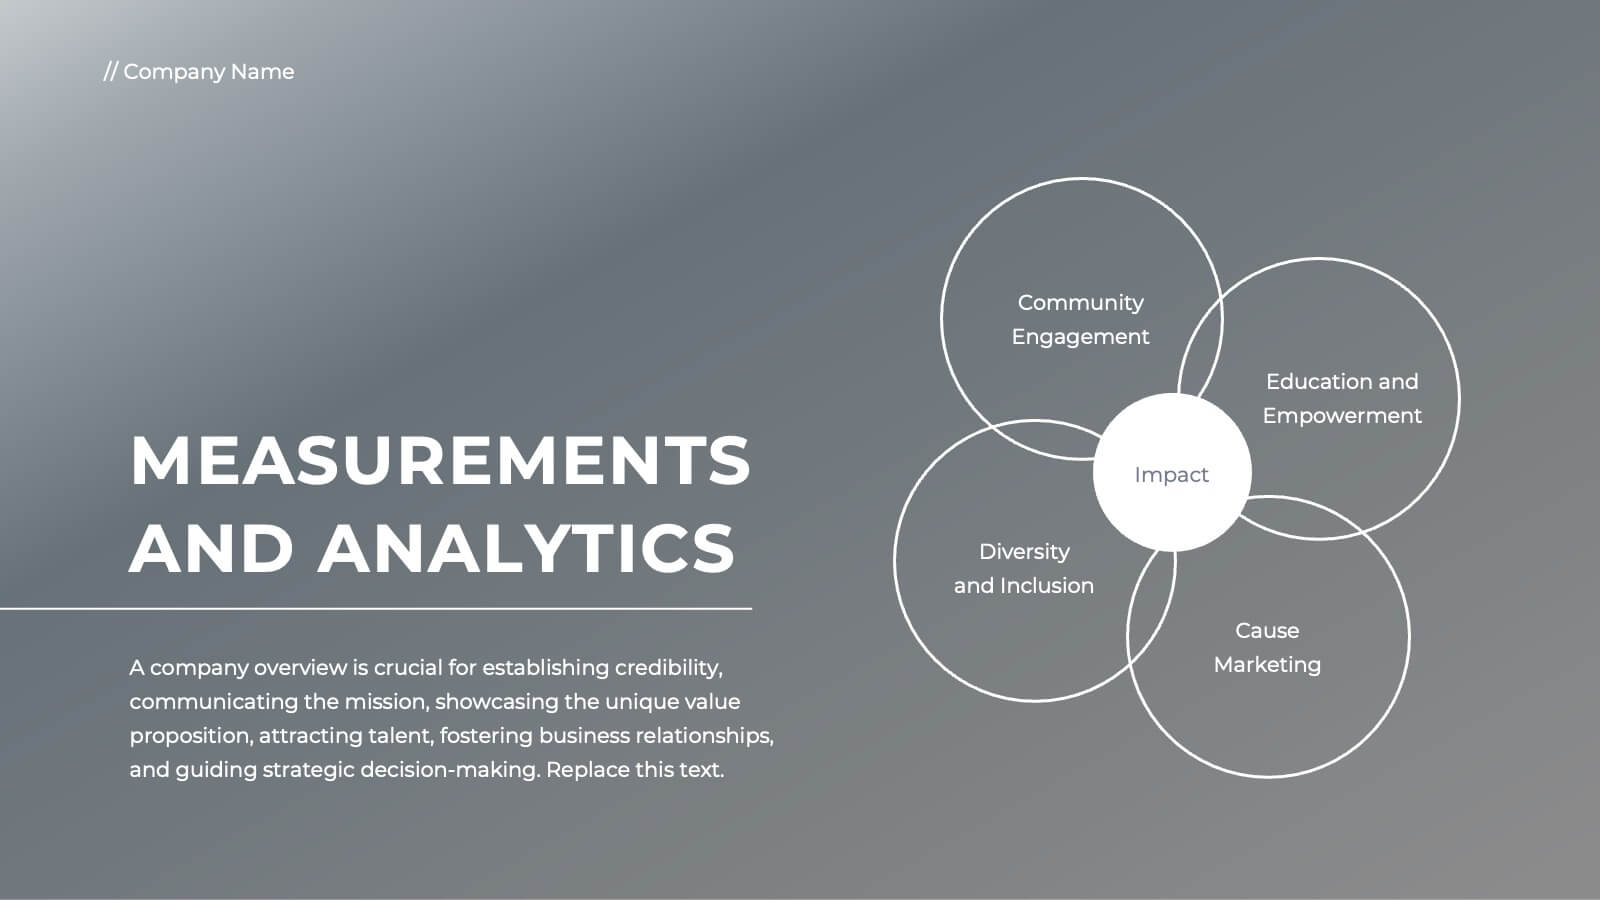
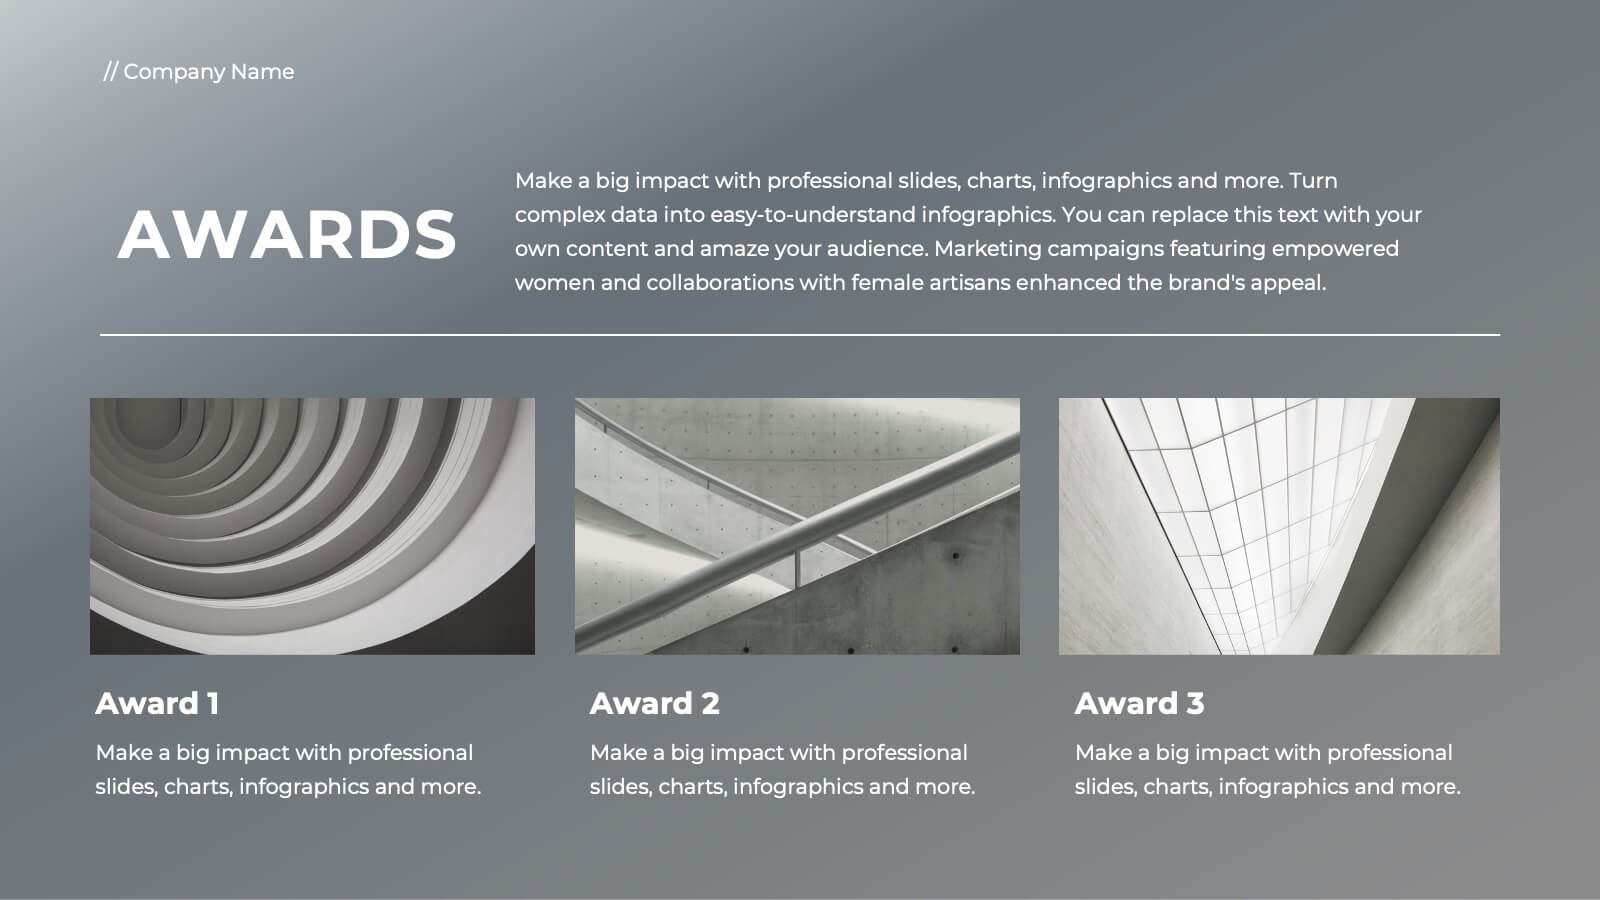
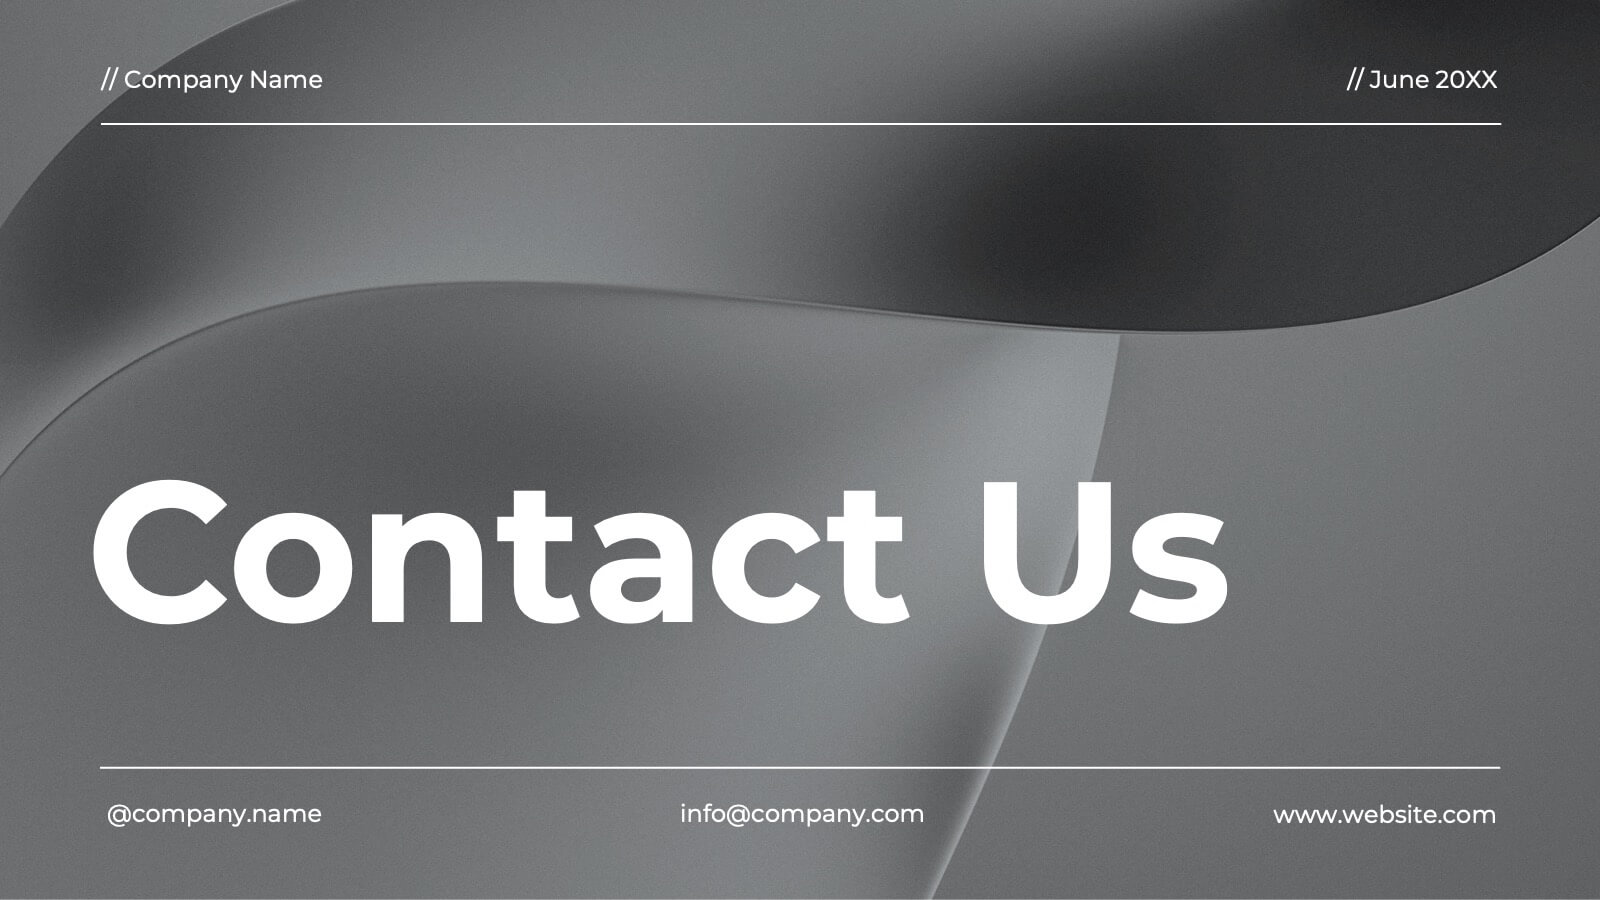
Business Introduction and Company Profile Presentation
Introduce your business with precision and clarity using this company profile layout. Highlight your mission, vision, and key insights alongside sleek visuals and structured content. Perfect for new client onboarding, internal briefings, or stakeholder presentations. Fully editable in PowerPoint, Keynote, and Google Slides for seamless, professional customization.


25 diapositivas
Keystone Market Research Presentation
Present your market research with confidence using this stylish, contemporary template. Perfect for detailing research objectives, data collection, and key findings, it features a sleek design with vibrant colors. Highlight critical aspects like market trends, results interpretation, and recommendations to captivate your audience. Compatible with PowerPoint, Keynote, and Google Slides, it ensures seamless presentations on any platform.


6 diapositivas
Clarifying Questions and Response Slide Presentation
Help your audience follow complex topics with the Clarifying Questions and Response Slide Presentation. Designed around a bold question mark layout, this slide format highlights five key clarifications or FAQs alongside thoughtful responses. Ideal for training, onboarding, or product demos, it enhances understanding and engagement. Fully editable in Canva, PowerPoint, Keynote, and Google Slides.


6 diapositivas
Role-Based Responsibility Matrix Presentation
Clarify team roles and accountability with this structured responsibility matrix. Perfect for RACI models and project task alignment, this template features customizable categories, color-coded rows, and editable role labels. Ideal for project managers and team leads. Fully compatible with PowerPoint, Google Slides, and Keynote for easy customization and collaboration.


4 diapositivas
School Curriculum Overview Presentation
Present your academic plan with this creative curriculum overview layout. Featuring intersecting pencil graphics, it visually organizes four key subjects or areas of focus. Perfect for teachers, school administrators, or education consultants. Fully customizable in PowerPoint, Keynote, and Google Slides to match any educational level or institutional branding.


5 diapositivas
Business Process Checklist Presentation
Ensure smooth workflows with the Business Process Checklist template. This visually structured layout simplifies process tracking, highlighting key steps and completion percentages. Perfect for project managers and teams looking to optimize efficiency. Fully editable and compatible with PowerPoint, Keynote, and Google Slides for easy customization and seamless presentation.


21 diapositivas
Elixara Startup Funding Proposal Presentation
Give your startup the pitch it deserves with this elegantly designed funding proposal presentation. Covering key areas like business model, competitive analysis, financial overview, and growth strategies, this template helps you present your vision with confidence. Fully customizable and compatible with PowerPoint, Keynote, and Google Slides for a seamless investor-ready experience.


22 diapositivas
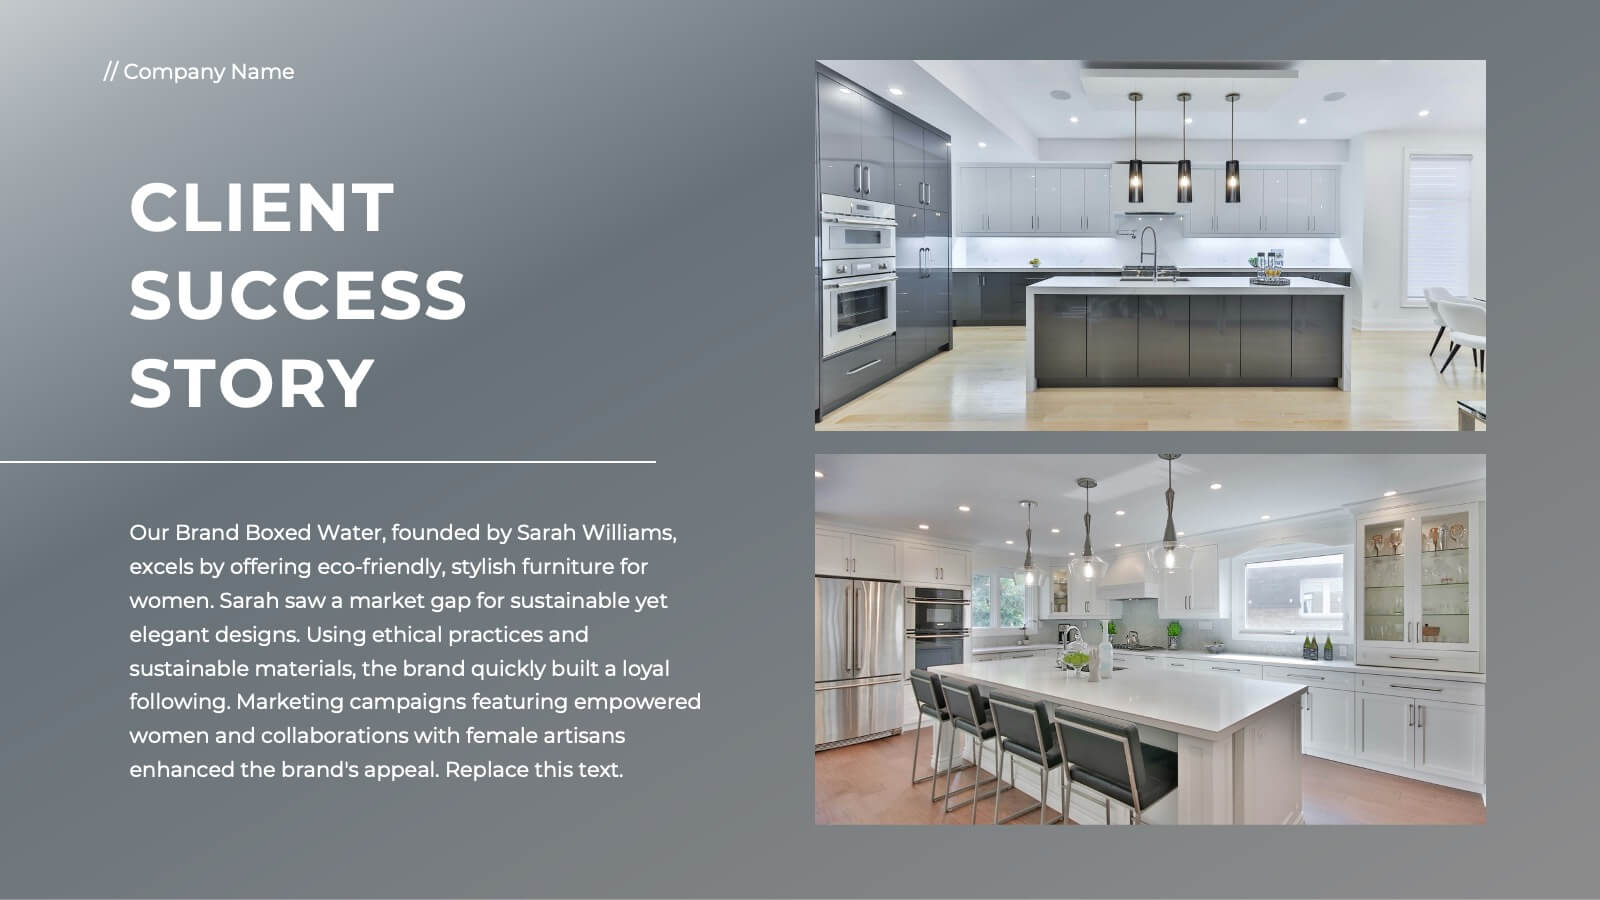
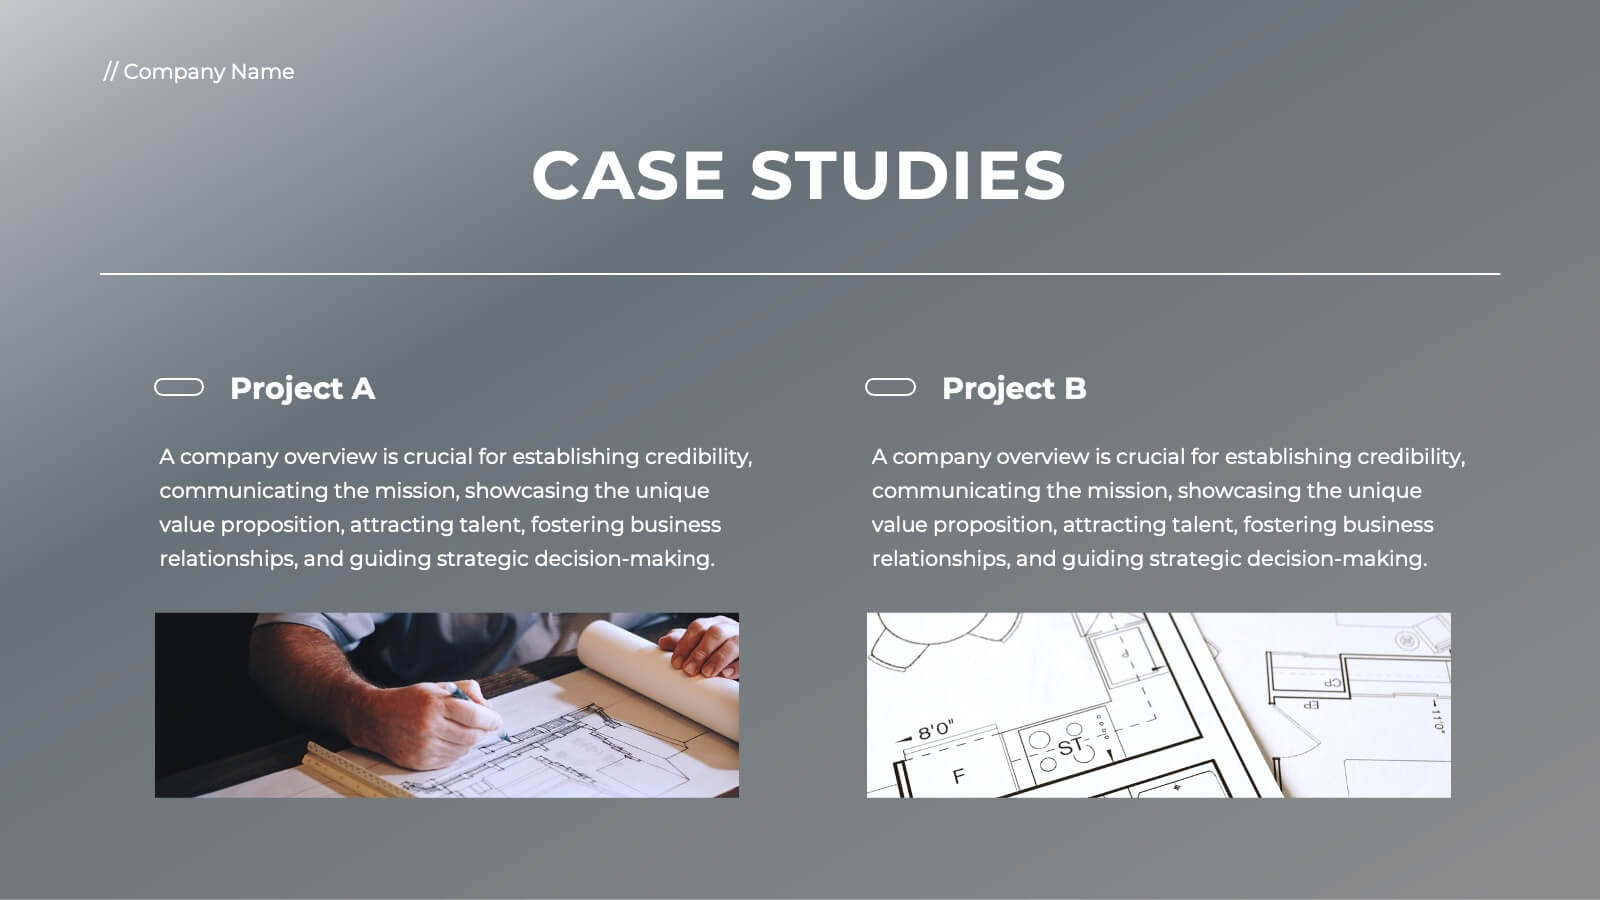
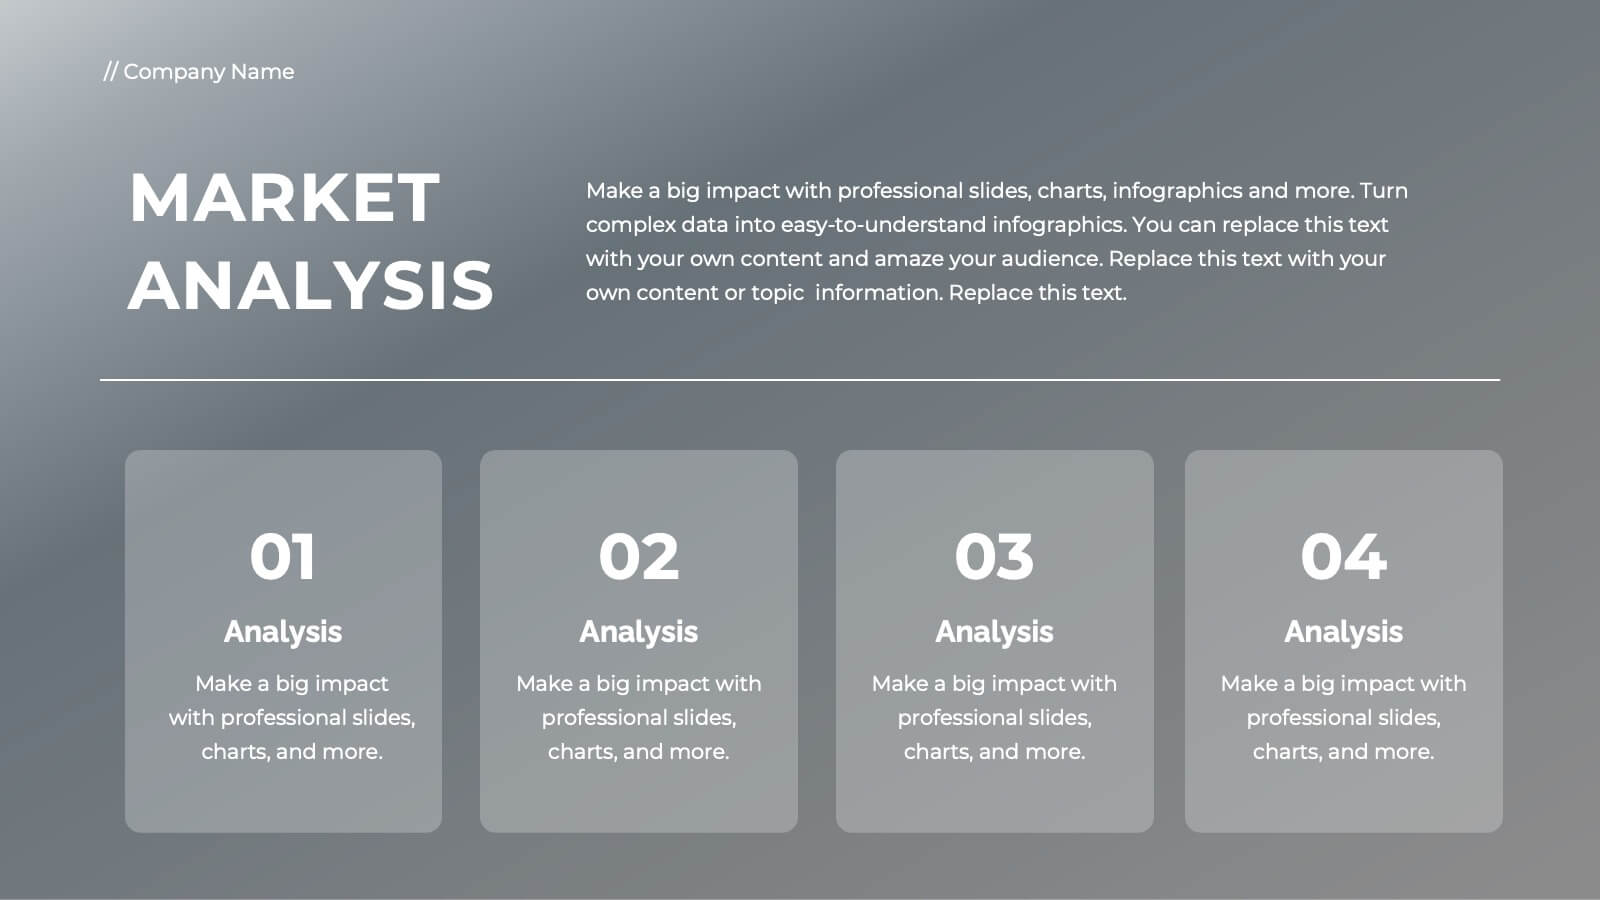
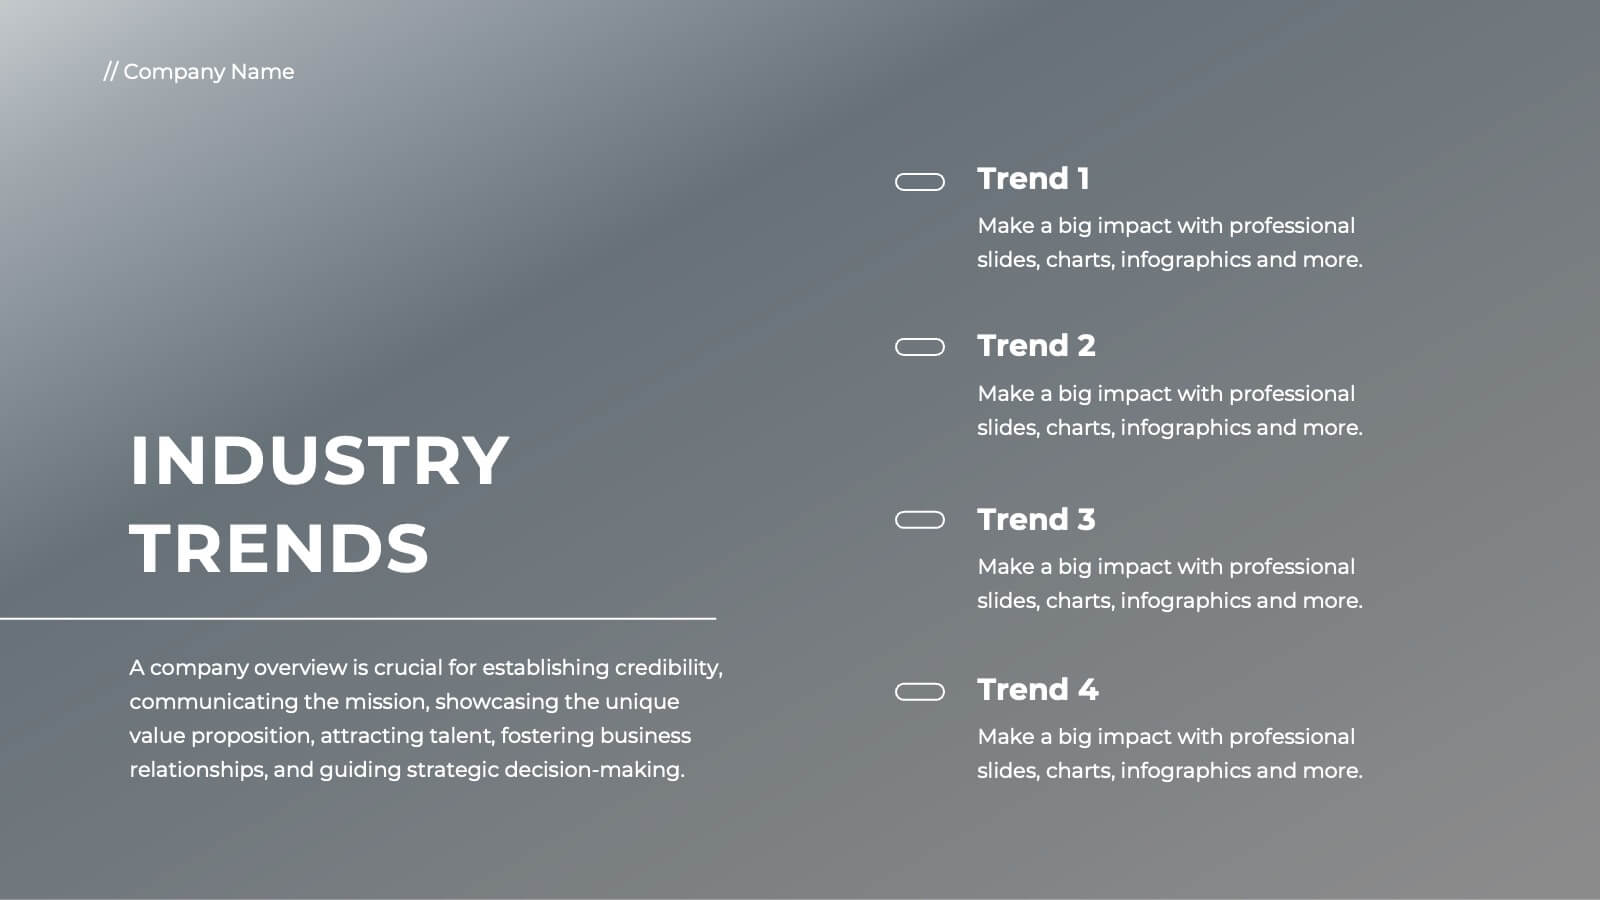
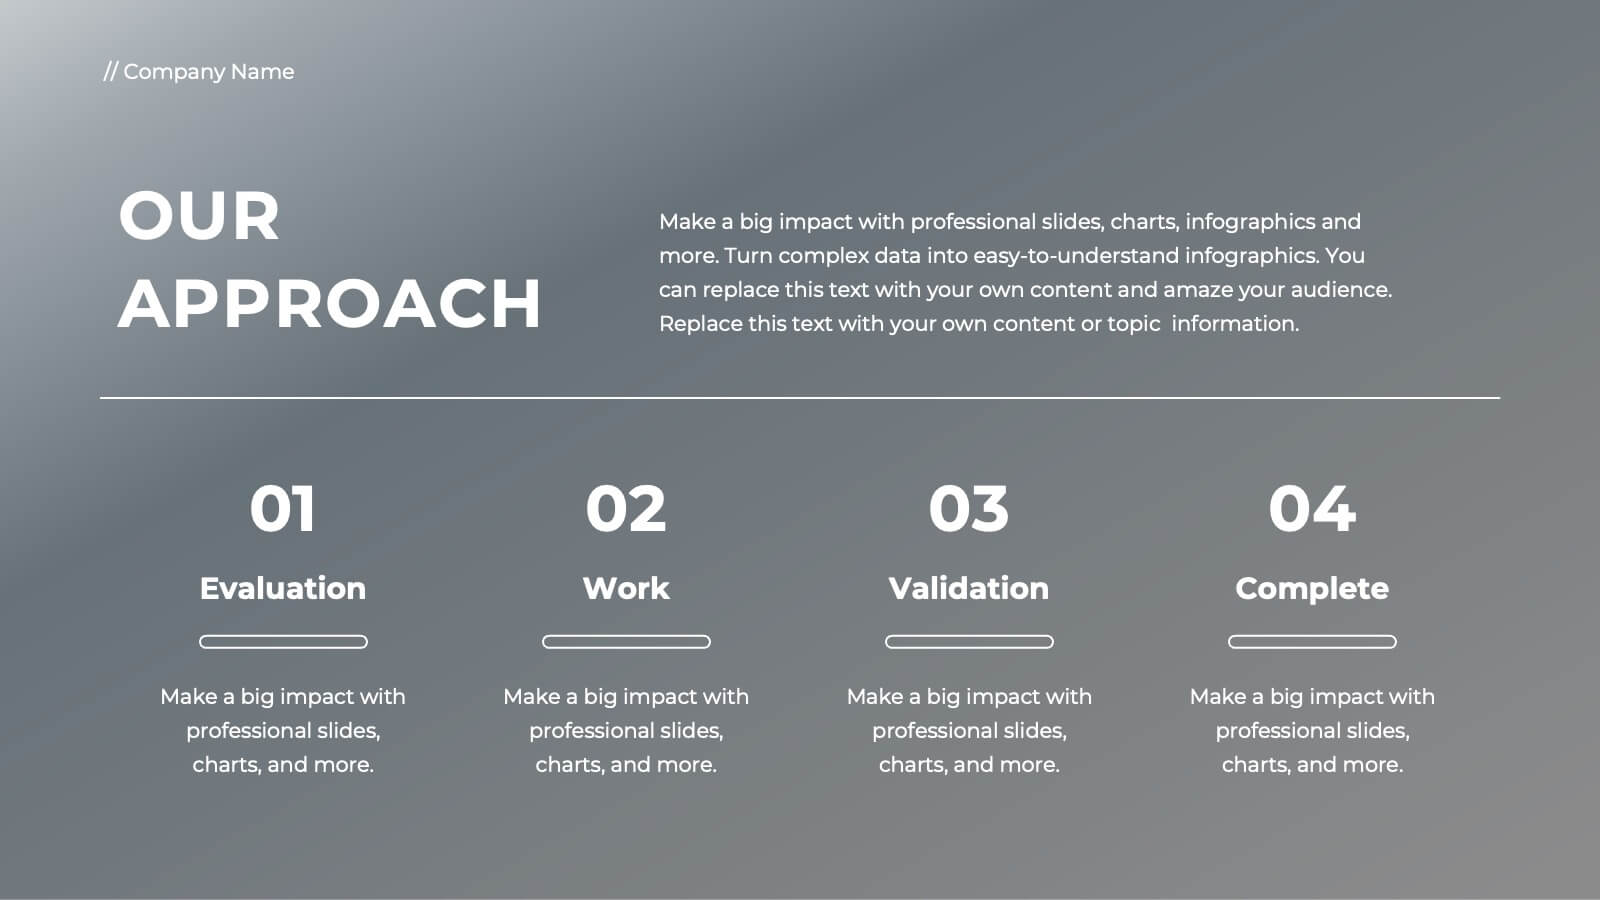
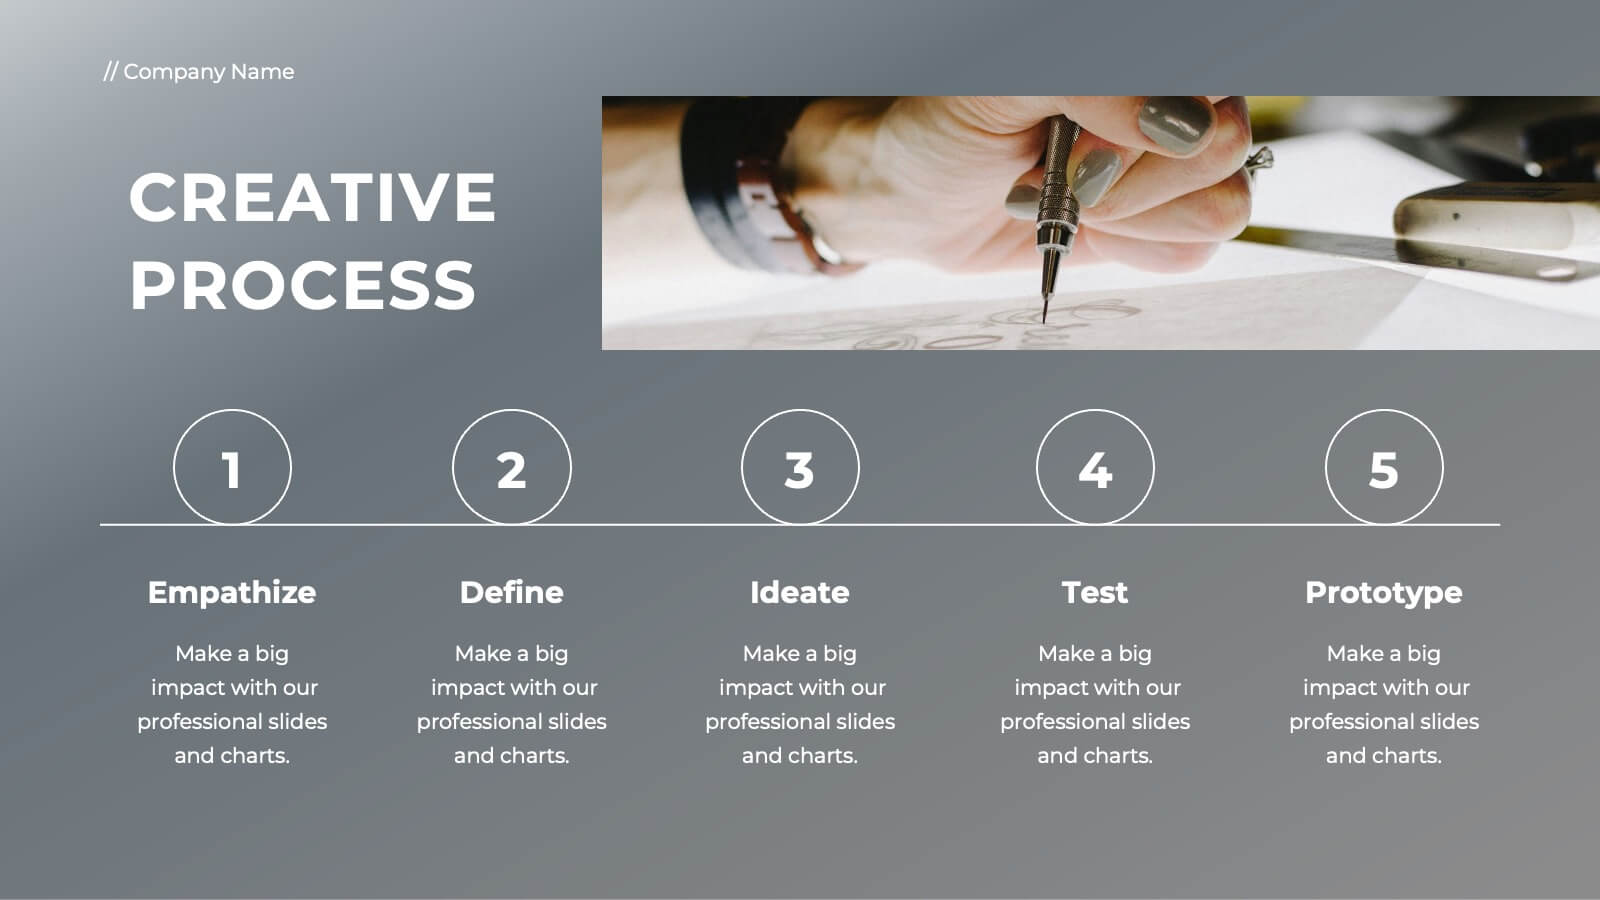
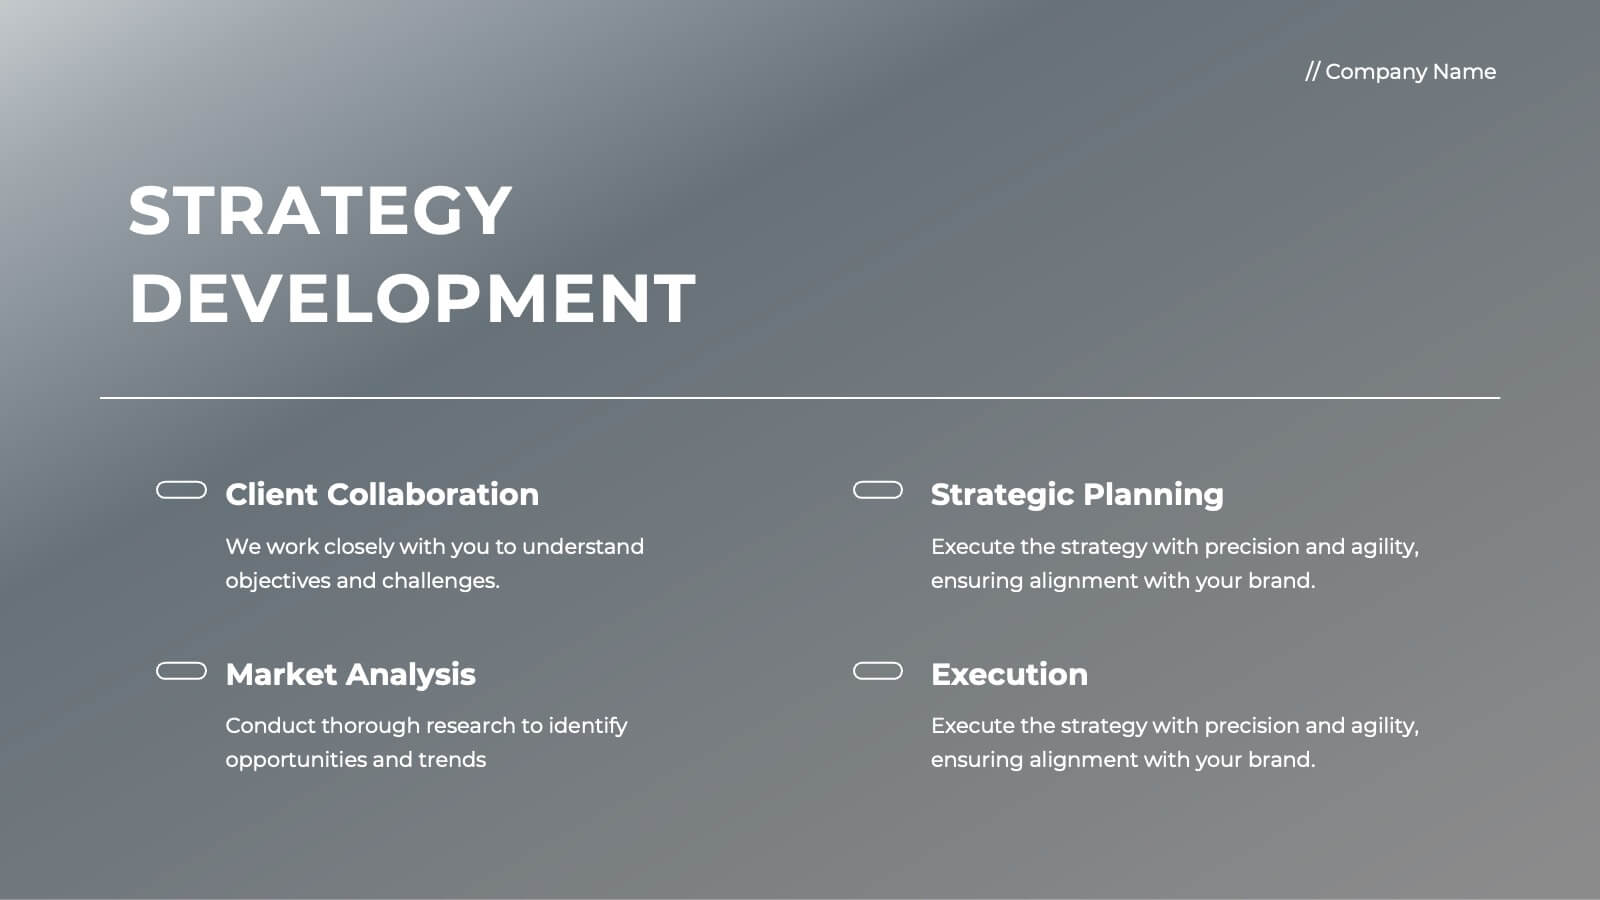
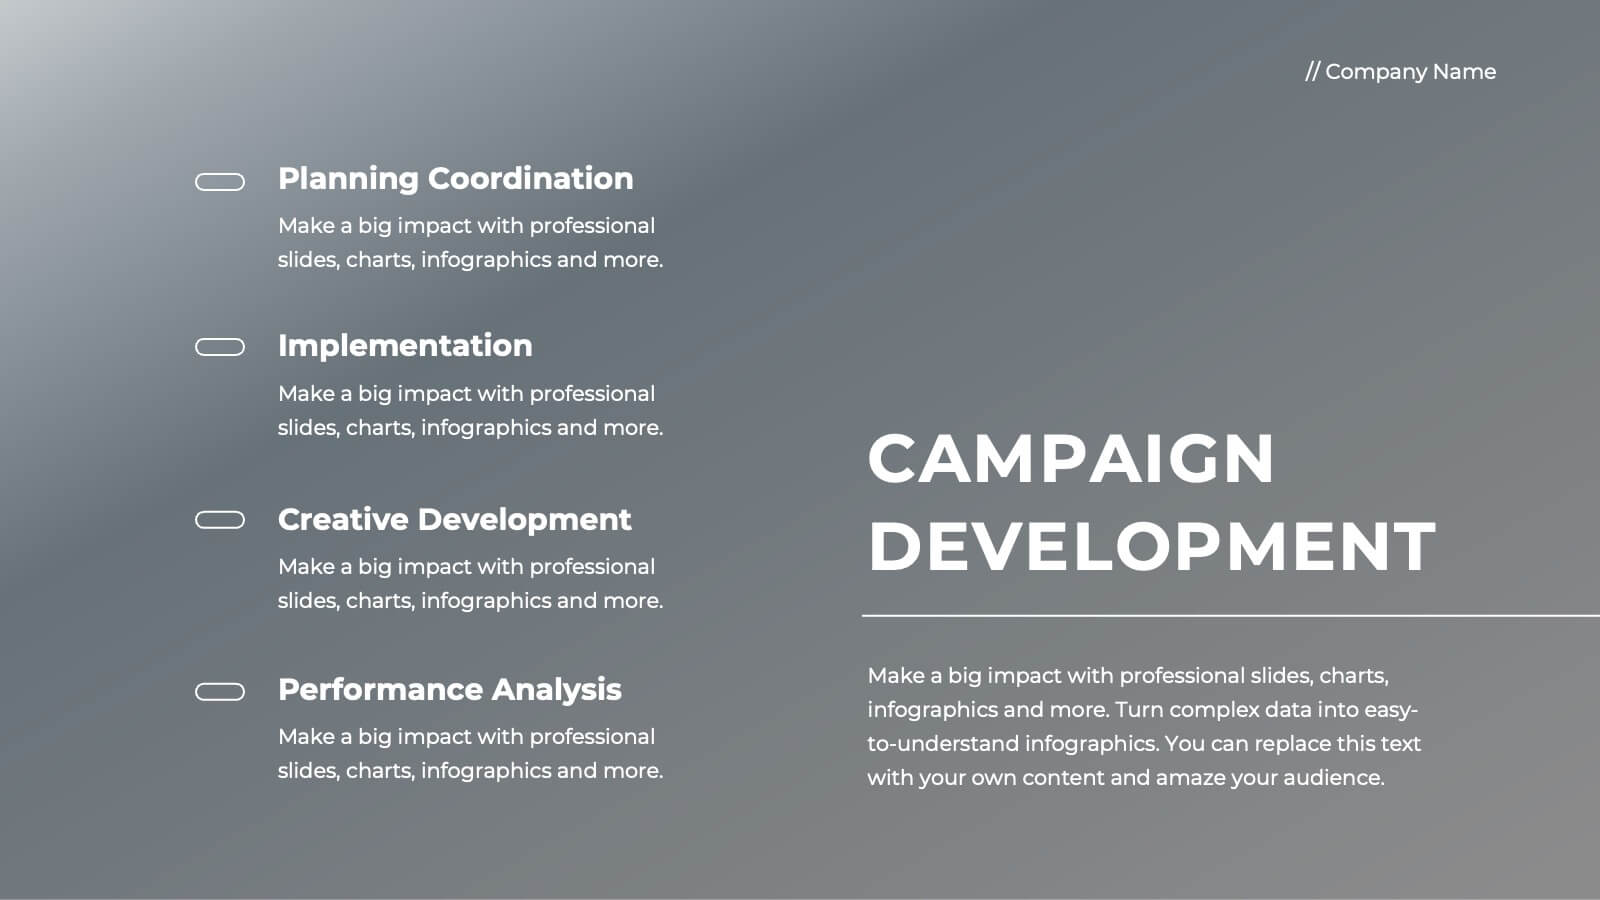
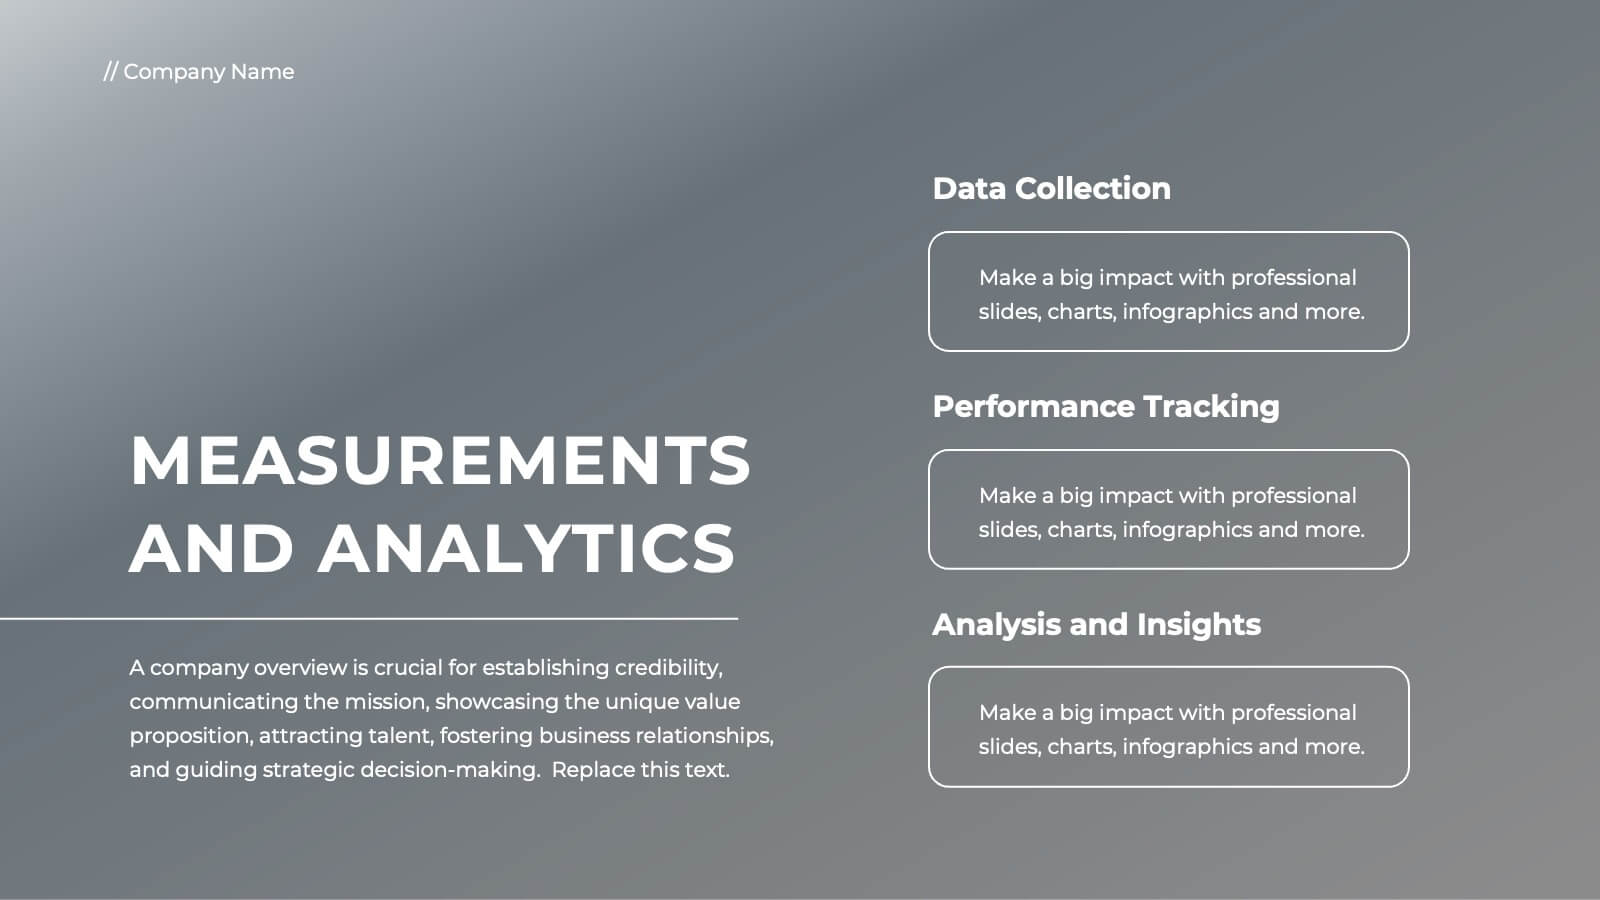
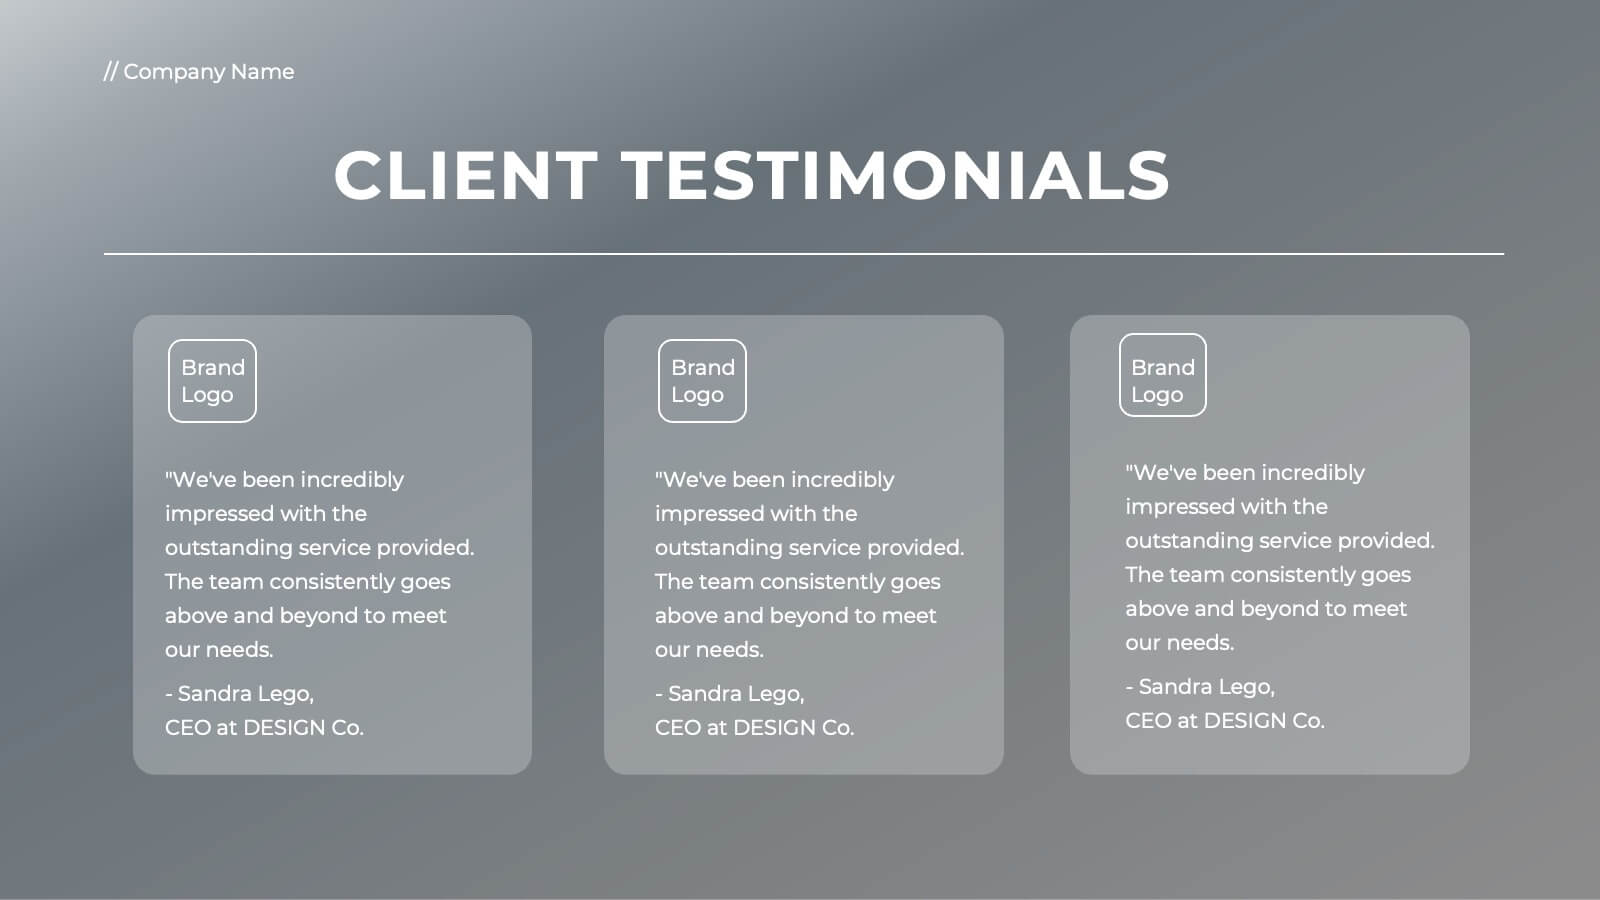
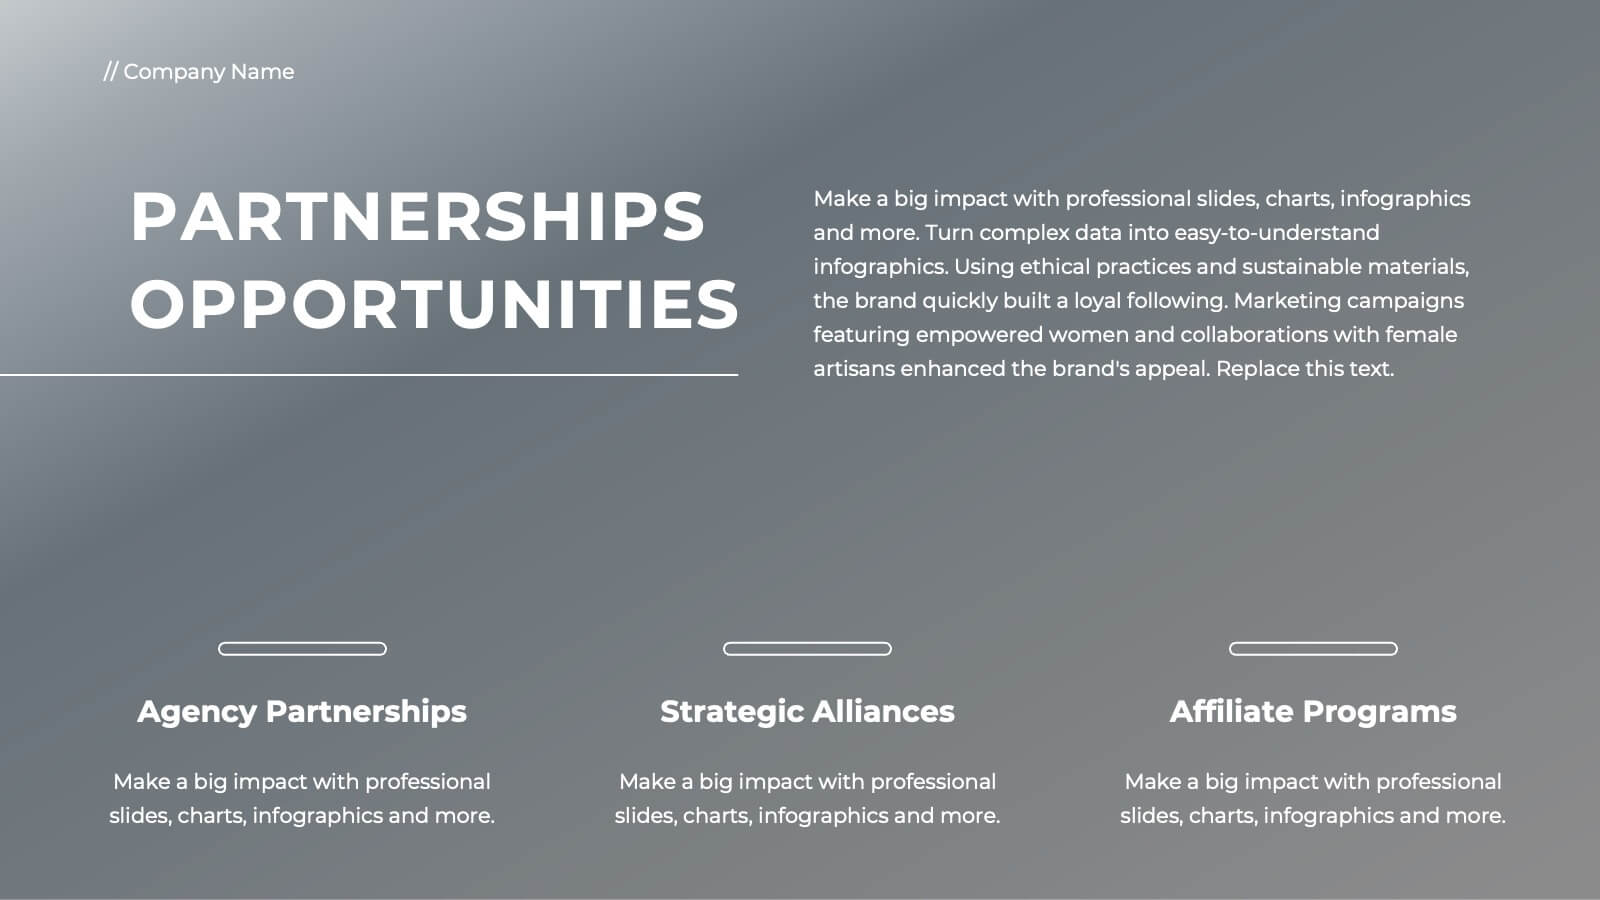
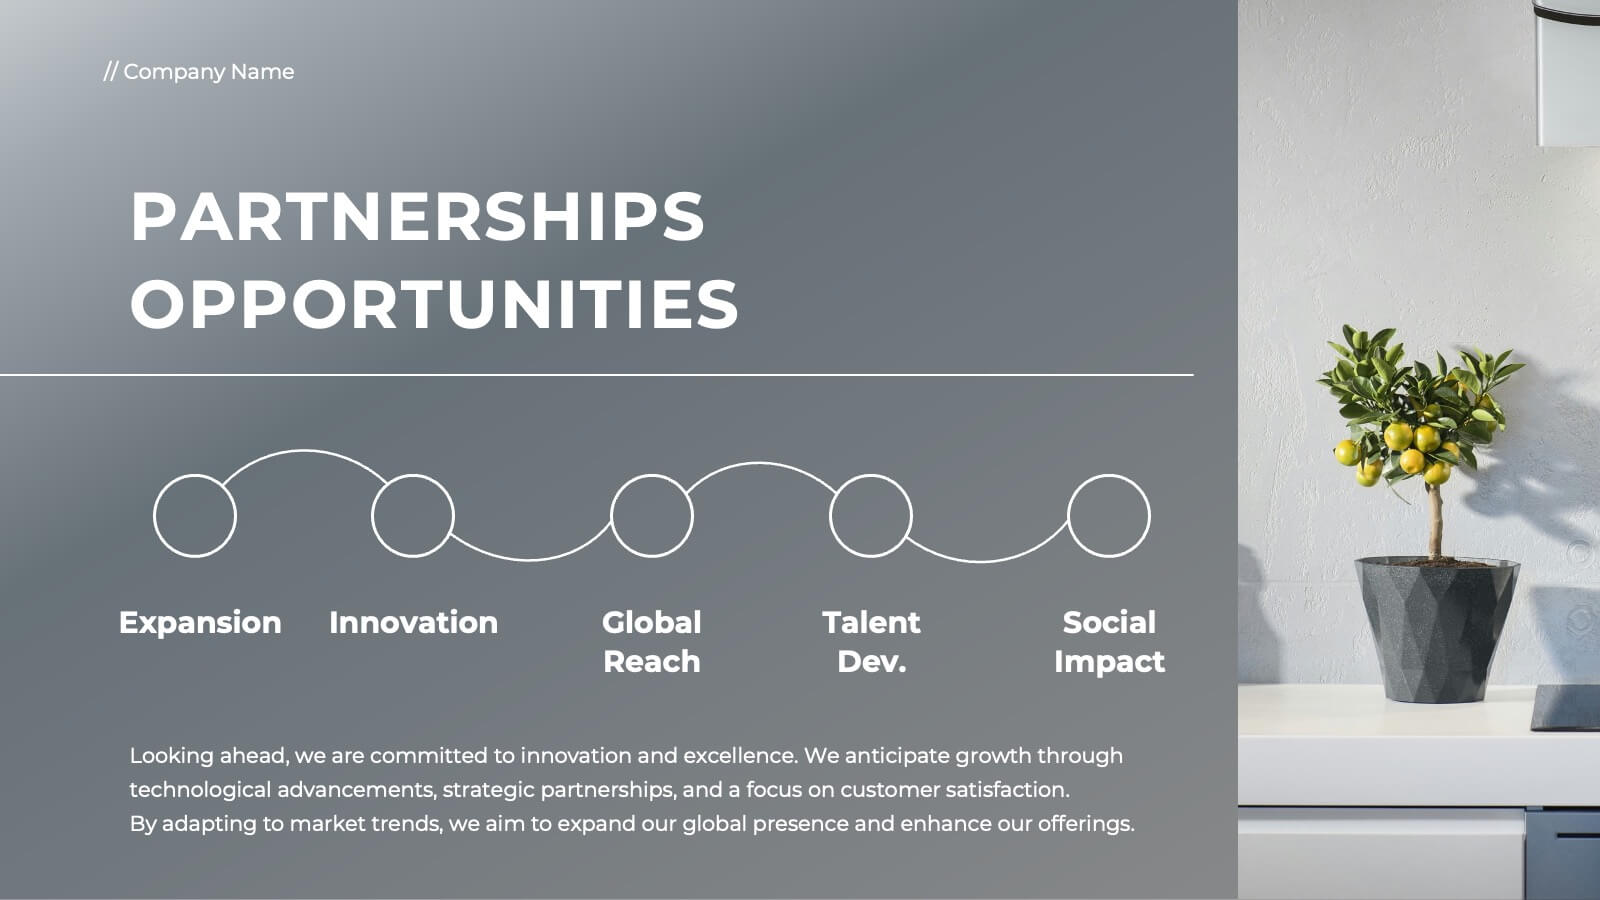
Ember Full-Service Agency Project Plan Presentation
Elevate your agency's presentation with this sleek project plan template! Ideal for showcasing your team's vision, market analysis, and client success stories, it includes slides for strategic development, campaign execution, and partnerships. Impress clients and stakeholders with professional visuals and detailed content. Compatible with PowerPoint, Keynote, and Google Slides for seamless presentations on any platform.


8 diapositivas
Business KPI Dashboard Presentation
Track performance at a glance with the Business KPI Dashboard Presentation. This clean, professional layout includes a speedometer-style gauge and monthly bar chart to showcase progress, goals, or metrics clearly. Ideal for reporting, analysis, or executive summaries. Fully editable and compatible with PowerPoint, Keynote, and Google Slides.


4 diapositivas
Project Brainstorming Mind Map Layout Presentation
Spark creativity with this Project Brainstorming Mind Map Layout presentation. Featuring a bold lightbulb centerpiece, this layout visually organizes four idea clusters around key project themes. Ideal for creative teams, planning sessions, or innovation workshops. Fully editable in Canva, PowerPoint, and Google Slides for easy personalization and professional impact.