


Características


¿Tienes alguna pregunta?
Recomendar


6 diapositivas
Closing Summary and Key Takeaways Presentation
Wrap up your presentation with clarity using the Closing Summary and Key Takeaways Presentation. This slide features a semi-circular segmented layout, ideal for highlighting 3–5 final points, action steps, or reflections. Clean, modern, and easy to customize in PowerPoint, Keynote, Google Slides, or Canva—perfect for impactful conclusions.


26 diapositivas
Leyna Presentation Template
Leyna is an elegant and minimalist wedding planner presentation template. This wonderful presentation template will help couples know what all you’ll offer as a wedding planner. We have made it easy for you this this multipurpose template because you will be able to edit easily to make sure it fits what you need. We have built a clean, responsive and modern design for them to have a great experience on what they are looking for in the best way possible. This template provides a professional and clean design for your business or personal use. It's time to impress the potential clients!


5 diapositivas
African Continent Map Slide Presentation
Visualize your data across Africa with a modern, easy-to-read map design that highlights regional trends and insights. Perfect for showcasing demographics, market distribution, or project reach, this template combines clarity and impact. Fully compatible with PowerPoint, Keynote, and Google Slides for smooth customization and presentation flexibility.


5 diapositivas
4-Stage Gap Identification Presentation
A clear, engaging way to map progression, this presentation helps you illustrate each stage of identifying business gaps with structure and clarity. It guides audiences through challenges, priorities, and opportunities in a simple step-by-step flow that’s easy to follow and present. Fully compatible with PowerPoint, Keynote, and Google Slides.


7 diapositivas
State-by-State Business Data Presentation
Break down insights with this State-by-State Business Data Presentation. Featuring a U.S. map segmented by regions, this slide is ideal for illustrating localized performance, regional statistics, or market segmentation. Customize text labels and highlight specific zones to match your business needs. Fully editable in PowerPoint, Keynote, and Google Slides.


4 diapositivas
Business Development Roadmap Presentation
Visualize your growth journey with this Business Development Roadmap Presentation. Featuring a winding road design with four milestones, it’s perfect for showcasing project phases, strategic goals, or quarterly plans. Each checkpoint is color-coded and icon-based for easy comprehension. Fully editable in PowerPoint, Keynote, and Google Slides.


26 diapositivas
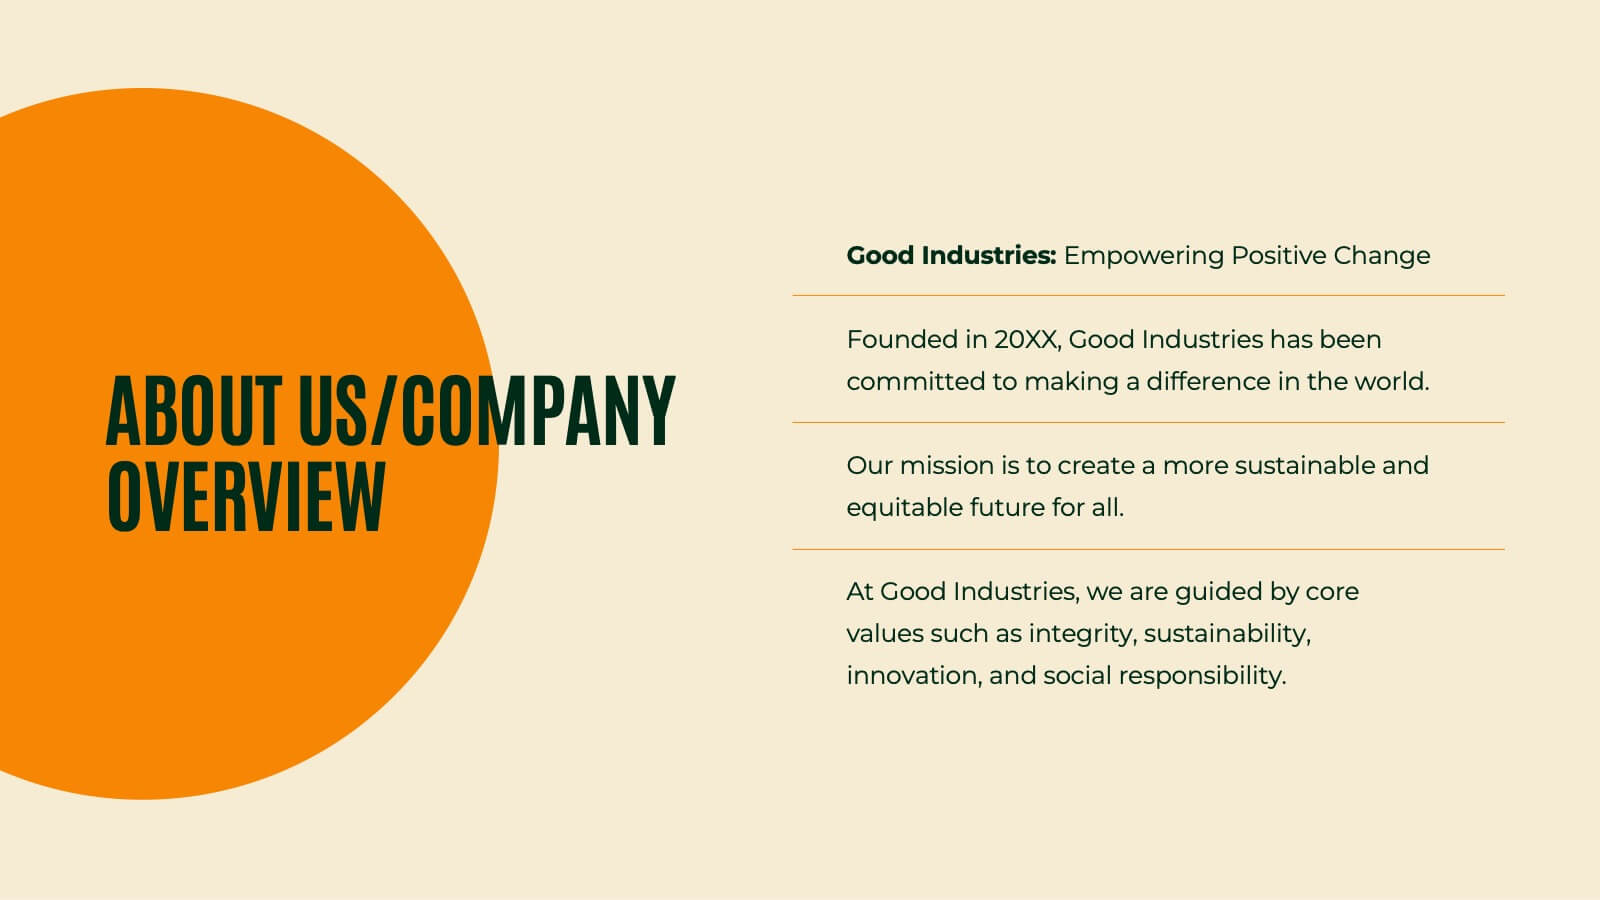
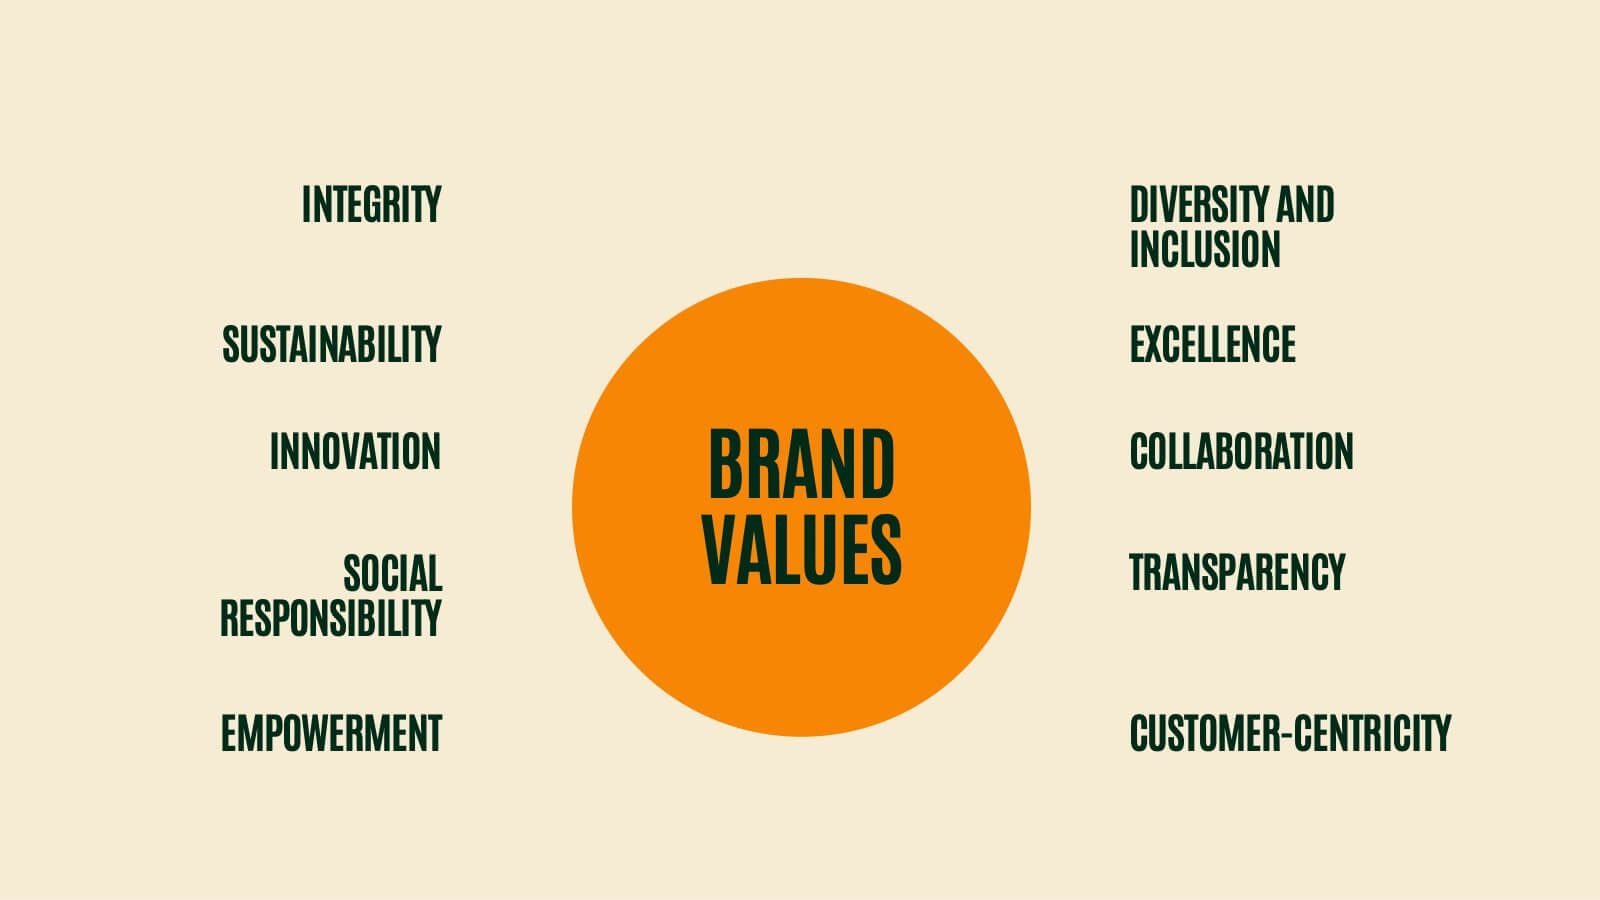
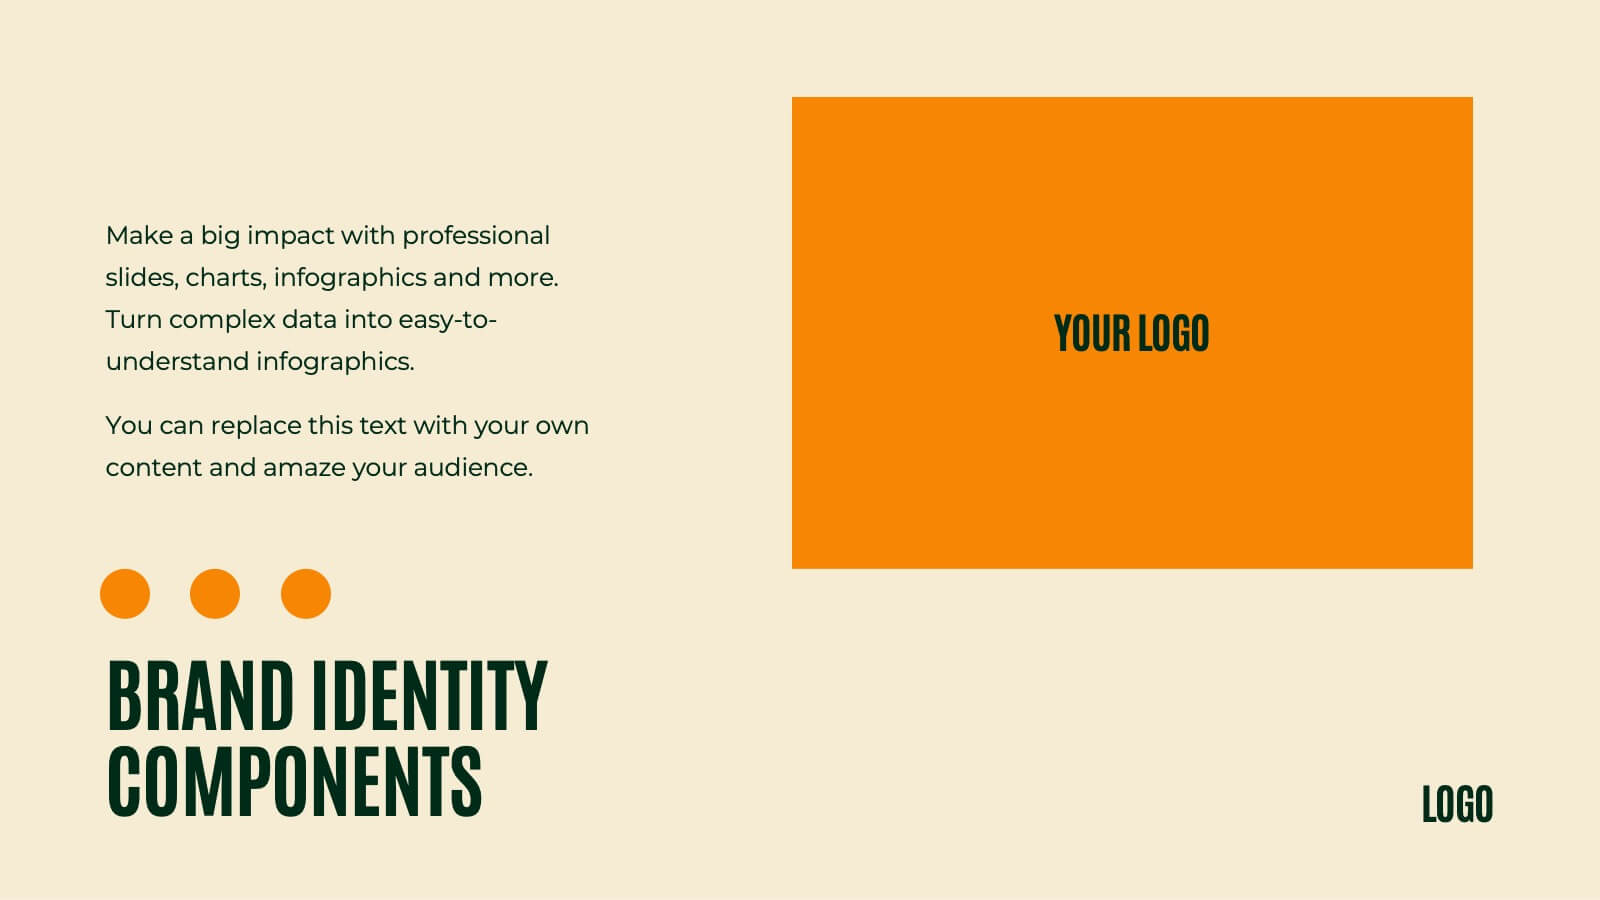
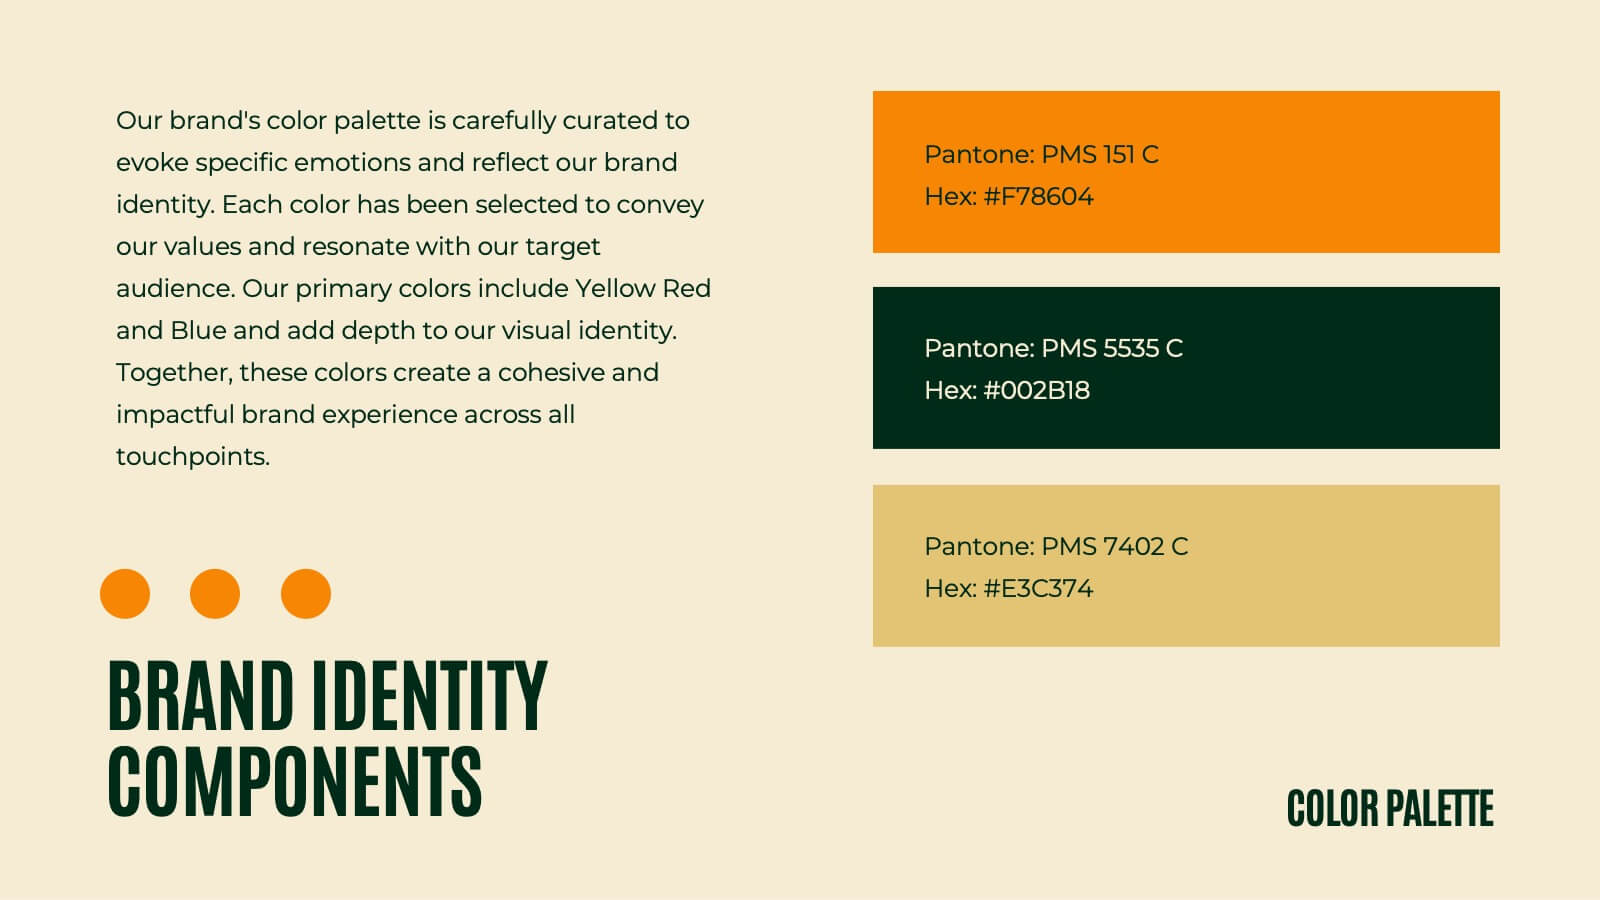
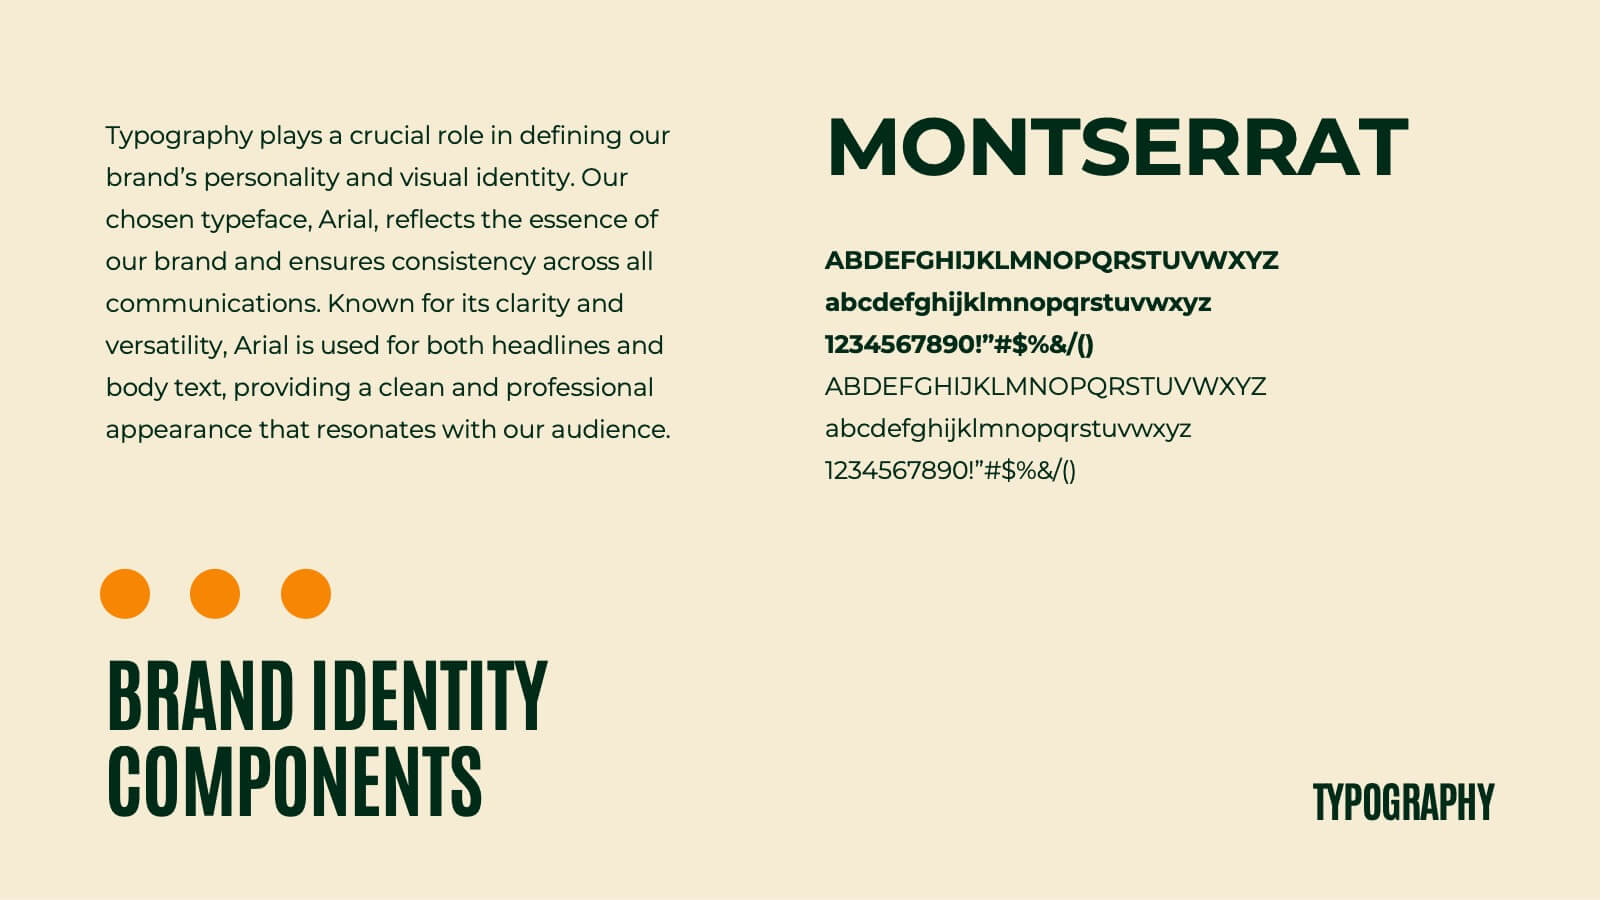
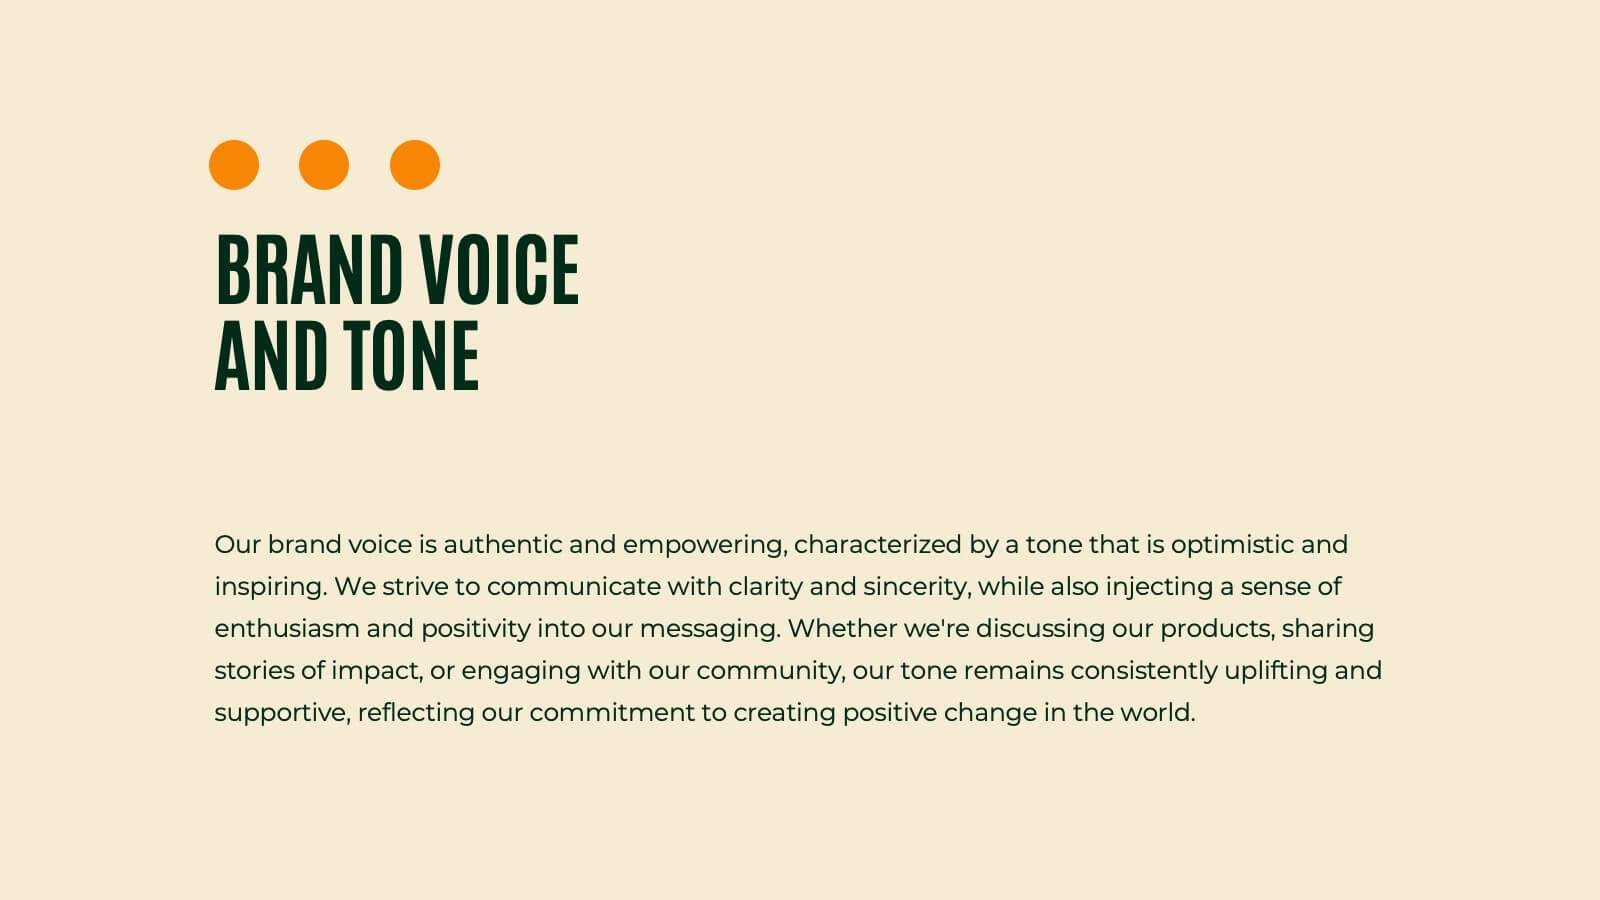
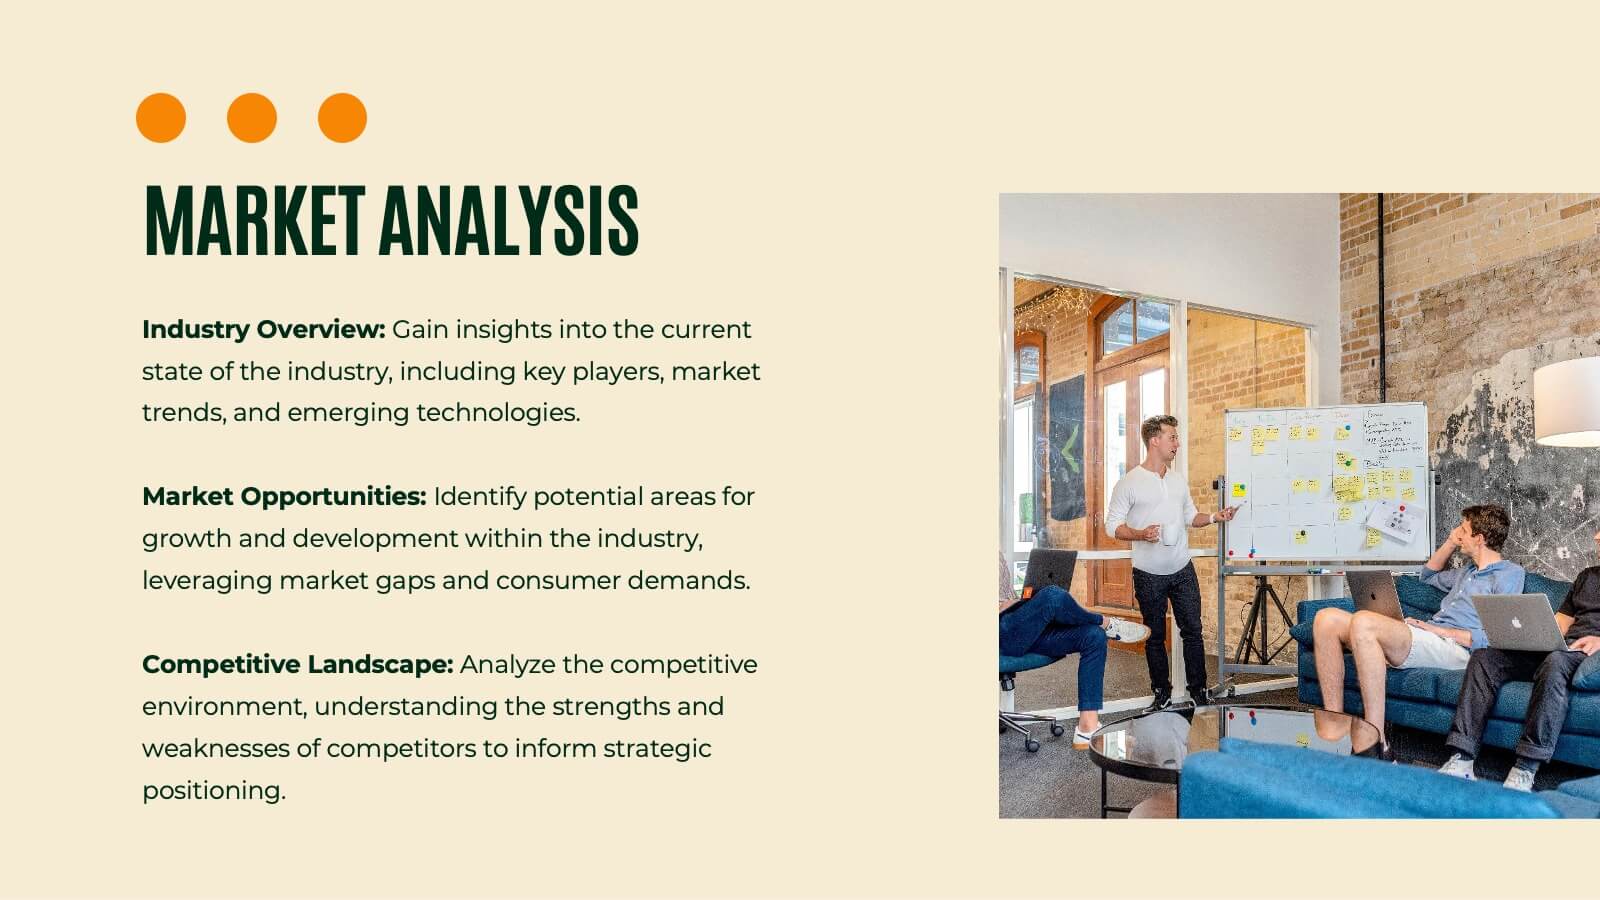
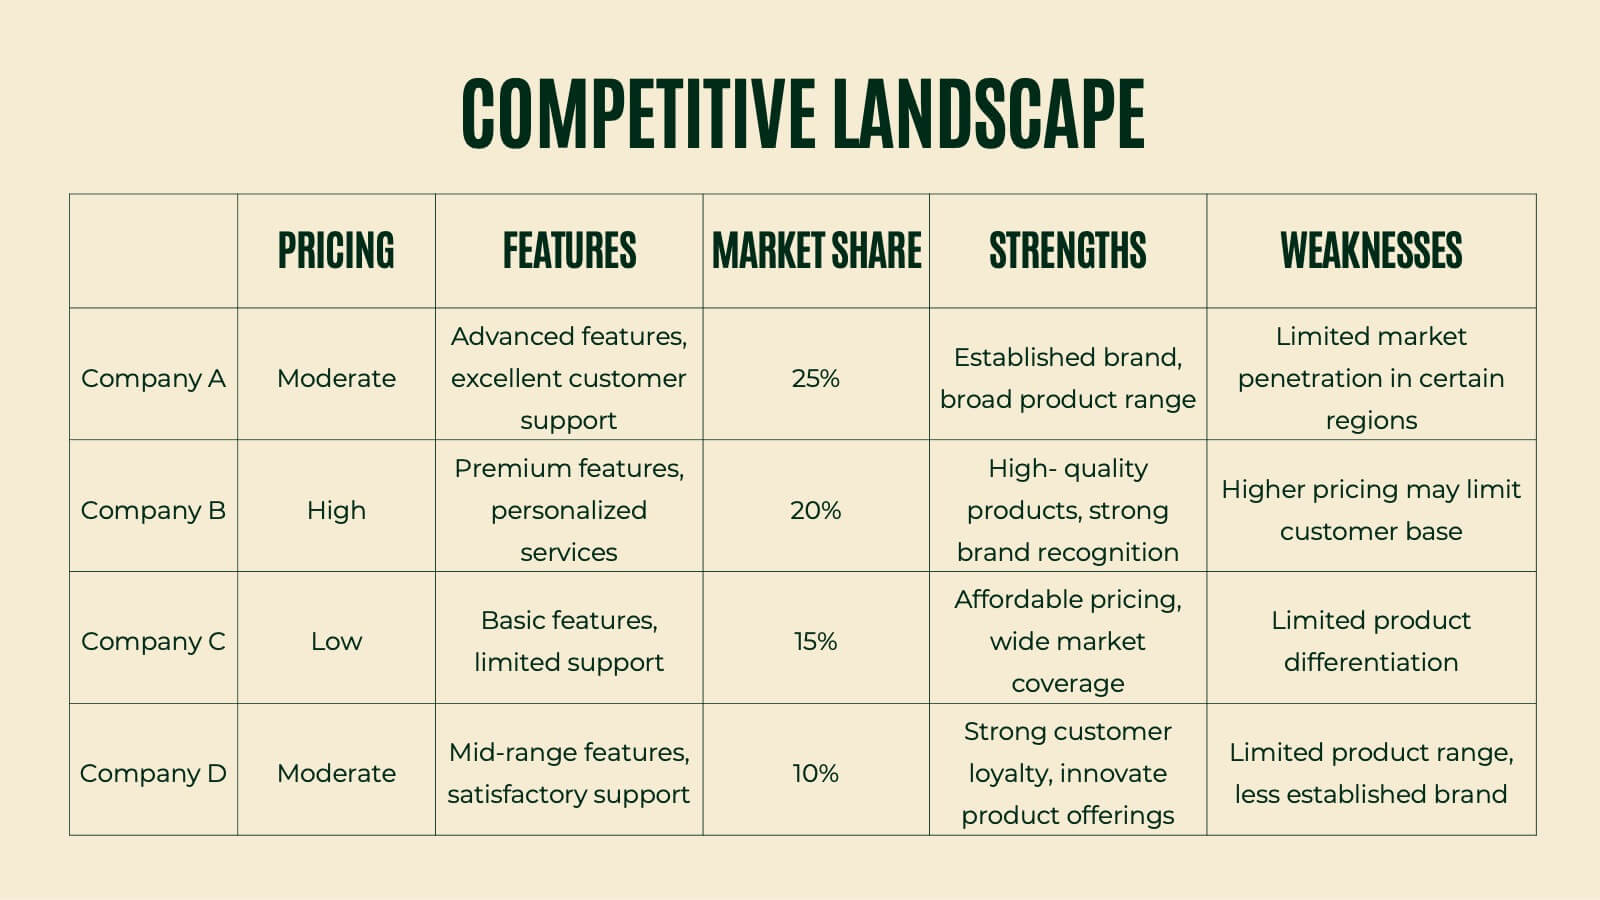
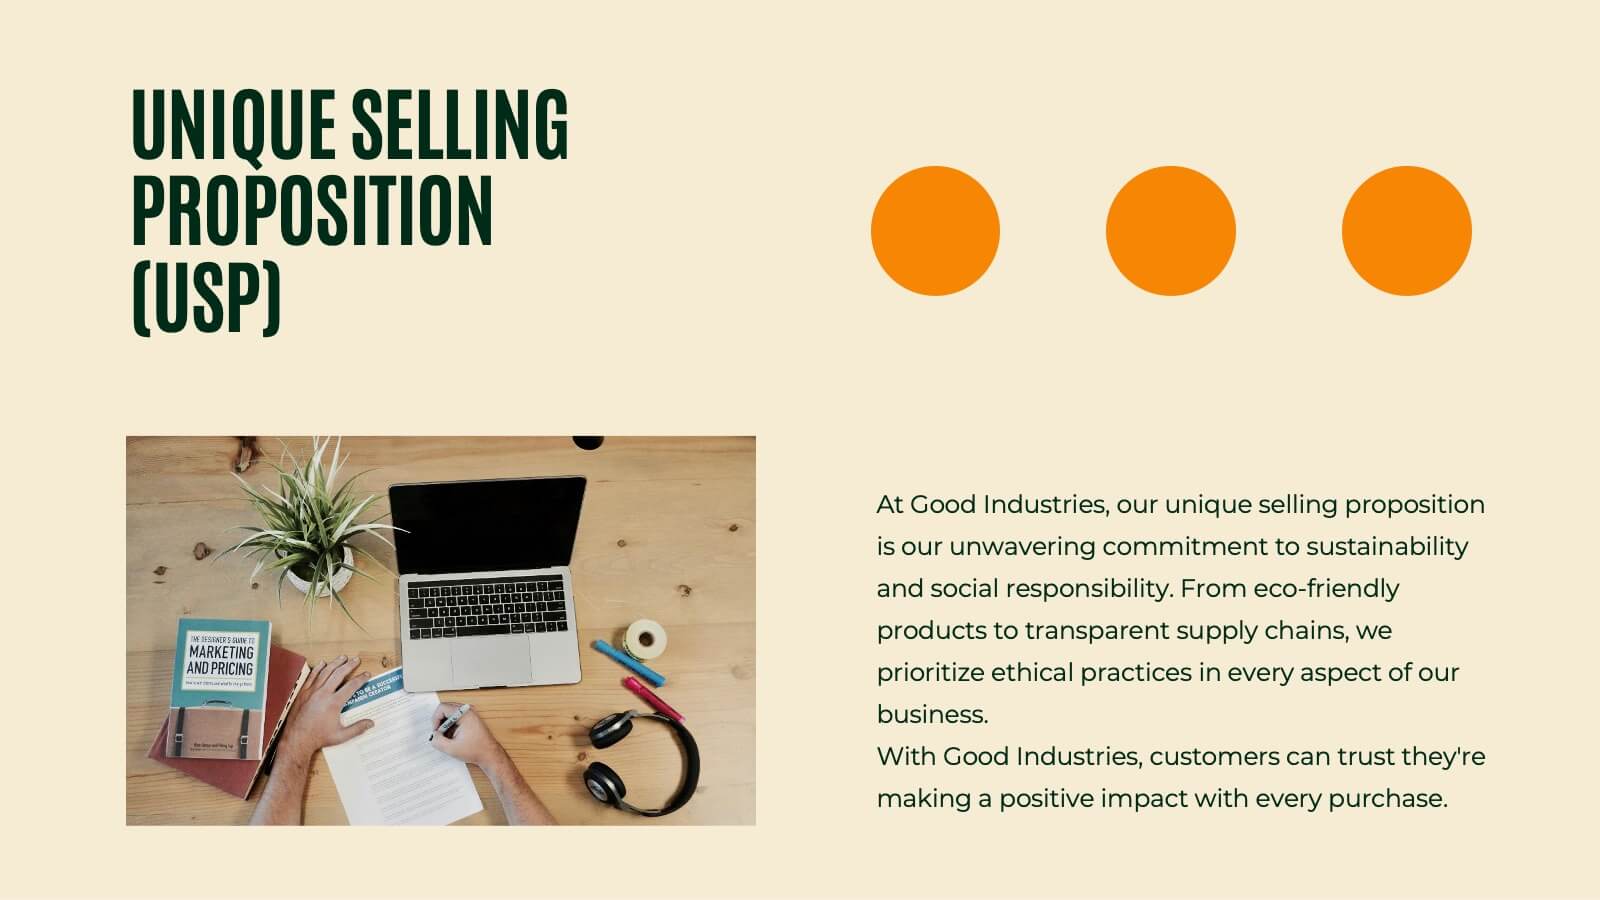
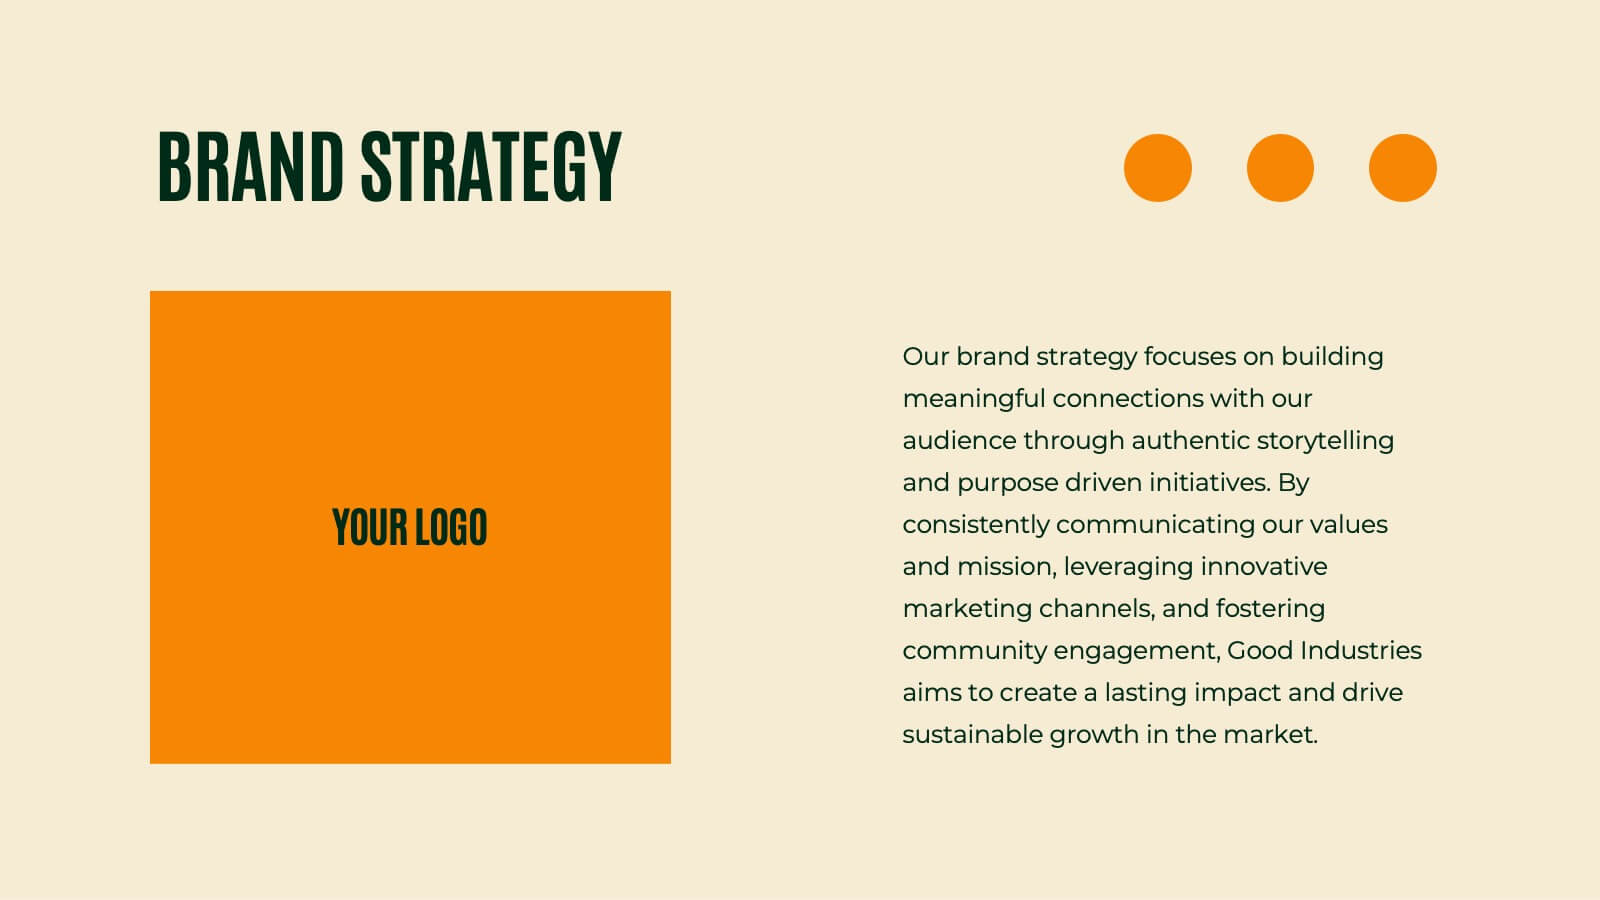
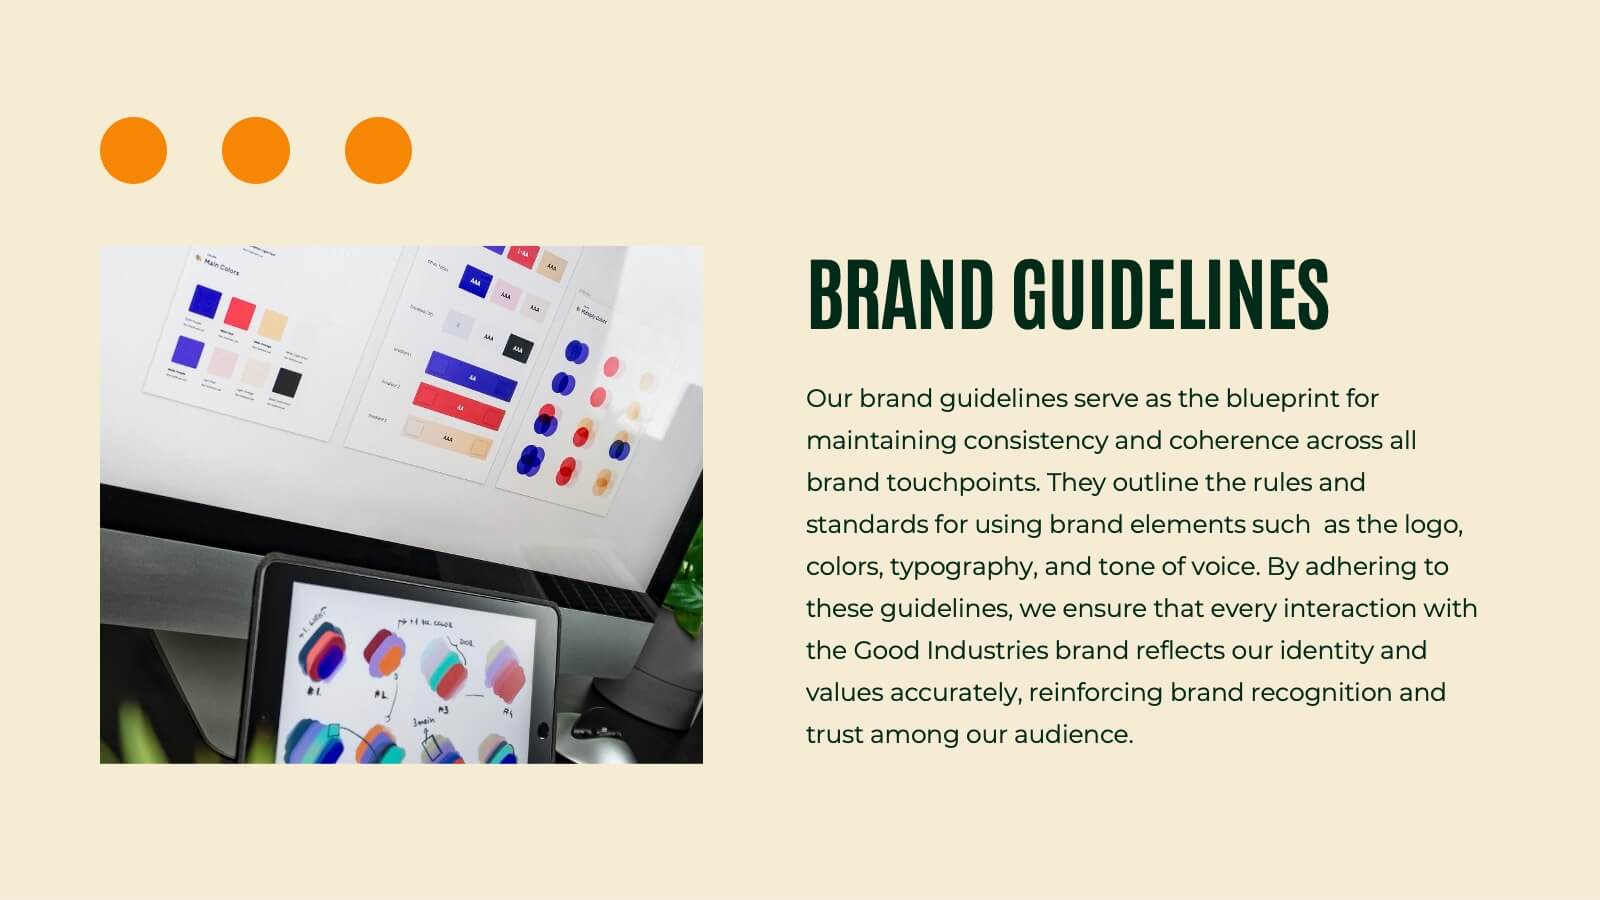
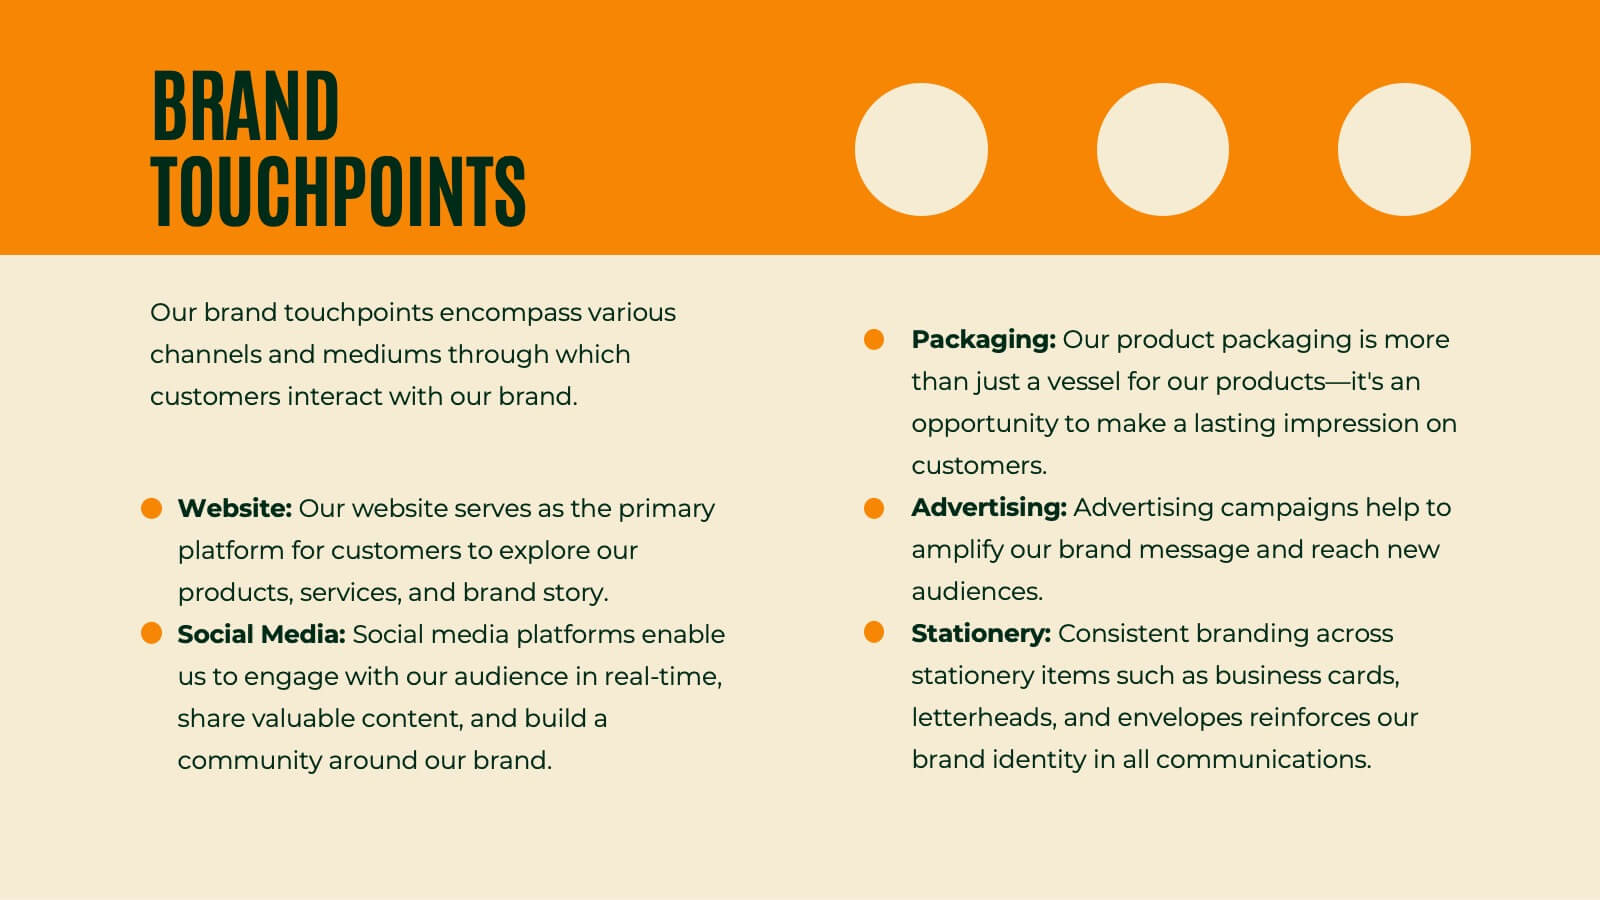
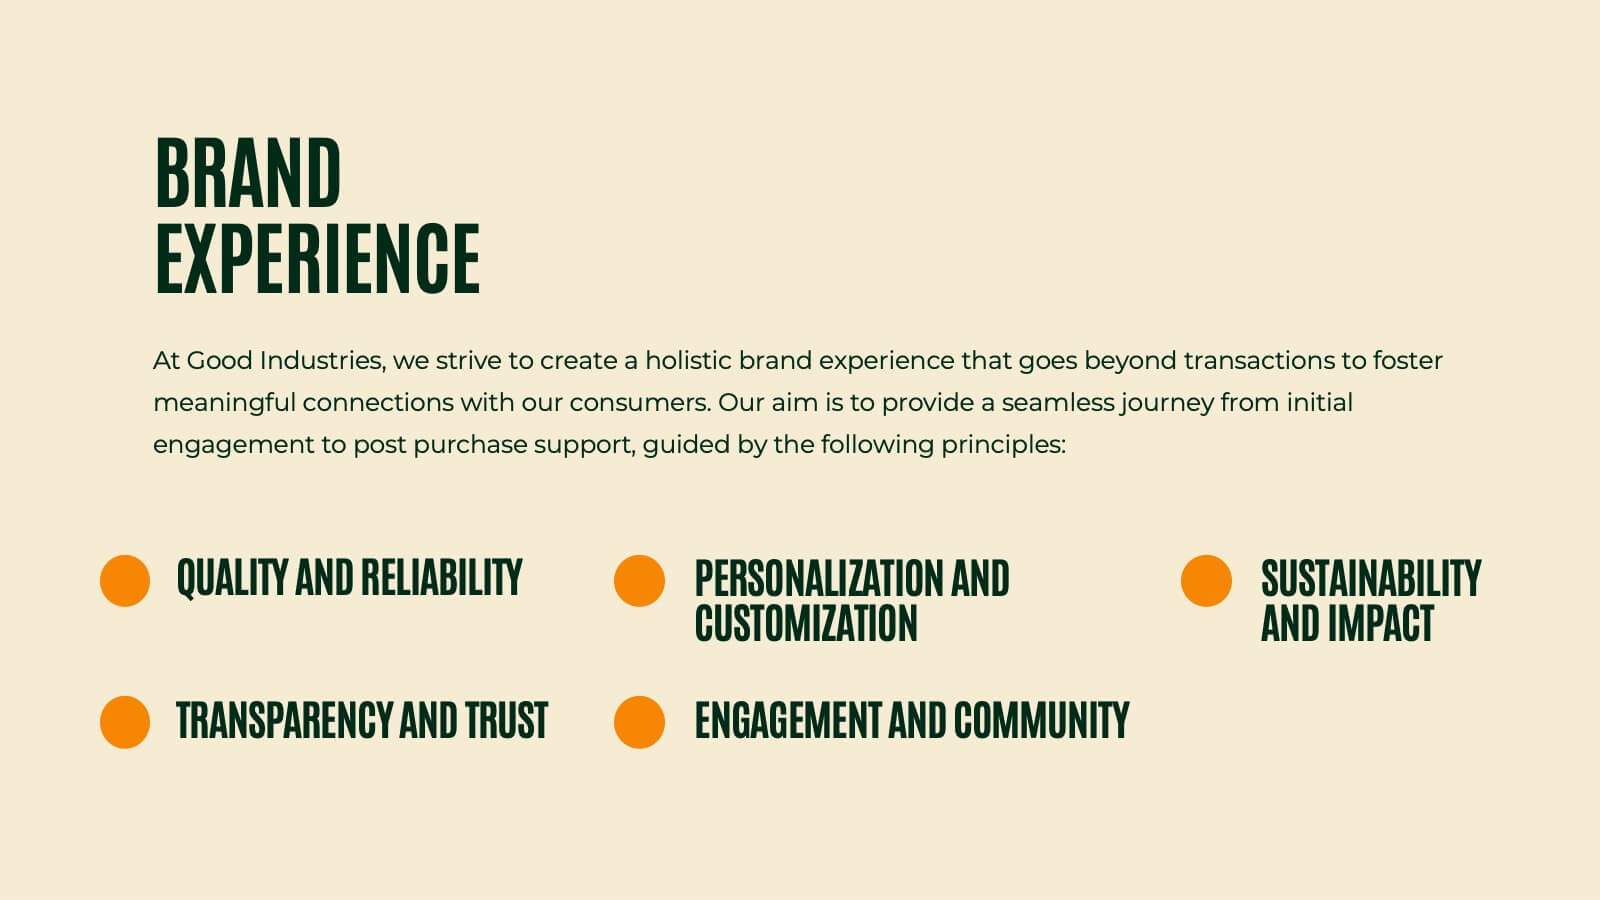
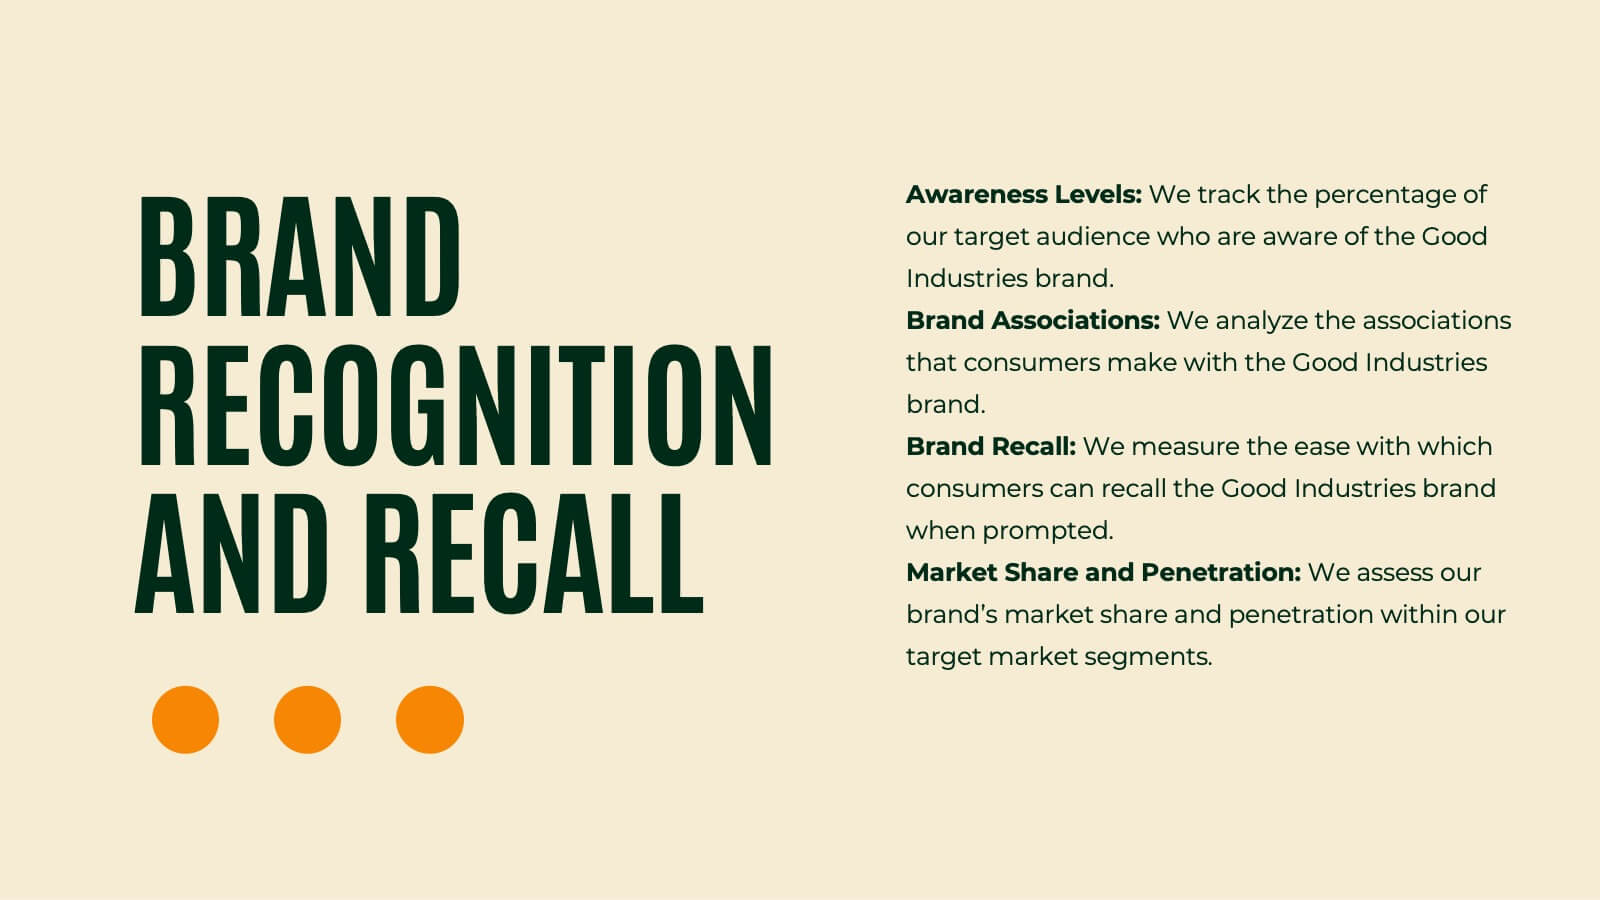
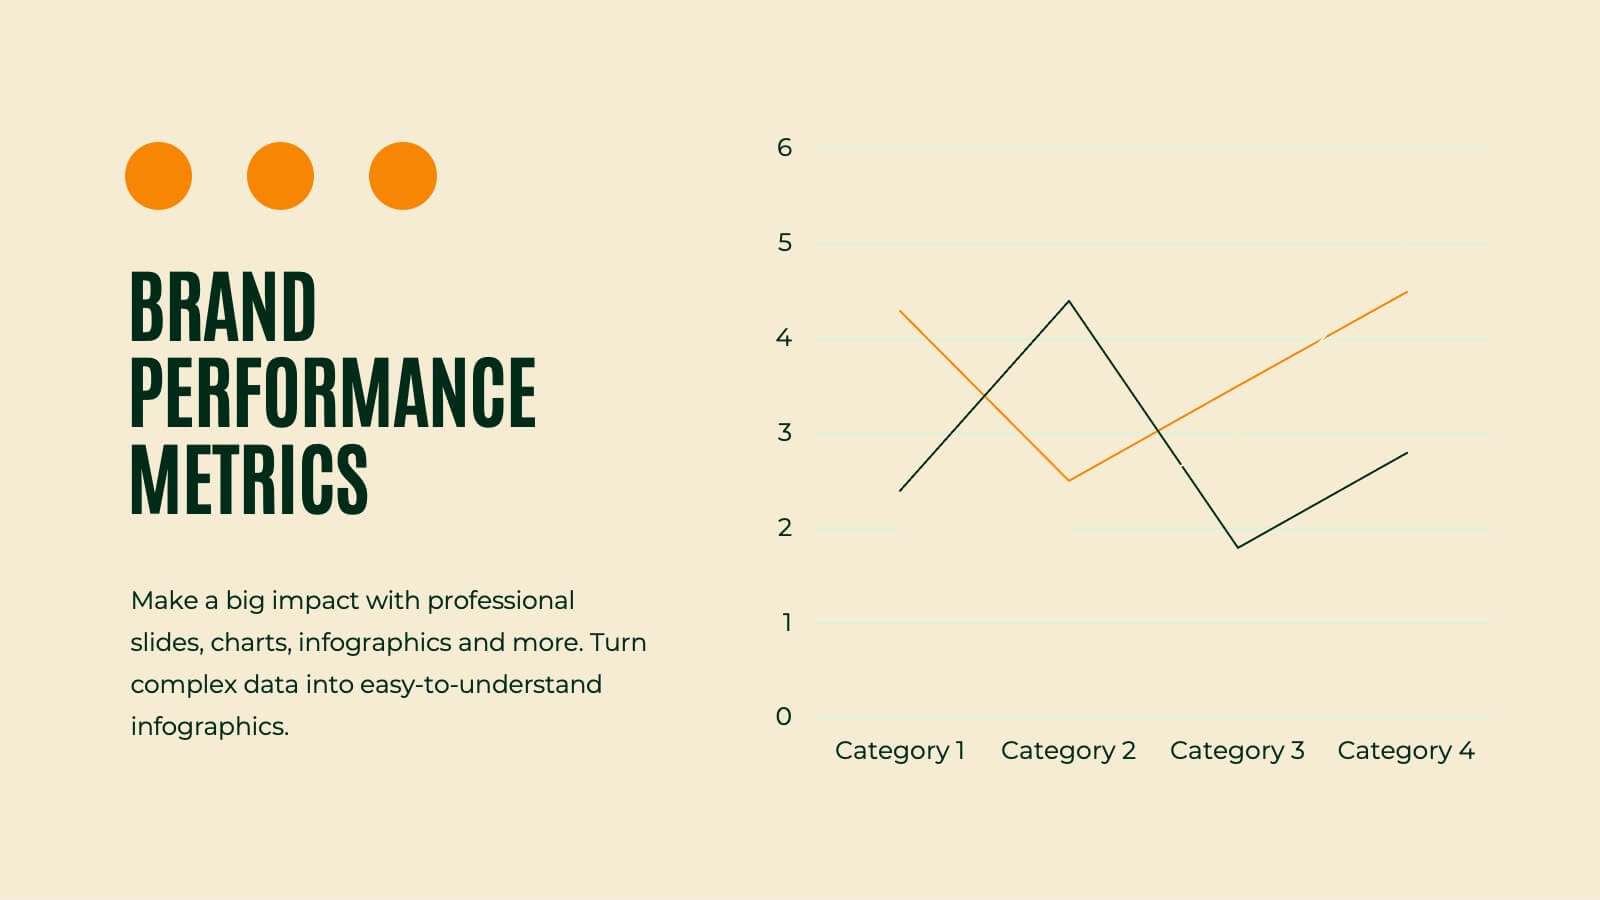
Griffin Rebranding Project Plan Presentation
Unleash the power of branding with this vibrant presentation template! This tool guides you through essential brand elements like identity, voice, and strategy. Perfect for marketers and brand managers aiming to make a memorable impact. Compatible with PowerPoint, Keynote, and Google Slides, it's a must-have for any branding project.


8 diapositivas
Airline Business Strategy Presentation
Leverage key insights into the aviation sector with the "Aviation Industry Market Analysis" presentation template. This design allows professionals in the aviation industry to effectively communicate market trends and forecasts. Its compatibility with PowerPoint, Keynote, and Google Slides ensures a versatile use across different platforms, making it ideal for industry analyses, investor meetings, or internal strategy discussions.


26 diapositivas
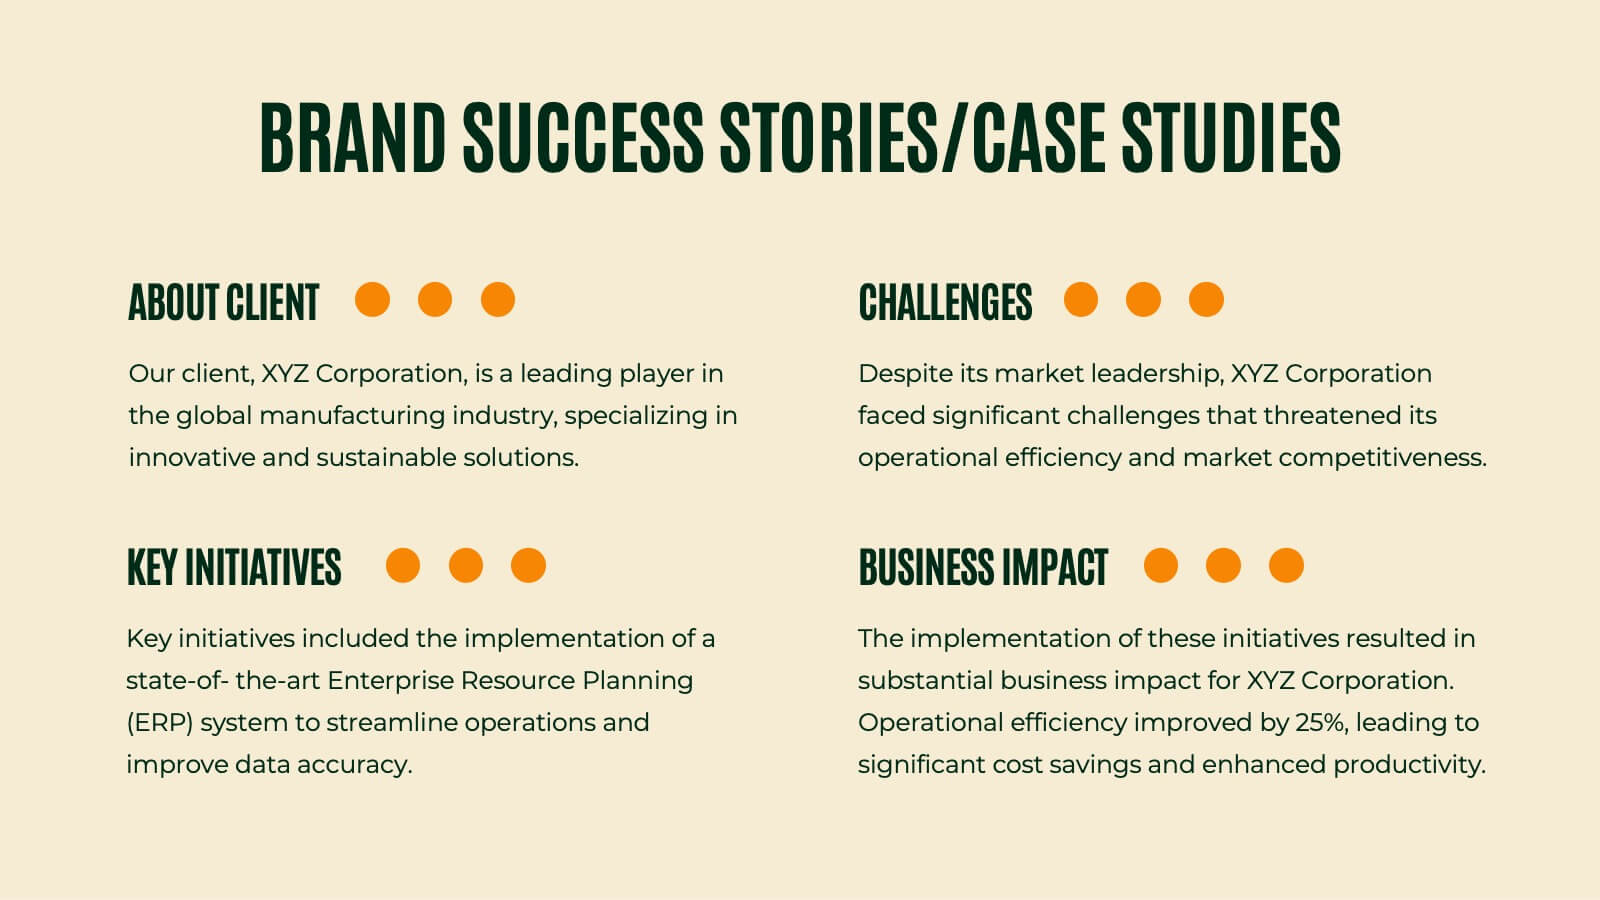
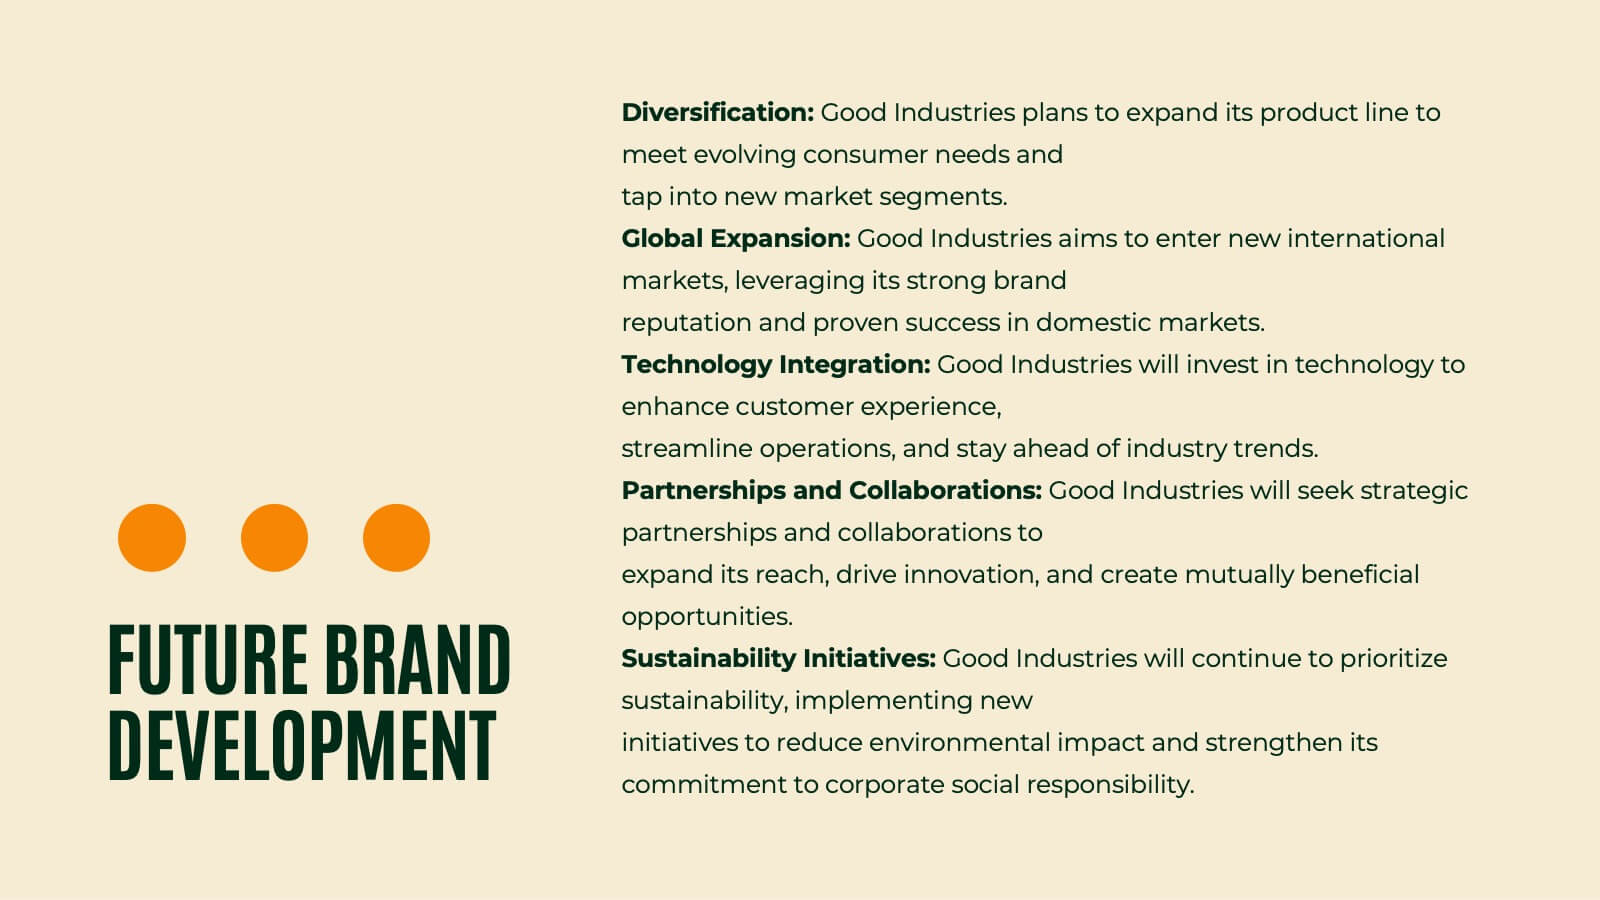
Company Profile and Accomplishments Presentation
A company profile is a document that provides an overview of a business entity. This template serves as a company introduction, presenting essential information about company history, products or services, achievements, goals, and other relevant details. This template showcases the milestones and capabilities of a company. This presentation is perfect for businesses, startups, or organizations looking to highlight their success, growth, and overall expertise in their industry. The clean layout, engaging visuals, and comprehensive information, will help your presentation leave a lasting impression on your audience and enhance your company's reputation.


6 diapositivas
Corporate Team Management Presentation
Highlight the interconnected roles of your corporate team with this sleek Corporate Team Management slide. The circular flow design emphasizes collaboration, leadership, and operational structure—making it ideal for showcasing team roles, department functions, or workflow cycles. Each of the six editable segments includes a title and description area with clean iconography. Fully compatible with PowerPoint, Keynote, and Google Slides.


4 diapositivas
Corporate Governance Structure Presentation
Build transparency and leadership clarity with this clean, layered presentation layout that visualizes company hierarchies and decision-making systems. Ideal for explaining organizational roles, responsibilities, and reporting flows, it simplifies complex structures into easy visuals. Fully editable and compatible with PowerPoint, Keynote, and Google Slides for professional, flexible use.


21 diapositivas
Cascade Marketing Proposal Template Presentation
Ignite your creativity with our dazzling Cascade Marketing Proposal Template Presentation! This captivating design brings your ideas to life, ensuring your presentation stands out. The sleek, dark theme is punctuated by electric blue accents, adding a modern, professional touch. Each slide is meticulously crafted, offering a perfect blend of visuals and content that keeps your audience engaged from start to finish. From the Company Overview to Growth Projections, every aspect of your pitch is highlighted with style and clarity. The template is fully customizable, allowing you to tailor it to your brand's identity effortlessly. Whether you're pitching to investors or presenting internally, this template has everything you need to make a lasting impression. Compatible with PowerPoint, Keynote, and Google Slides, it’s versatile and easy to use. Get ready to electrify your next presentation and leave your audience in awe!


8 diapositivas
3-Part Business Triangle Diagram
Showcase interconnected ideas or processes with this clean 3-part triangle layout. Ideal for illustrating strategies, relationships, or project phases in a clear and visually engaging way. Fully customizable in PowerPoint, Keynote, and Google Slides for seamless editing.


4 diapositivas
Project Task Ownership with RACI Chart Presentation
Assign roles clearly with the Project Task Ownership with RACI Chart Presentation. This template simplifies responsibility mapping across tasks using the RACI framework (Responsible, Accountable, Consulted, Informed). With a clean matrix layout, it's perfect for project planning, stakeholder alignment, and workflow transparency. Fully editable in PowerPoint, Canva, and Google Slides.


5 diapositivas
Purpose-Driven Mission and Values Presentation
Present your organization’s core purpose and guiding principles with this Purpose-Driven Mission and Values presentation. This clean, flag-style layout is perfect for showcasing five key pillars such as integrity, collaboration, or innovation. Easily customizable in Canva, PowerPoint, or Google Slides to align with your brand.


21 diapositivas
Mystorin Market Analysis Report Presentation
Present your market analysis findings with this sleek and professional report presentation template. Covering essential sections such as key highlights, performance metrics, competitor insights, and strategic initiatives, it provides a comprehensive framework for data-driven decisions. Ideal for businesses and analysts. Compatible with PowerPoint, Keynote, and Google Slides for easy customization.


5 diapositivas
Leadership and Team Management
Showcase roles, responsibilities, and the structure of your team with this clear and engaging leadership diagram. Ideal for HR professionals, team leads, and project managers to explain reporting lines and team composition. Easily editable in PowerPoint, Keynote, and Google Slides—customize colors, icons, and content in minutes.