


Características


¿Tienes alguna pregunta?
Recomendar


5 diapositivas
Western Europe Political Map Slide Presentation
Showcase political insights and regional data with a clear, modern map design that highlights countries across Western Europe. Perfect for comparing demographics, election data, or market performance, this layout combines clarity with visual impact. Fully compatible with PowerPoint, Keynote, and Google Slides for easy customization and professional presentations.


6 diapositivas
Shopping Pricing Tables Infographic
Pricing tables are visual tools commonly used on websites, product pages, and marketing materials to showcase different pricing options for products or services. This infographic template displays different pricing plans or packages offered by a business or service provider. This provides a clear comparison of features, benefits, and costs, helping viewers make informed decisions about which option best suits their needs and budget. This infographic is designed to help customers quickly compare features, costs, and benefits of each plan, aiding in their decision-making process. Compatible with Powerpoint, Keynote, and Google Slides.


6 diapositivas
Market Share Analysis Pie Chart
Clearly communicate competitive positioning with this market share pie chart layout. Ideal for showcasing data segments such as revenue splits, customer base percentages, or geographic market distribution. Each pie chart highlights a distinct insight, with editable text and values. Compatible with PowerPoint, Keynote, and Google Slides.


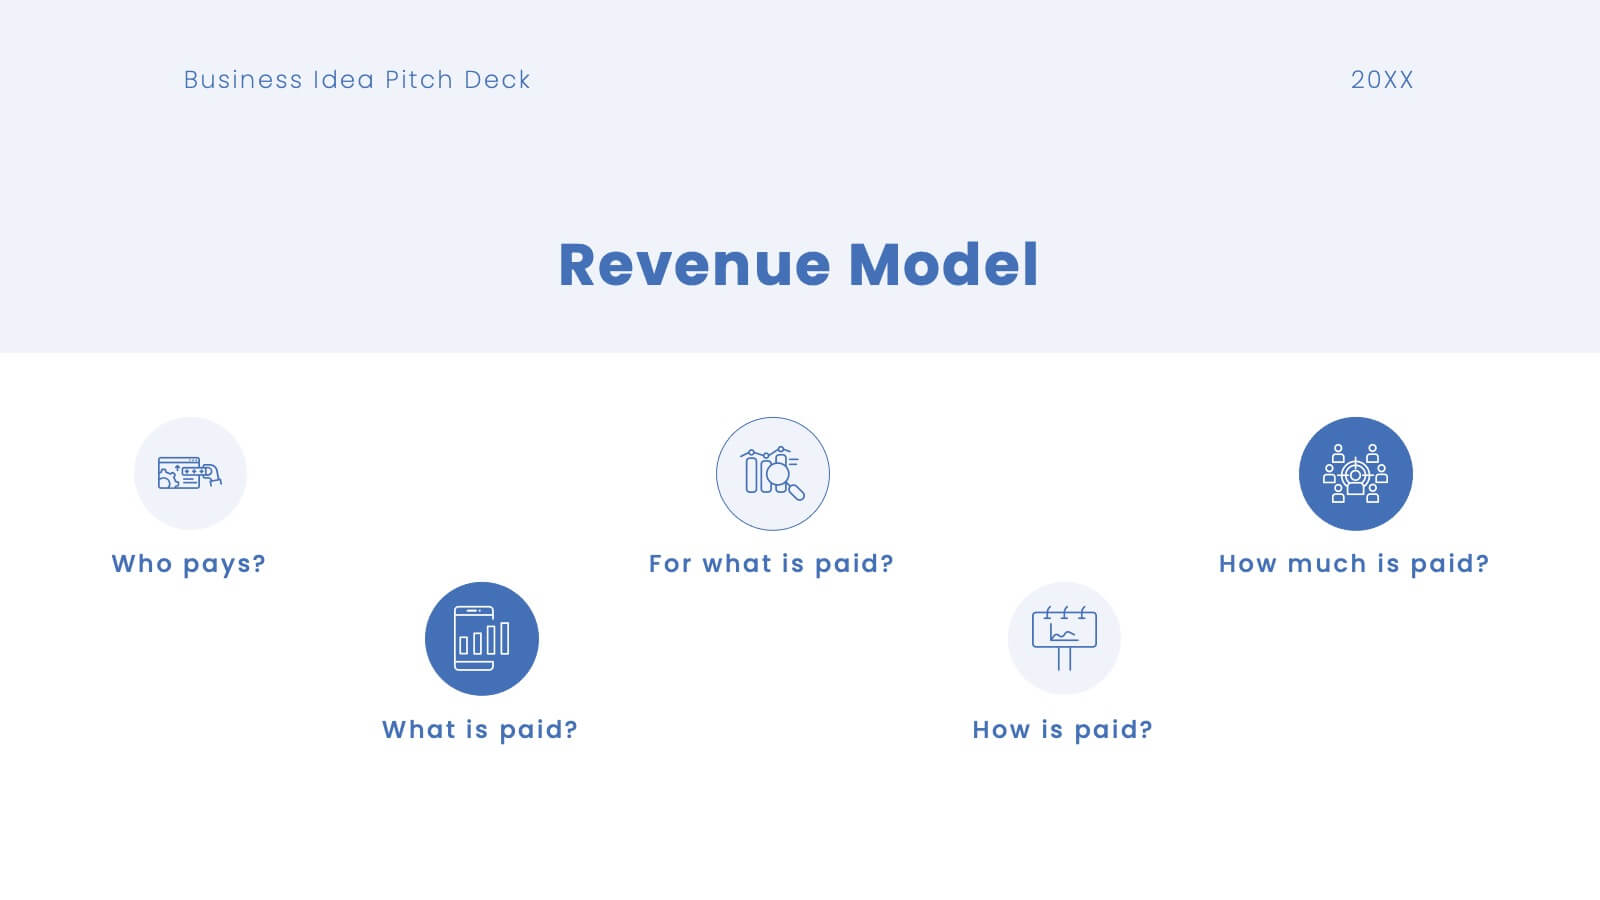


28 diapositivas
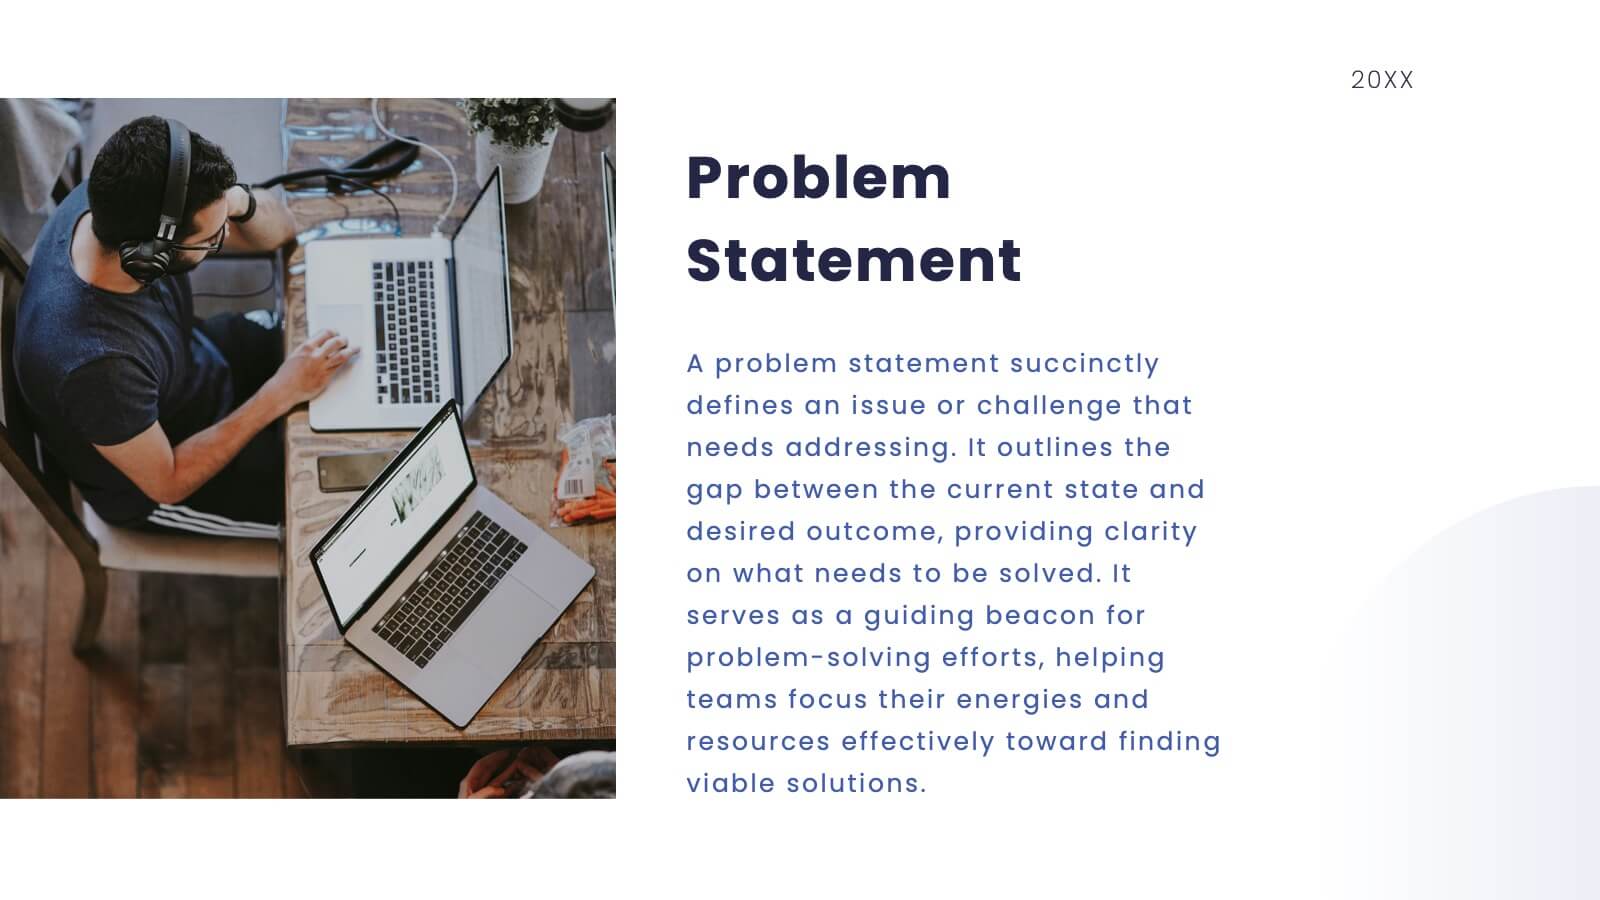
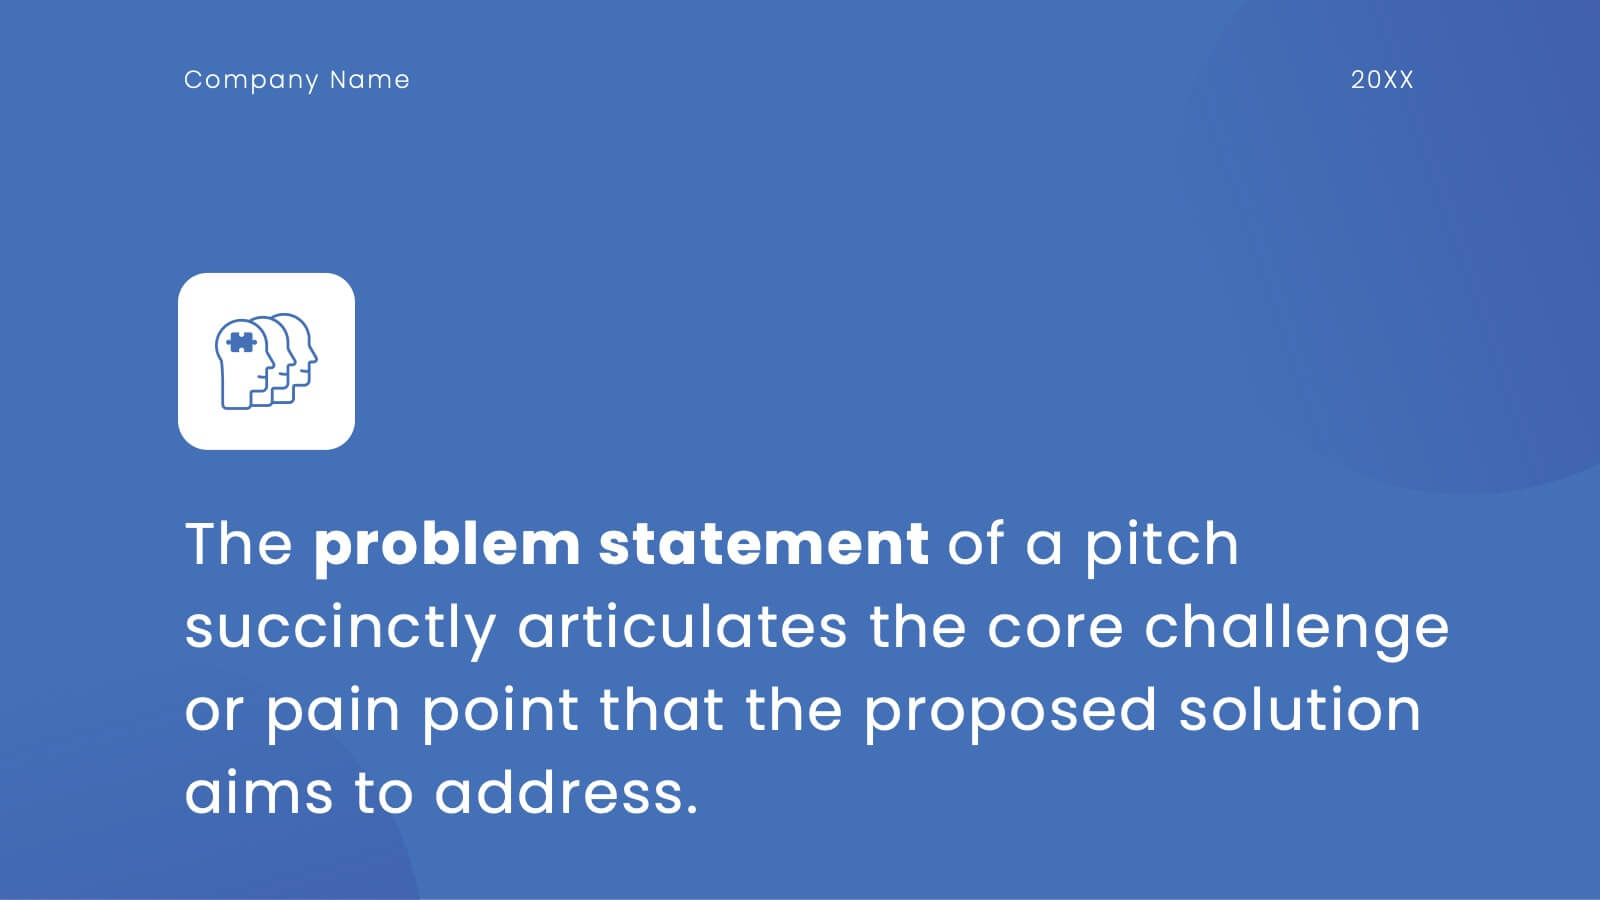
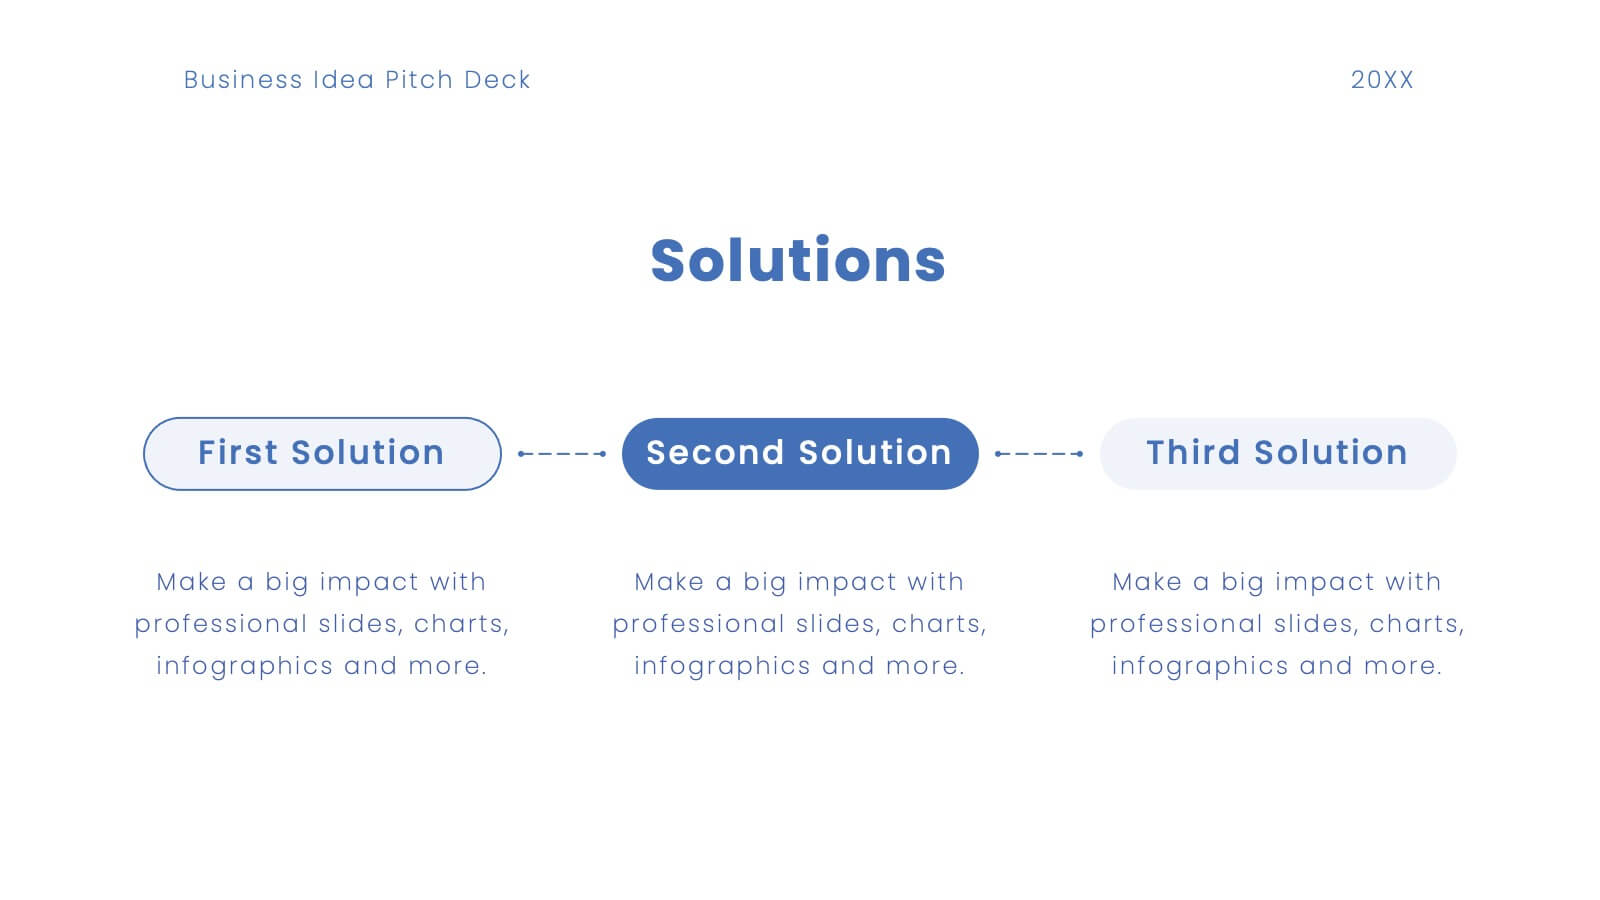
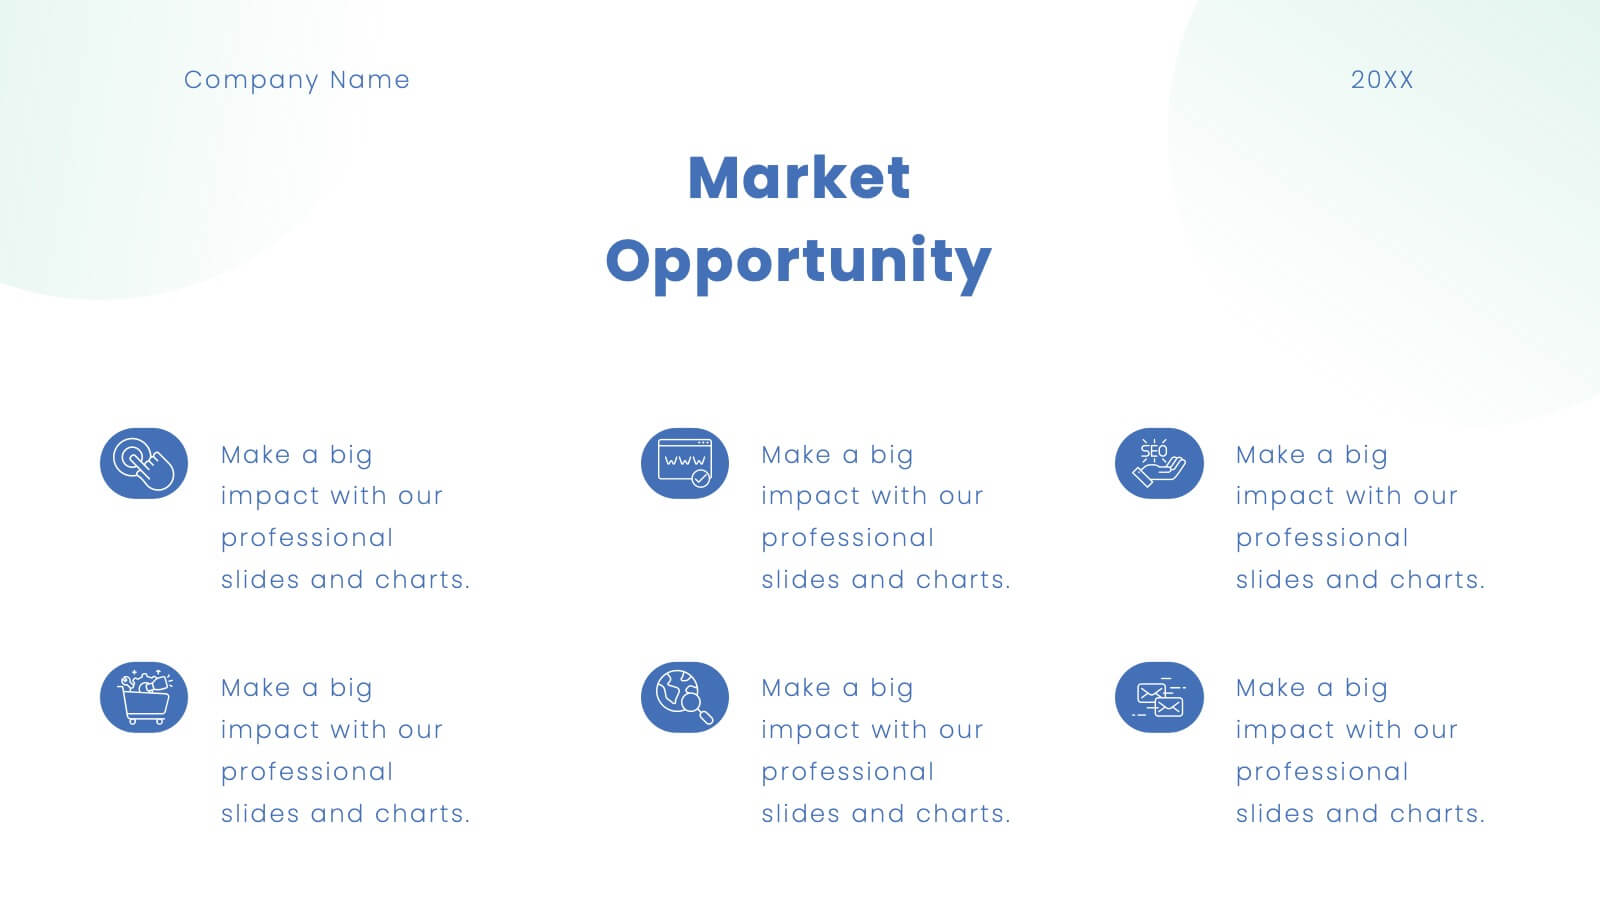
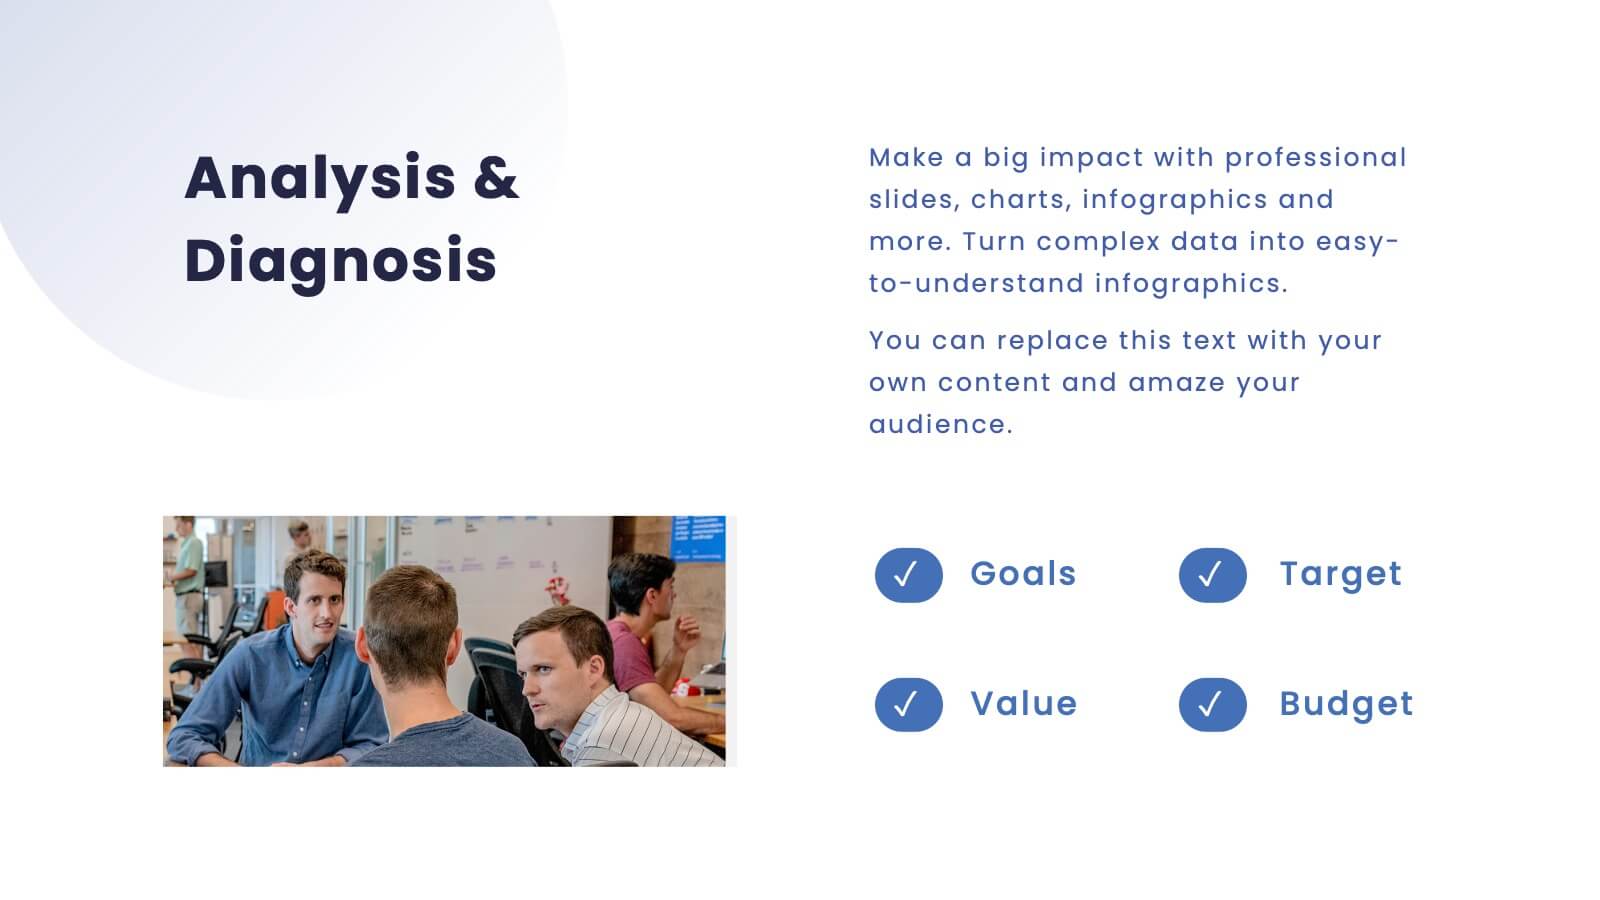
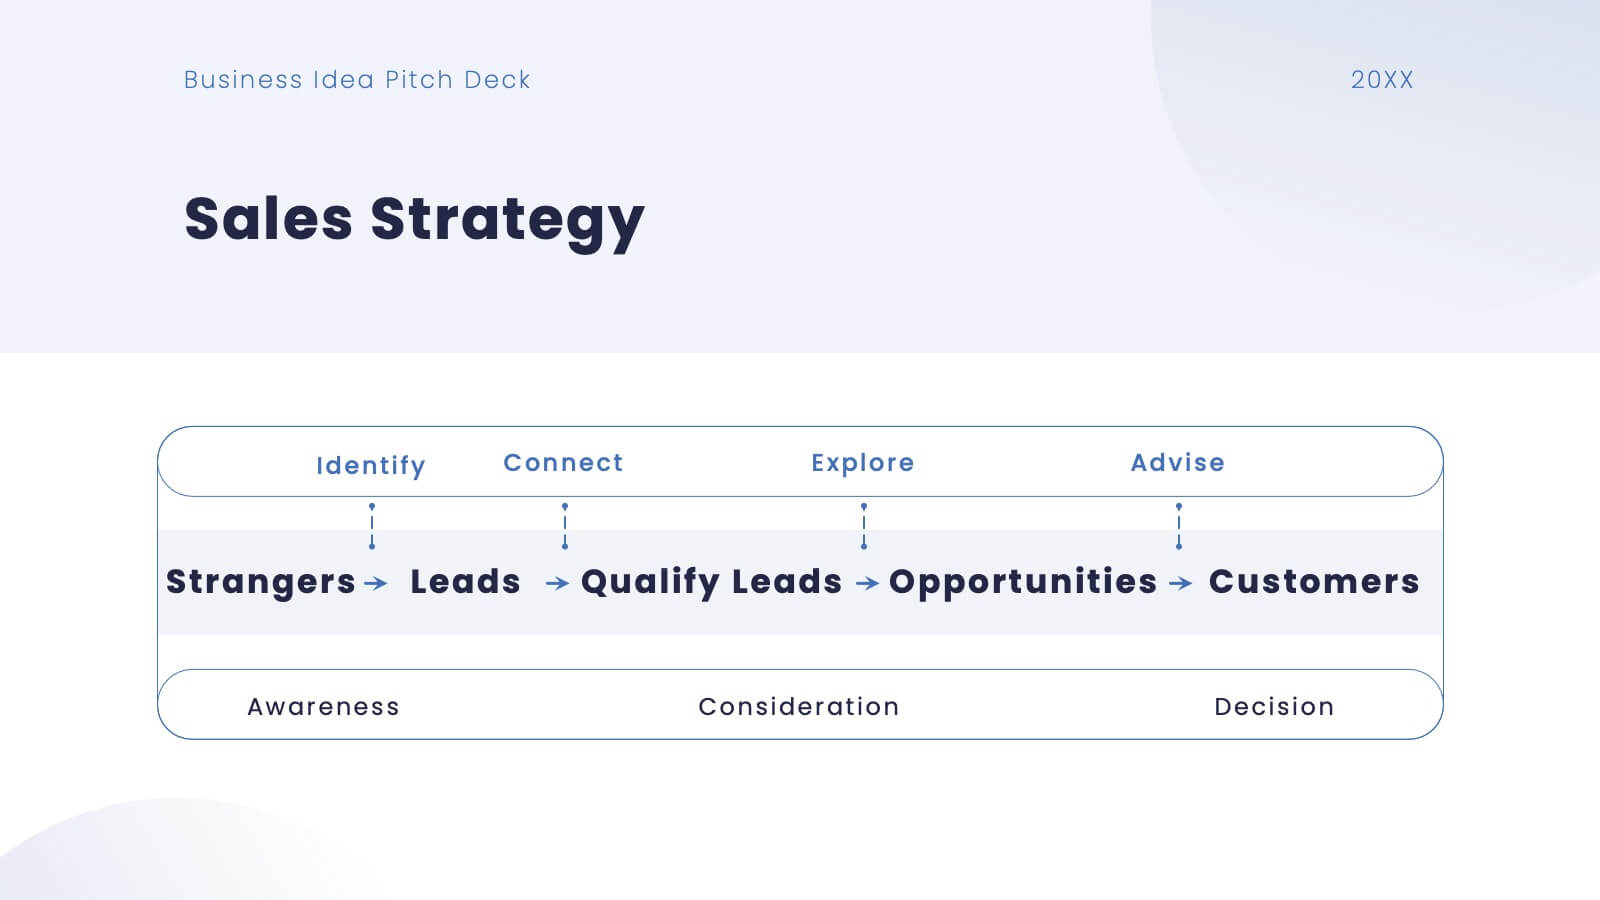
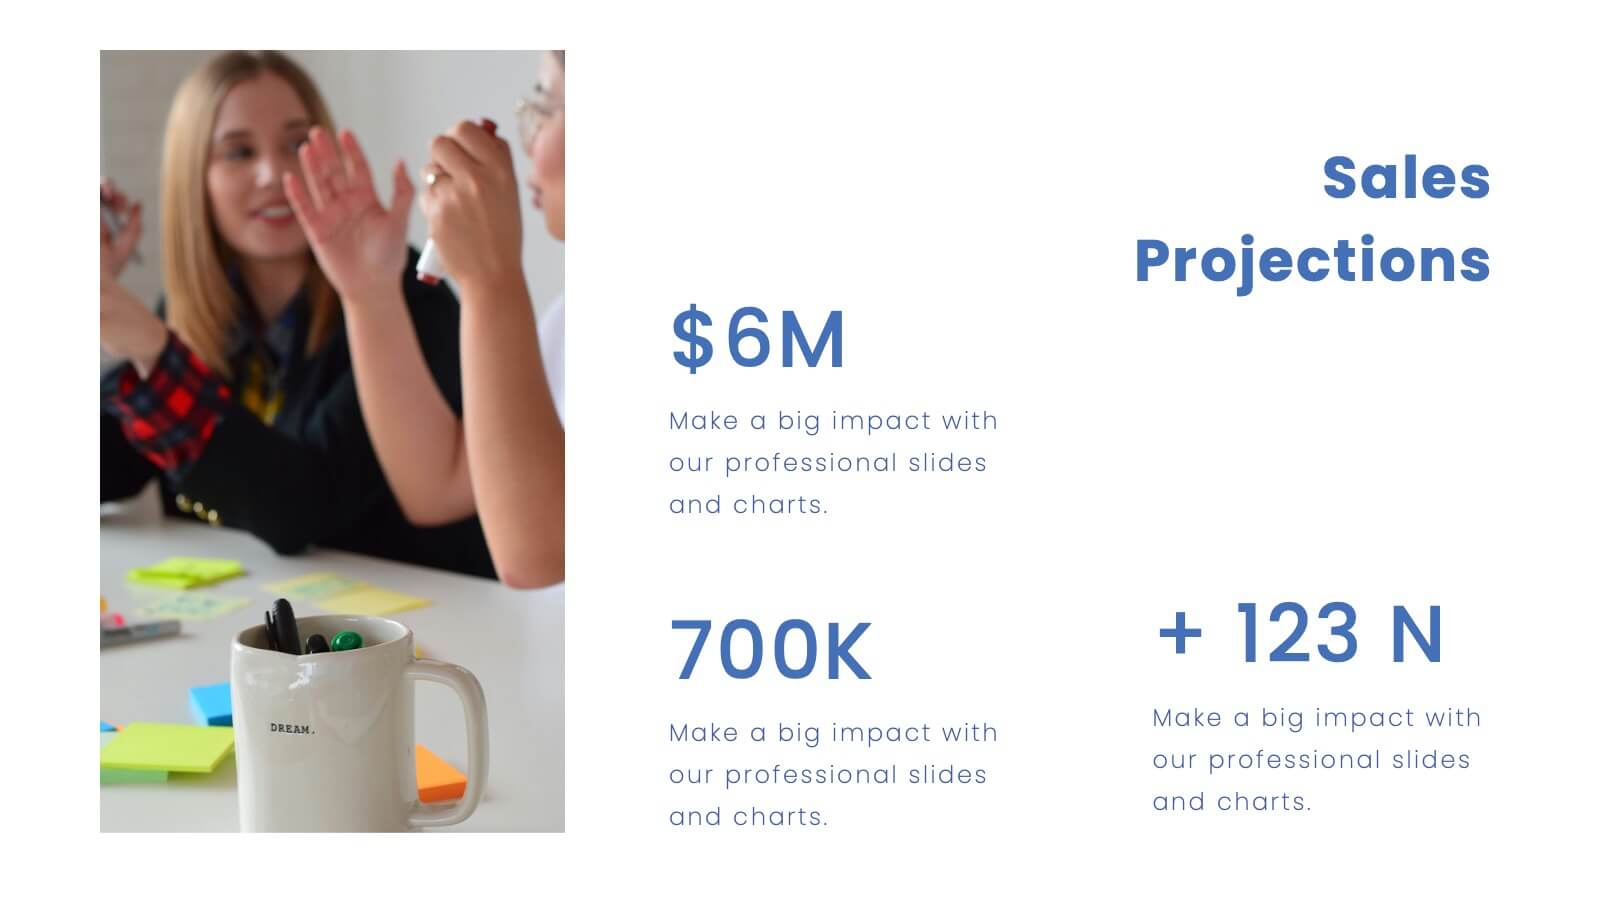
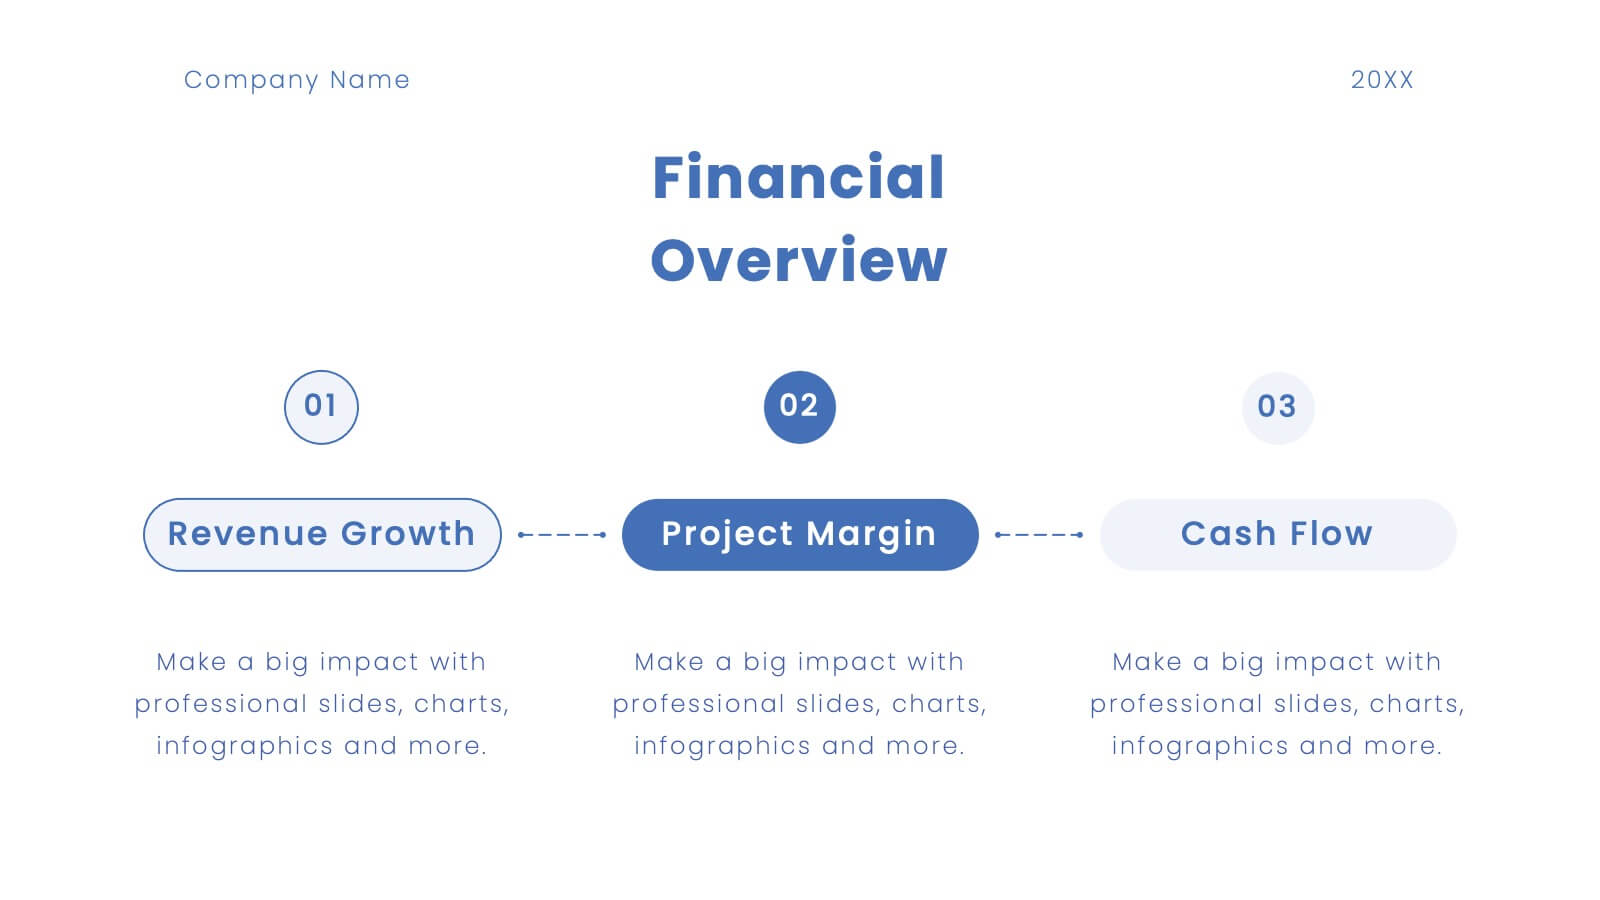
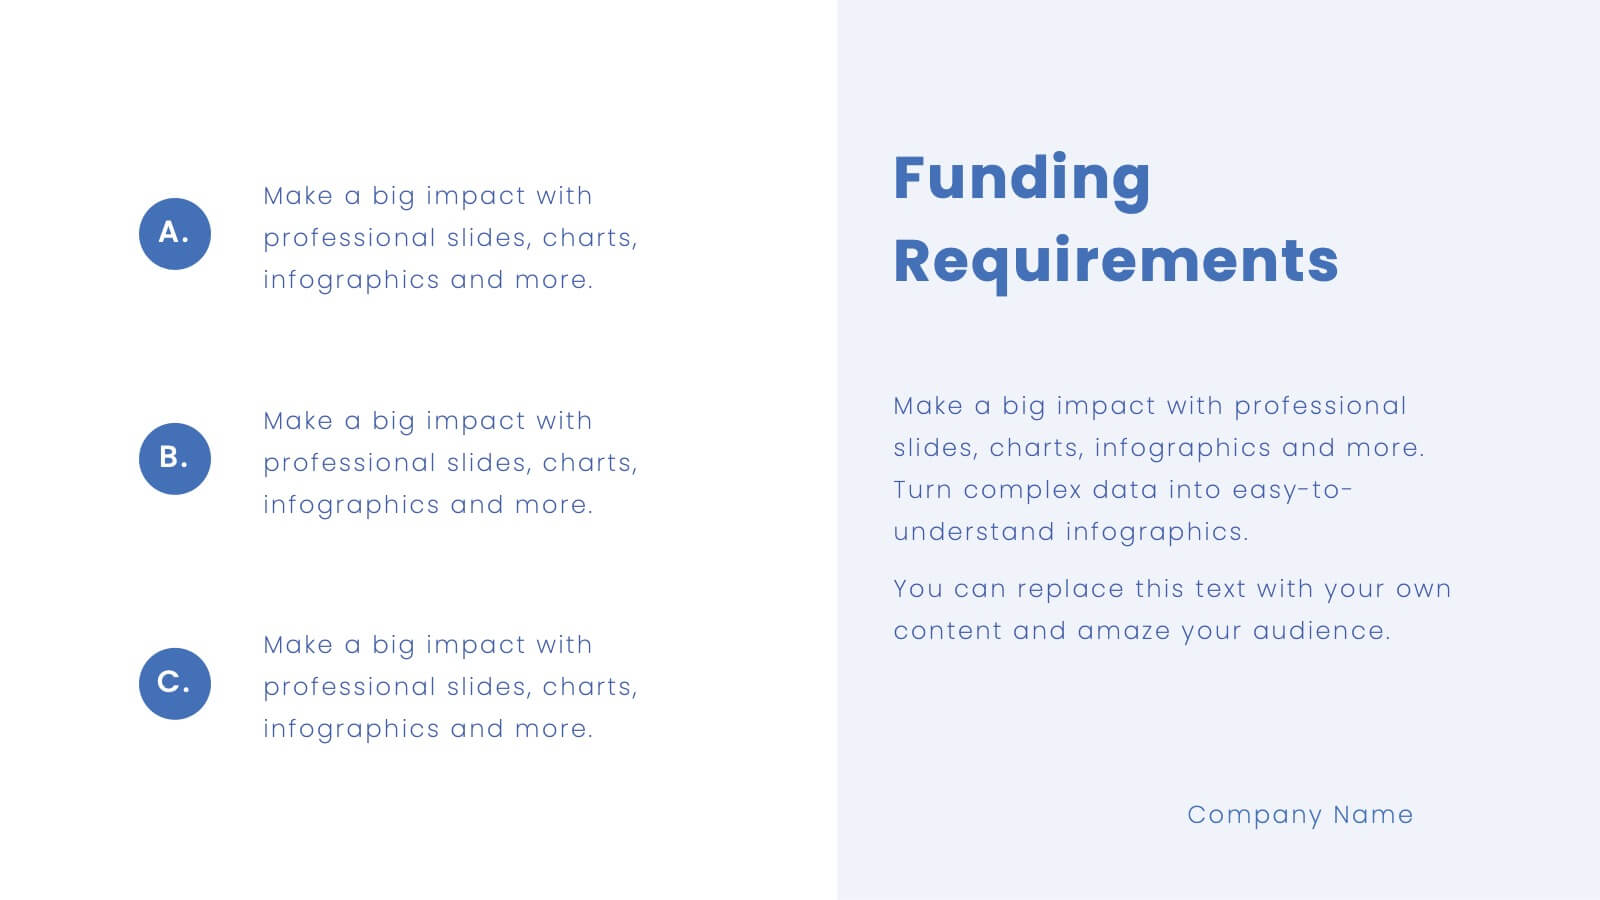
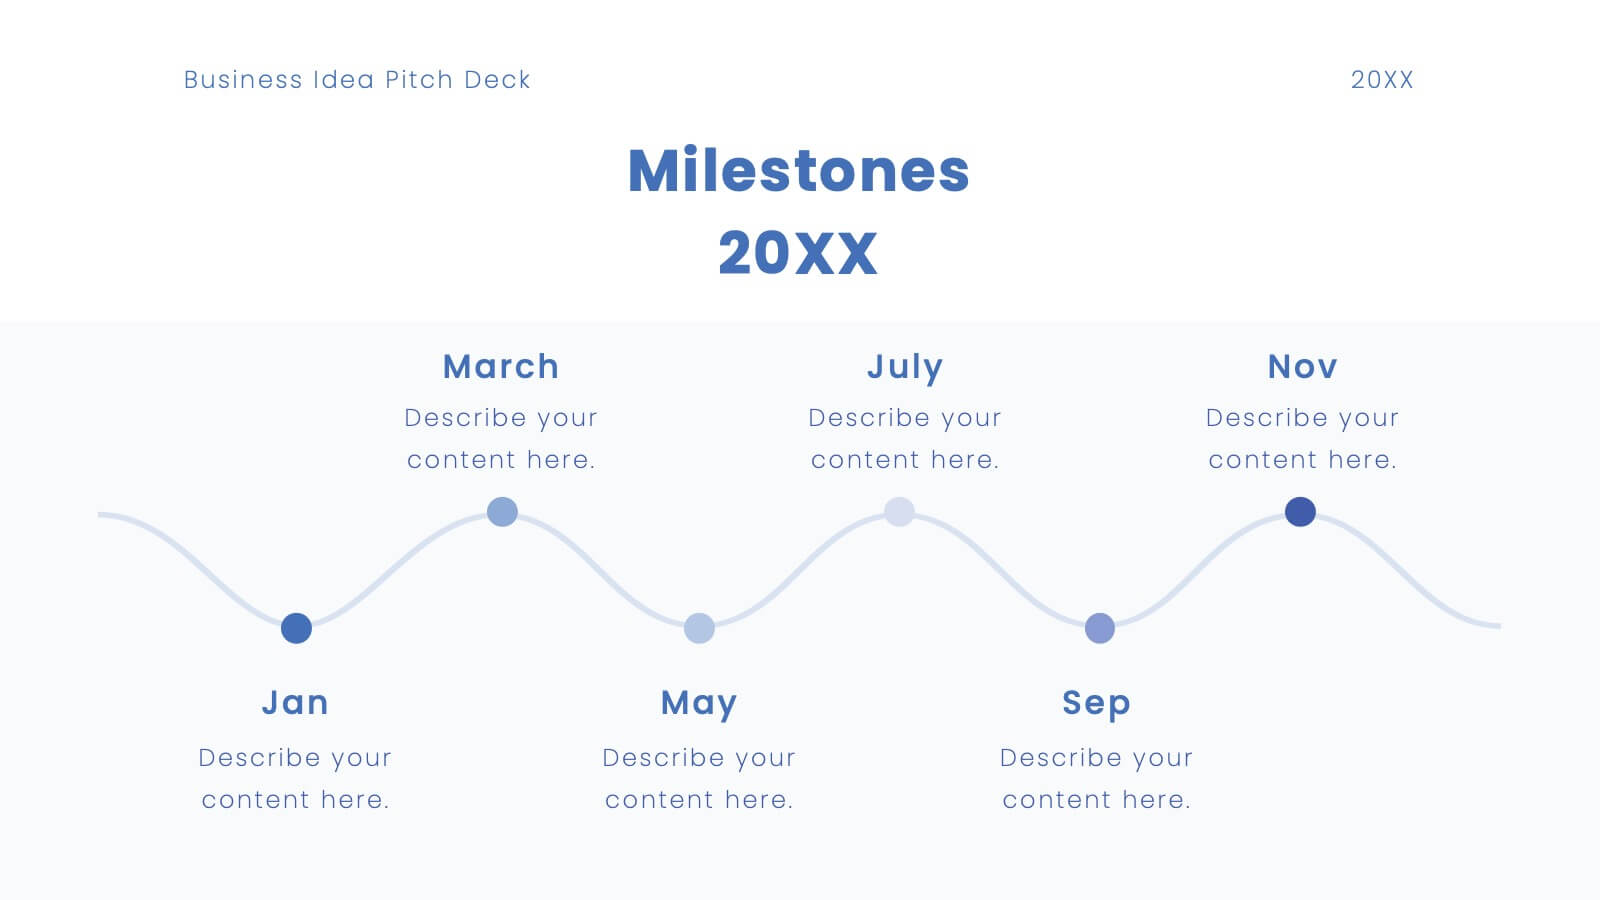
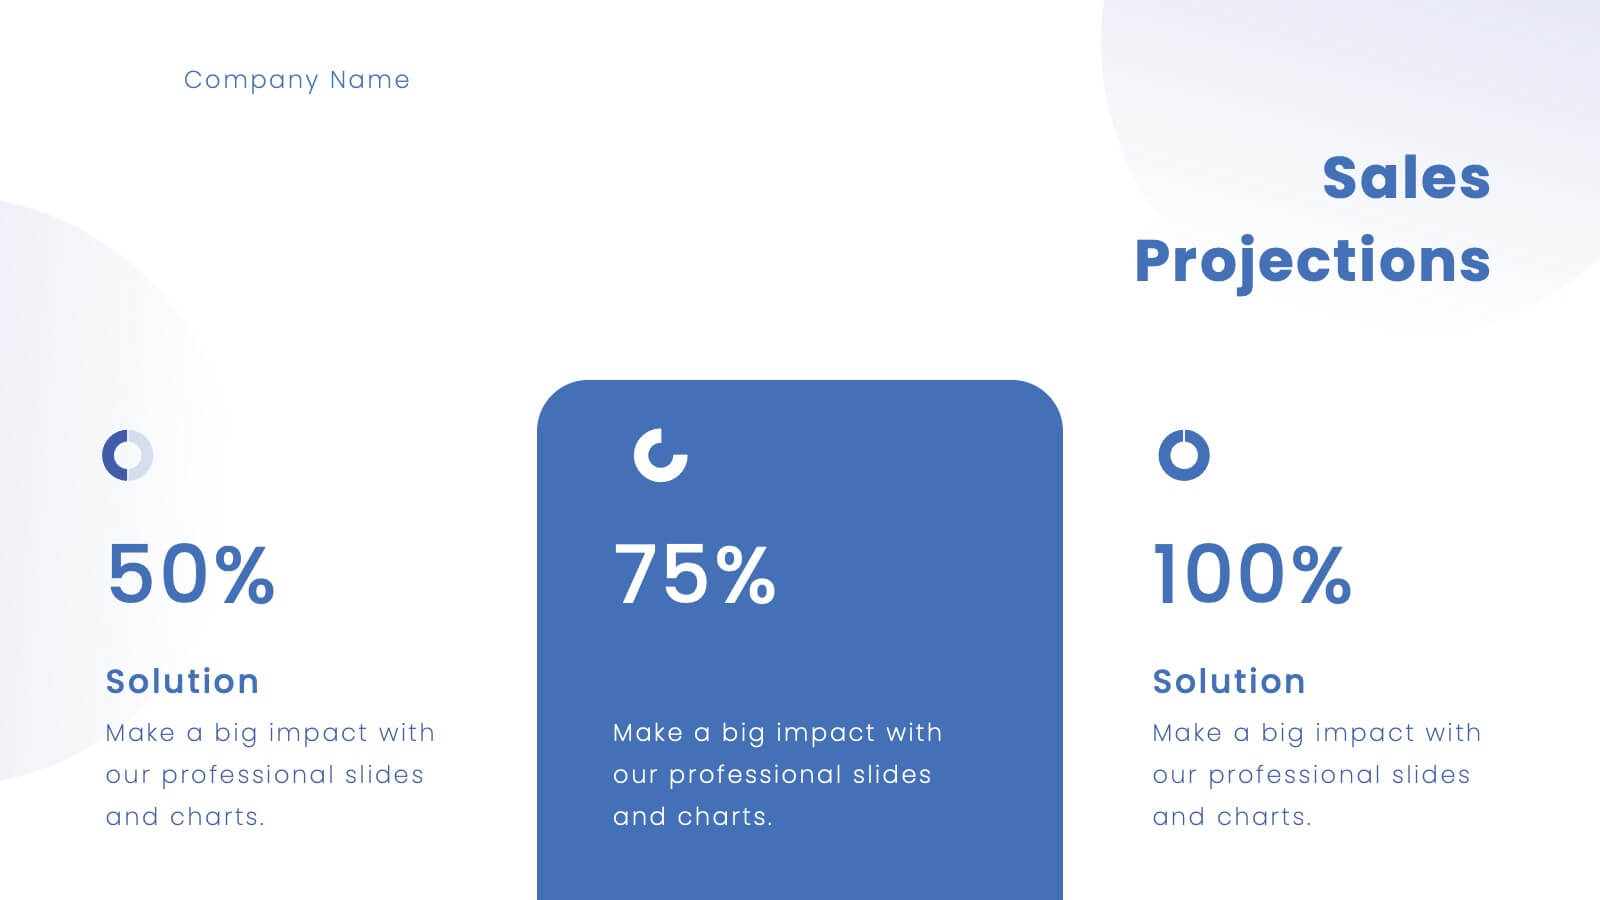
Platinum Business Idea Pitch Deck Presentation
Present your business idea with this sleek and professional pitch deck template! It includes everything from market opportunities to financial projections and sales strategies, providing a comprehensive structure for your pitch. Fully customizable and compatible with PowerPoint, Keynote, and Google Slides, this template is ideal for impressing investors and stakeholders.


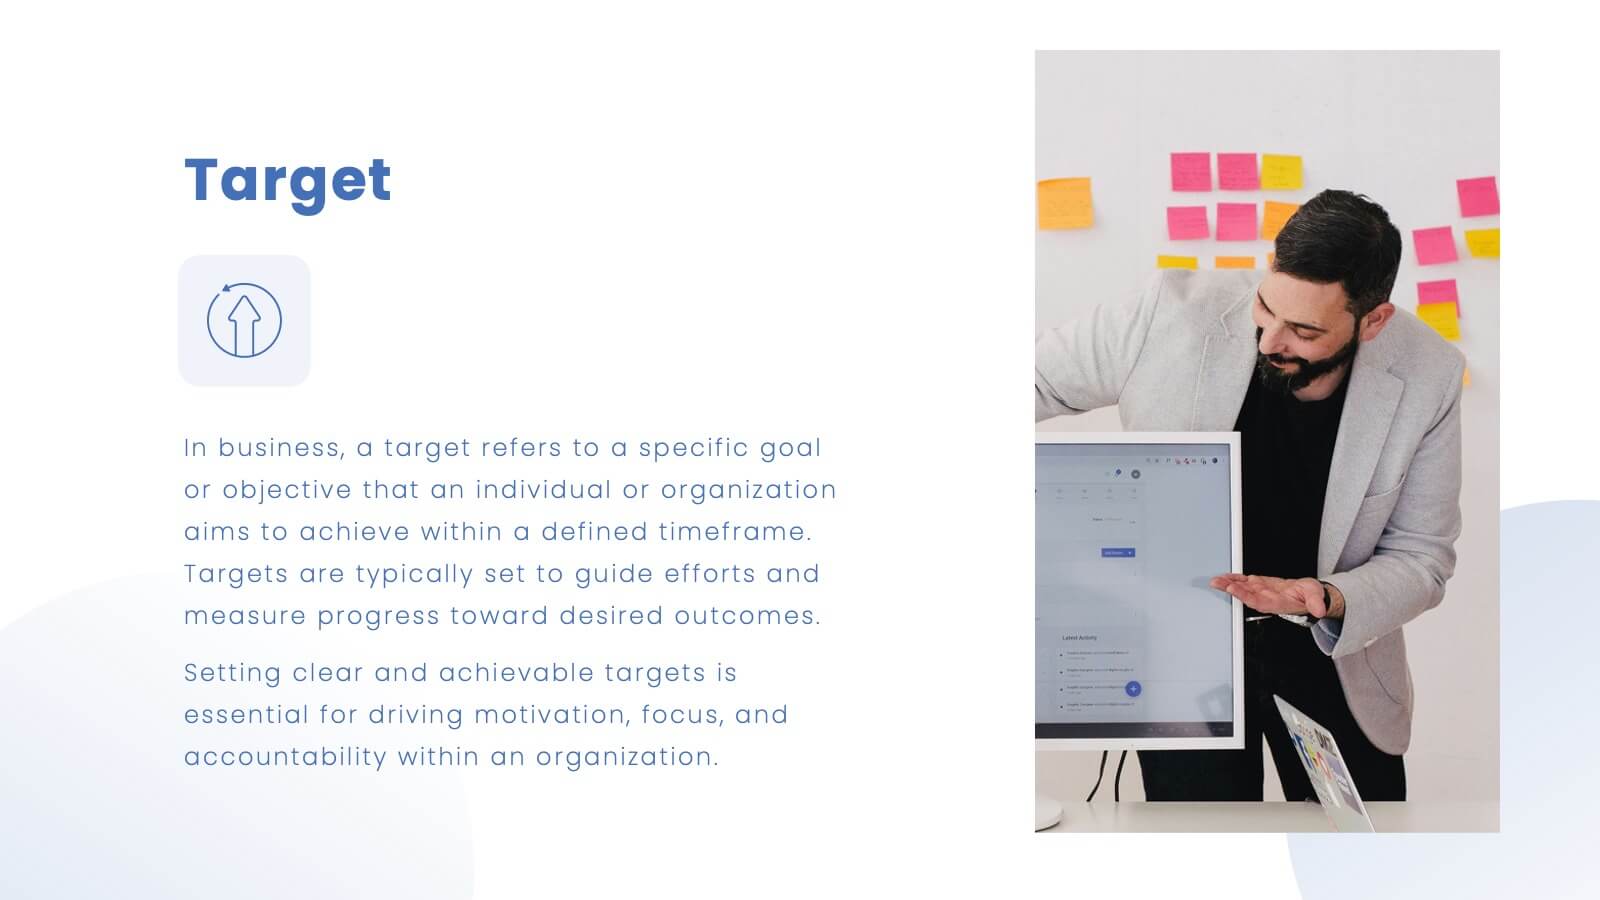
4 diapositivas
Operating Expenses and Cost Allocation Presentation
Clearly outline key financial movements with the Operating Expenses and Cost Allocation Presentation. This slide uses a step-arrow layout to show the relationship between spending and allocation, making it ideal for budgeting updates, operational analysis, or finance planning. Fully editable in PowerPoint, Keynote, Google Slides, and Canva for seamless customization.


4 diapositivas
Startup Business Plan Executive Overview Presentation
Present your startup vision with this bold, rocket-themed executive overview template. Perfect for outlining growth strategies, milestones, and launch plans, it combines vibrant visuals with a clean layout. Fully editable in Canva, PowerPoint, and Google Slides, it’s ideal for inspiring investors and stakeholders with a clear, professional business roadmap.


26 diapositivas
Financial Literacy Simple Presentation
Our "Financial Literacy" template is a must-have for anyone teaching money management, savings, and investment strategies. Compatible with PowerPoint, Keynote, and Google Slides, it makes financial education accessible and engaging. Introduce the basics with "Financial Literacy: Creating a Smarter Tomorrow" and outline your agenda with the "Table of Contents." The "Meet Our Team" slide can spotlight your financial experts, and the "Three Option Slide" breaks down key concepts like budgeting, saving, and investing. The "This is your big image slide" can visualize financial goals, while "Earn, Save, Invest, Protect." reinforces sound financial habits. Use "This is your Chart Slide" to present data on spending patterns and "Brain Infographic" to explore the psychology of spending. The template's clean design and customizable features make it easy to tailor your financial literacy presentation to any audience, ensuring that your message on smart money management is clear and impactful.


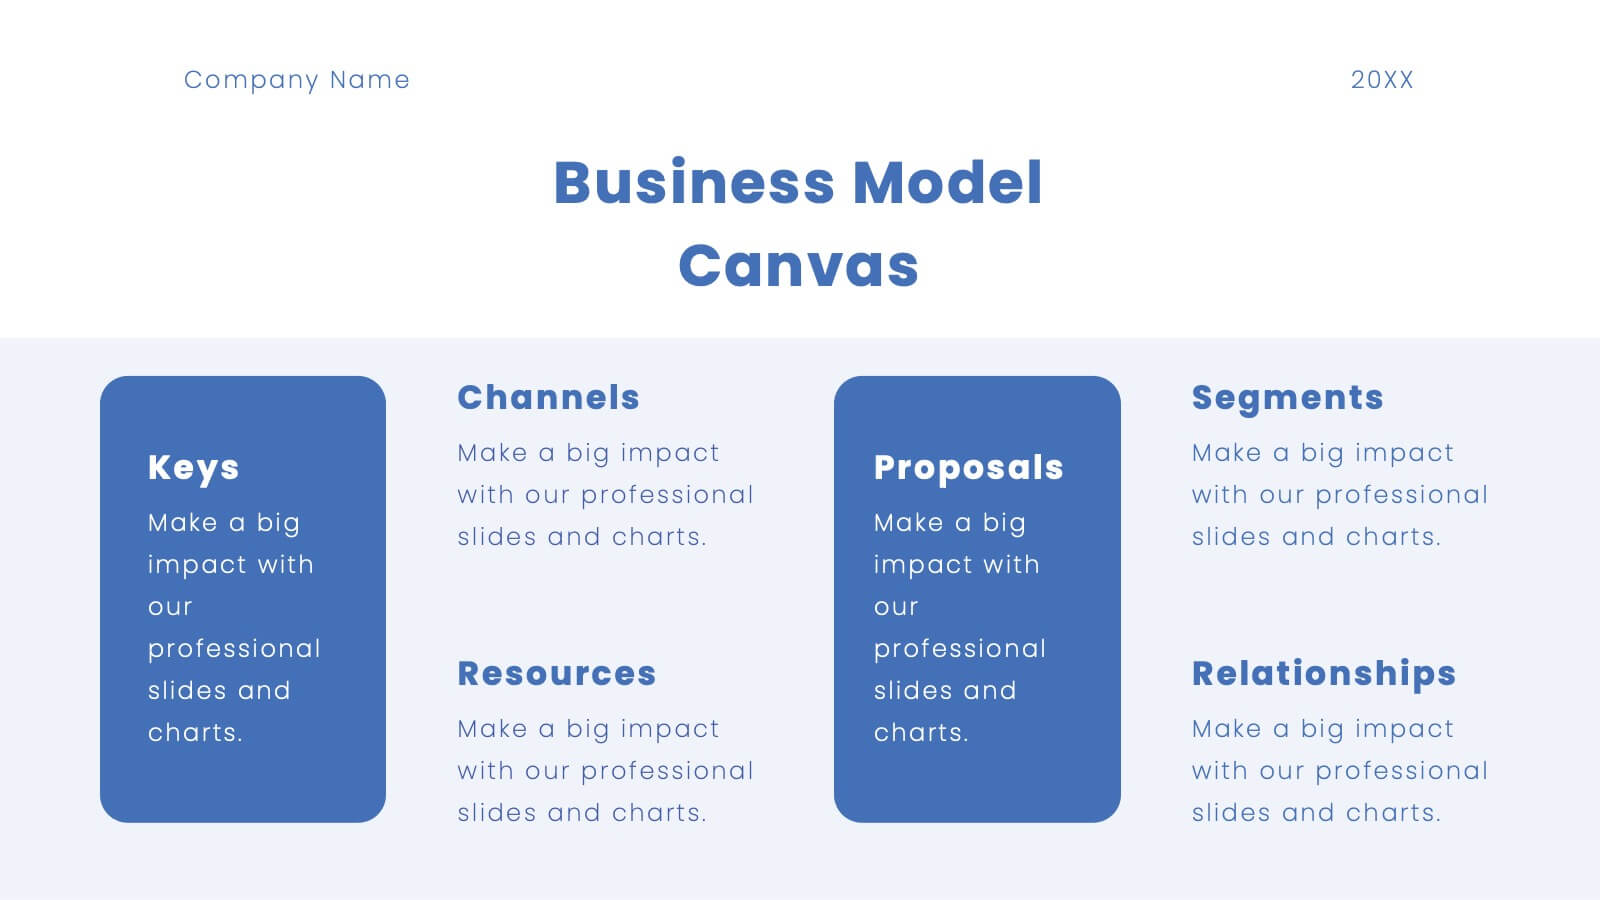
5 diapositivas
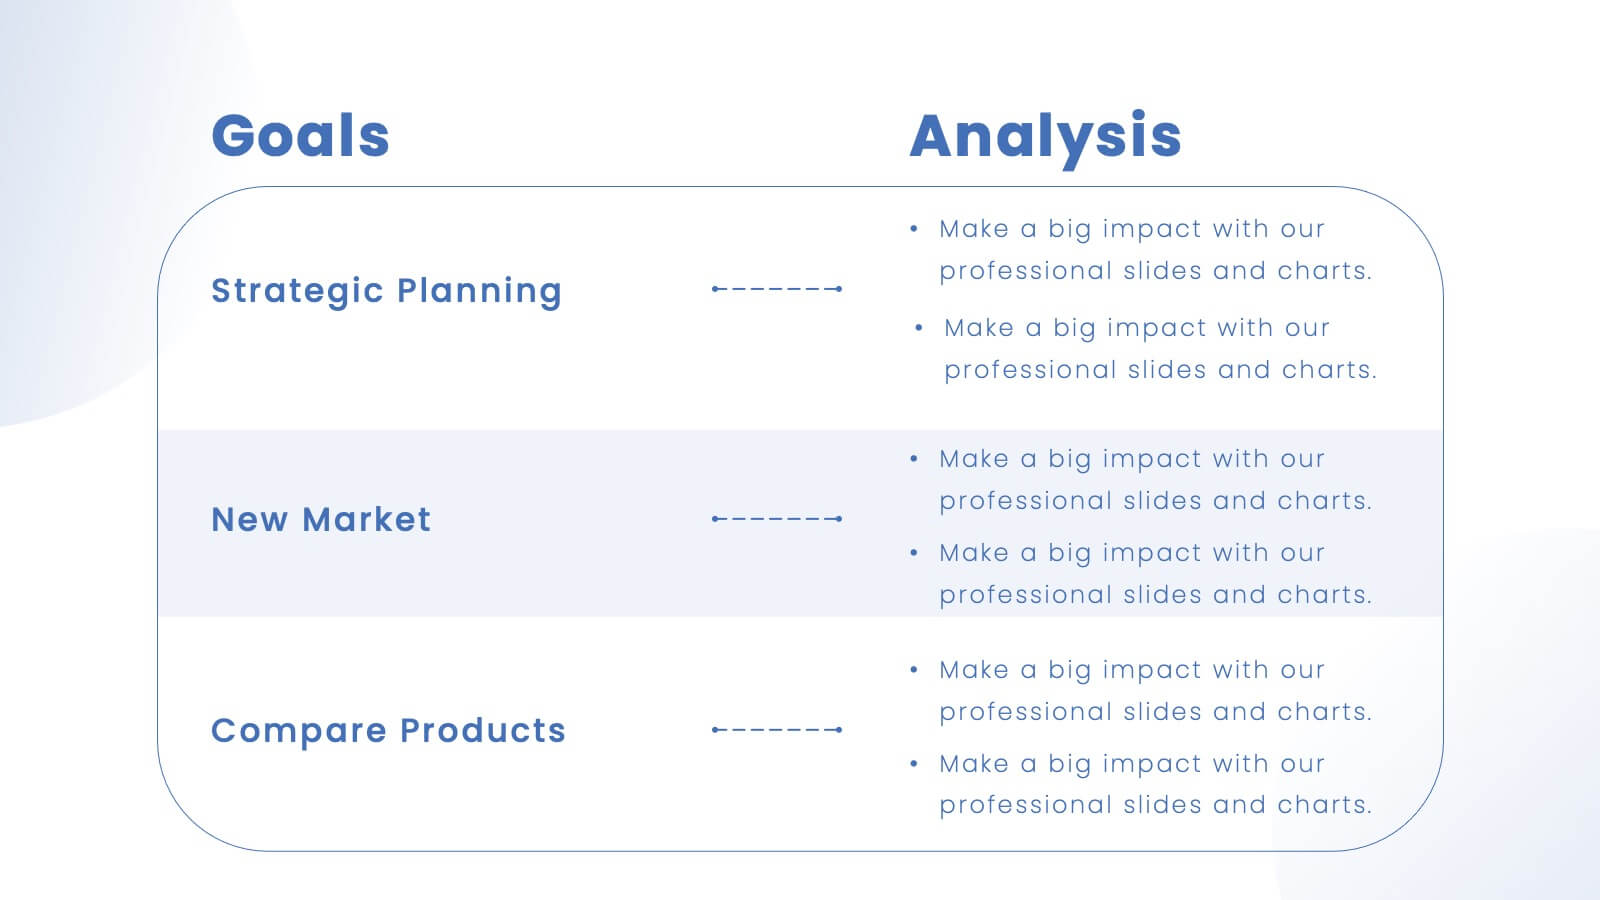
Business Matrix Model Presentation
Clearly define your strategy with this Business Matrix Model Presentation. This slide visualizes four key segments in a grid layout, perfect for mapping business priorities, comparing performance, or identifying growth opportunities. Each quadrant is color-coded and labeled, making it easy to explain complex concepts. Ideal for business planning, SWOT analysis, or strategy workshops. Fully editable in PowerPoint, Keynote, and Google Slides.


4 diapositivas
Risk vs Impact Matrix Layout Presentation
Visualize risk levels clearly with the Risk vs Impact Matrix Layout Presentation. This customizable template helps you assess and categorize potential risks based on their likelihood and impact, using a clear 3x3 color-coded grid. Ideal for project managers, risk analysts, and strategy teams. Compatible with PowerPoint, Keynote, Google Slides, and Canva.


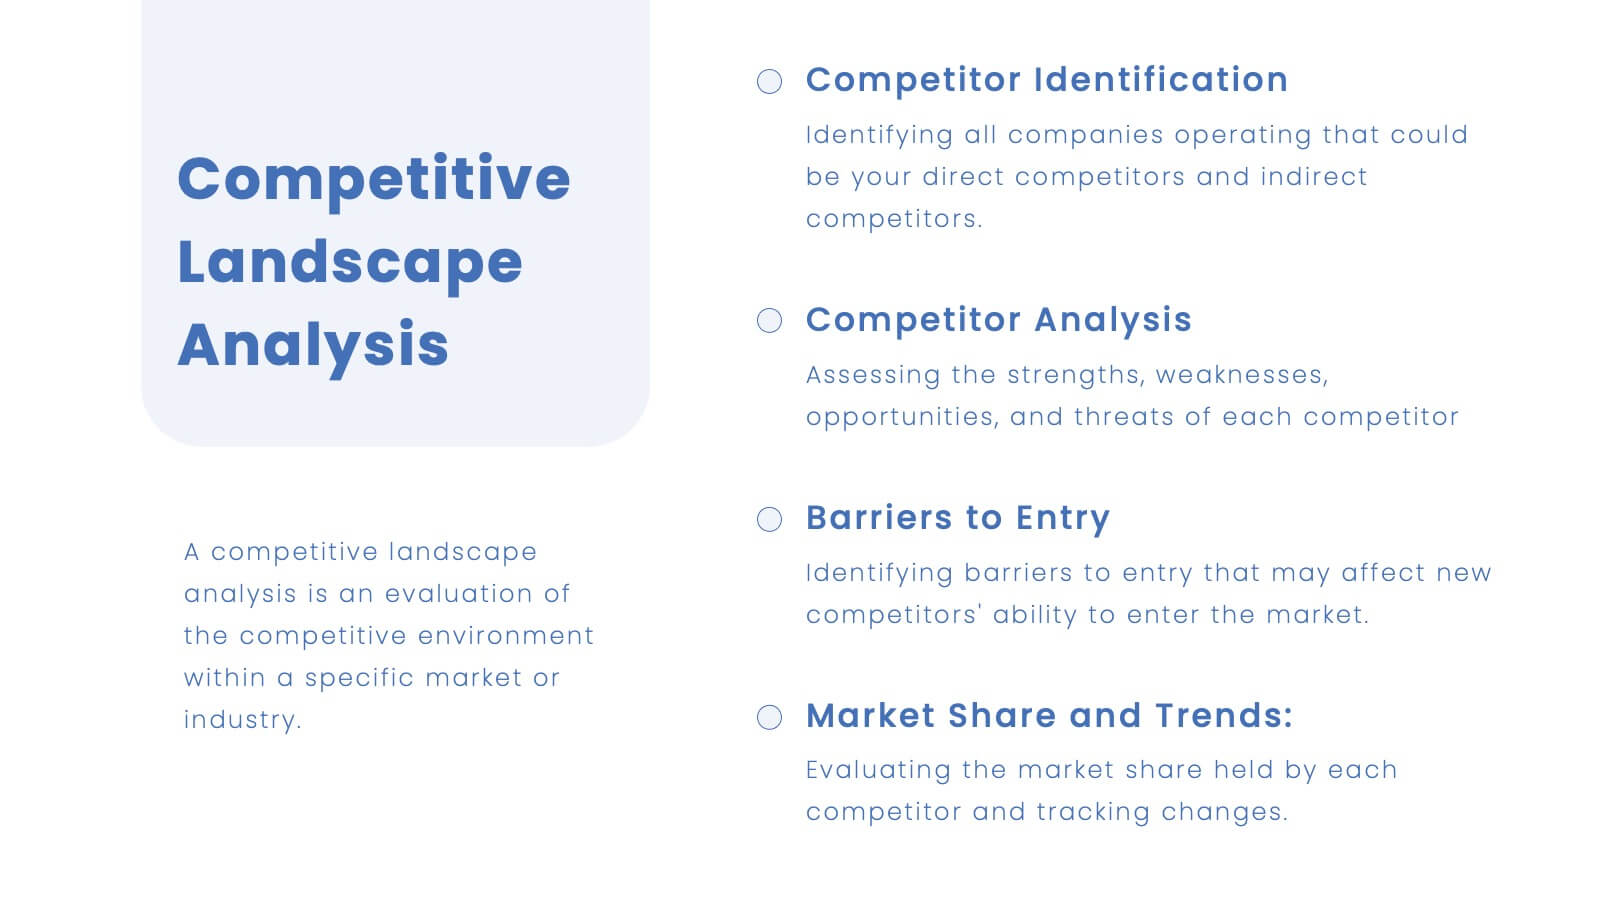
4 diapositivas
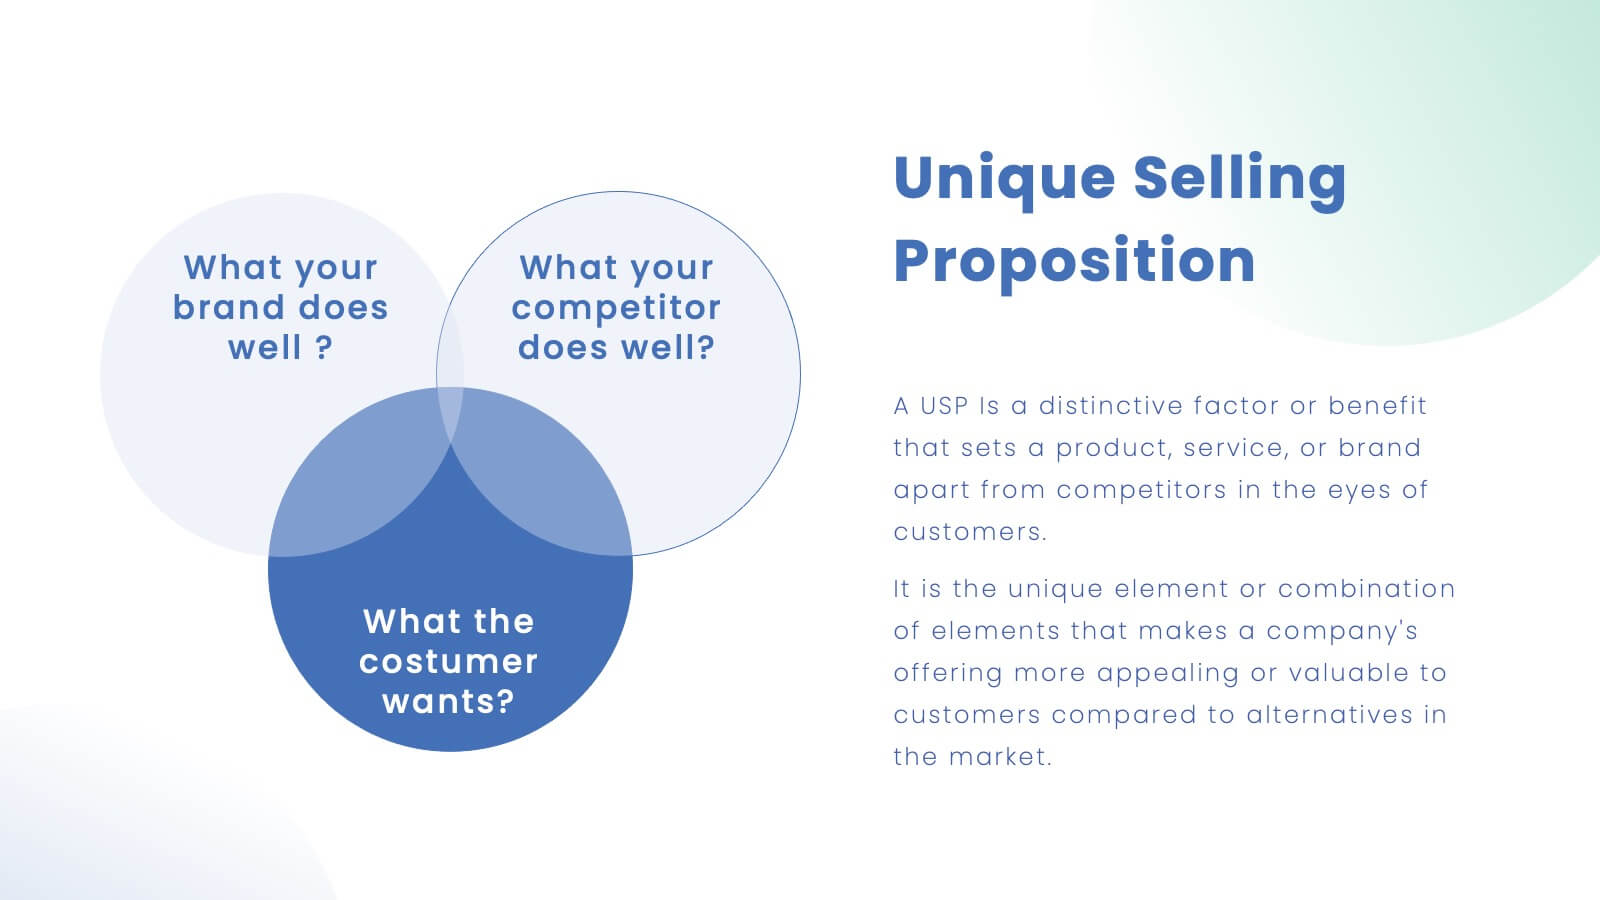
Blue Ocean Strategic Differentiation Presentation
Visually compare red and blue ocean strategies with this side-by-side layout. Perfect for showcasing competitive advantages, innovation, and market positioning. Each column highlights key differentiators in a clean, structured format. Ideal for marketing, strategy, or executive presentations. Fully customizable in PowerPoint, Keynote, and Google Slides to match your branding.


5 diapositivas
Corporate Risk Mitigation Plan Presentation
Visualize your risk strategy with the Corporate Risk Mitigation Plan Presentation. Featuring a segmented umbrella graphic (A–D), this slide is perfect for illustrating coverage areas, response actions, or protection levels. Great for corporate risk managers and planning teams. Editable in PowerPoint, Google Slides, and Canva.


21 diapositivas
Veridian Agile Project Plan Presentation
Streamline your project management with this agile project plan template, featuring deliverables, timeline, resource allocation, and quality assurance. Ideal for agile teams, it helps in tracking progress and managing risks efficiently. Compatible with PowerPoint, Keynote, and Google Slides, ensuring seamless and impactful presentations.


4 diapositivas
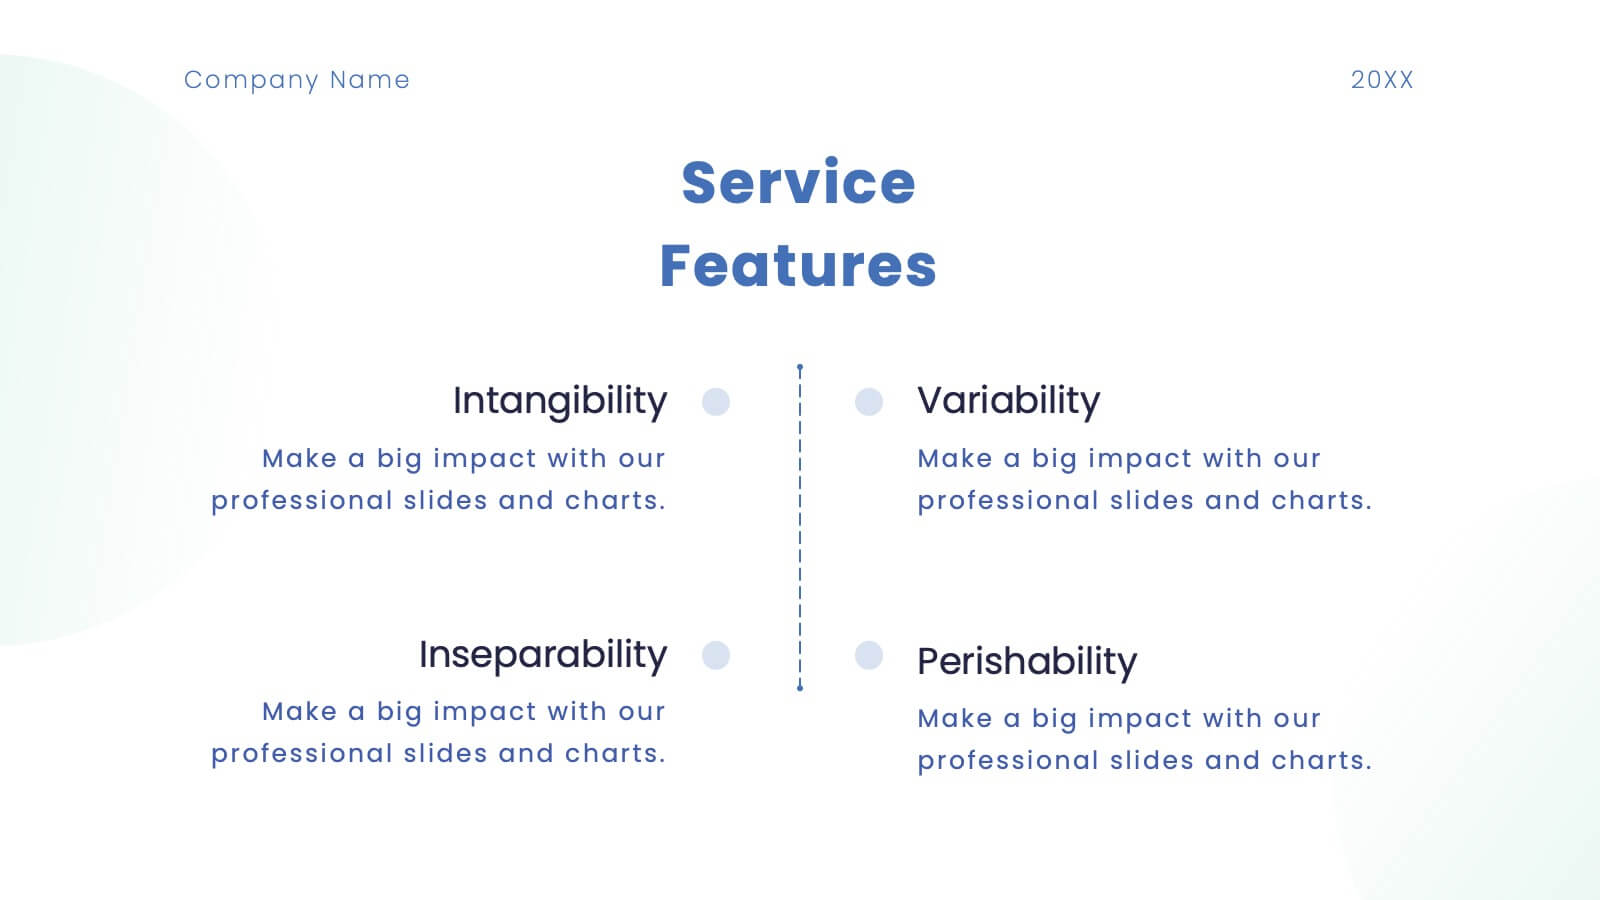
Empathy Mapping for Product Development Presentation
Strengthen user understanding with the Empathy Mapping for Product Development Presentation. This template helps teams visualize what users think, feel, say, and do—essential for creating intuitive products and experiences. Ideal for design sprints, UX workshops, and product planning sessions. Fully editable in PowerPoint, Keynote, Canva, and Google Slides.


6 diapositivas
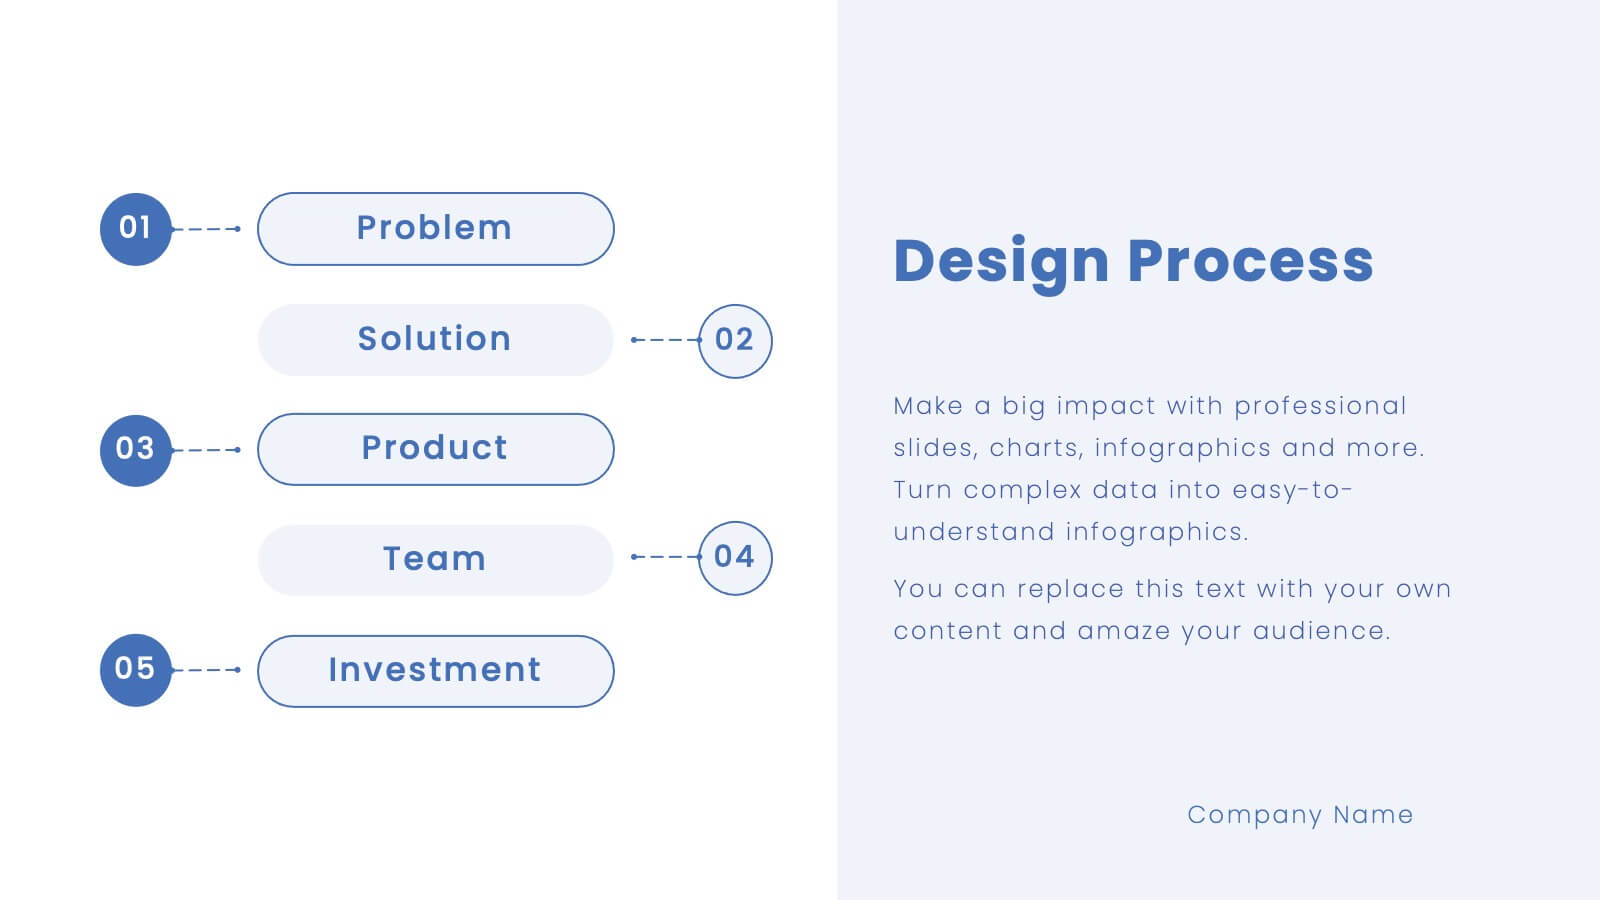
Virtual Team Collaboration and Productivity Presentation
Boost team synergy and streamline communication with this Virtual Team Collaboration and Productivity presentation. Designed around a 6-step path, this visual layout helps illustrate key strategies for remote teamwork, digital workflows, and efficient task distribution. Each step is clearly labeled with space for your insights, making it ideal for team training, project kickoff meetings, or collaboration tool tutorials. Fully editable and compatible with PowerPoint, Keynote, and Google Slides.


24 diapositivas
Fictara UX Research Report Presentation
Present your UX research findings effectively with this modern and professional template. Covering essential topics such as user personas, wireframes, usability guidelines, and feedback iteration, it’s designed to showcase insights clearly. Fully editable and compatible with PowerPoint, Keynote, and Google Slides.


7 diapositivas
Cryptocurrency Prices Infographic
Cryptocurrency prices refer to the current or historical values of various cryptocurrencies in terms of a specific fiat currency or other cryptocurrencies. This infographic template is a visual journey into the ever-fluctuating world of digital currencies. This template serves as your gateway to understanding the trends and values of cryptocurrencies, empowering you to make informed decisions in this exciting financial realm. Compatible with Powerpoint, Keynote, and Google Slides. Use this infographic to easily present major cryptocurrencies as celestial bodies, emphasizing the vastness and potential of the crypto universe.


4 diapositivas
Personalized Learning Experience Presentation
Present tailored learning paths with this vibrant personalized education slide. Designed with sticky-note and pin graphics, it's ideal for breaking down individual goals, curriculum customization, or adaptive learning models. Fully editable in PowerPoint, Keynote, and Google Slides—perfect for educators, trainers, and instructional designers seeking clarity and engagement in learning presentations.