


Características


¿Tienes alguna pregunta?
Recomendar


6 diapositivas
5-Step Investment Planning Presentation
Guide your audience through a clear, structured journey with a modern layout that turns each financial step into a simple, visual milestone. This presentation helps you explain goals, outline processes, and communicate actionable insights with ease and clarity. Fully editable and compatible with PowerPoint, Keynote, and Google Slides.


6 diapositivas
How to Master Time Management Presentation
Make every minute count with this sleek and dynamic template built to visualize productivity, efficiency, and planning. Perfect for showcasing workflows, priorities, or time allocation, it helps communicate structure with clarity and style. Fully customizable and compatible with PowerPoint, Keynote, and Google Slides for effortless editing and presentation.


6 diapositivas
Data Trends and Statistical Overview Presentation
Present your insights clearly with the Data Trends and Statistical Overview presentation. This template features a clean combination of bar charts and half-pie graphs to showcase metrics, comparisons, and progress at a glance. Ideal for monthly analytics, business reviews, or performance tracking. Fully editable in PowerPoint, Keynote, and Google Slides.


6 diapositivas
Detailed Case Analysis Report Presentation
Turn complex findings into a clear and engaging story with this modern, data-focused layout. Ideal for professionals presenting research, performance reviews, or audit results, it helps you organize insights with precision and clarity. Fully editable and compatible with PowerPoint, Keynote, and Google Slides for effortless customization and presentation delivery.


6 diapositivas
Corporation Schedule Infographics
Elevate your corporate presentations with our Corporation Schedule infographic, expertly designed for compatibility with Powerpoint, Keynote, and Google Slides. This practical and polished infographic is an exceptional resource for managers, team leads, and event coordinators planning and presenting schedules, timelines, and agendas. The infographic is structured to visually organize and communicate a corporation's schedule, making it an invaluable tool for outlining project timelines, meeting agendas, or corporate event itineraries. Its clear, concise format is specifically tailored to the business environment, where readability and quick comprehension are paramount. Integrating this infographic into your presentation will not only enhance its professional appearance but also facilitate effective time management and ensure alignment across teams. Whether you’re detailing a week-long conference schedule or outlining a project’s phases, this infographic provides a streamlined approach to sharing that information with your audience. It’s a strategic way to keep everyone informed and focused on the company's key timeframes and objectives.


25 diapositivas
The Power of HIIT Presentation
Supercharge your fitness routine with this high-energy presentation on the power of HIIT. Covering key benefits like fat burning, muscle endurance, metabolism boost, and time-efficient workouts, this template helps break down the science behind high-intensity interval training. Fully customizable and compatible with PowerPoint, Keynote, and Google Slides for a seamless presentation experience.
8 diapositivas
Business Growth and Progress Tracking Presentation
Visualize success with this upward-arrow roadmap template designed to highlight four key stages of business development. Ideal for managers, analysts, and entrepreneurs, this slide uses milestone icons and clean, directional layout to emphasize progress. Fully editable in PowerPoint, Keynote, and Google Slides for seamless customization.


7 diapositivas
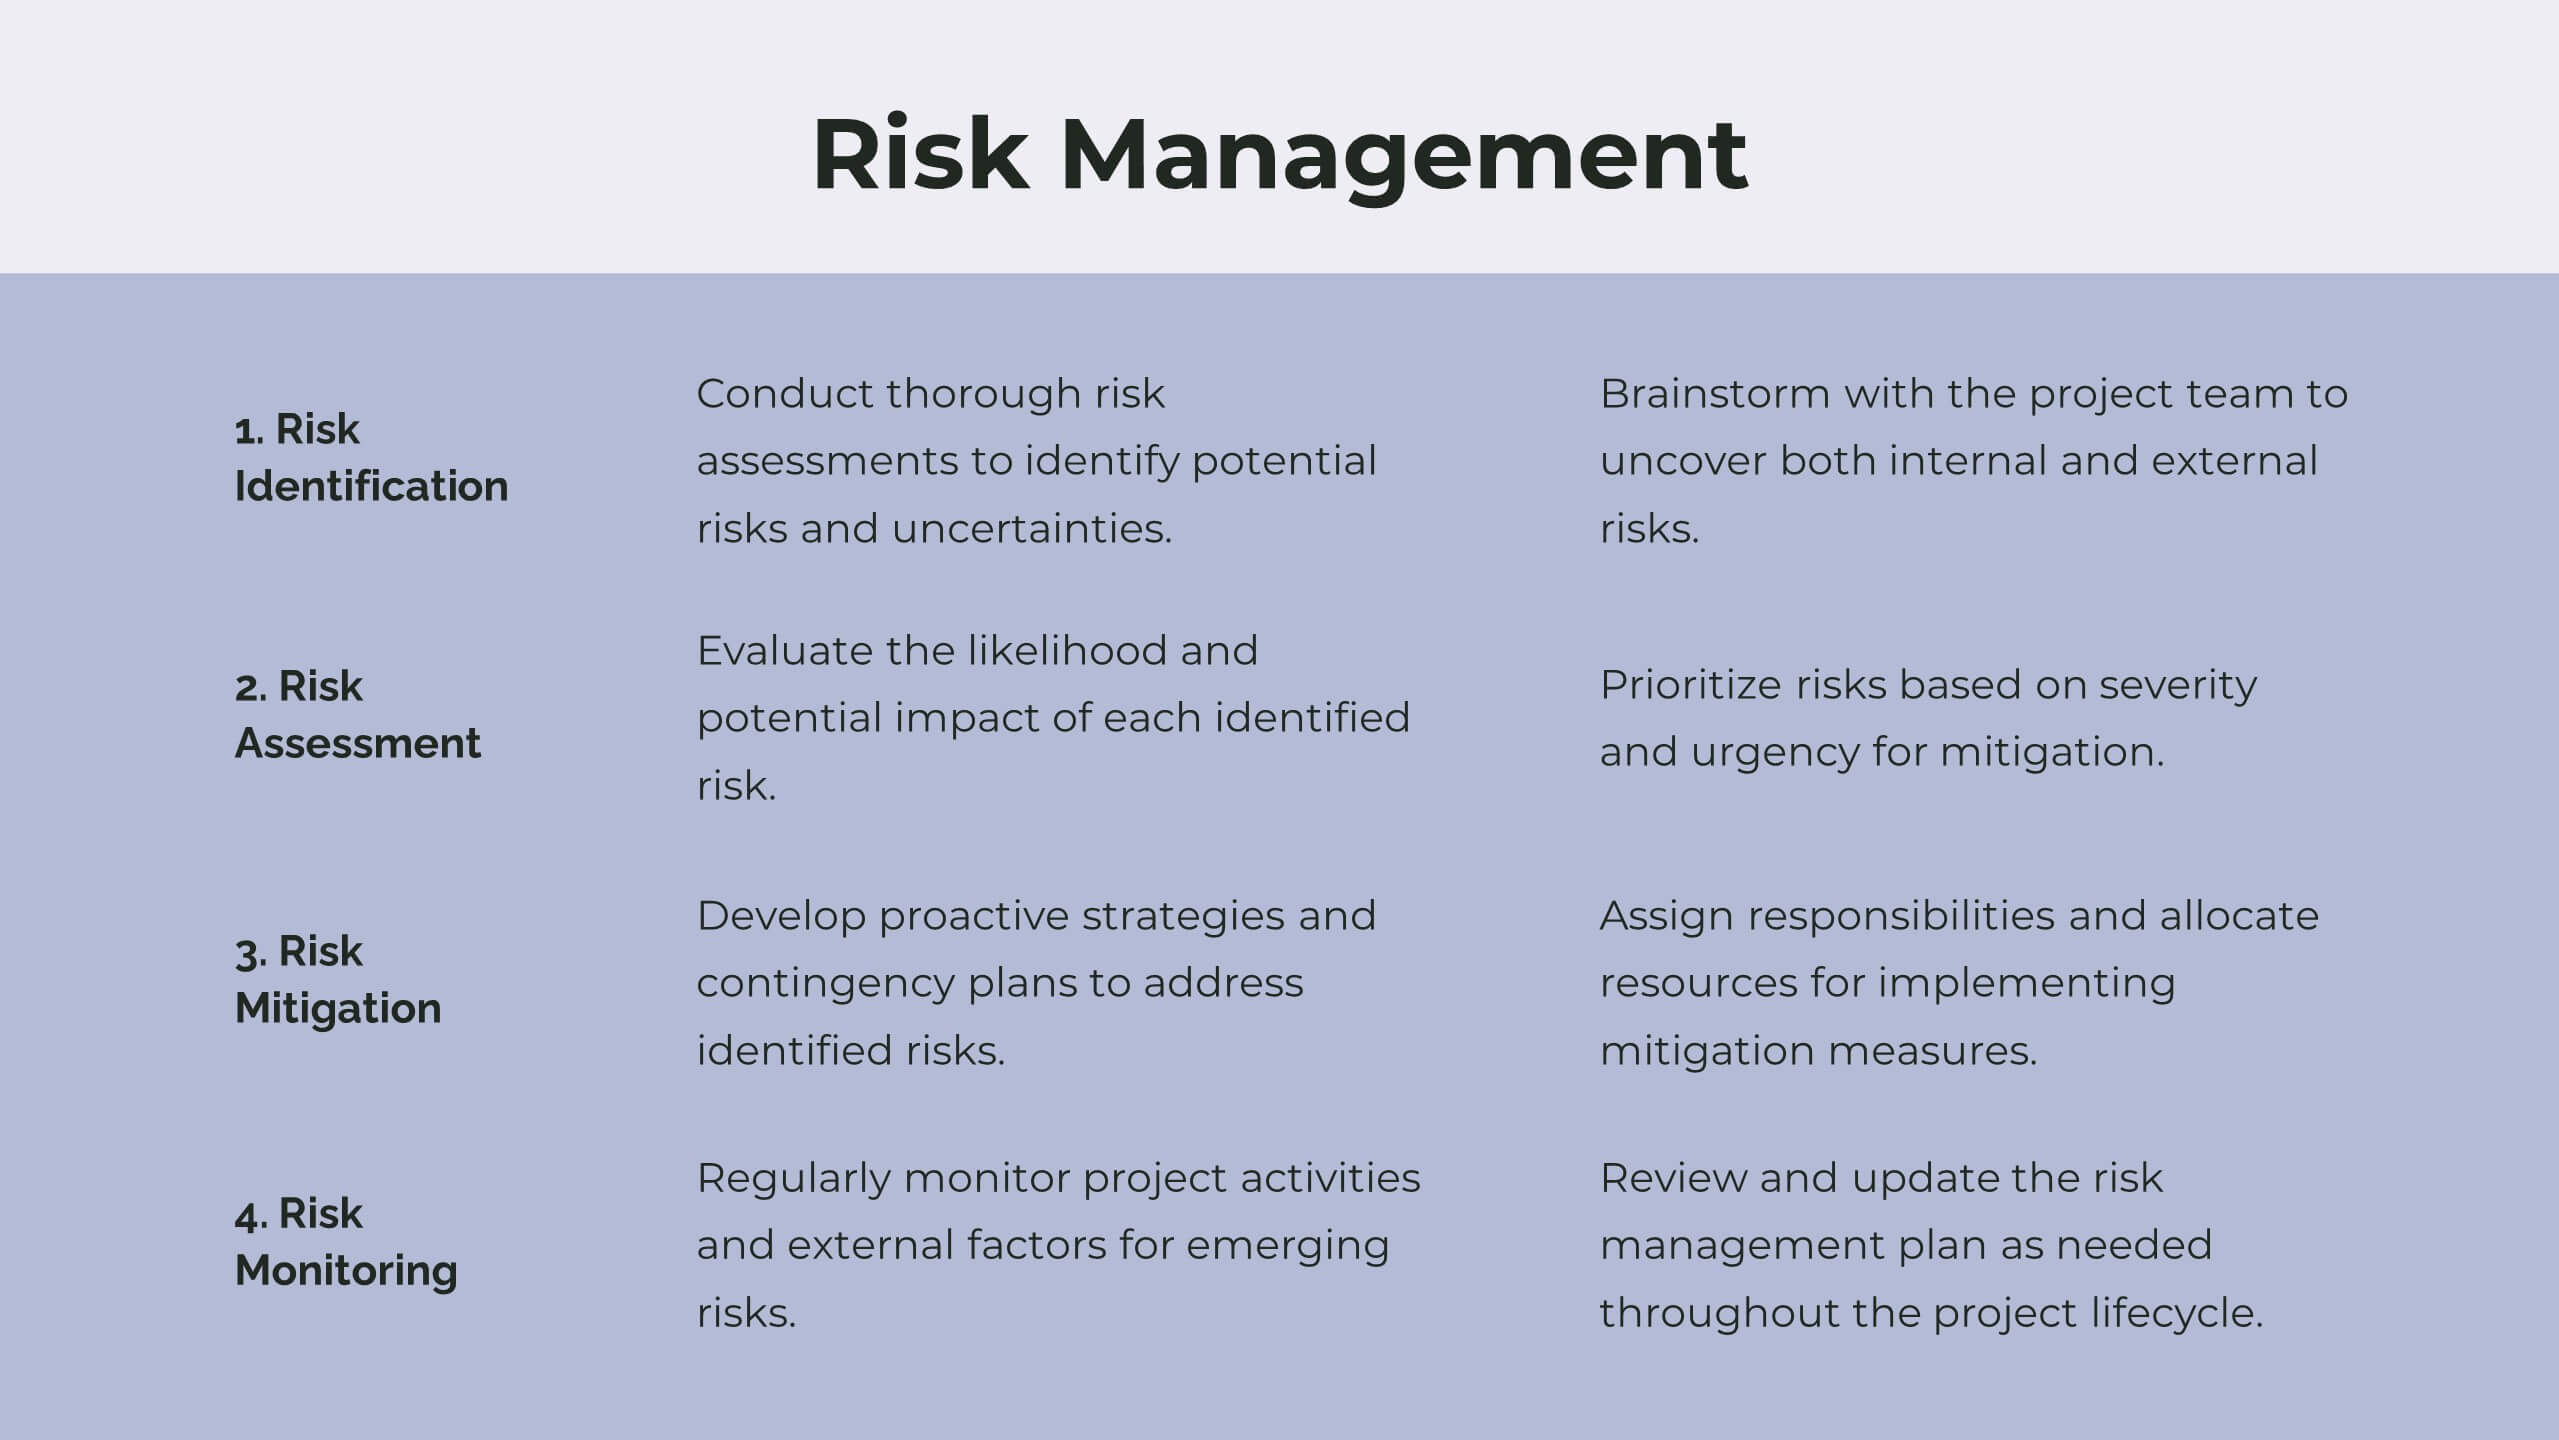
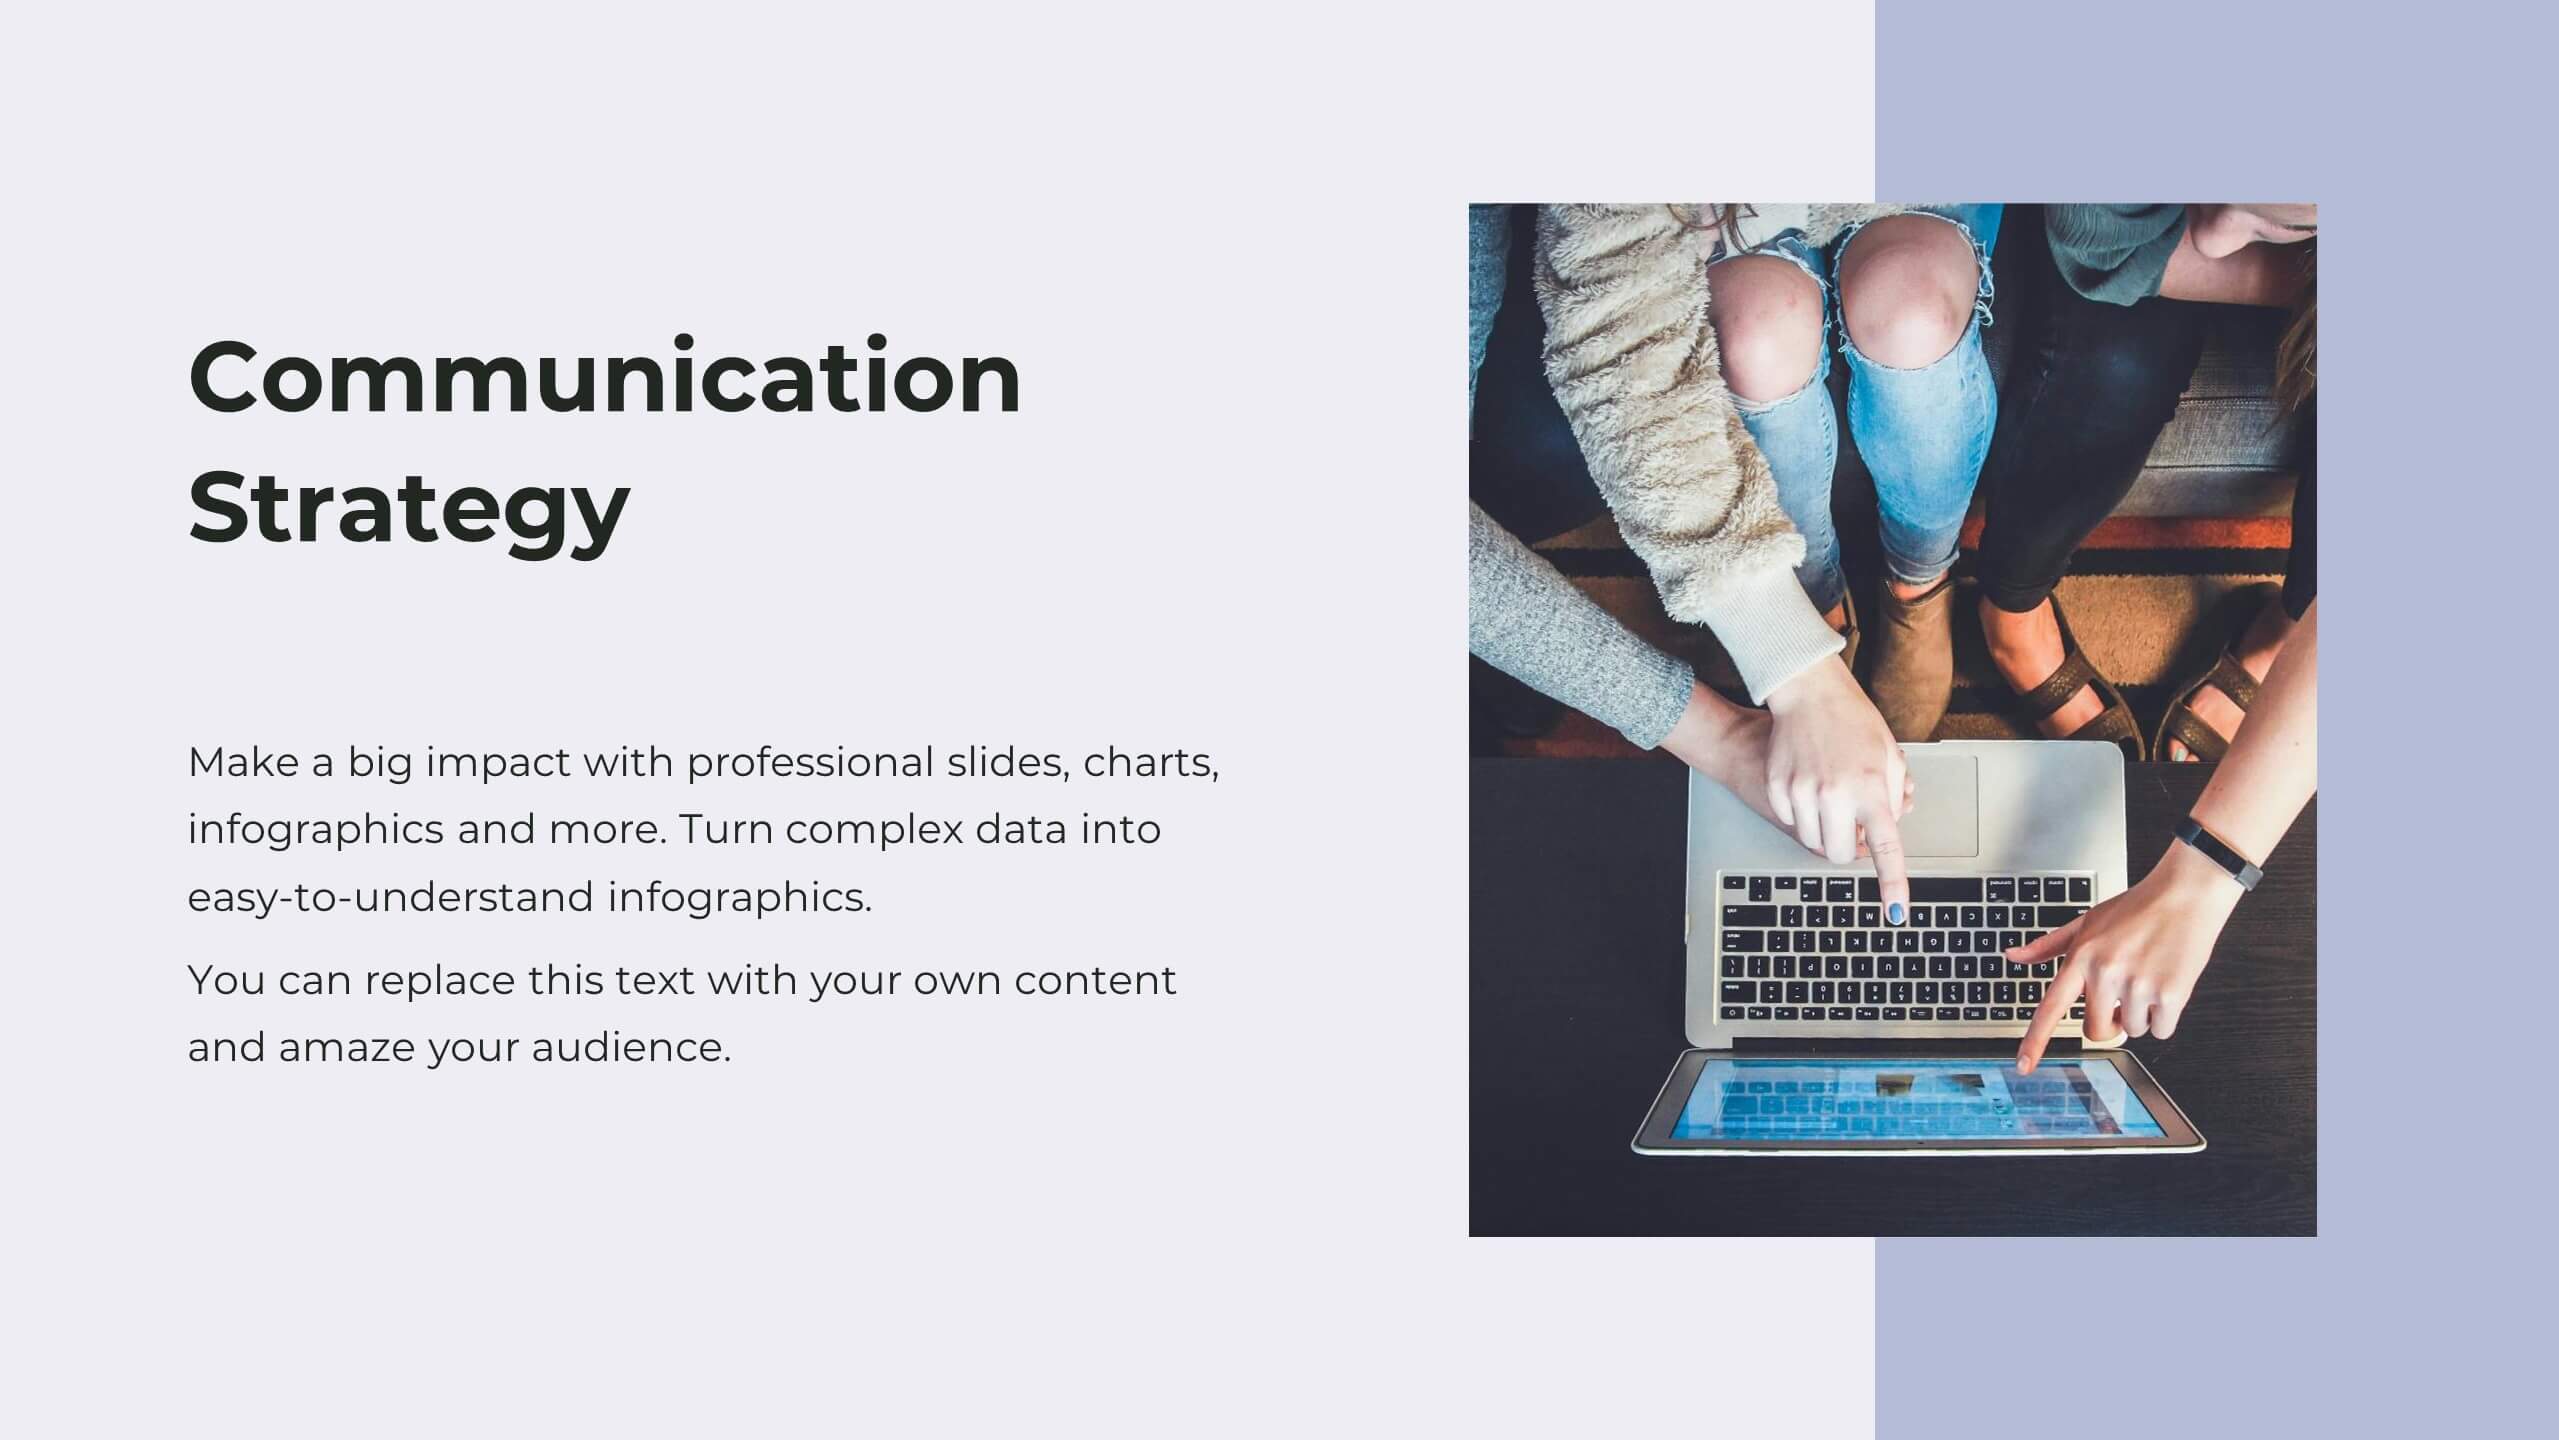
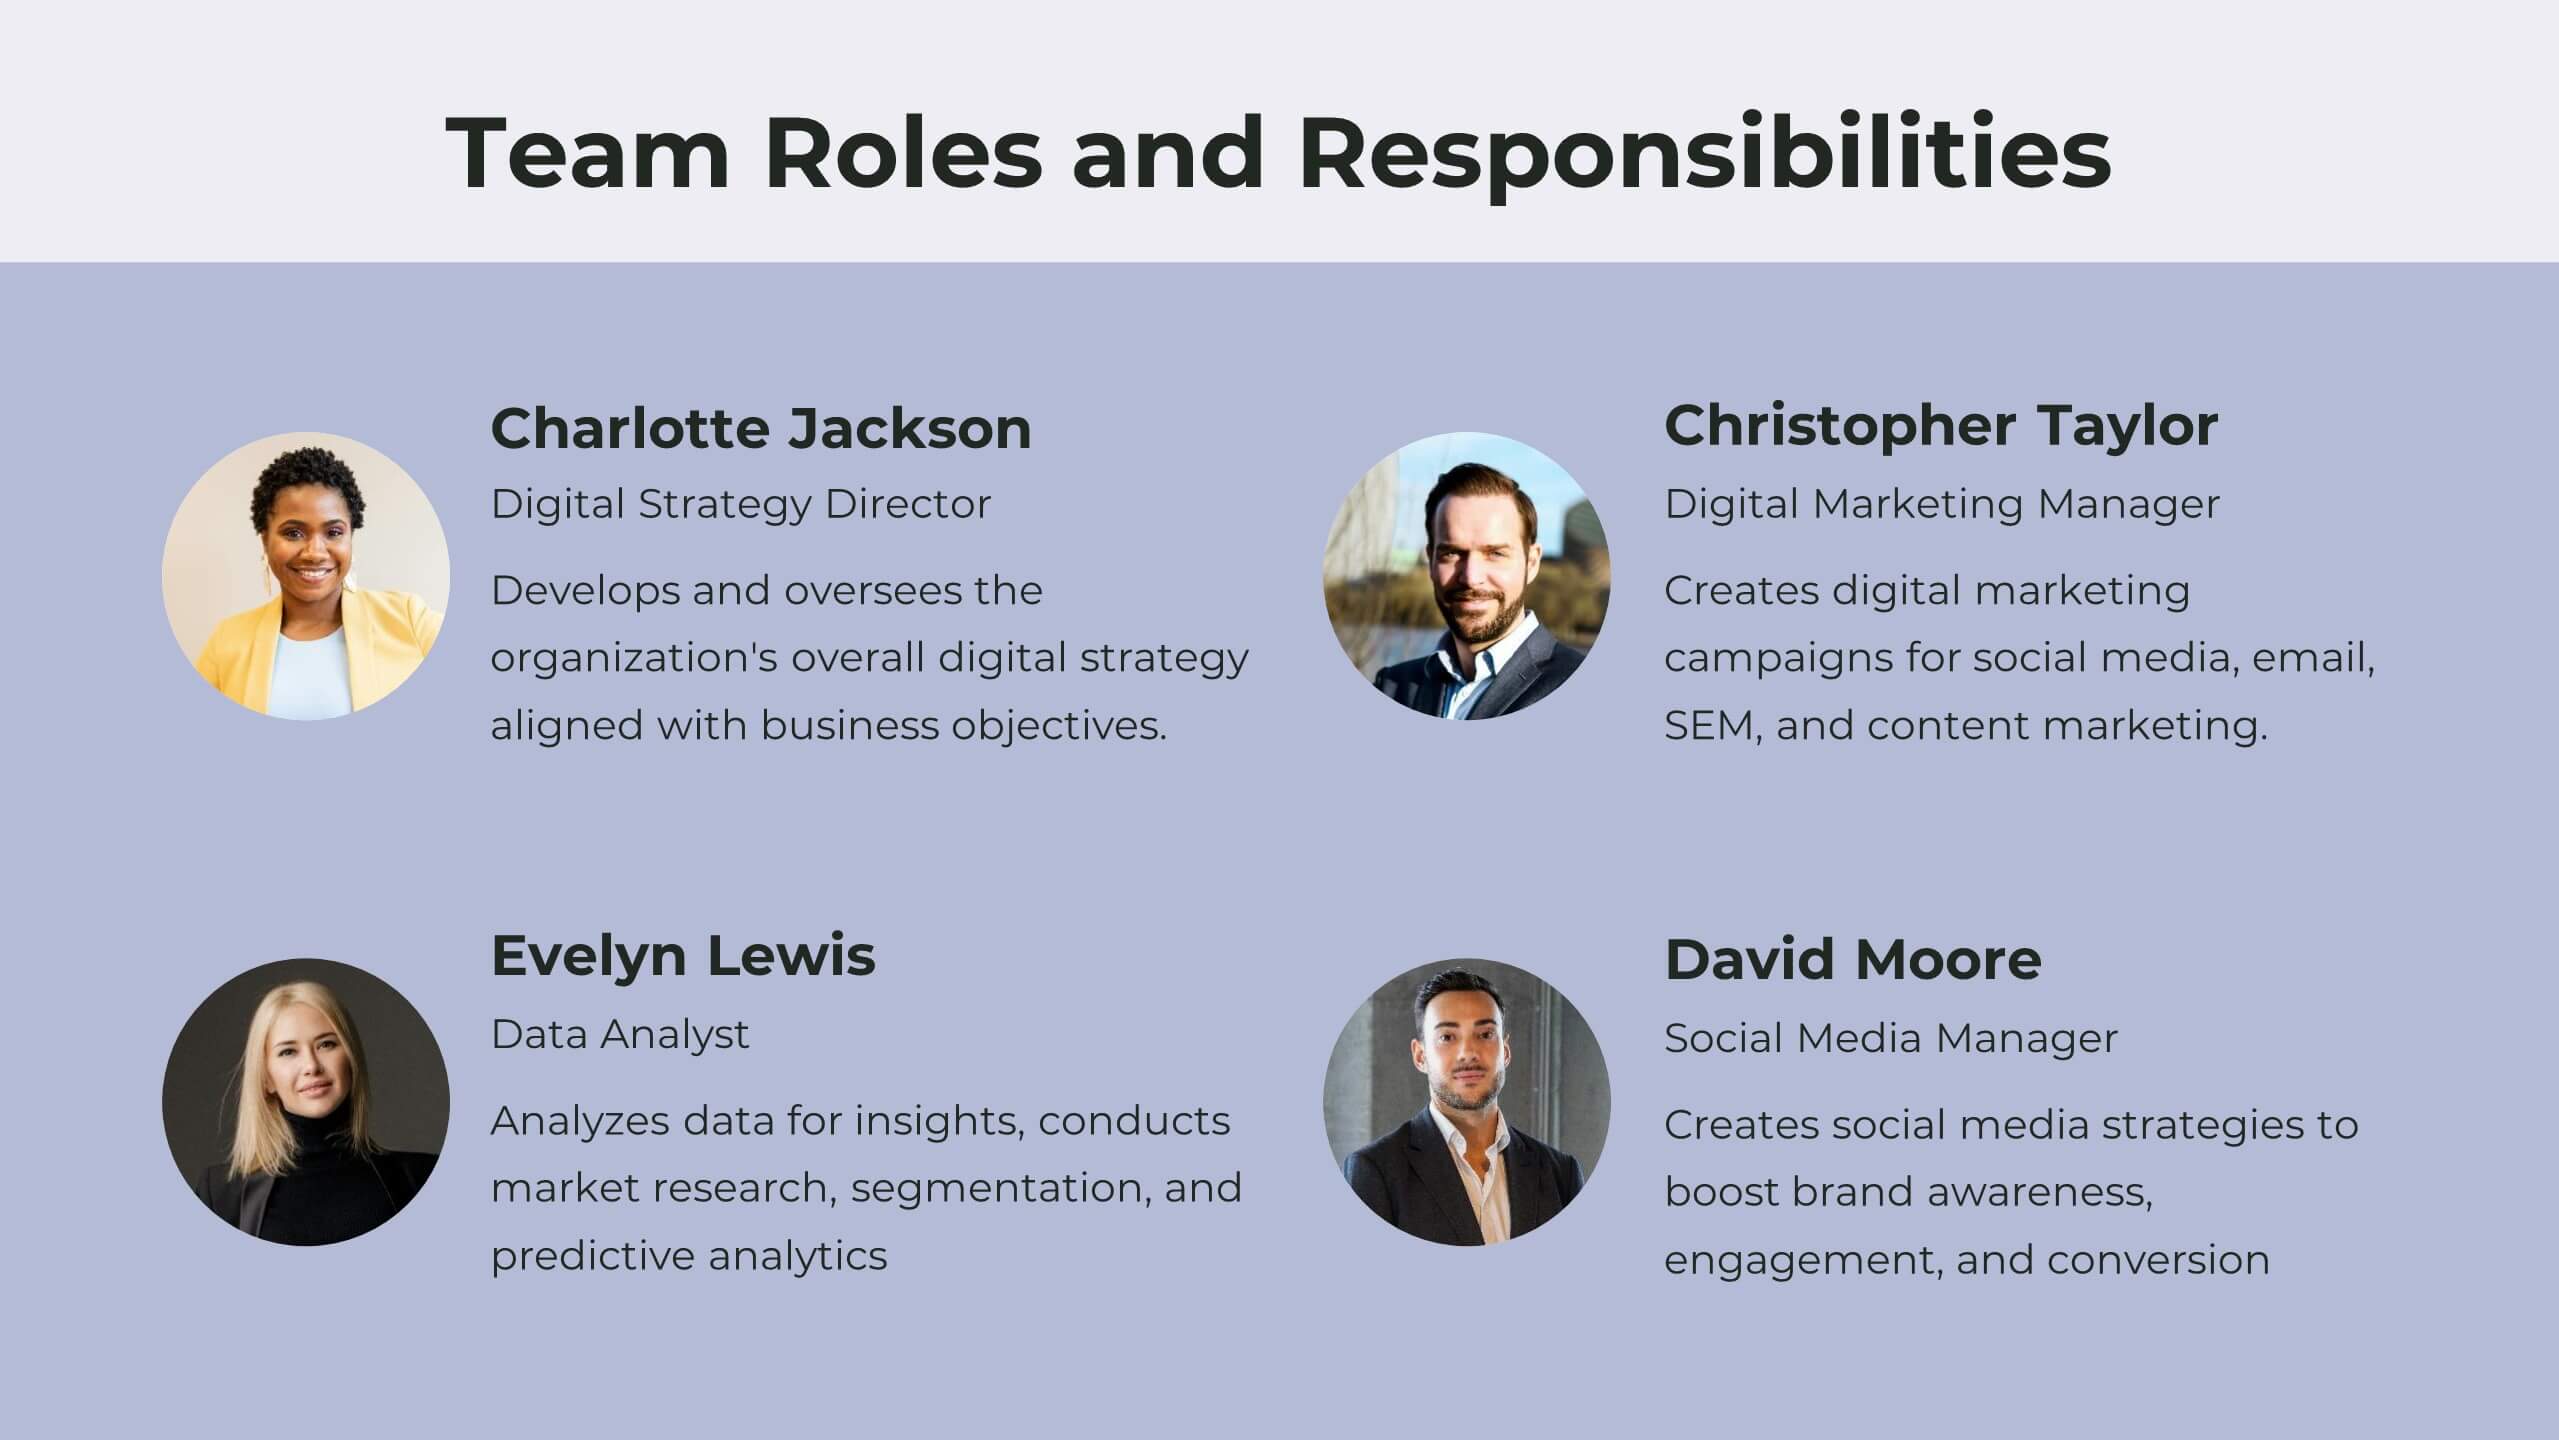
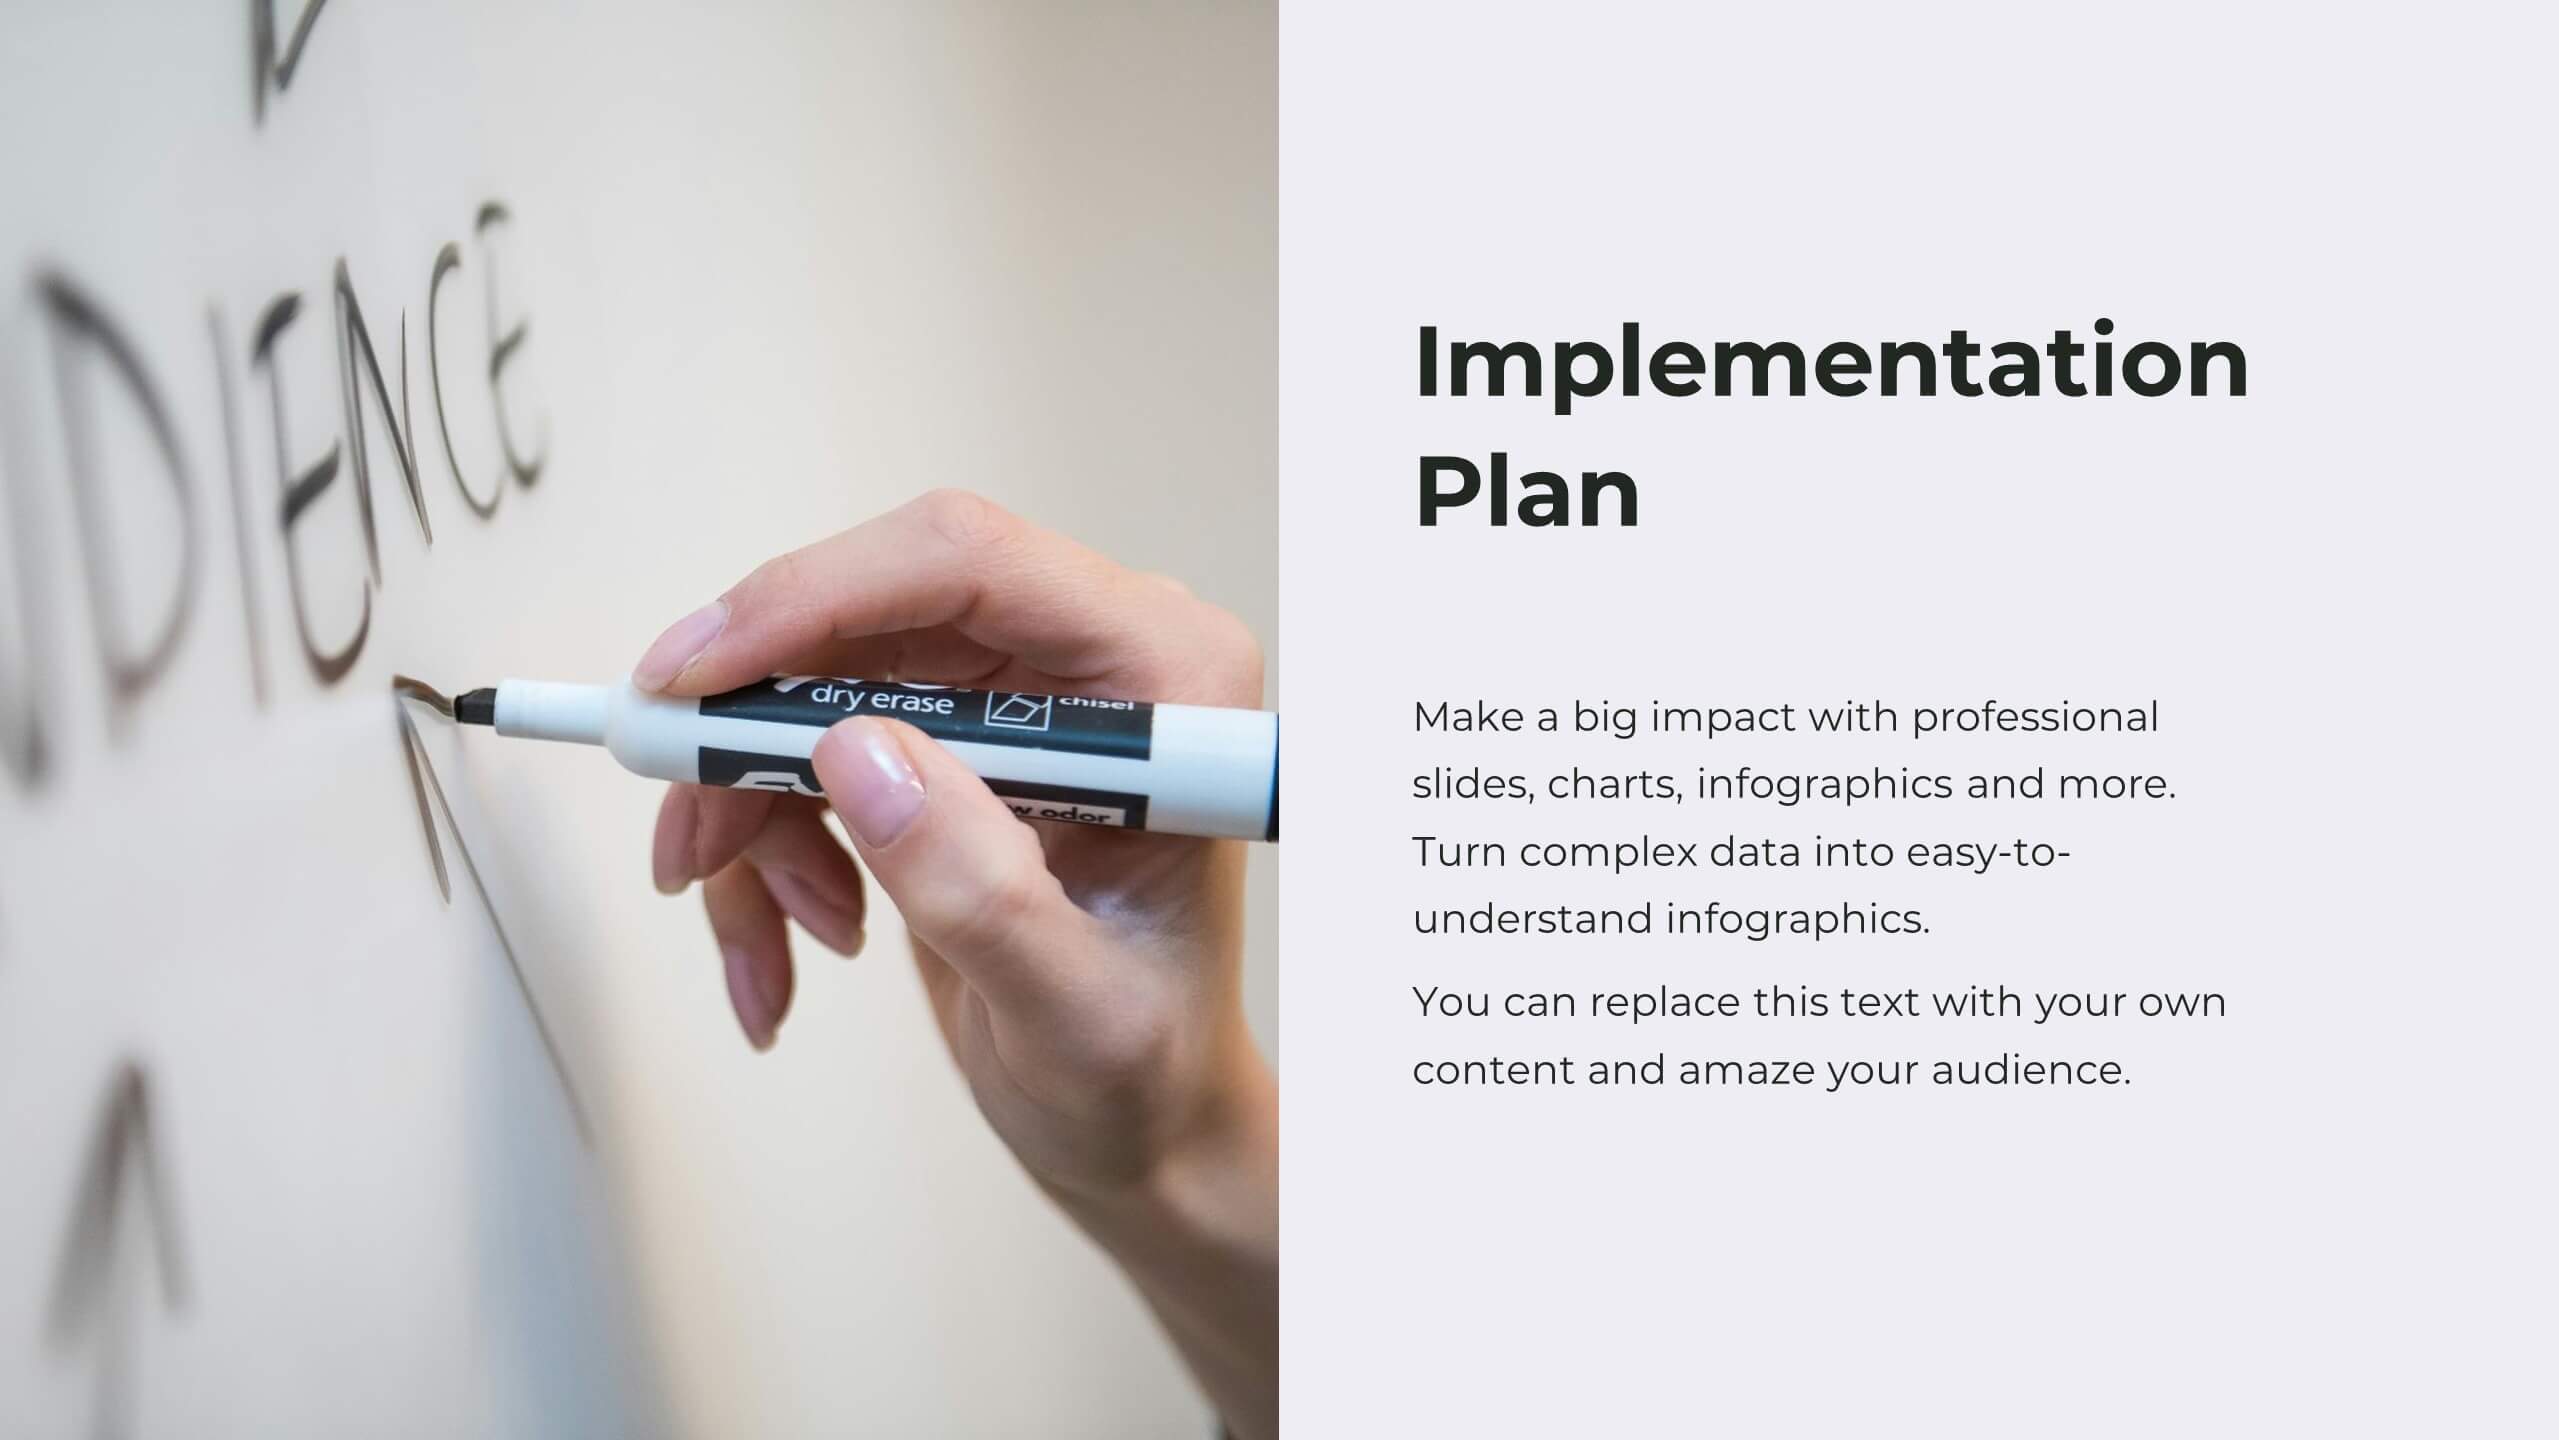
Marketing Team Infographic
This collection showcases a series of slides dedicated to optimizing marketing team operations and strategies. Each template is designed to cater to various facets of marketing planning and execution, featuring layouts that help articulate team roles, campaign timelines, budget allocations, and performance metrics. The slides incorporate diverse visual elements, such as hierarchical diagrams, flow charts, and graphs, to ensure complex information is accessible and engaging. Customizable color palettes and design elements allow for seamless integration into existing corporate branding, making these templates not only functional but also aesthetically aligned with company standards. Ideal for marketing strategy presentations, team meetings, and stakeholder briefings, these slides facilitate a comprehensive overview of marketing efforts, pinpointing achievements and areas for improvement. The adaptability of these templates makes them an essential tool for marketing professionals aiming to communicate effectively and drive results.


5 diapositivas
Team Role Distribution Matrix Presentation
Clarify responsibilities and improve collaboration with the Team Role Distribution Matrix Presentation. This RACI-style slide helps visualize team accountability across multiple tasks, making it ideal for project management, cross-functional teams, or workflow planning. Each layout option includes clearly labeled roles and color-coded responsibilities: Responsible, Accountable, Consulted, and Informed. Fully editable in Canva, PowerPoint, Keynote, and Google Slides.


8 diapositivas
Machine Learning Overview Presentation
The "Machine Learning Overview" presentation template features a central circular design that effectively illustrates the interconnectedness of various components in machine learning processes. Each segment of the circle is dedicated to a key area such as data acquisition, algorithm development, model training, validation, and deployment, which are critical to understanding and executing machine learning projects. This visual arrangement makes it easy to follow and is ideal for educational environments or professional settings where clarity and concise information delivery are essential.


6 diapositivas
Business Funding Pitch Deck Presentation
Secure funding with confidence using this Business Funding Pitch Deck template. Designed to communicate your business model, growth potential, and financial strategy, it helps you make a strong case to investors. Engage your audience with a clear, structured layout. Fully compatible with PowerPoint, Keynote, and Google Slides for effortless customization.

23 diapositivas
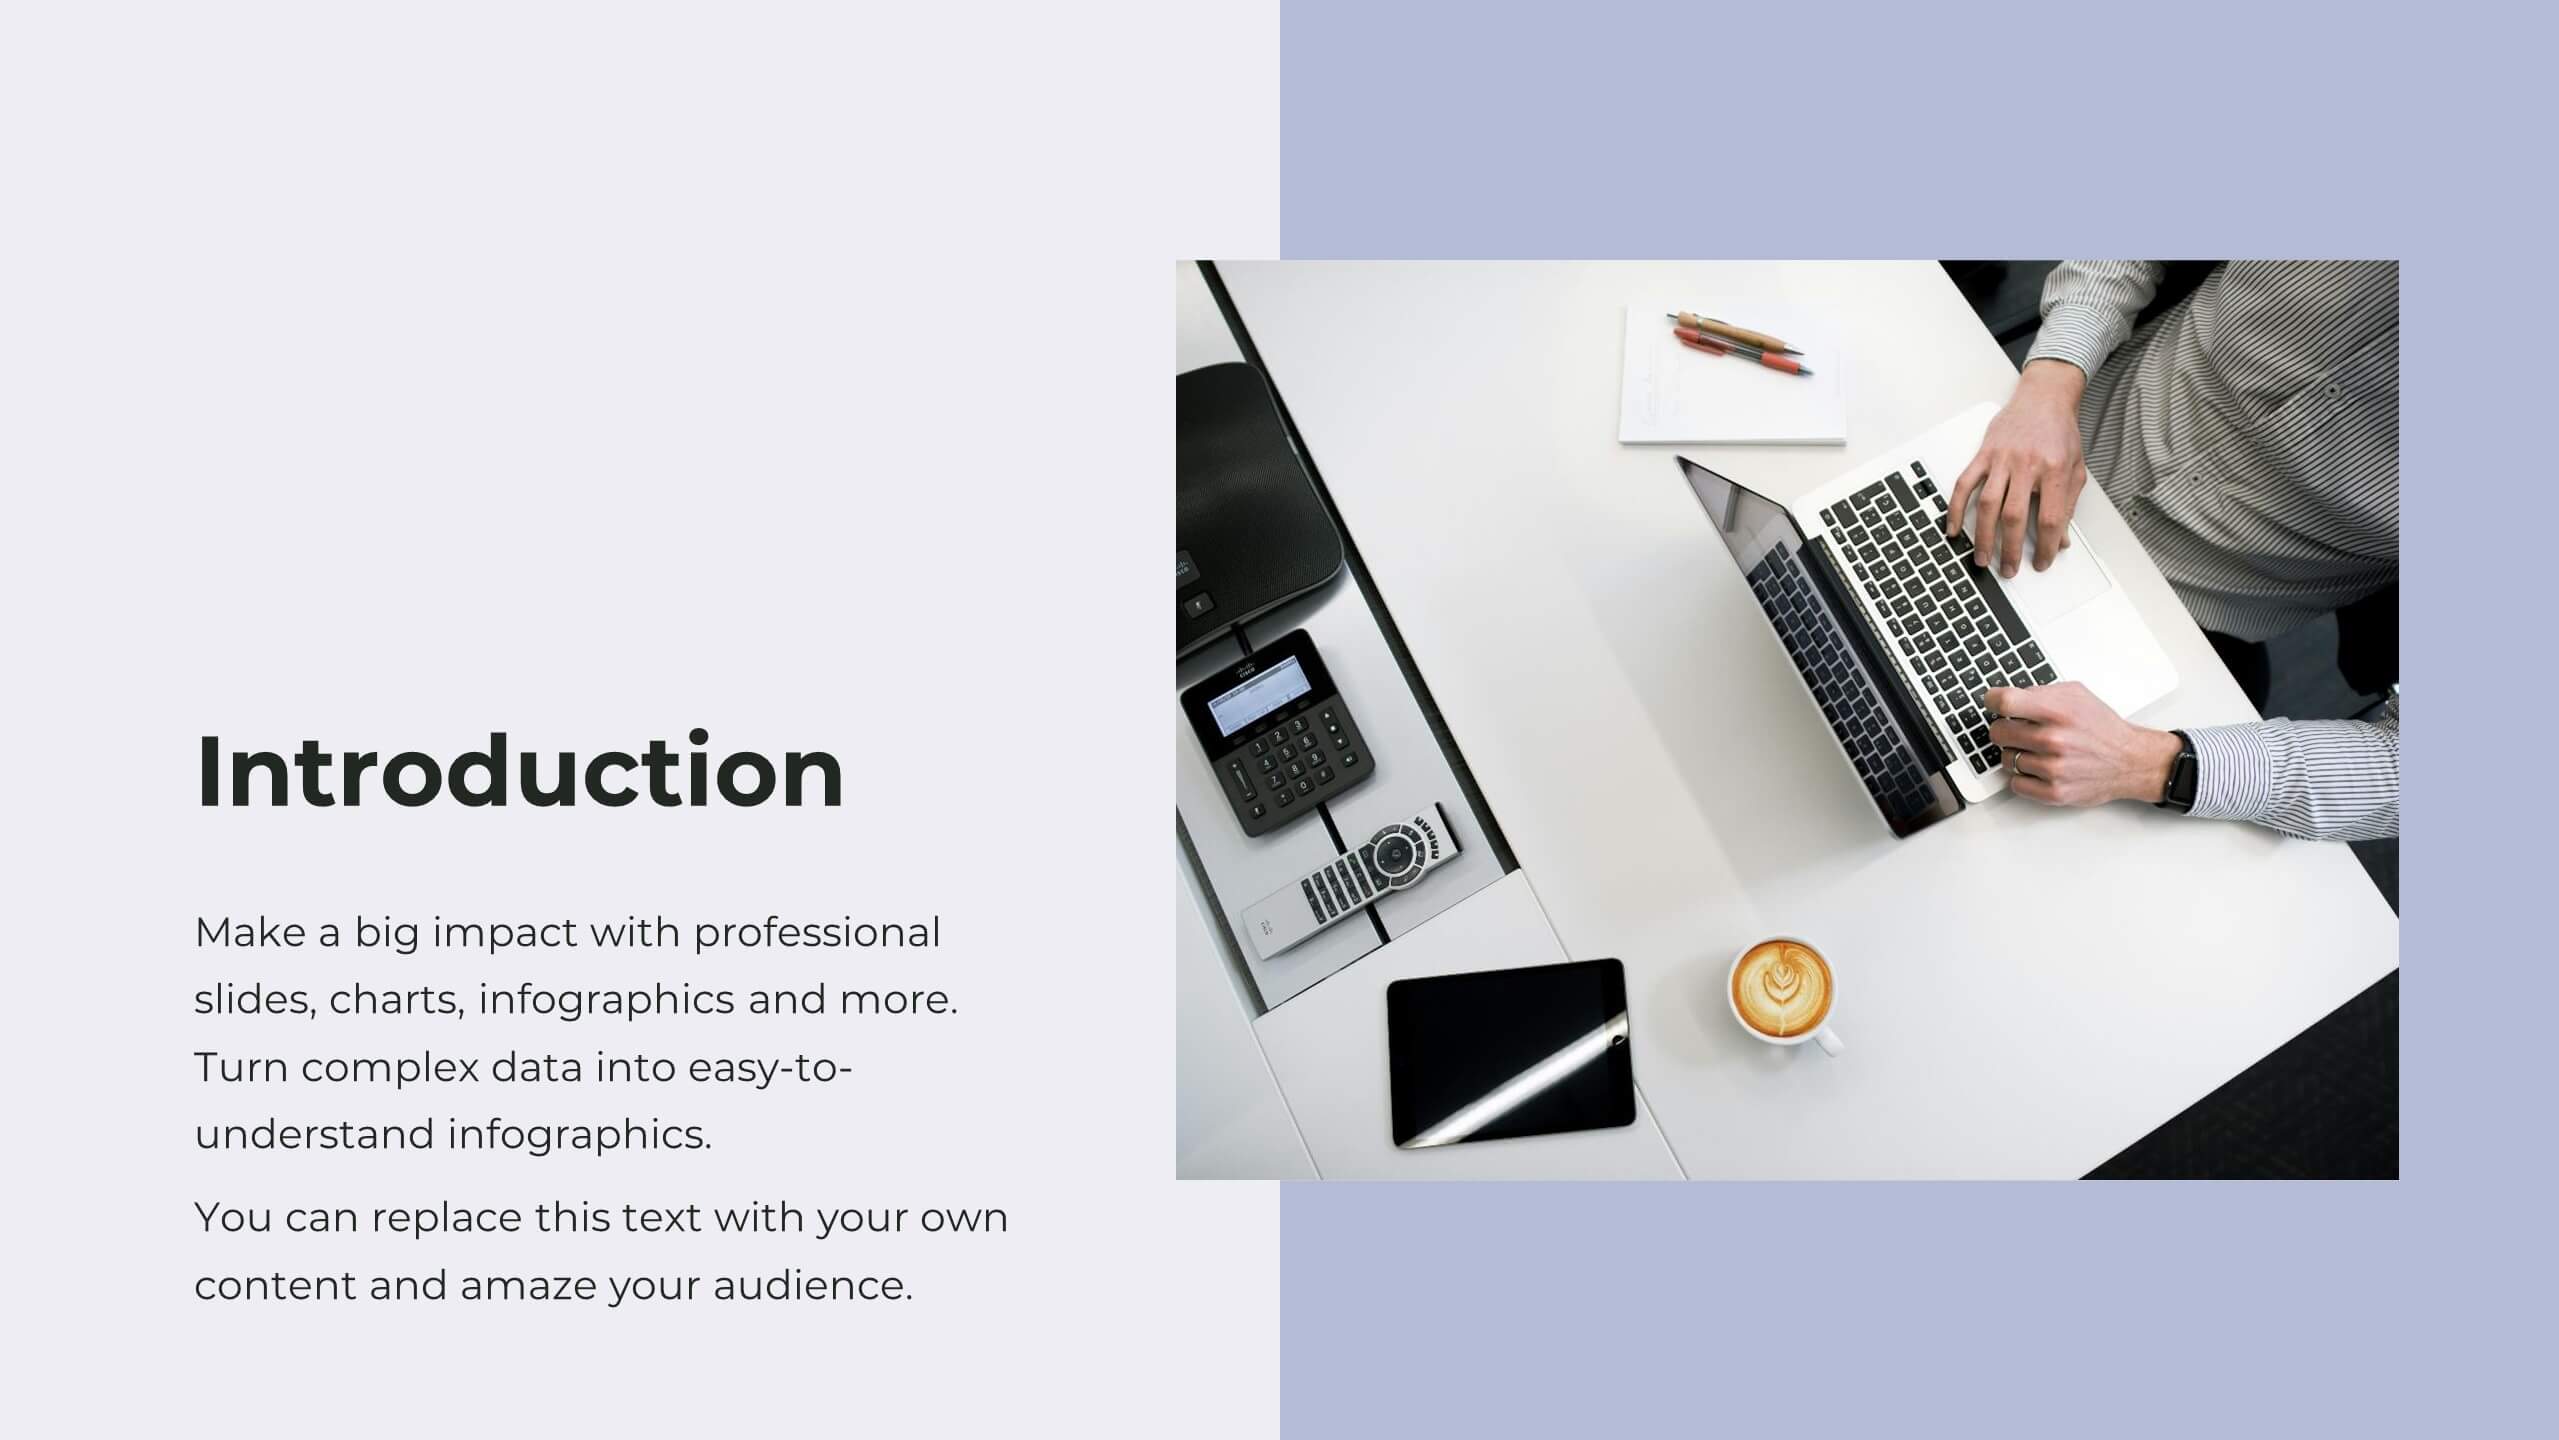
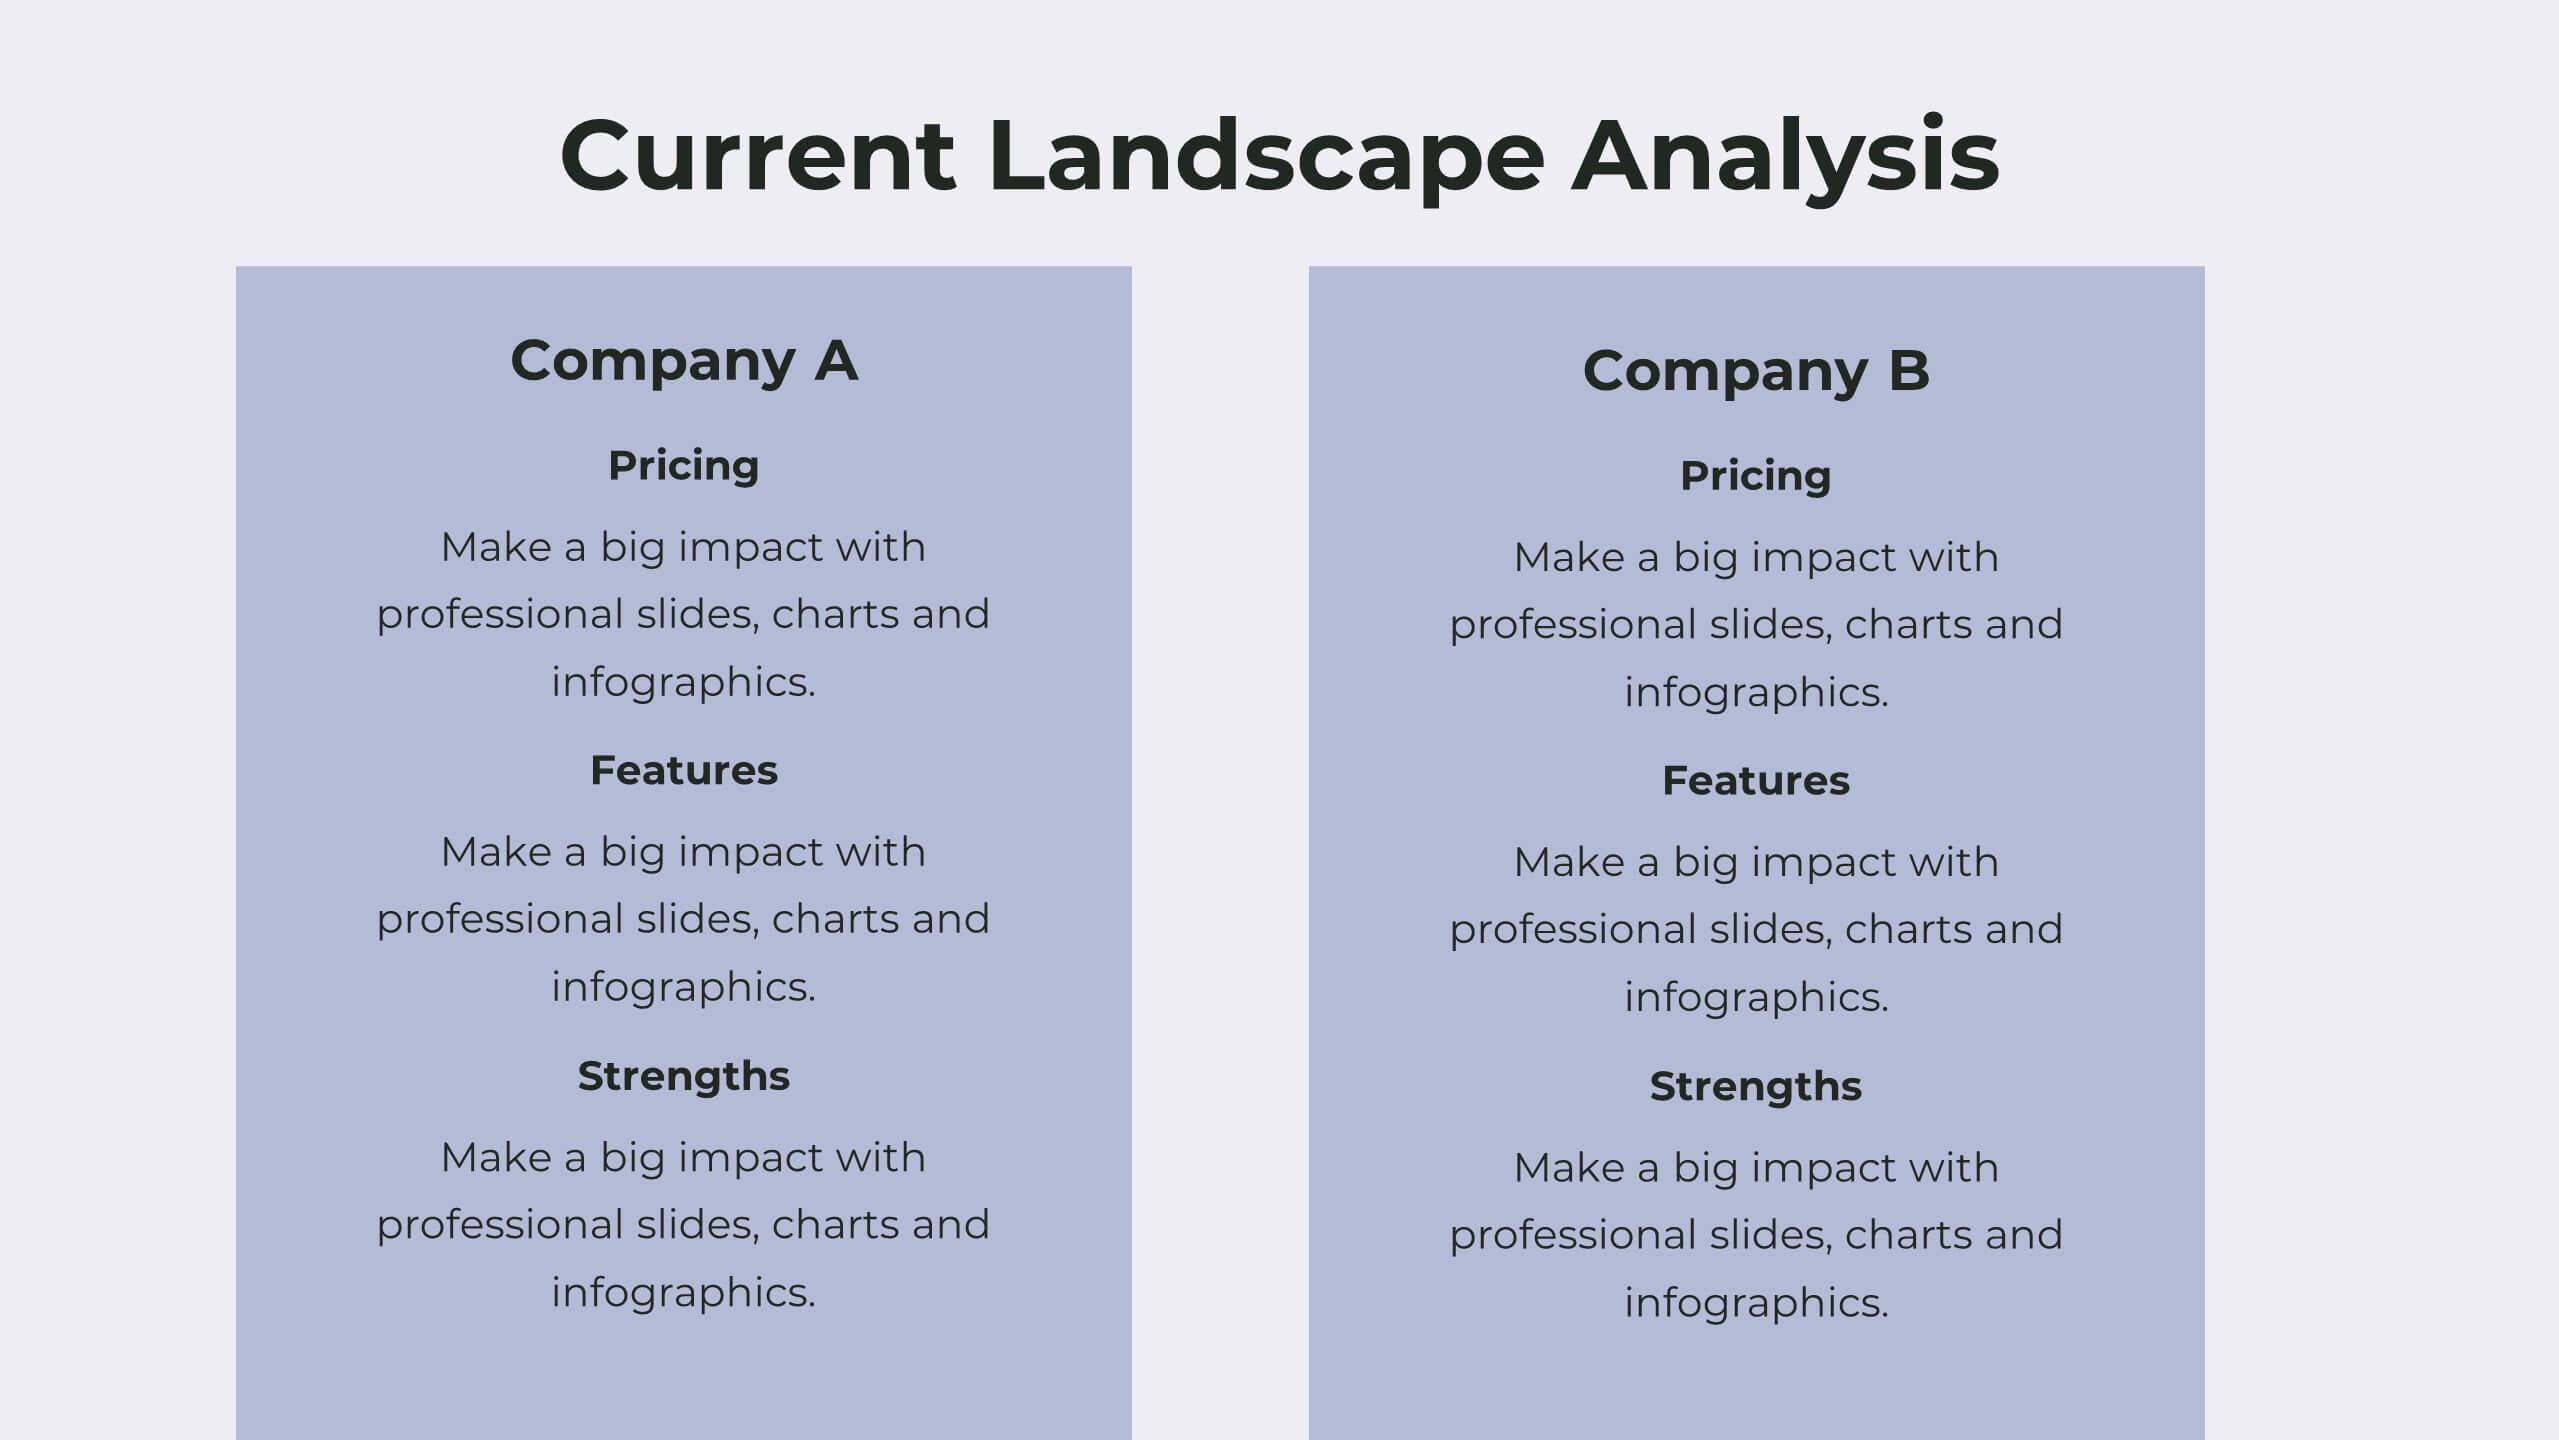
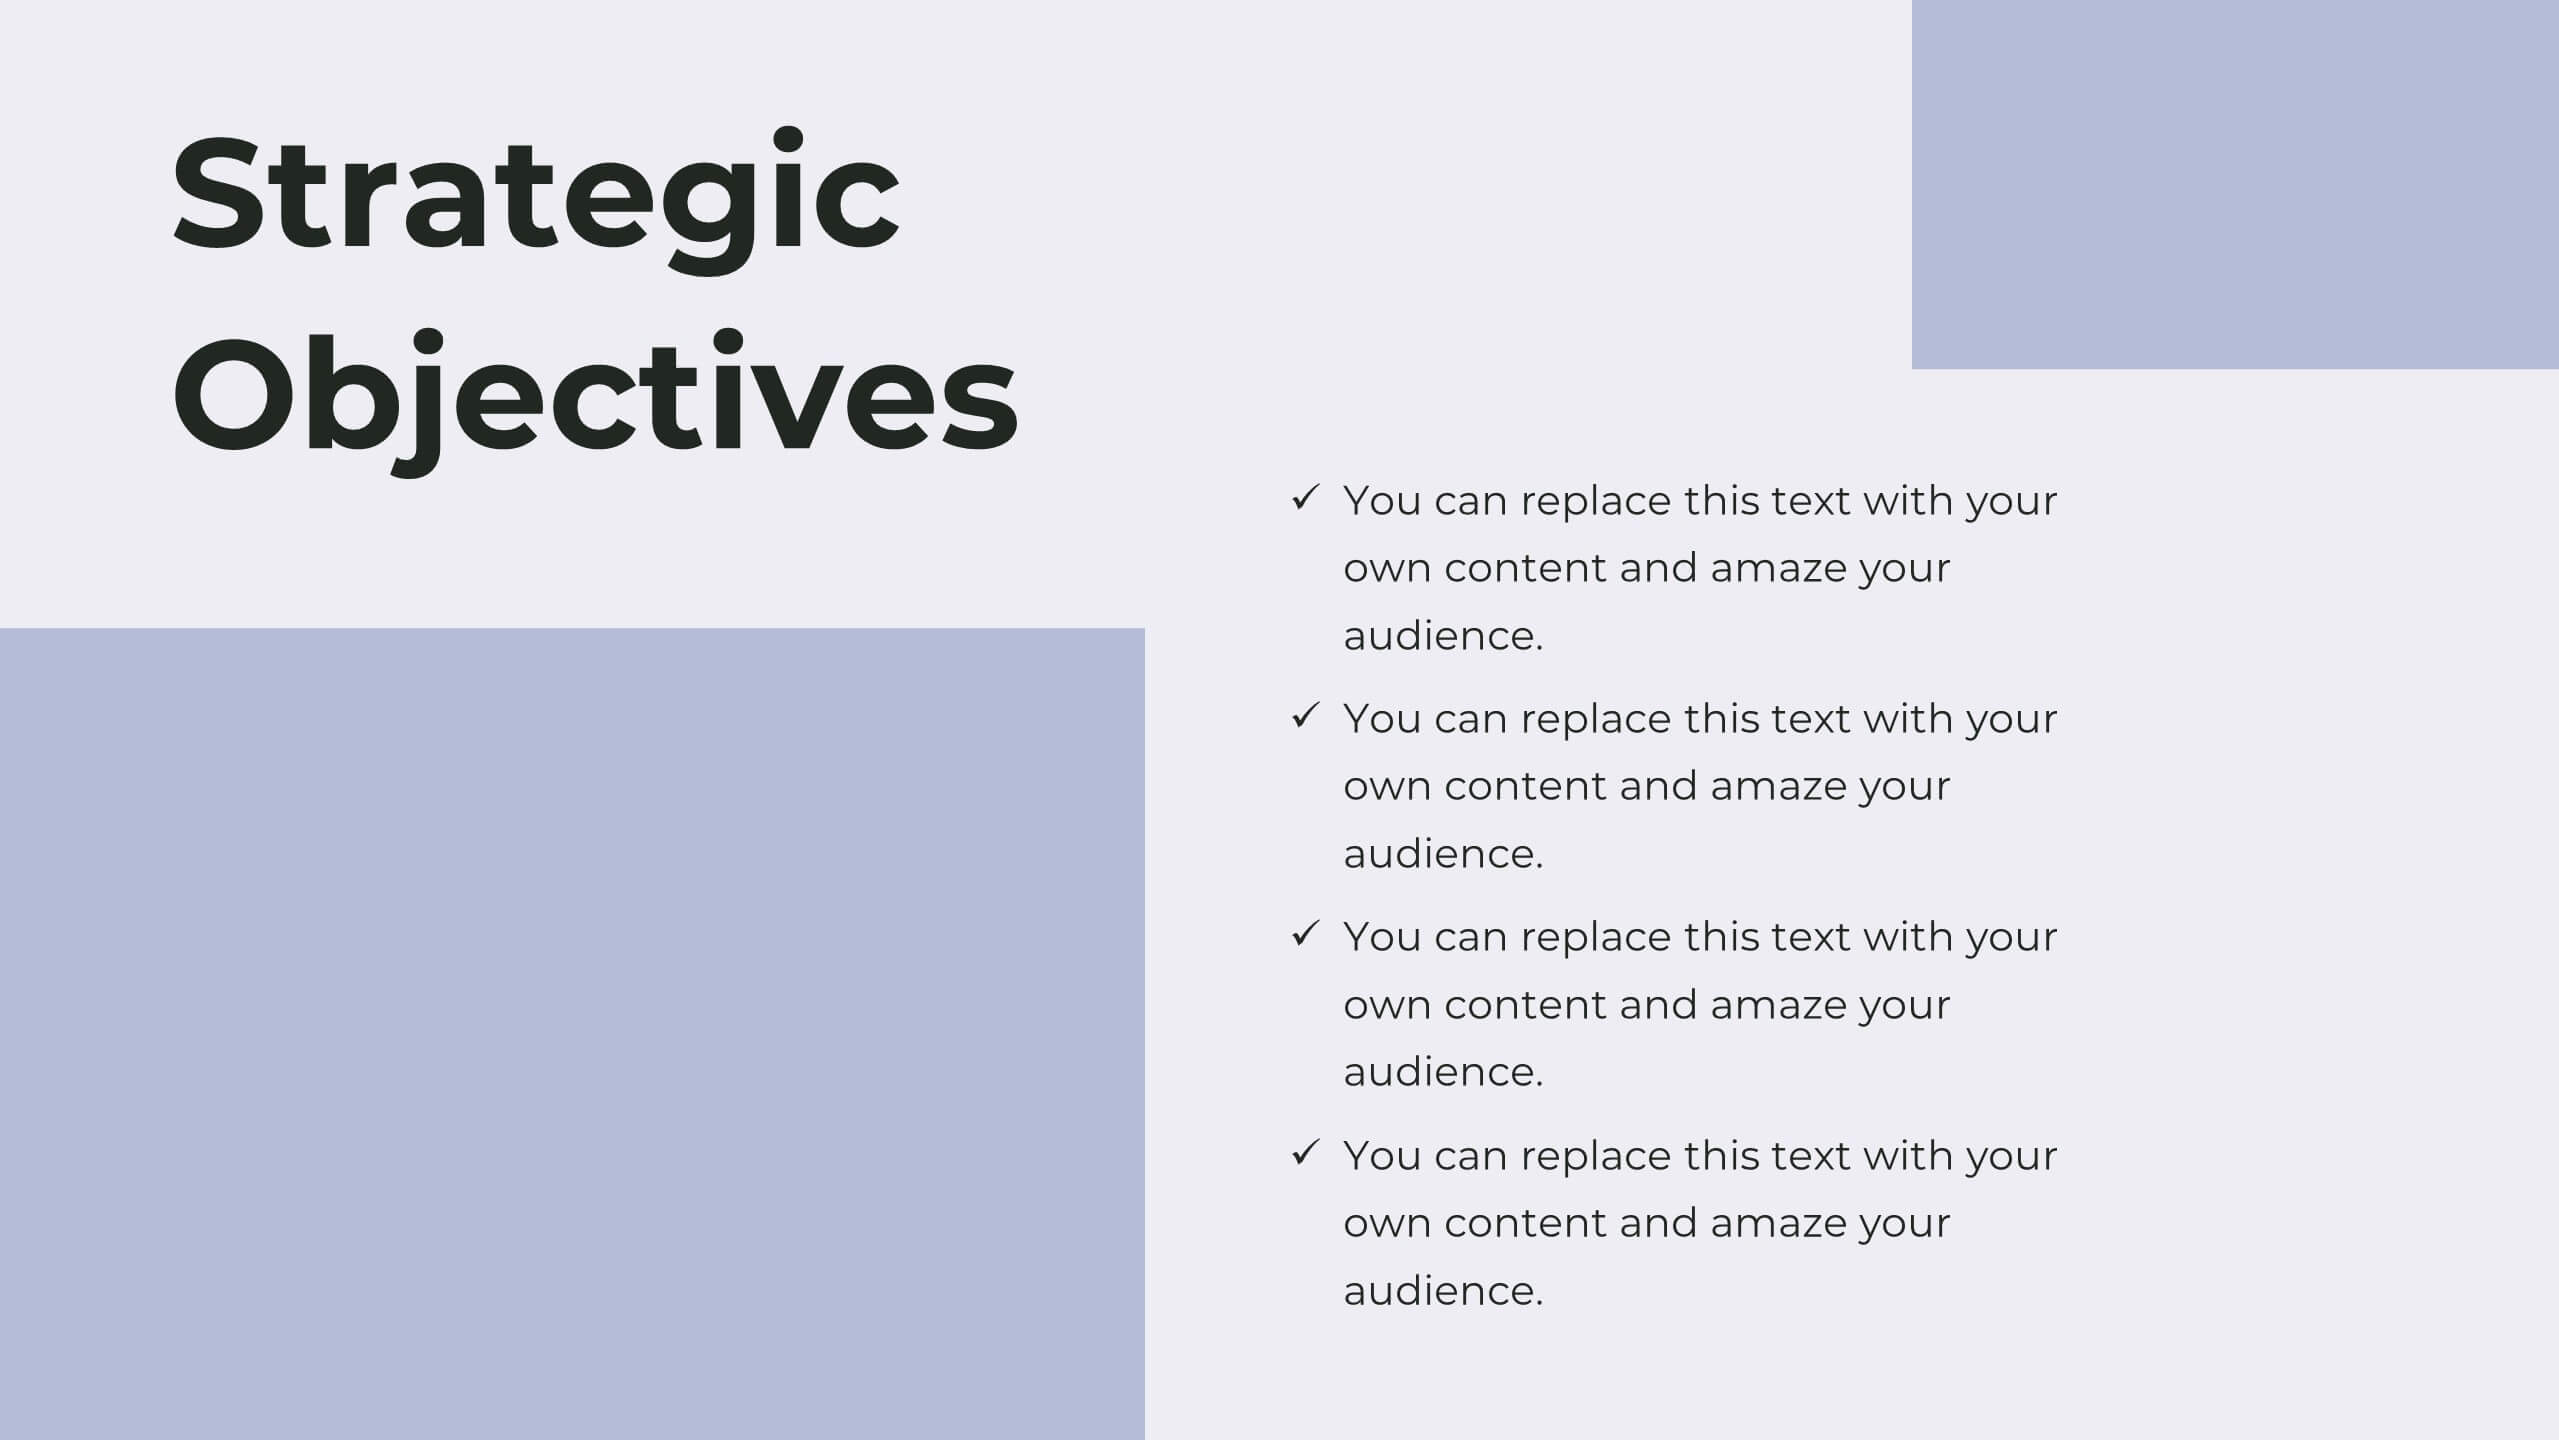
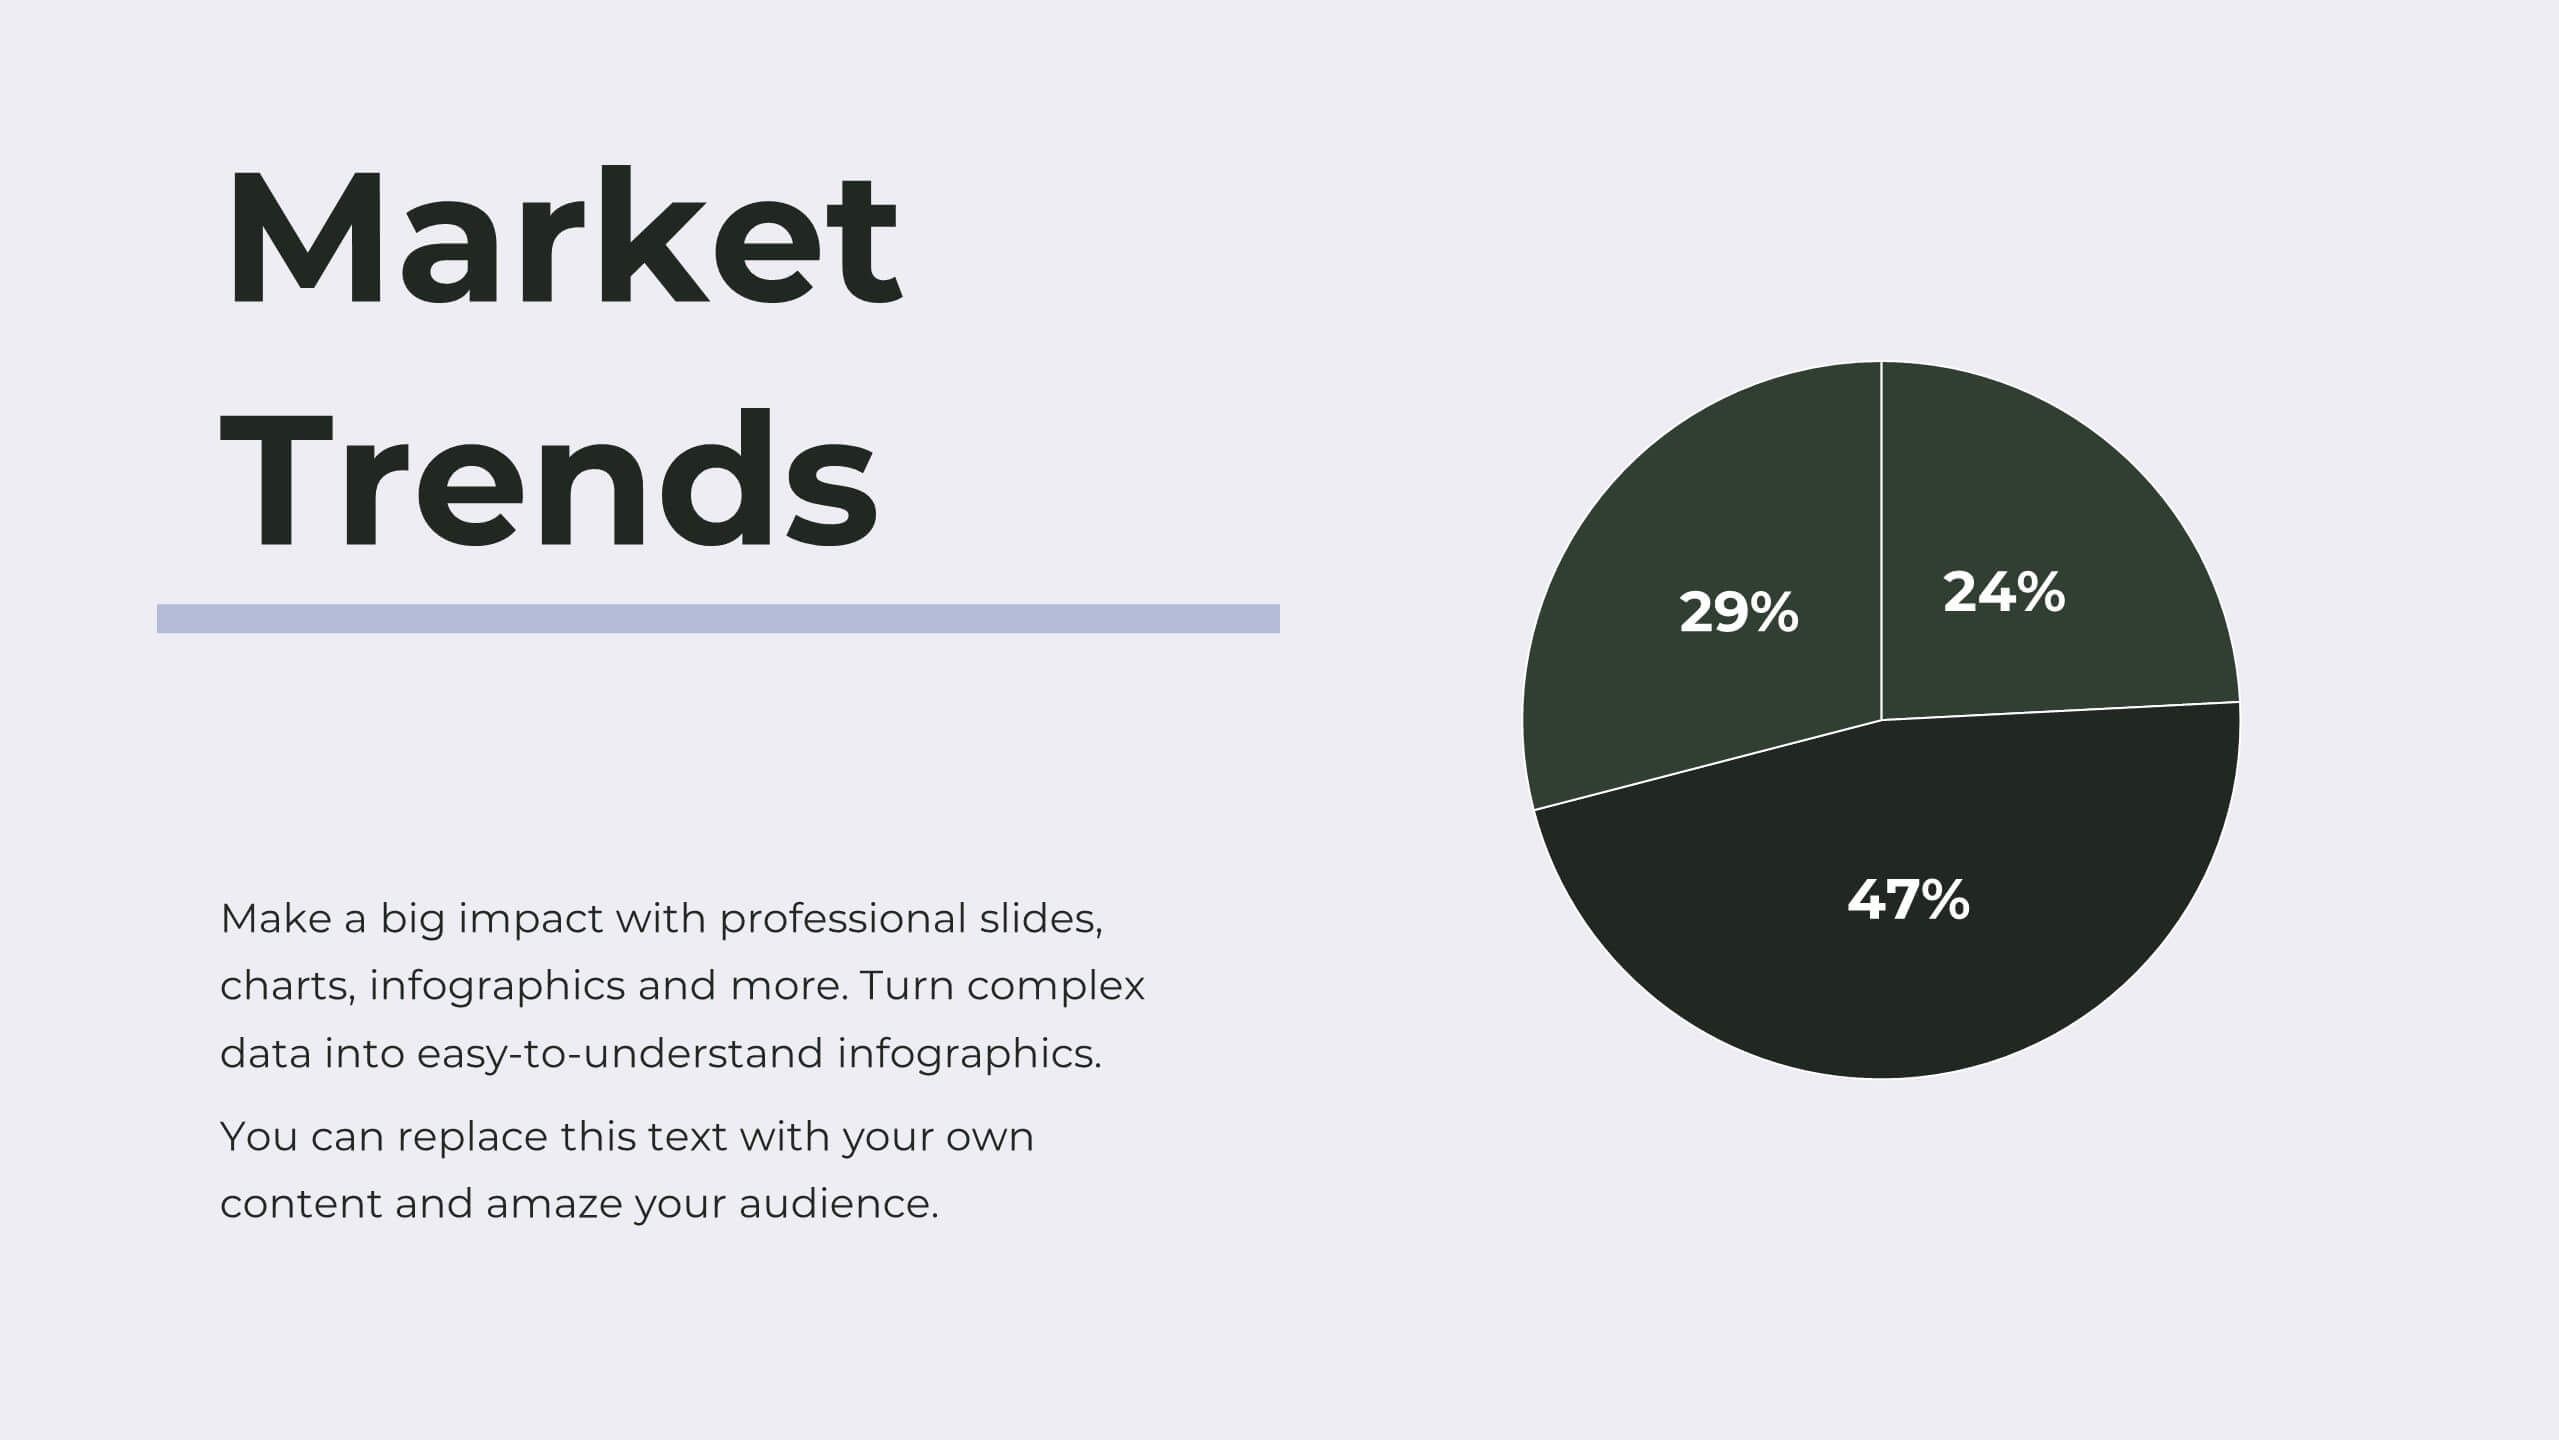
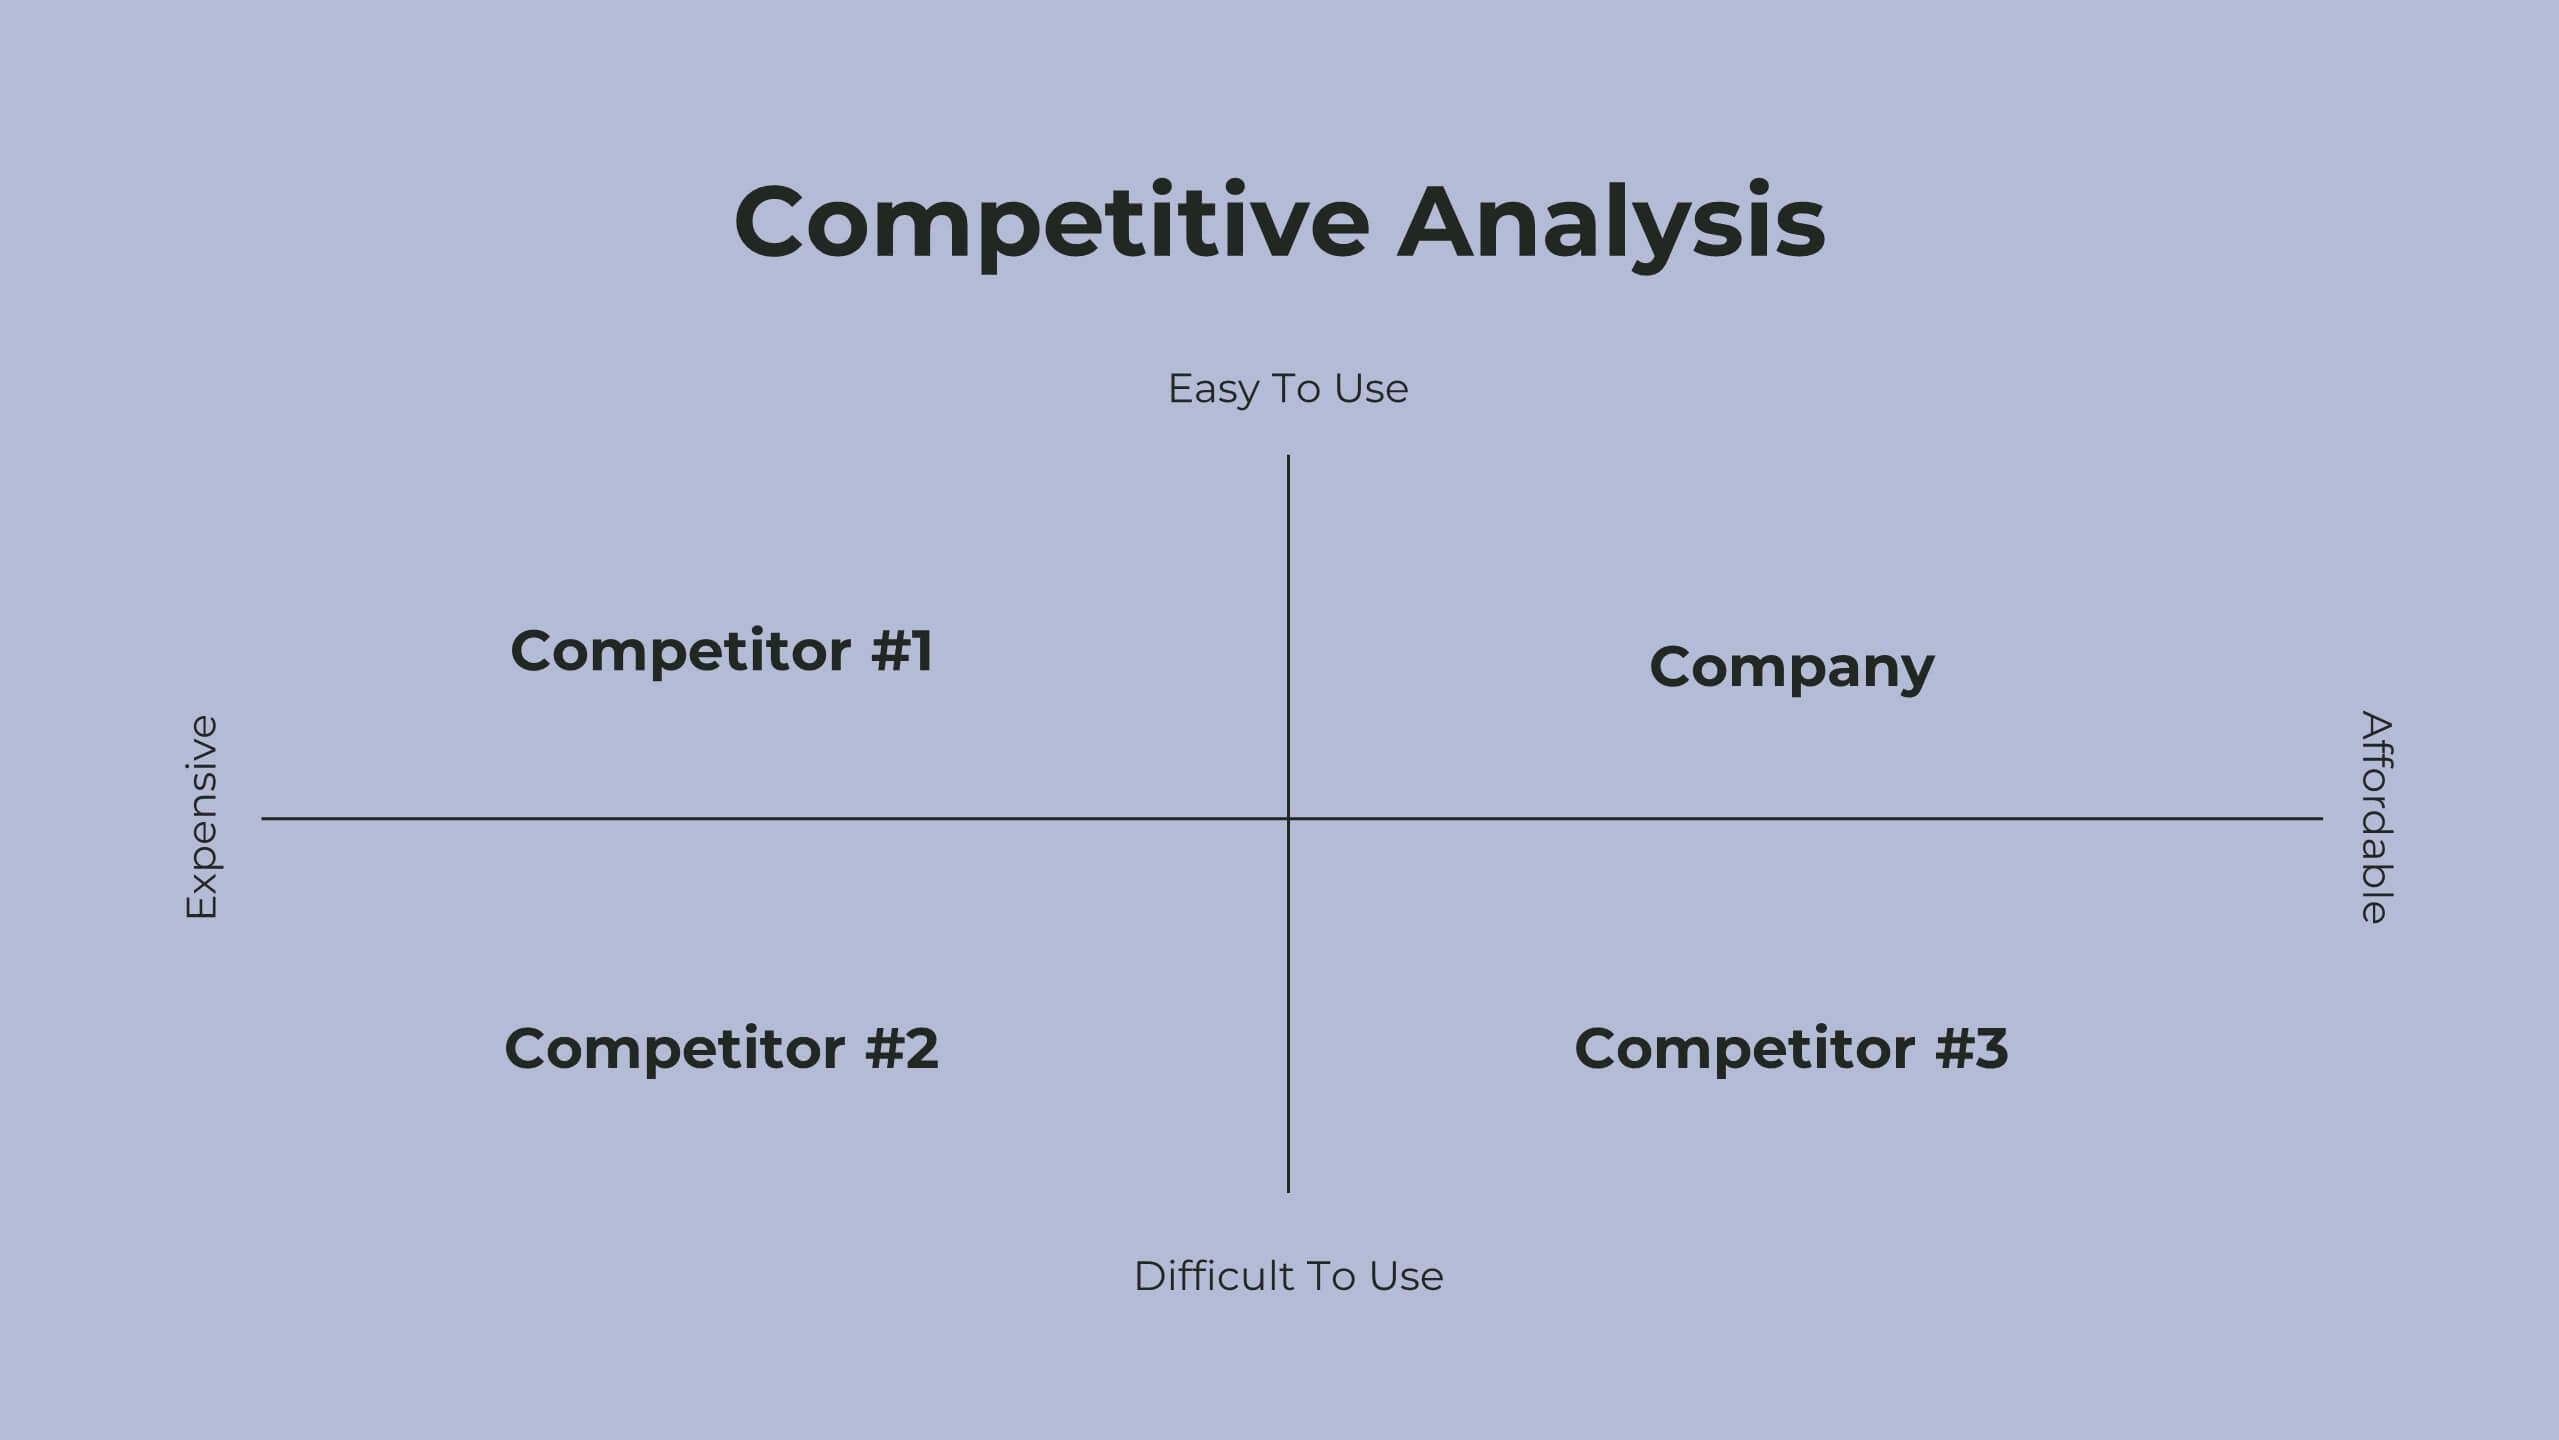
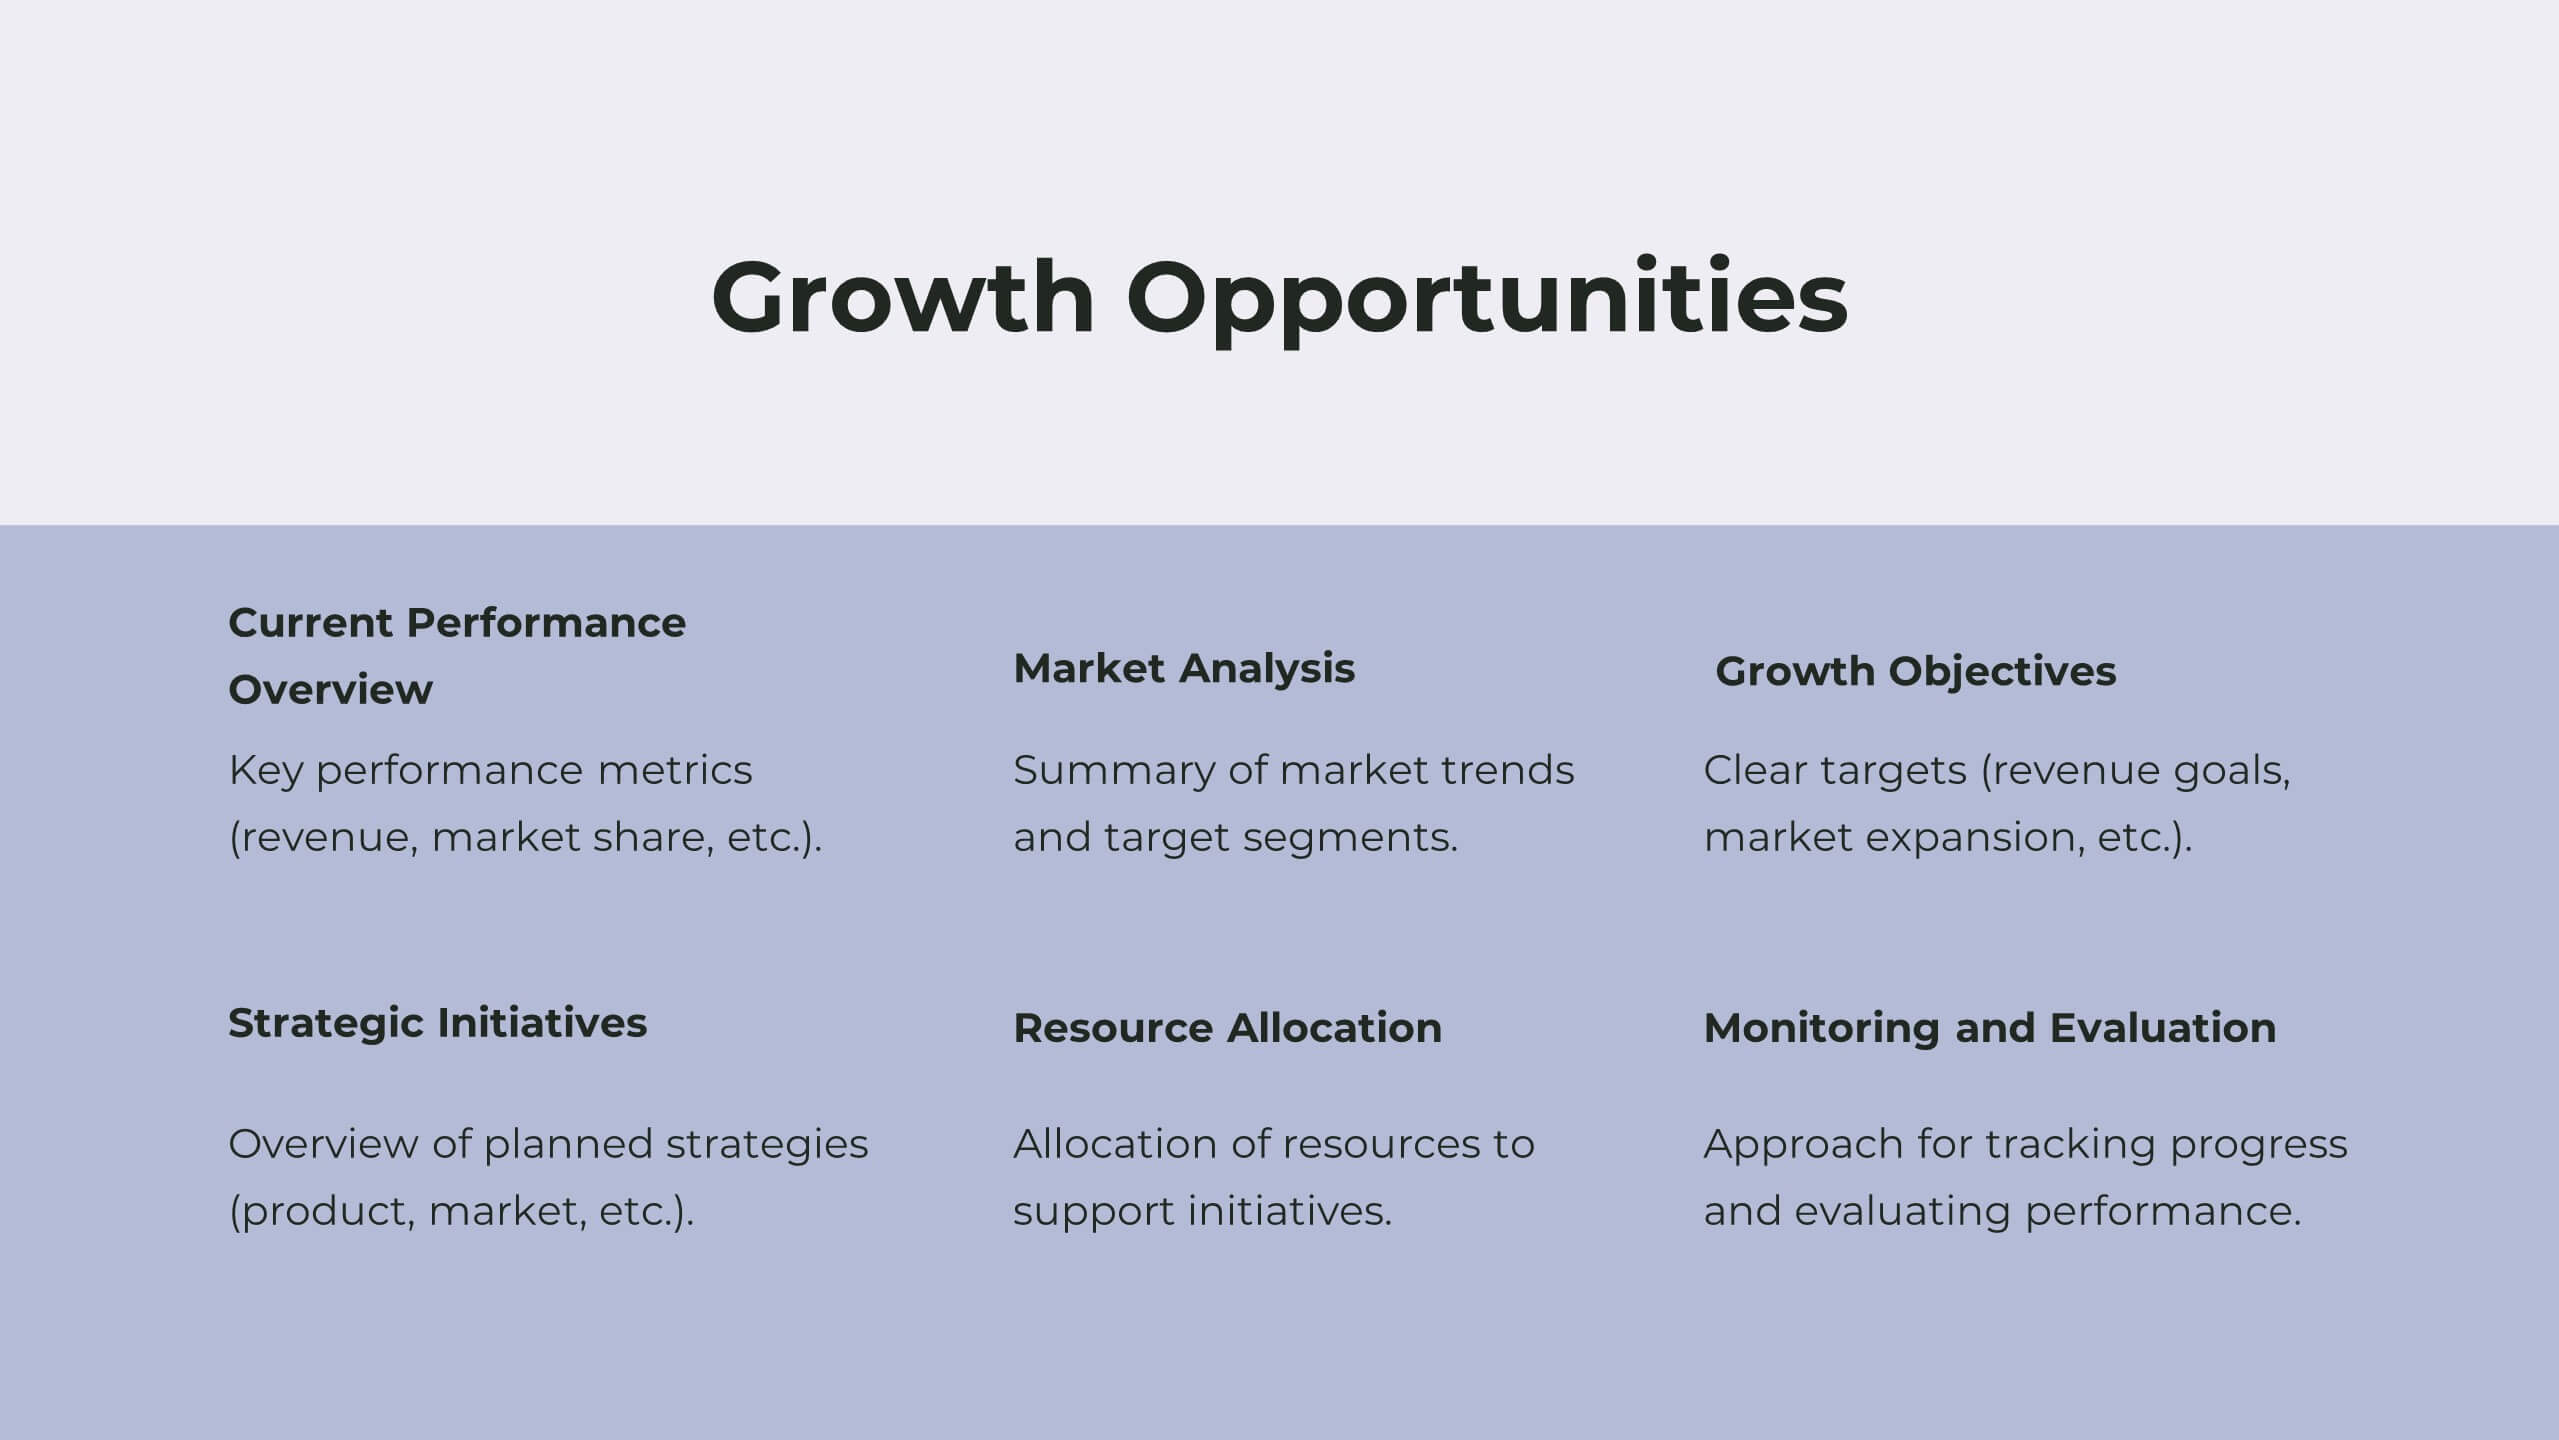
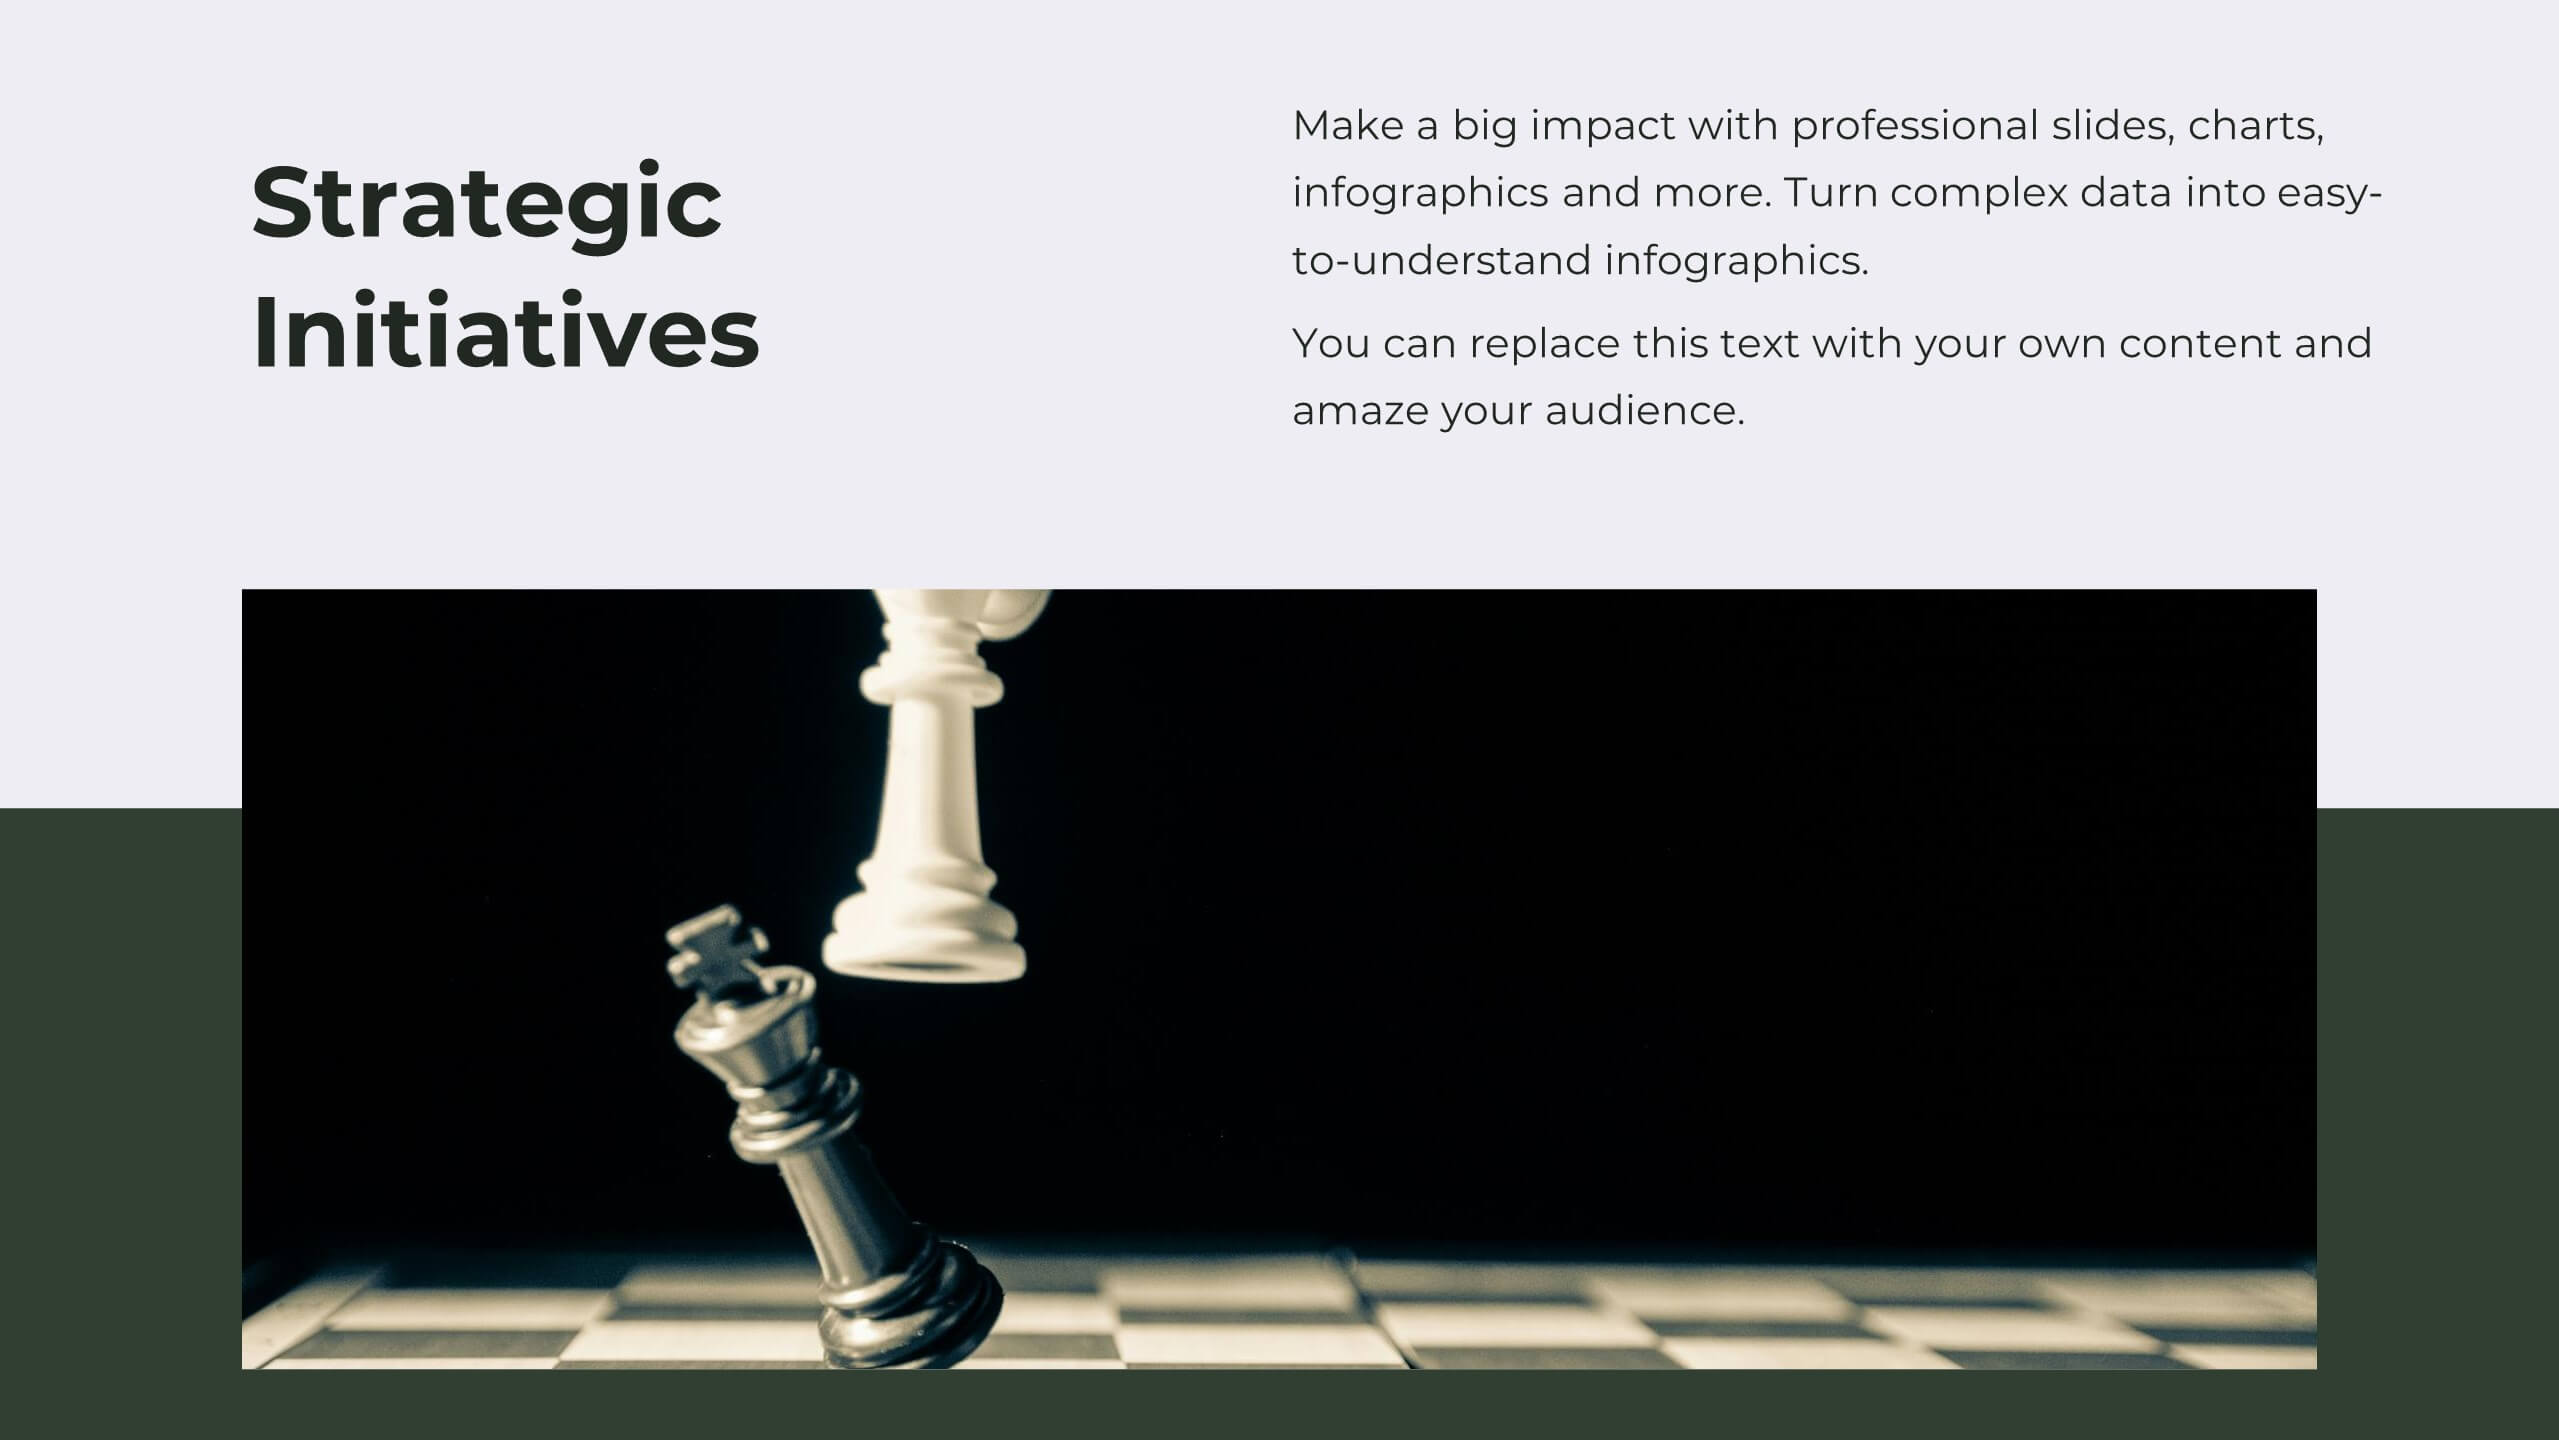
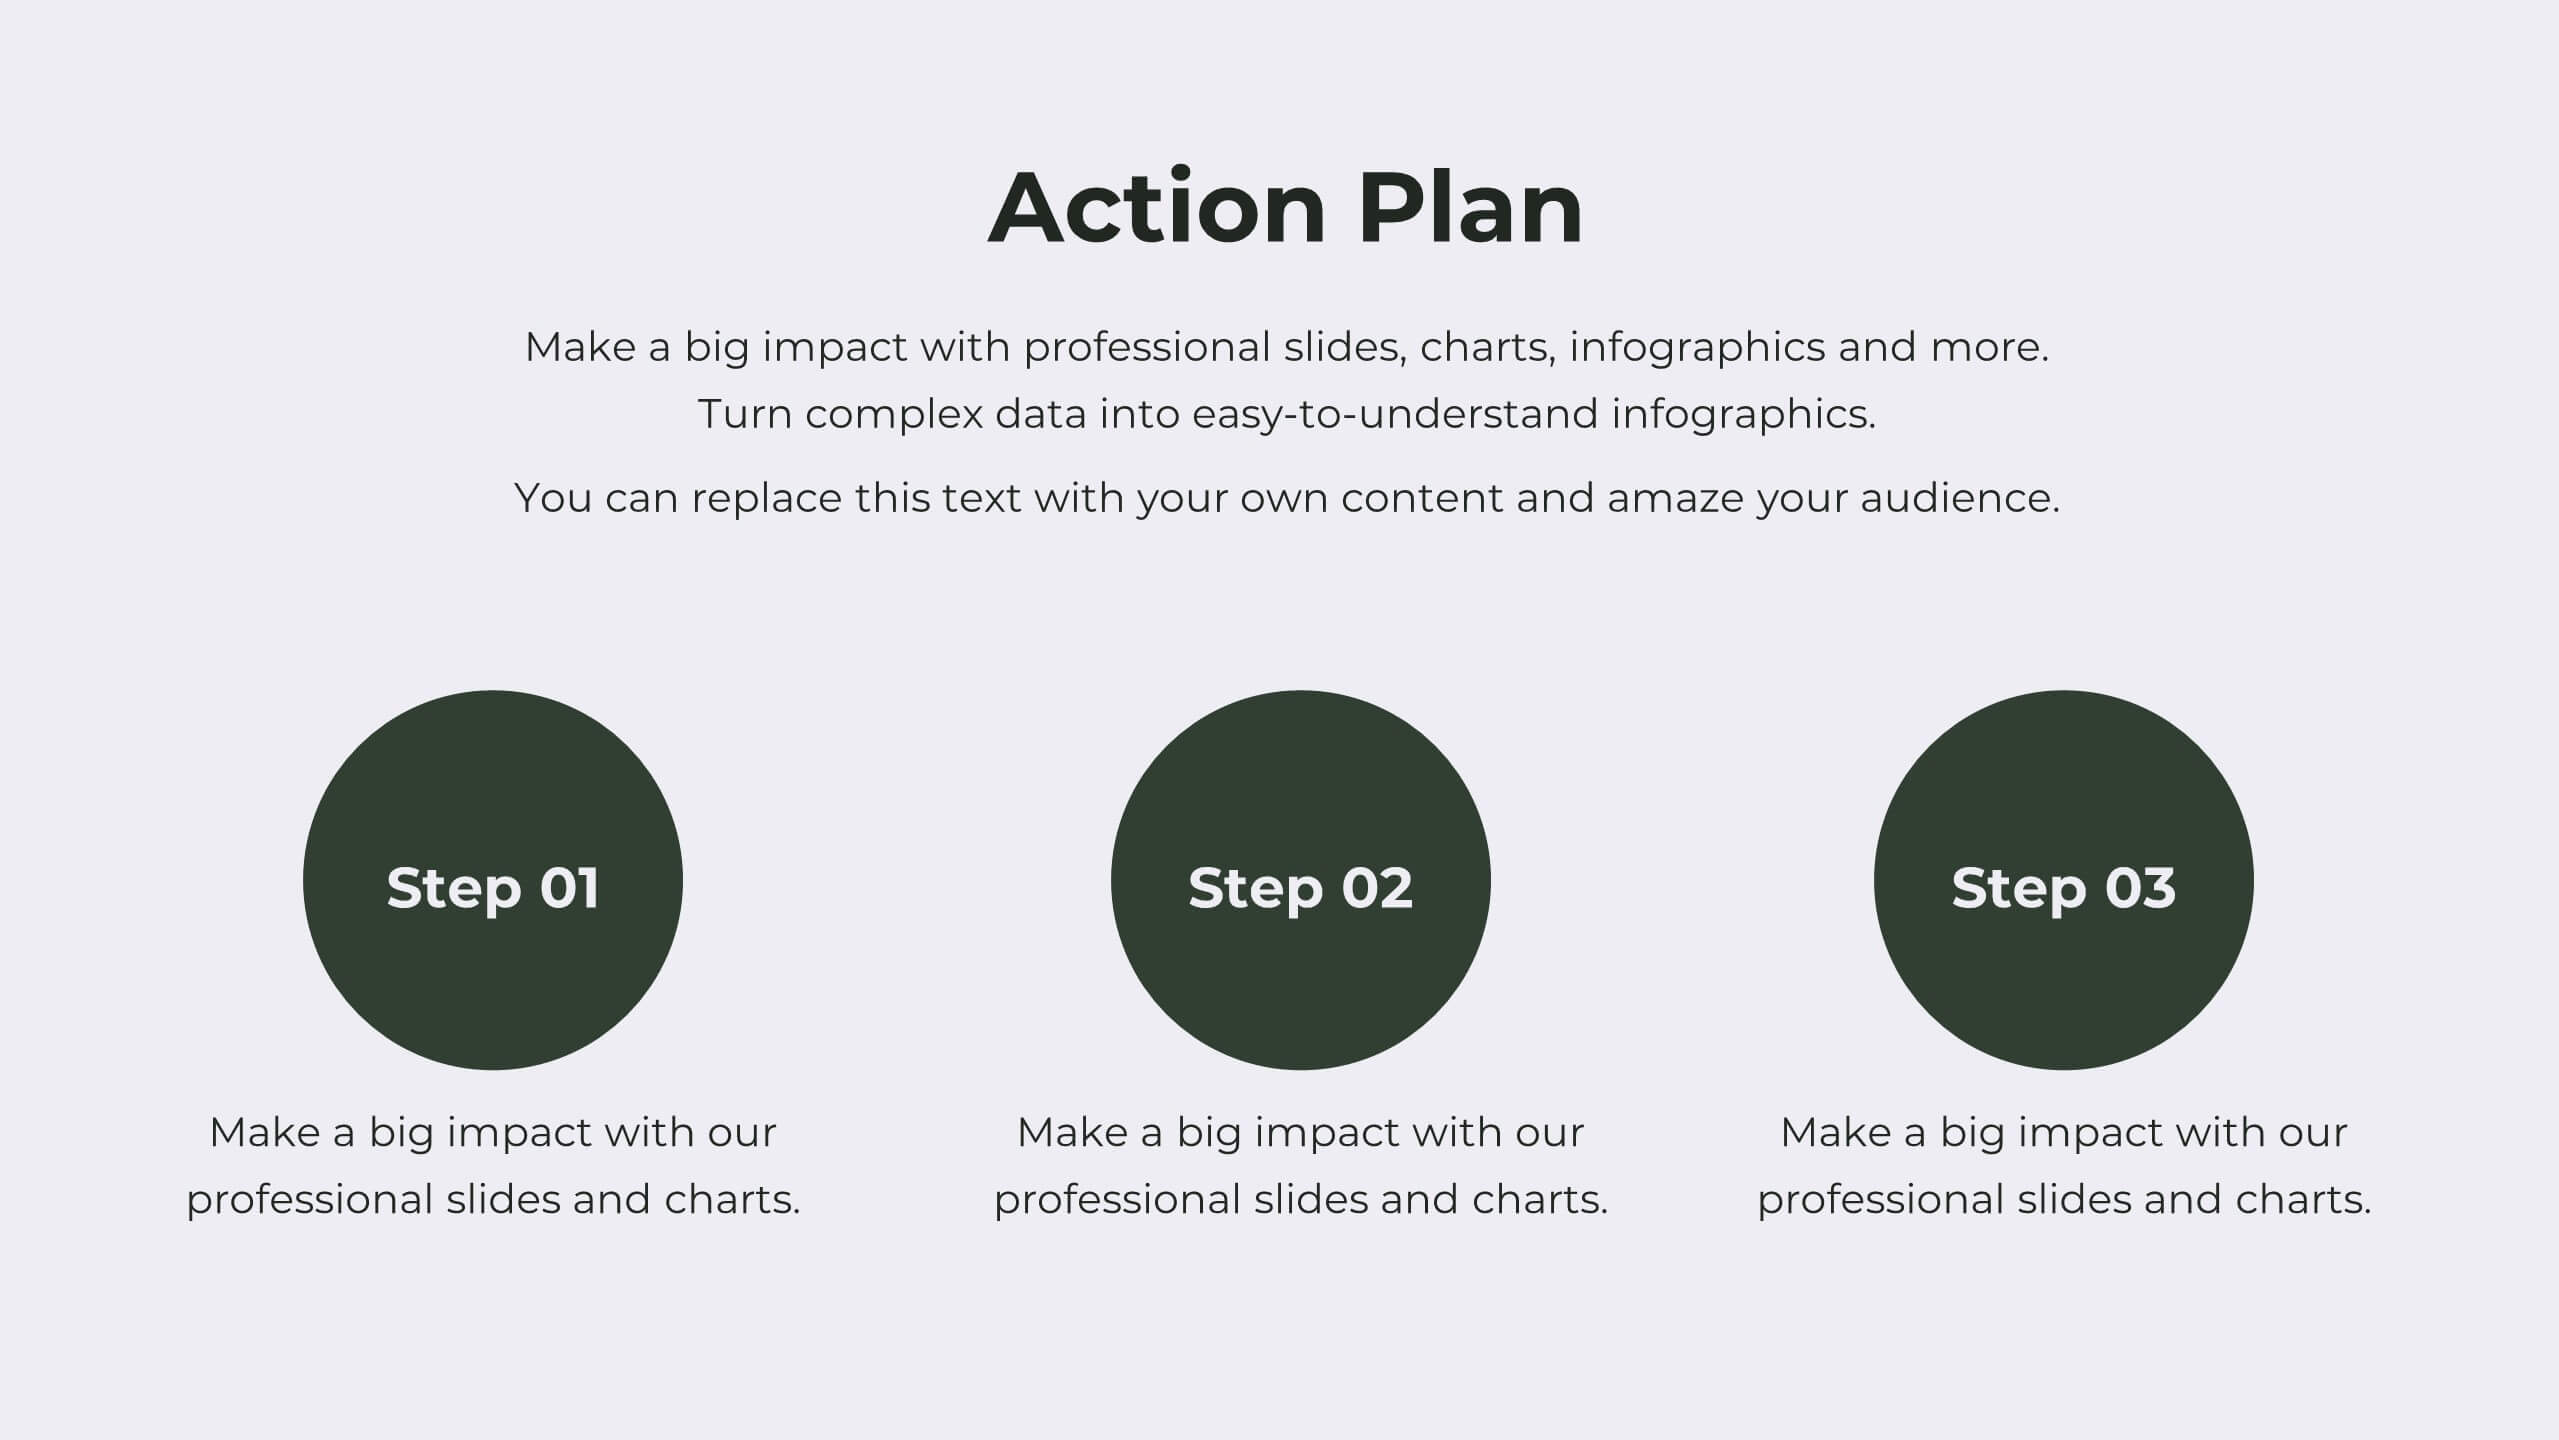
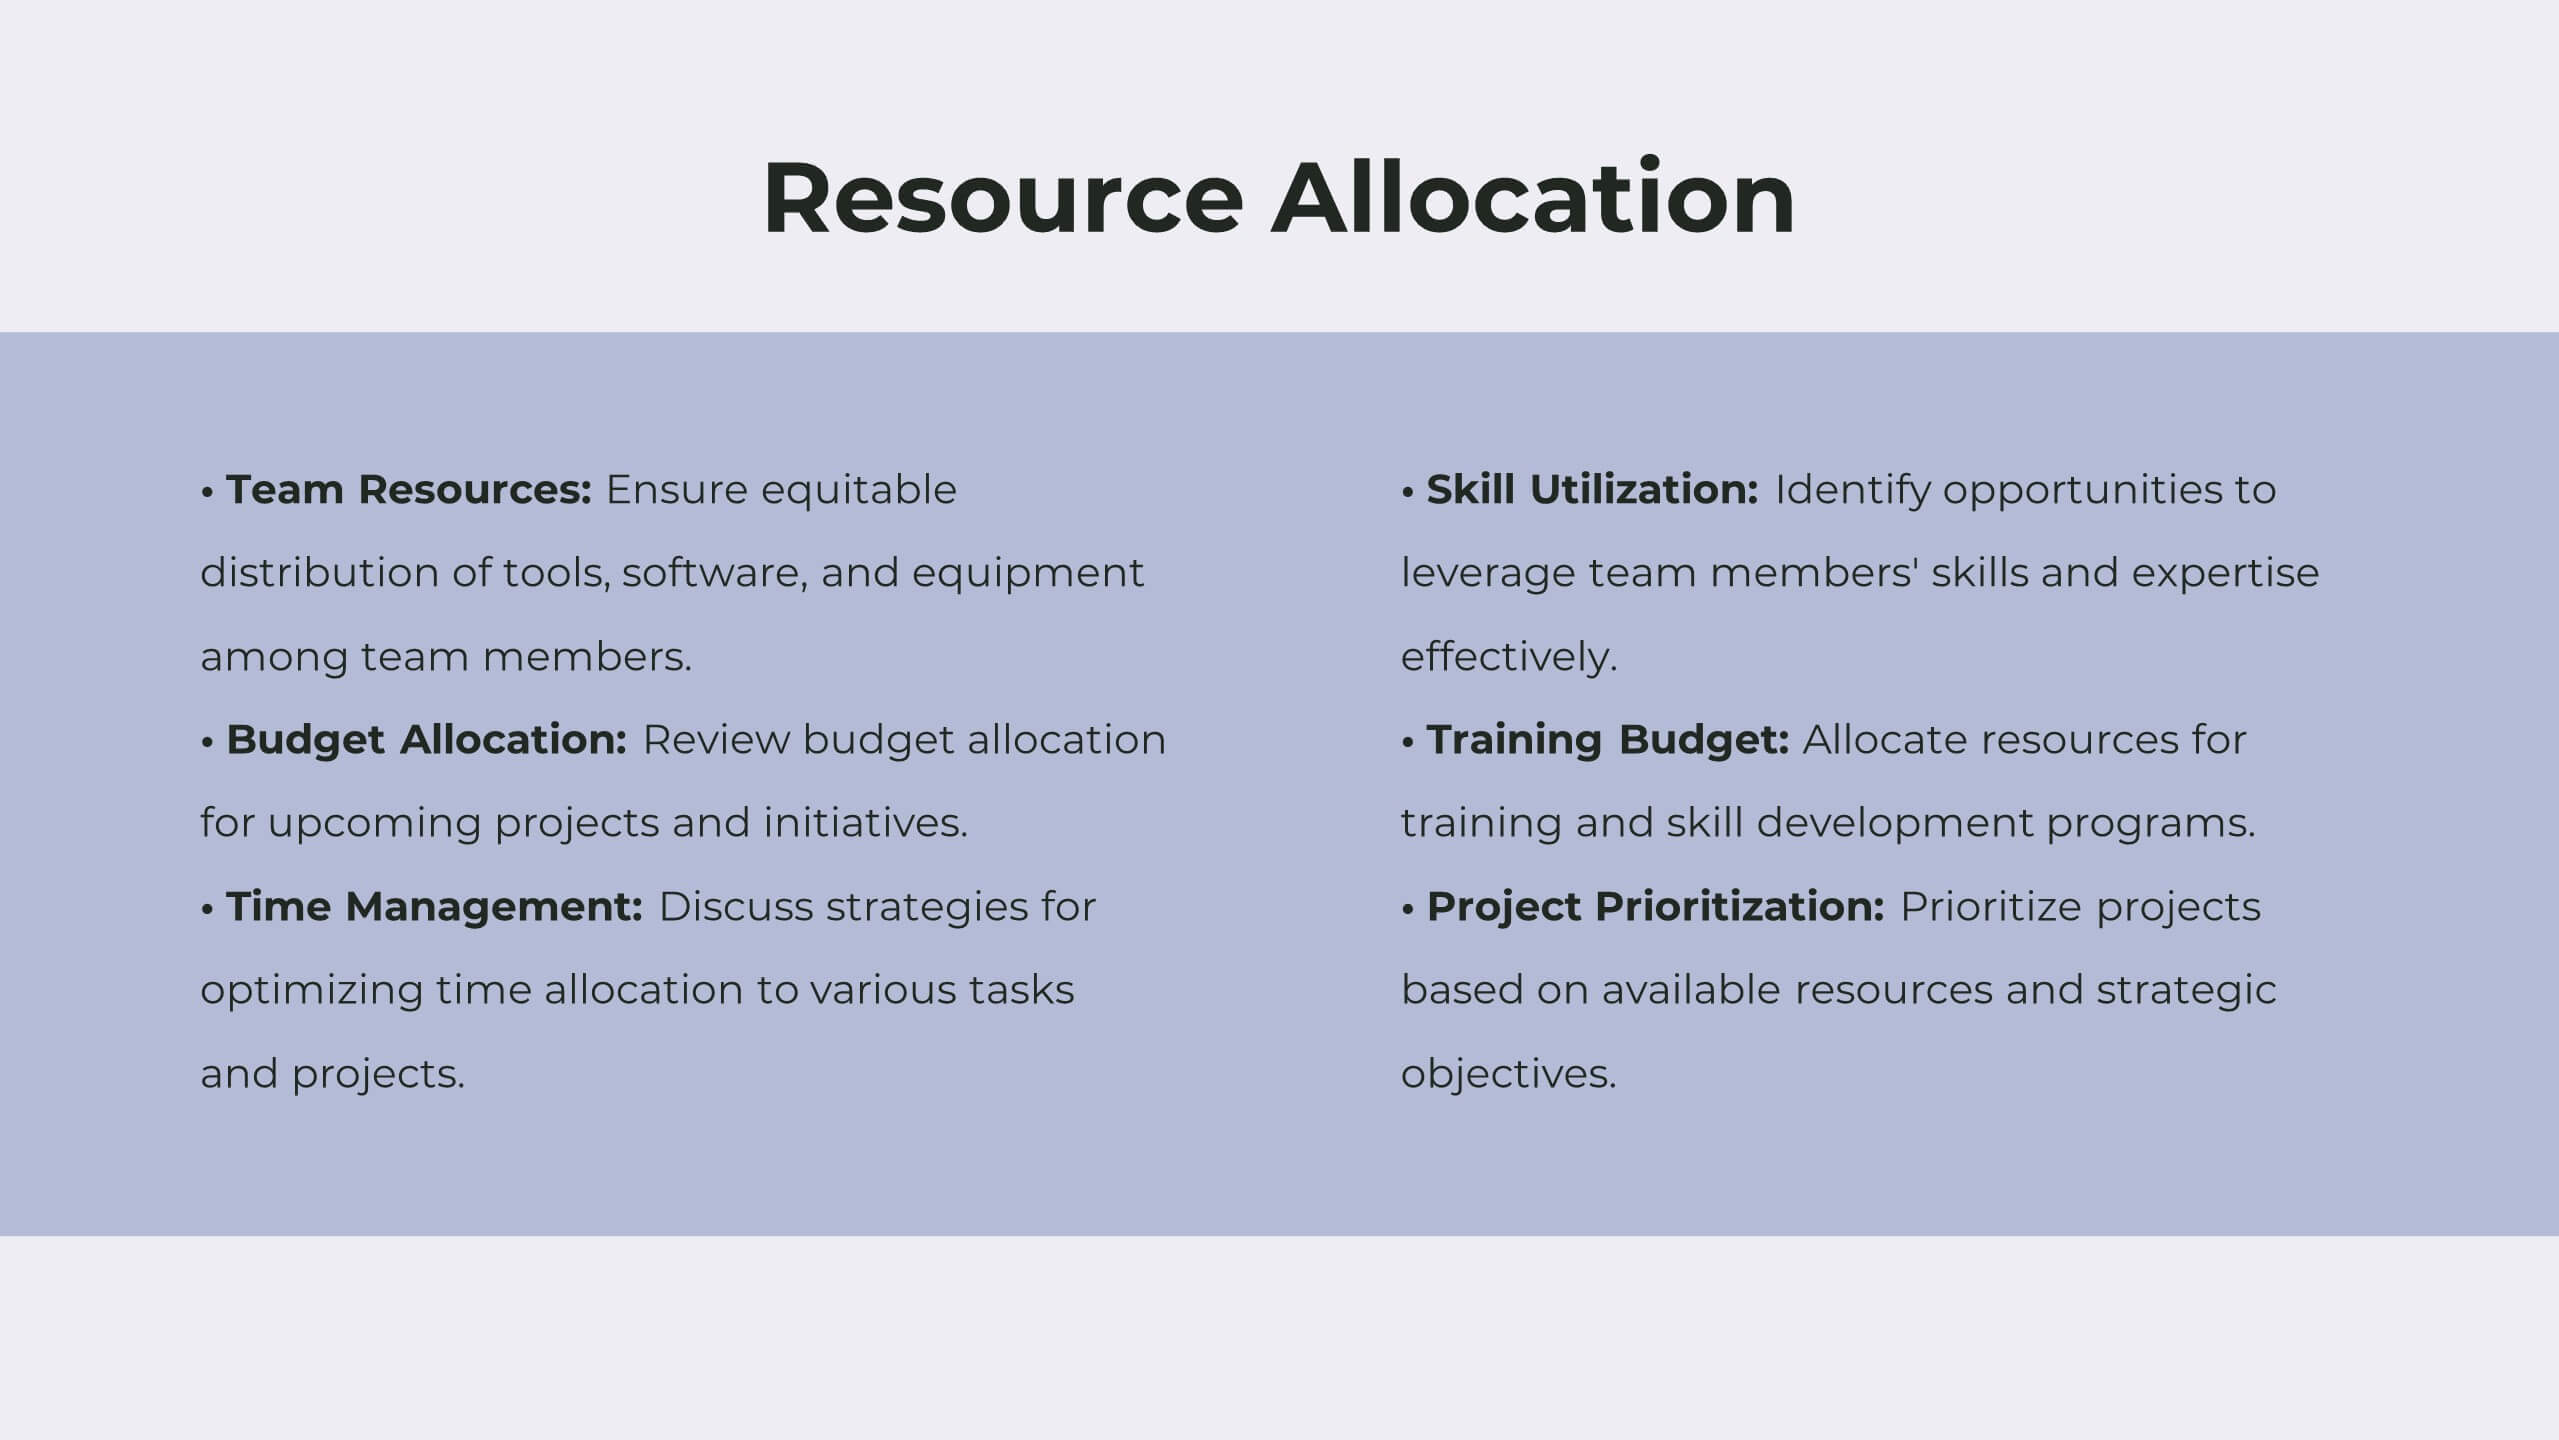
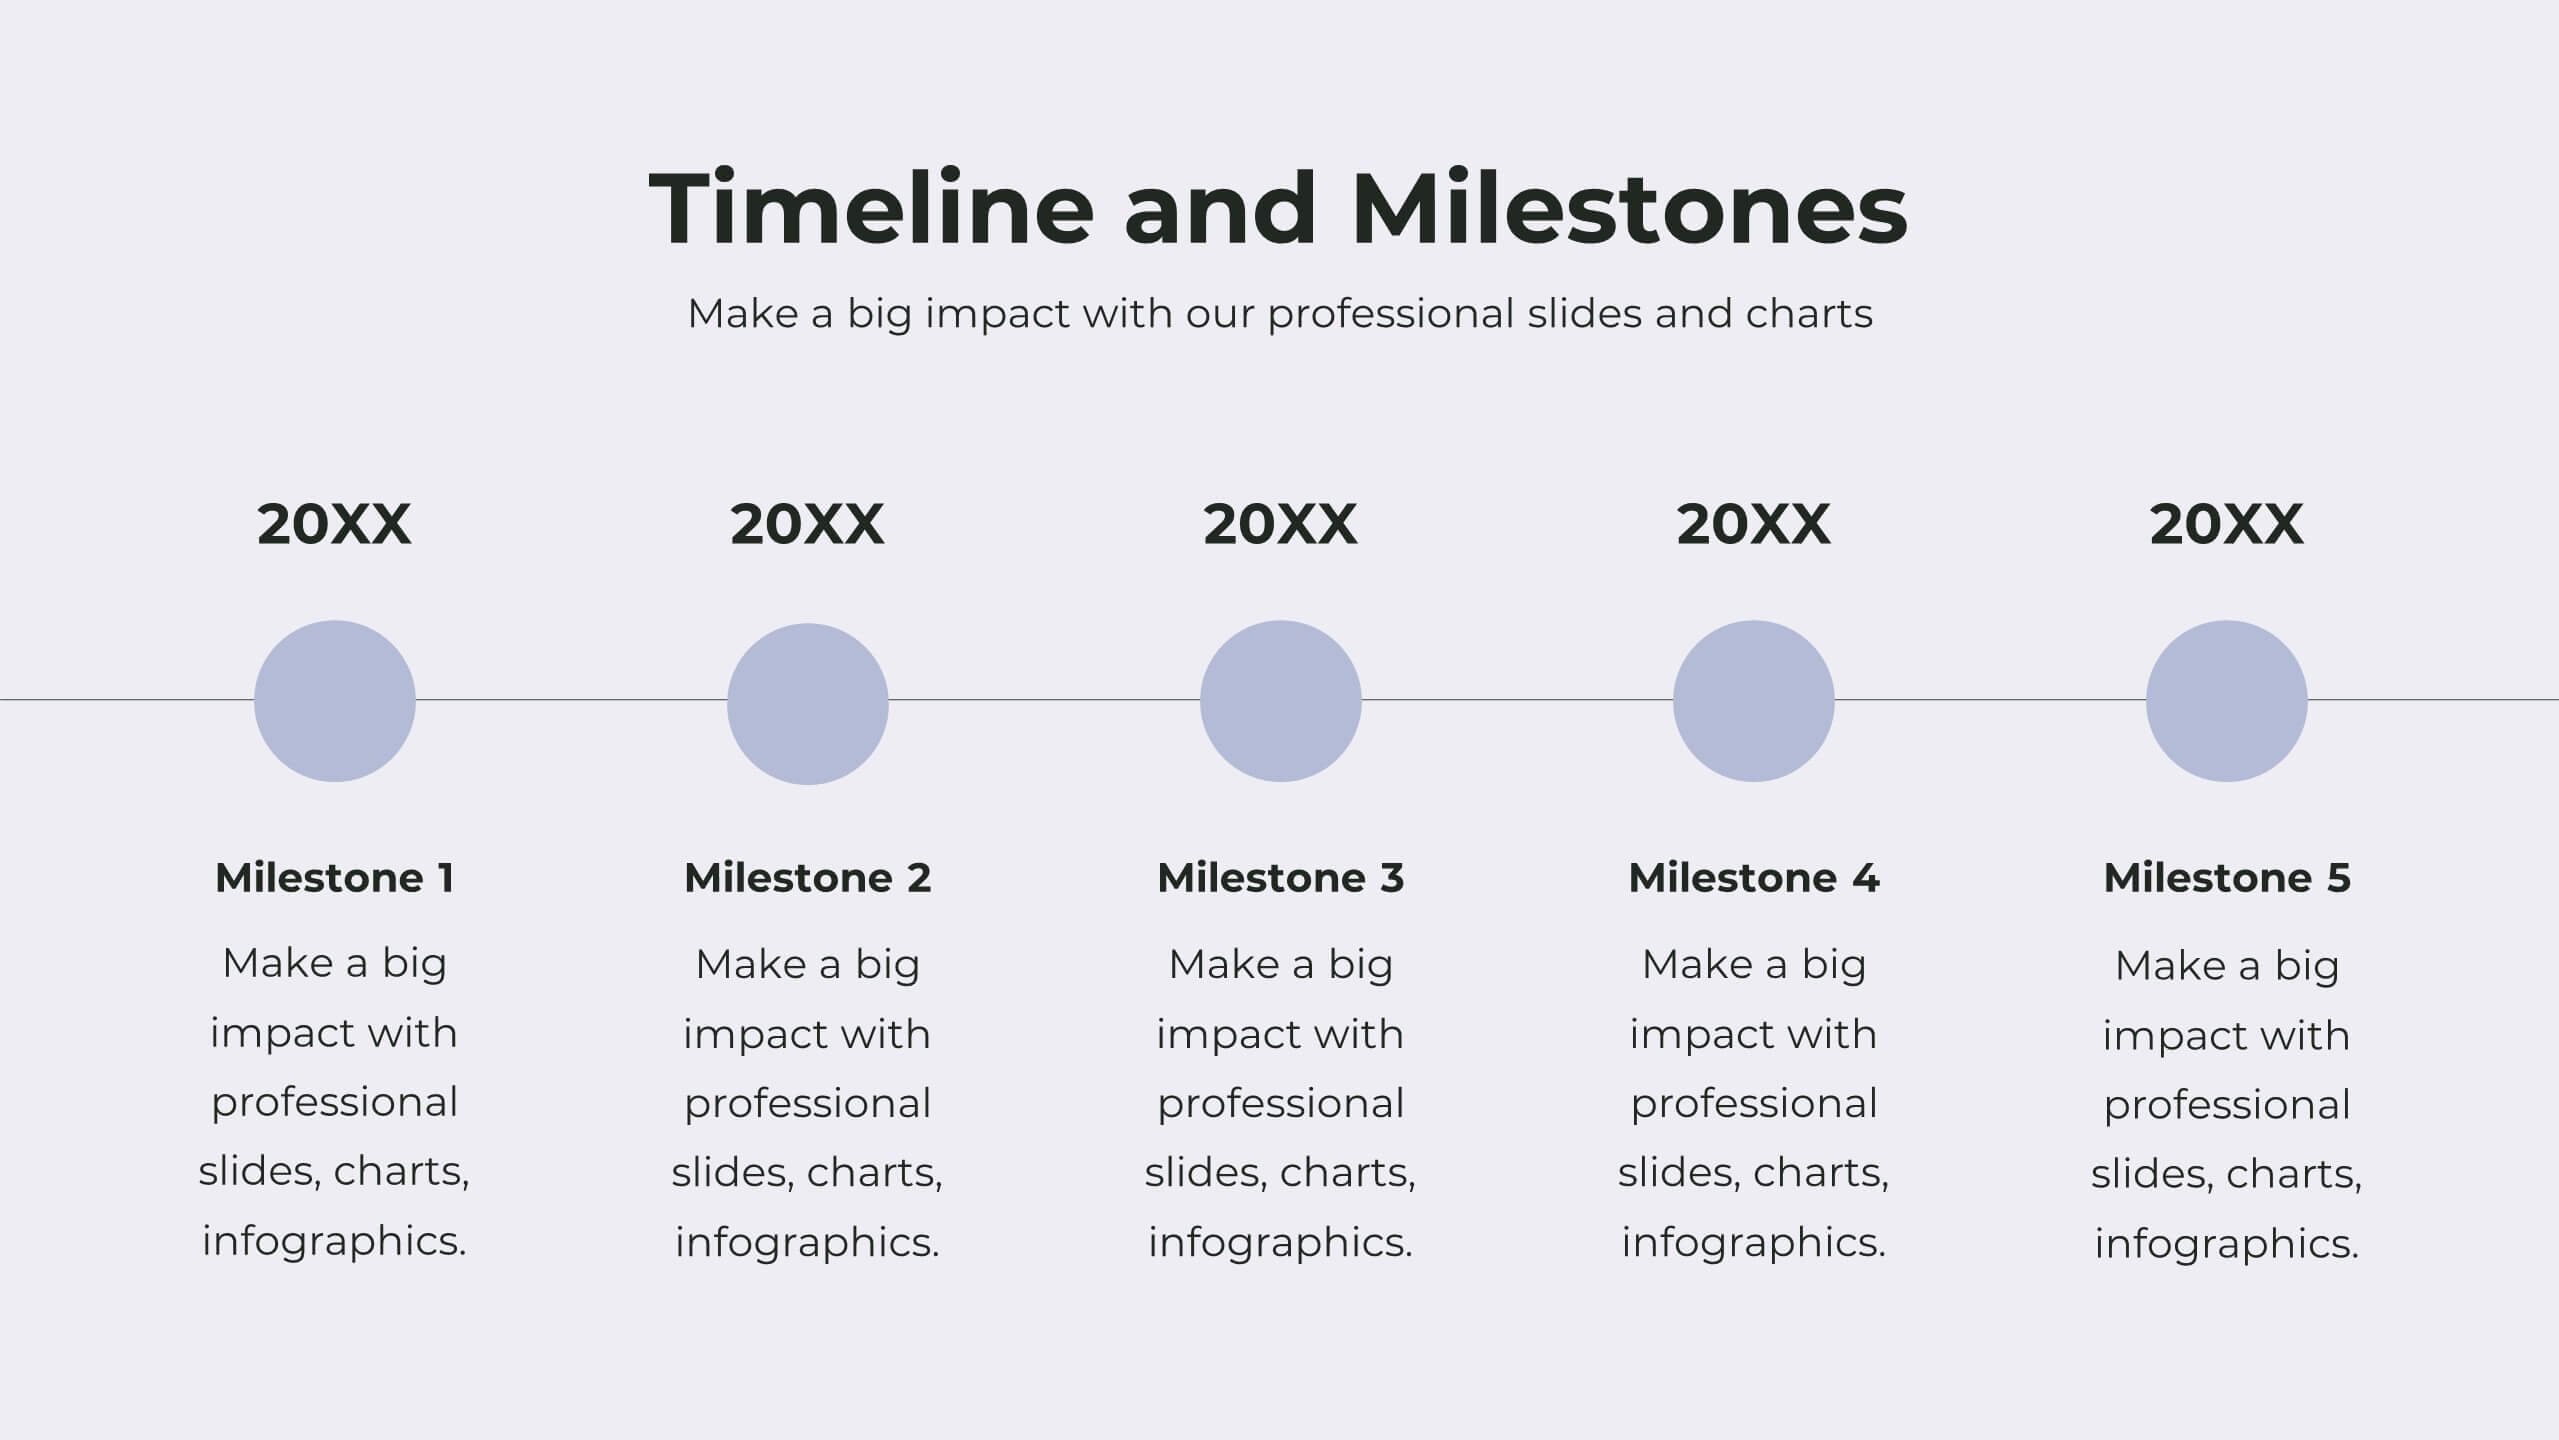
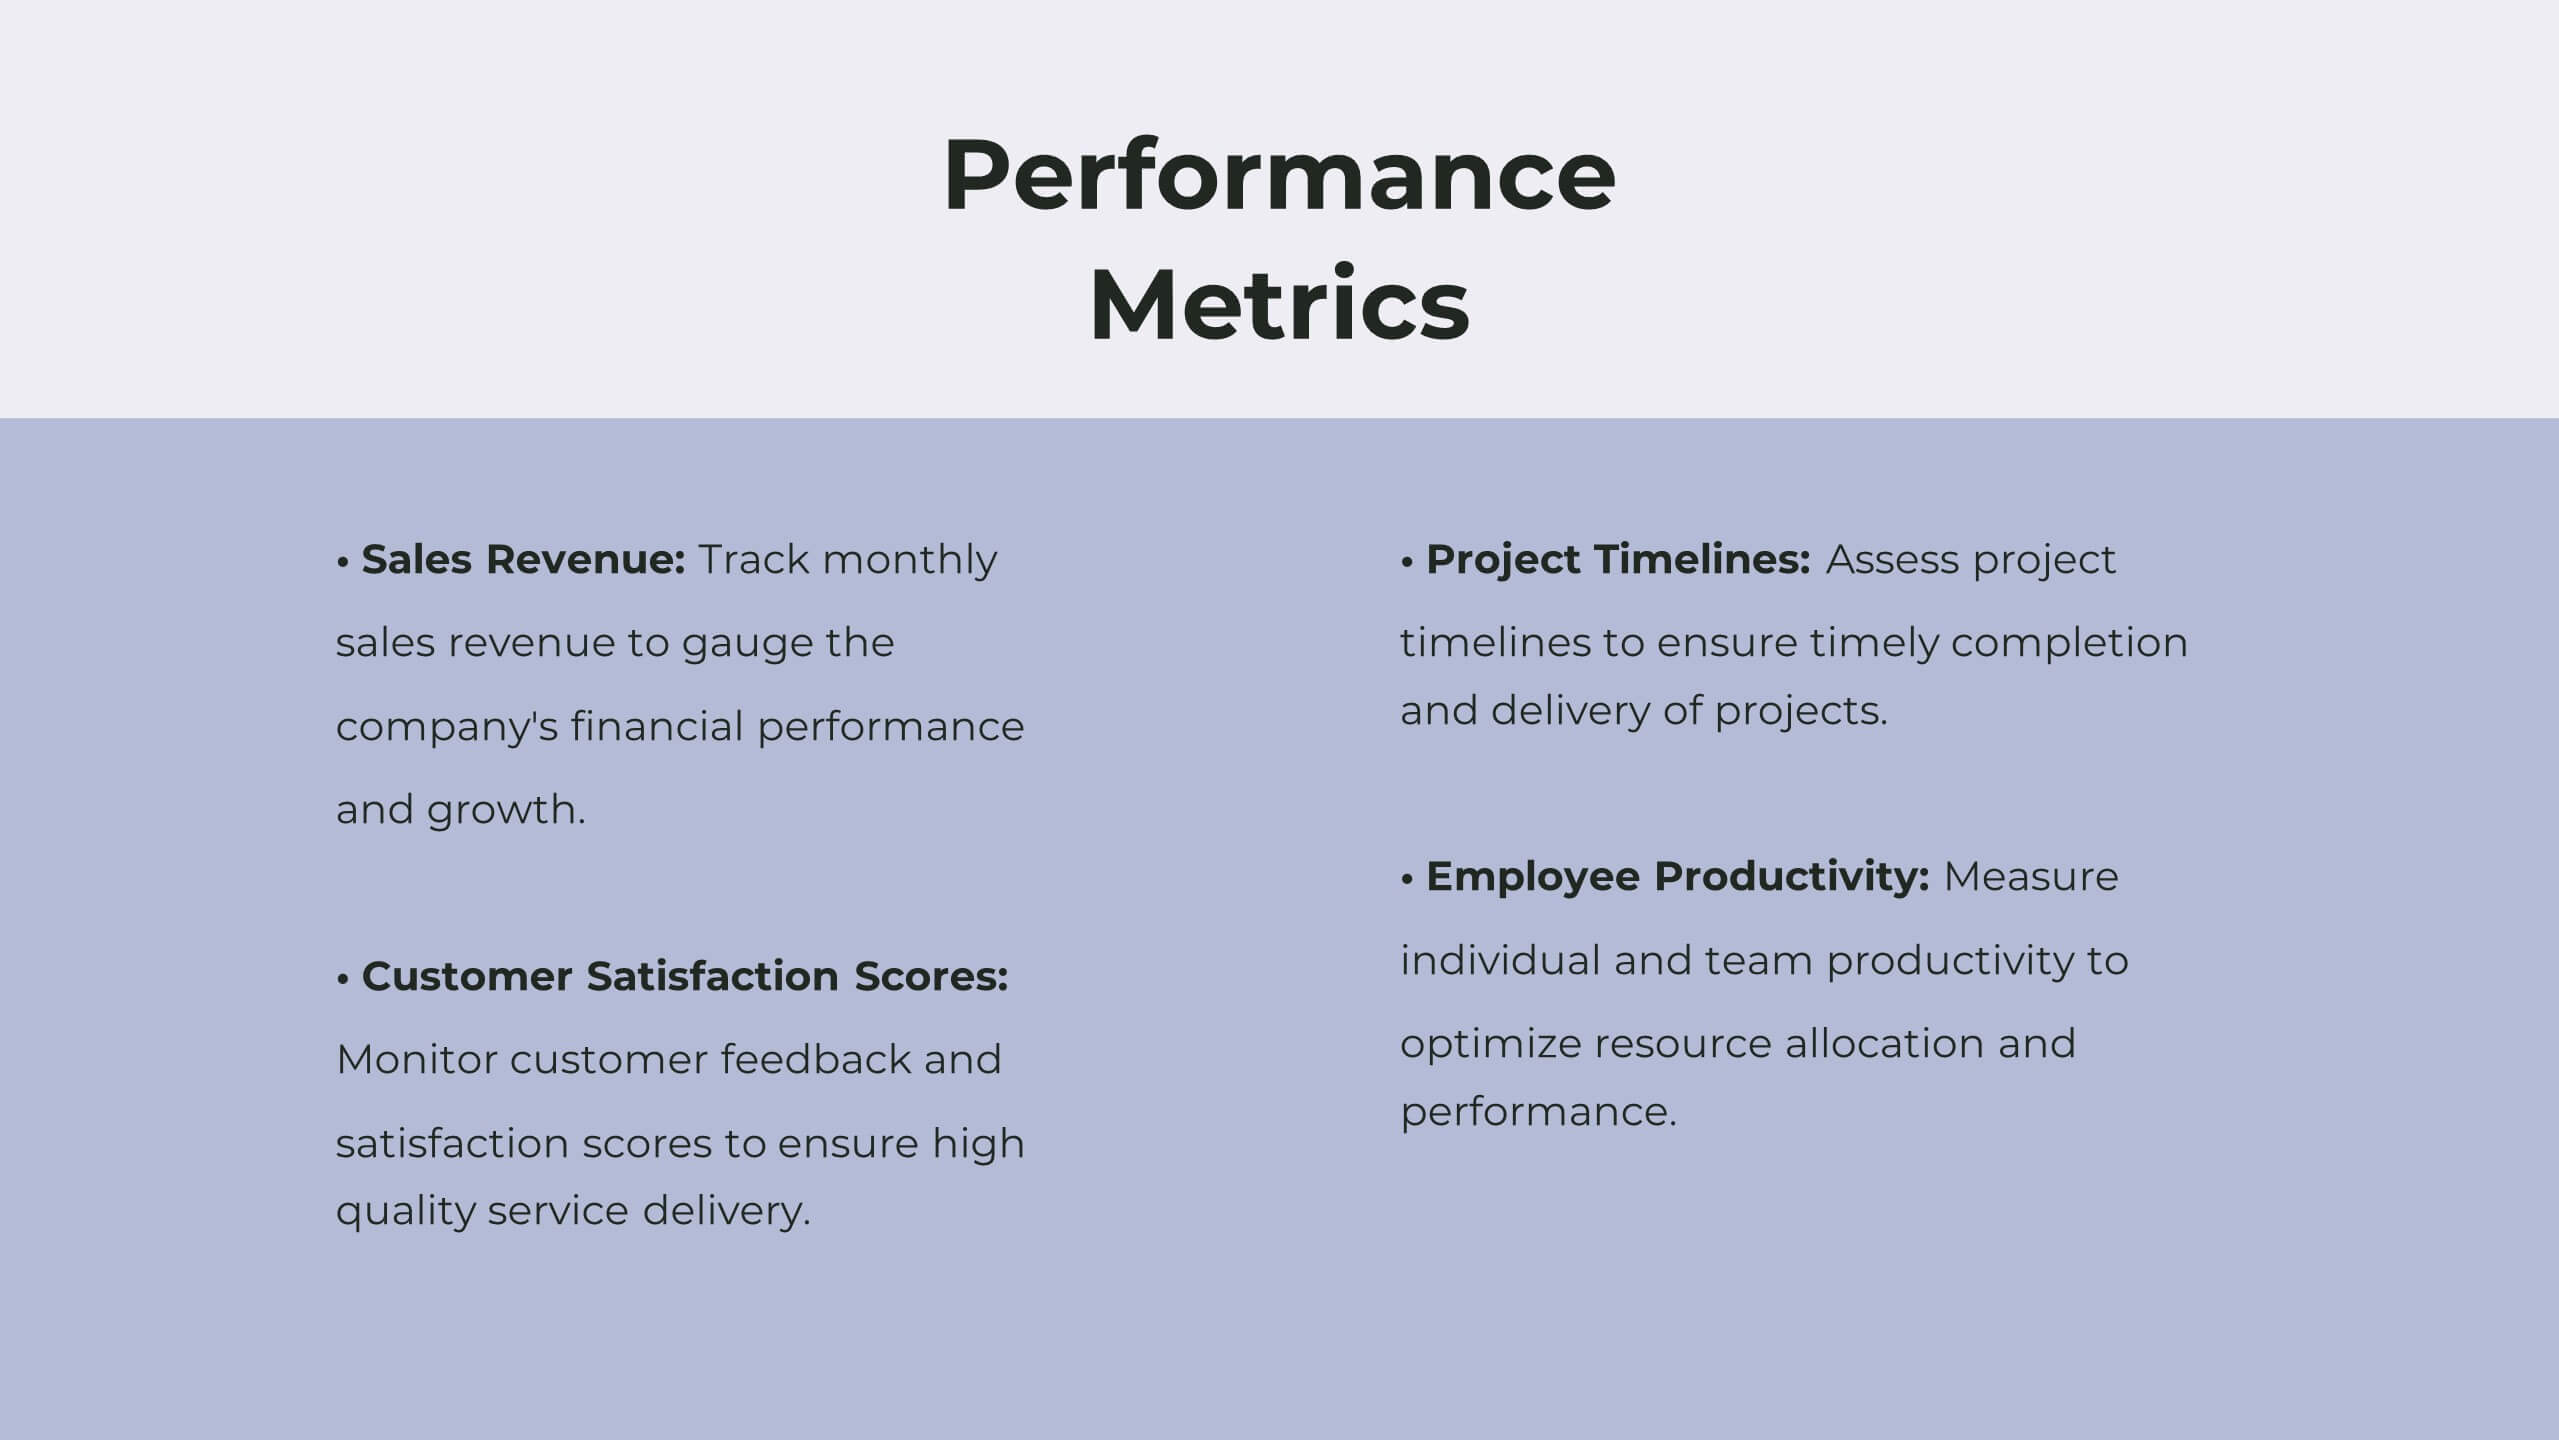
Tranquil Corporate Strategy Proposal Presentation
Drive your business forward with this elegant corporate strategy proposal template! Ideal for outlining strategic objectives, competitive analysis, and growth opportunities, it includes slides for SWOT analysis, resource allocation, and performance metrics. Impress stakeholders with clear visuals and structured content. Compatible with PowerPoint, Keynote, and Google Slides for seamless presentations on any platform.


5 diapositivas
Rival Strategy Review Presentation
Bring competitive insights to life with a modern, circular layout that highlights rival strategies, key strengths, and market positioning. Perfect for analyzing competitors and identifying growth opportunities, this presentation combines clarity with style. Fully compatible with PowerPoint, Keynote, and Google Slides for effortless customization and professional delivery.


7 diapositivas
RACI Matrix Infographic Presentation Template
A RACI Matrix Infographic is a visual representation of the RACI model, which is used to clarify roles and responsibilities in an organization. The RACI model stands for Responsible, Accountable, Consulted, and Informed, and is a framework for defining the relationships between individuals and tasks in a project. This infographic displays a visual representation of the RACI matrix, showing the roles and responsibilities of each topic in a clear and organized manner. This Infographic can serve as a useful tool for managers and teams, as it can help to ensure clear communication and organization.


6 diapositivas
Platinum Credit Card Benefits Infographics
The "Platinum Credit Card Benefits" infographic template is a perfect blend of elegance and functionality, designed for PowerPoint, Keynote, and Google Slides. This template is ideal for financial institutions, credit card companies, and financial advisors presenting the advantages of platinum credit cards to clients and customers. This sophisticated template highlights key benefits such as reward points, travel perks, insurance benefits, and exclusive offers associated with platinum credit cards. Its sleek design and clear layout make it easy for presenters to convey the premium features of the card in a way that is both appealing and easy to understand. The design features a color scheme with metallic tones and luxurious accents, reflecting the high-end nature of platinum credit cards. This not only enhances the visual appeal of the presentation but also aligns with the premium status of the product being discussed. Whether it's used in client meetings, marketing presentations, or financial workshops, this template ensures that the premium benefits of platinum credit cards are presented in a professional and attractive manner.


8 diapositivas
Team Roles & Skills Chart Presentation
Bring your team’s strengths to life with this clean, engaging slide designed to highlight individual roles, skill levels, and key capabilities. It helps teams clearly visualize expertise, compare competencies, and communicate responsibilities with ease. Fully editable and compatible with PowerPoint, Keynote, and Google Slides.


5 diapositivas
Business Growths Strategy Presentation
Grow your ideas with a dynamic visual layout that makes every milestone feel achievable and clear. This presentation helps you explain key stages, strategic actions, and long-term growth goals with confidence and simplicity. Fully customizable and compatible with PowerPoint, Keynote, and Google Slides.