


Características


¿Tienes alguna pregunta?
Recomendar


21 diapositivas
Trident Product Development Plan Presentation
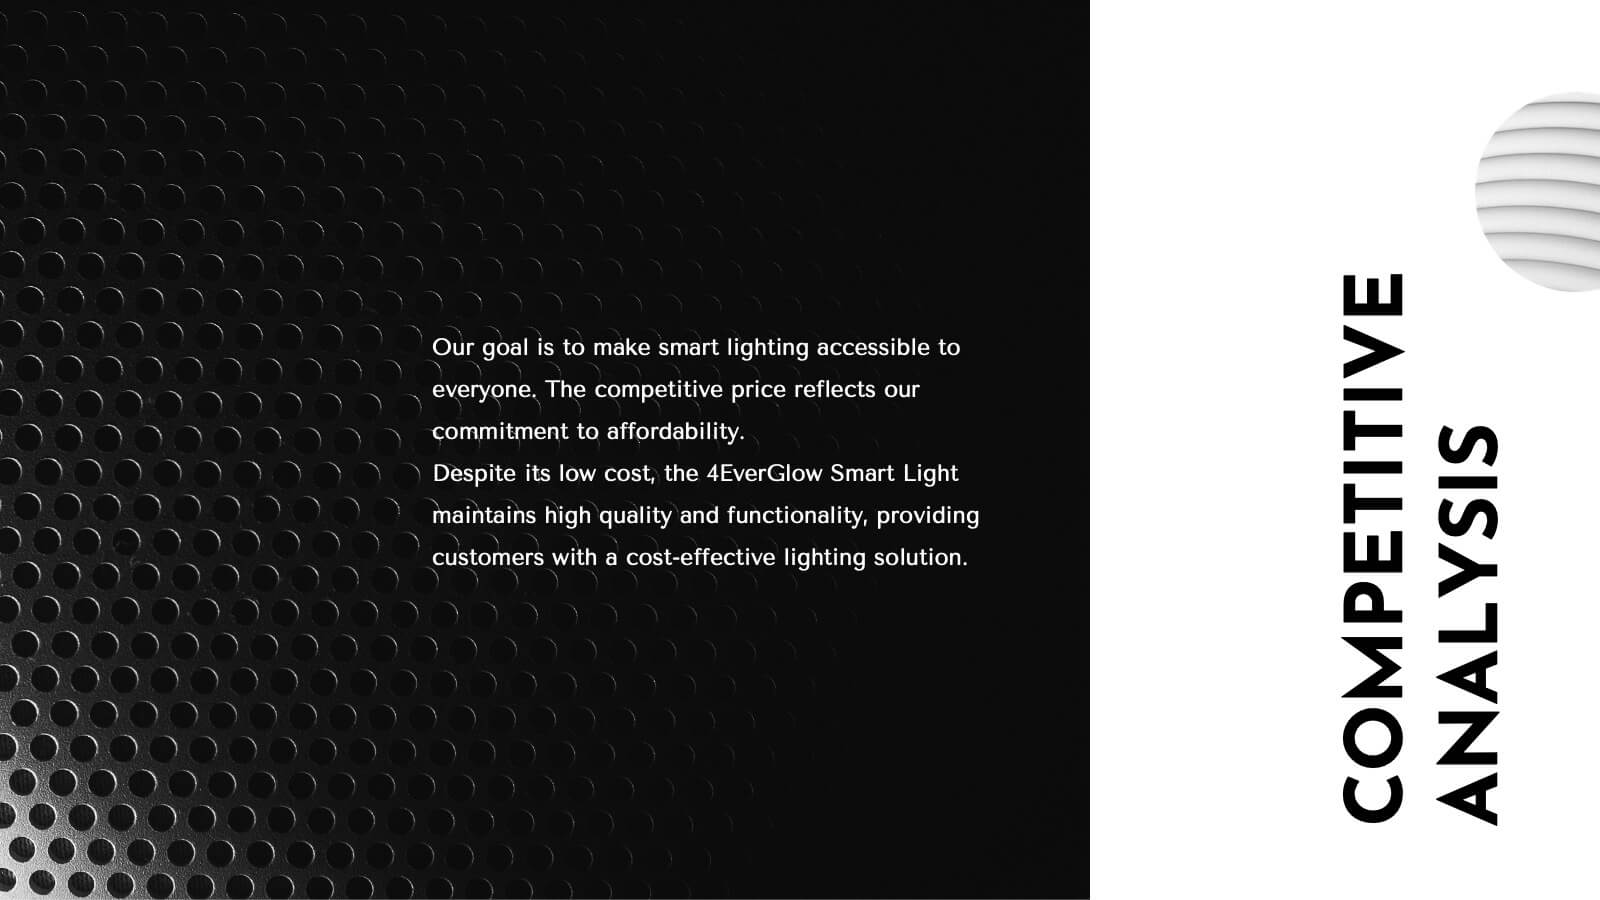
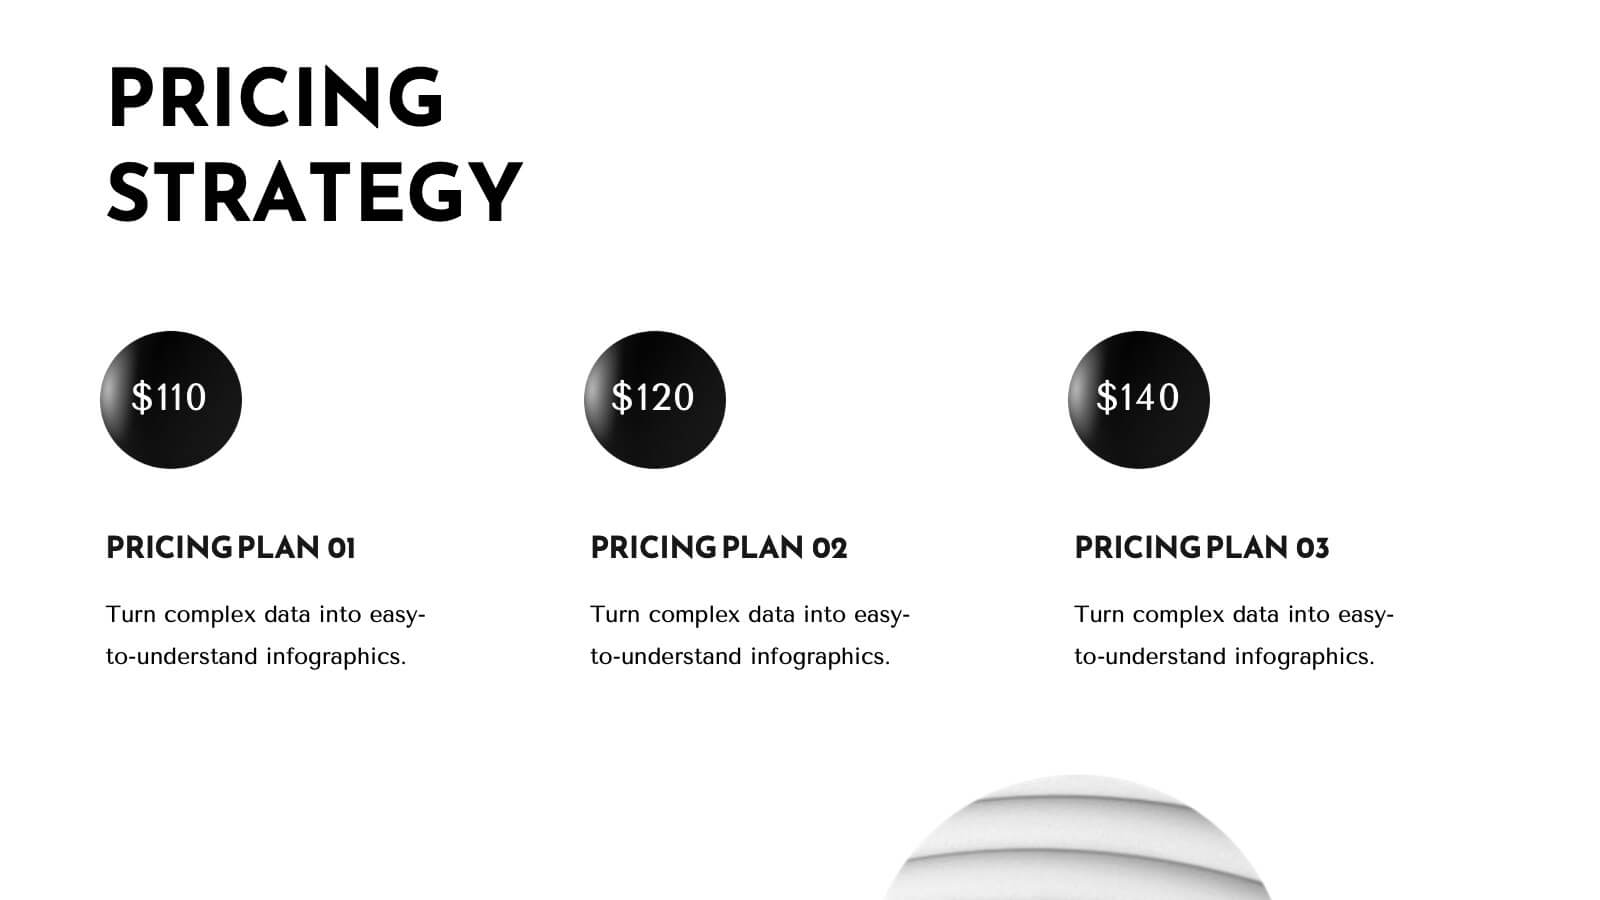
Present your product development strategy with this sleek, professional template! Highlight company overview, product features, and unique selling proposition. Ideal for showcasing market analysis, pricing strategy, and production process. Perfect for developers and project managers. Compatible with PowerPoint, Keynote, and Google Slides.


5 diapositivas
Performance Metrics Dashboard Presentation
Turn complex data into clear, engaging visuals with a clean, modern dashboard layout that highlights performance results at a glance. Perfect for tracking KPIs, progress, and team outcomes, this template brings structure and clarity to reports. Easily editable in PowerPoint, Keynote, and Google Slides for professional presentations.


4 diapositivas
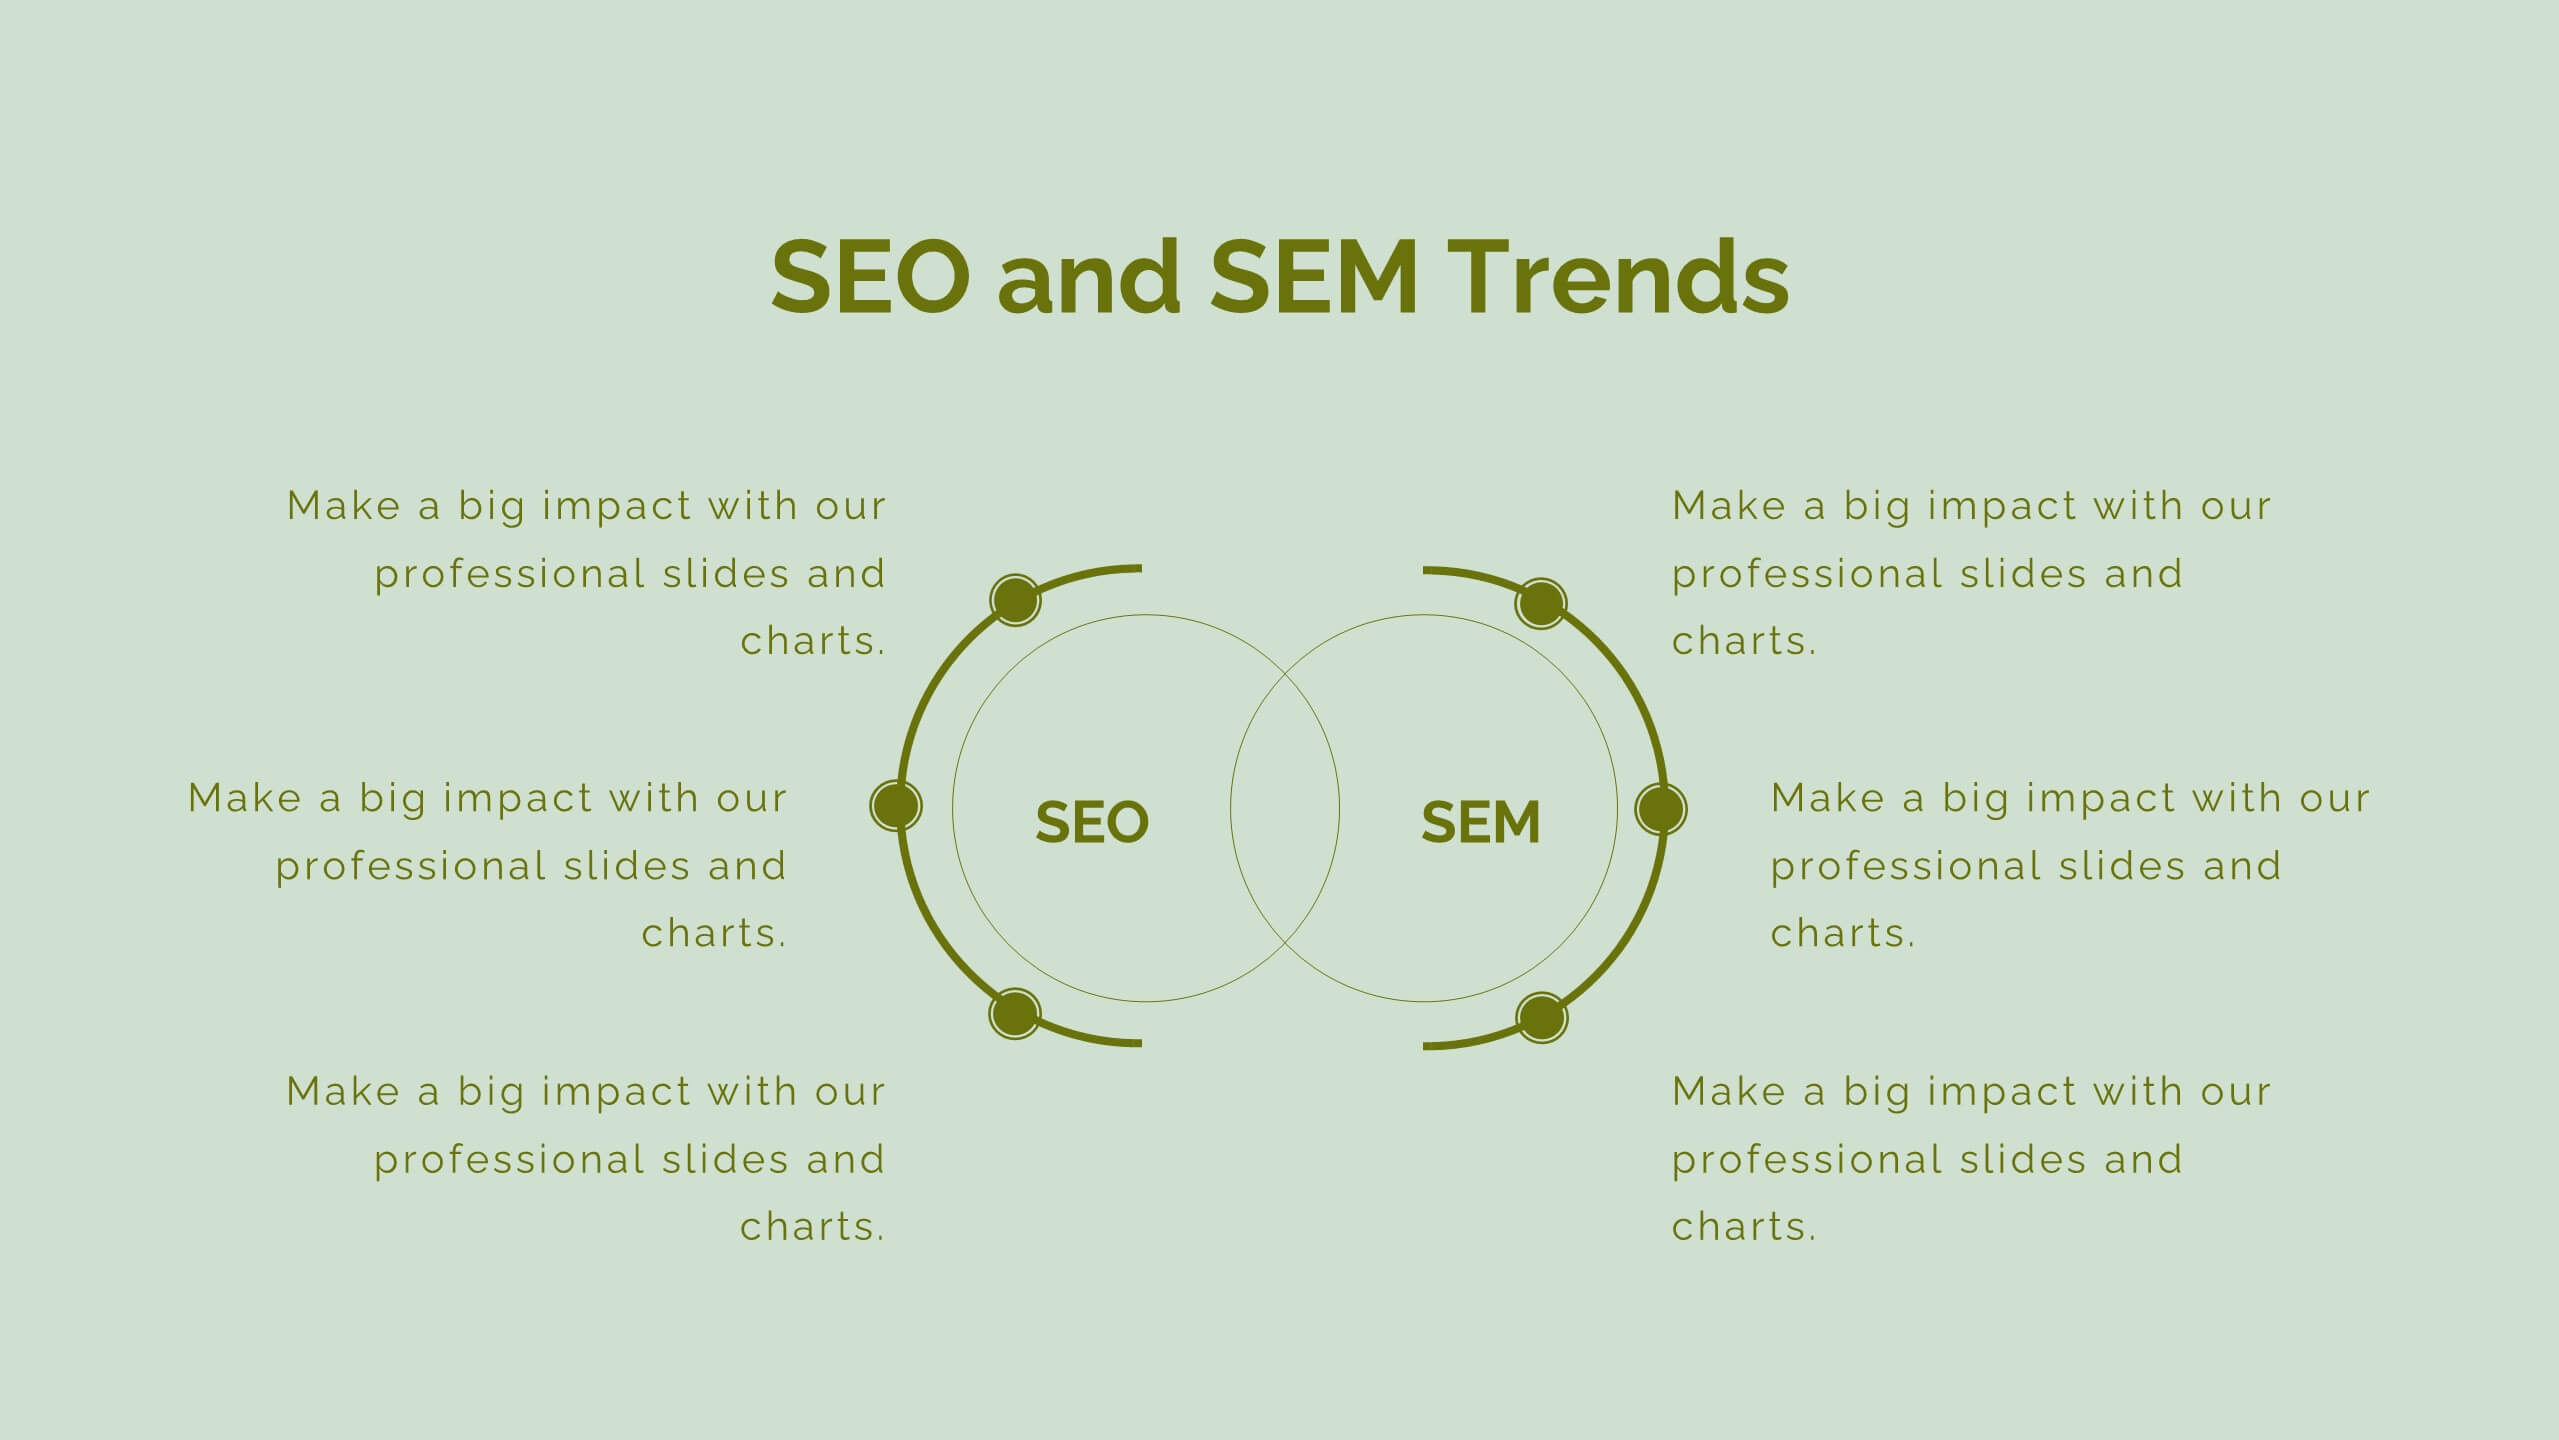
Green Initiatives & Climate Strategy Presentation
Highlight your sustainability roadmap with the Green Initiatives & Climate Strategy Presentation. Designed with a quadrant tree layout, this slide communicates four key environmental focus areas. Ideal for eco-friendly proposals, CSR updates, or climate reports. Fully customizable in PowerPoint, Keynote, and Google Slides—perfect for green strategies, goals, or impact summaries.


21 diapositivas
Ember Echo Graphic Design Project Plan Presentation
The Ember Graphic Design Project Plan template is the perfect canvas for your creative journey! Kickstart your project with a sleek and professional introduction that sets the tone for your design vision. This template is designed to guide you through every step of the design process, from the initial brief to the final presentation. Highlight your target audience, concept development, and design elements with beautifully crafted slides that capture the essence of your project. Dive into the specifics with dedicated sections for brand identity components, textures, and the design process itself, ensuring that every detail is covered. The template also includes mood boards, prototypes, and design assets, making it easy to showcase your work in progress. With feedback and testing slides, you can iterate and refine your designs before presenting the final product. This template is fully compatible with PowerPoint, Keynote, and Google Slides, making it versatile and easy to use for any creative project.


5 diapositivas
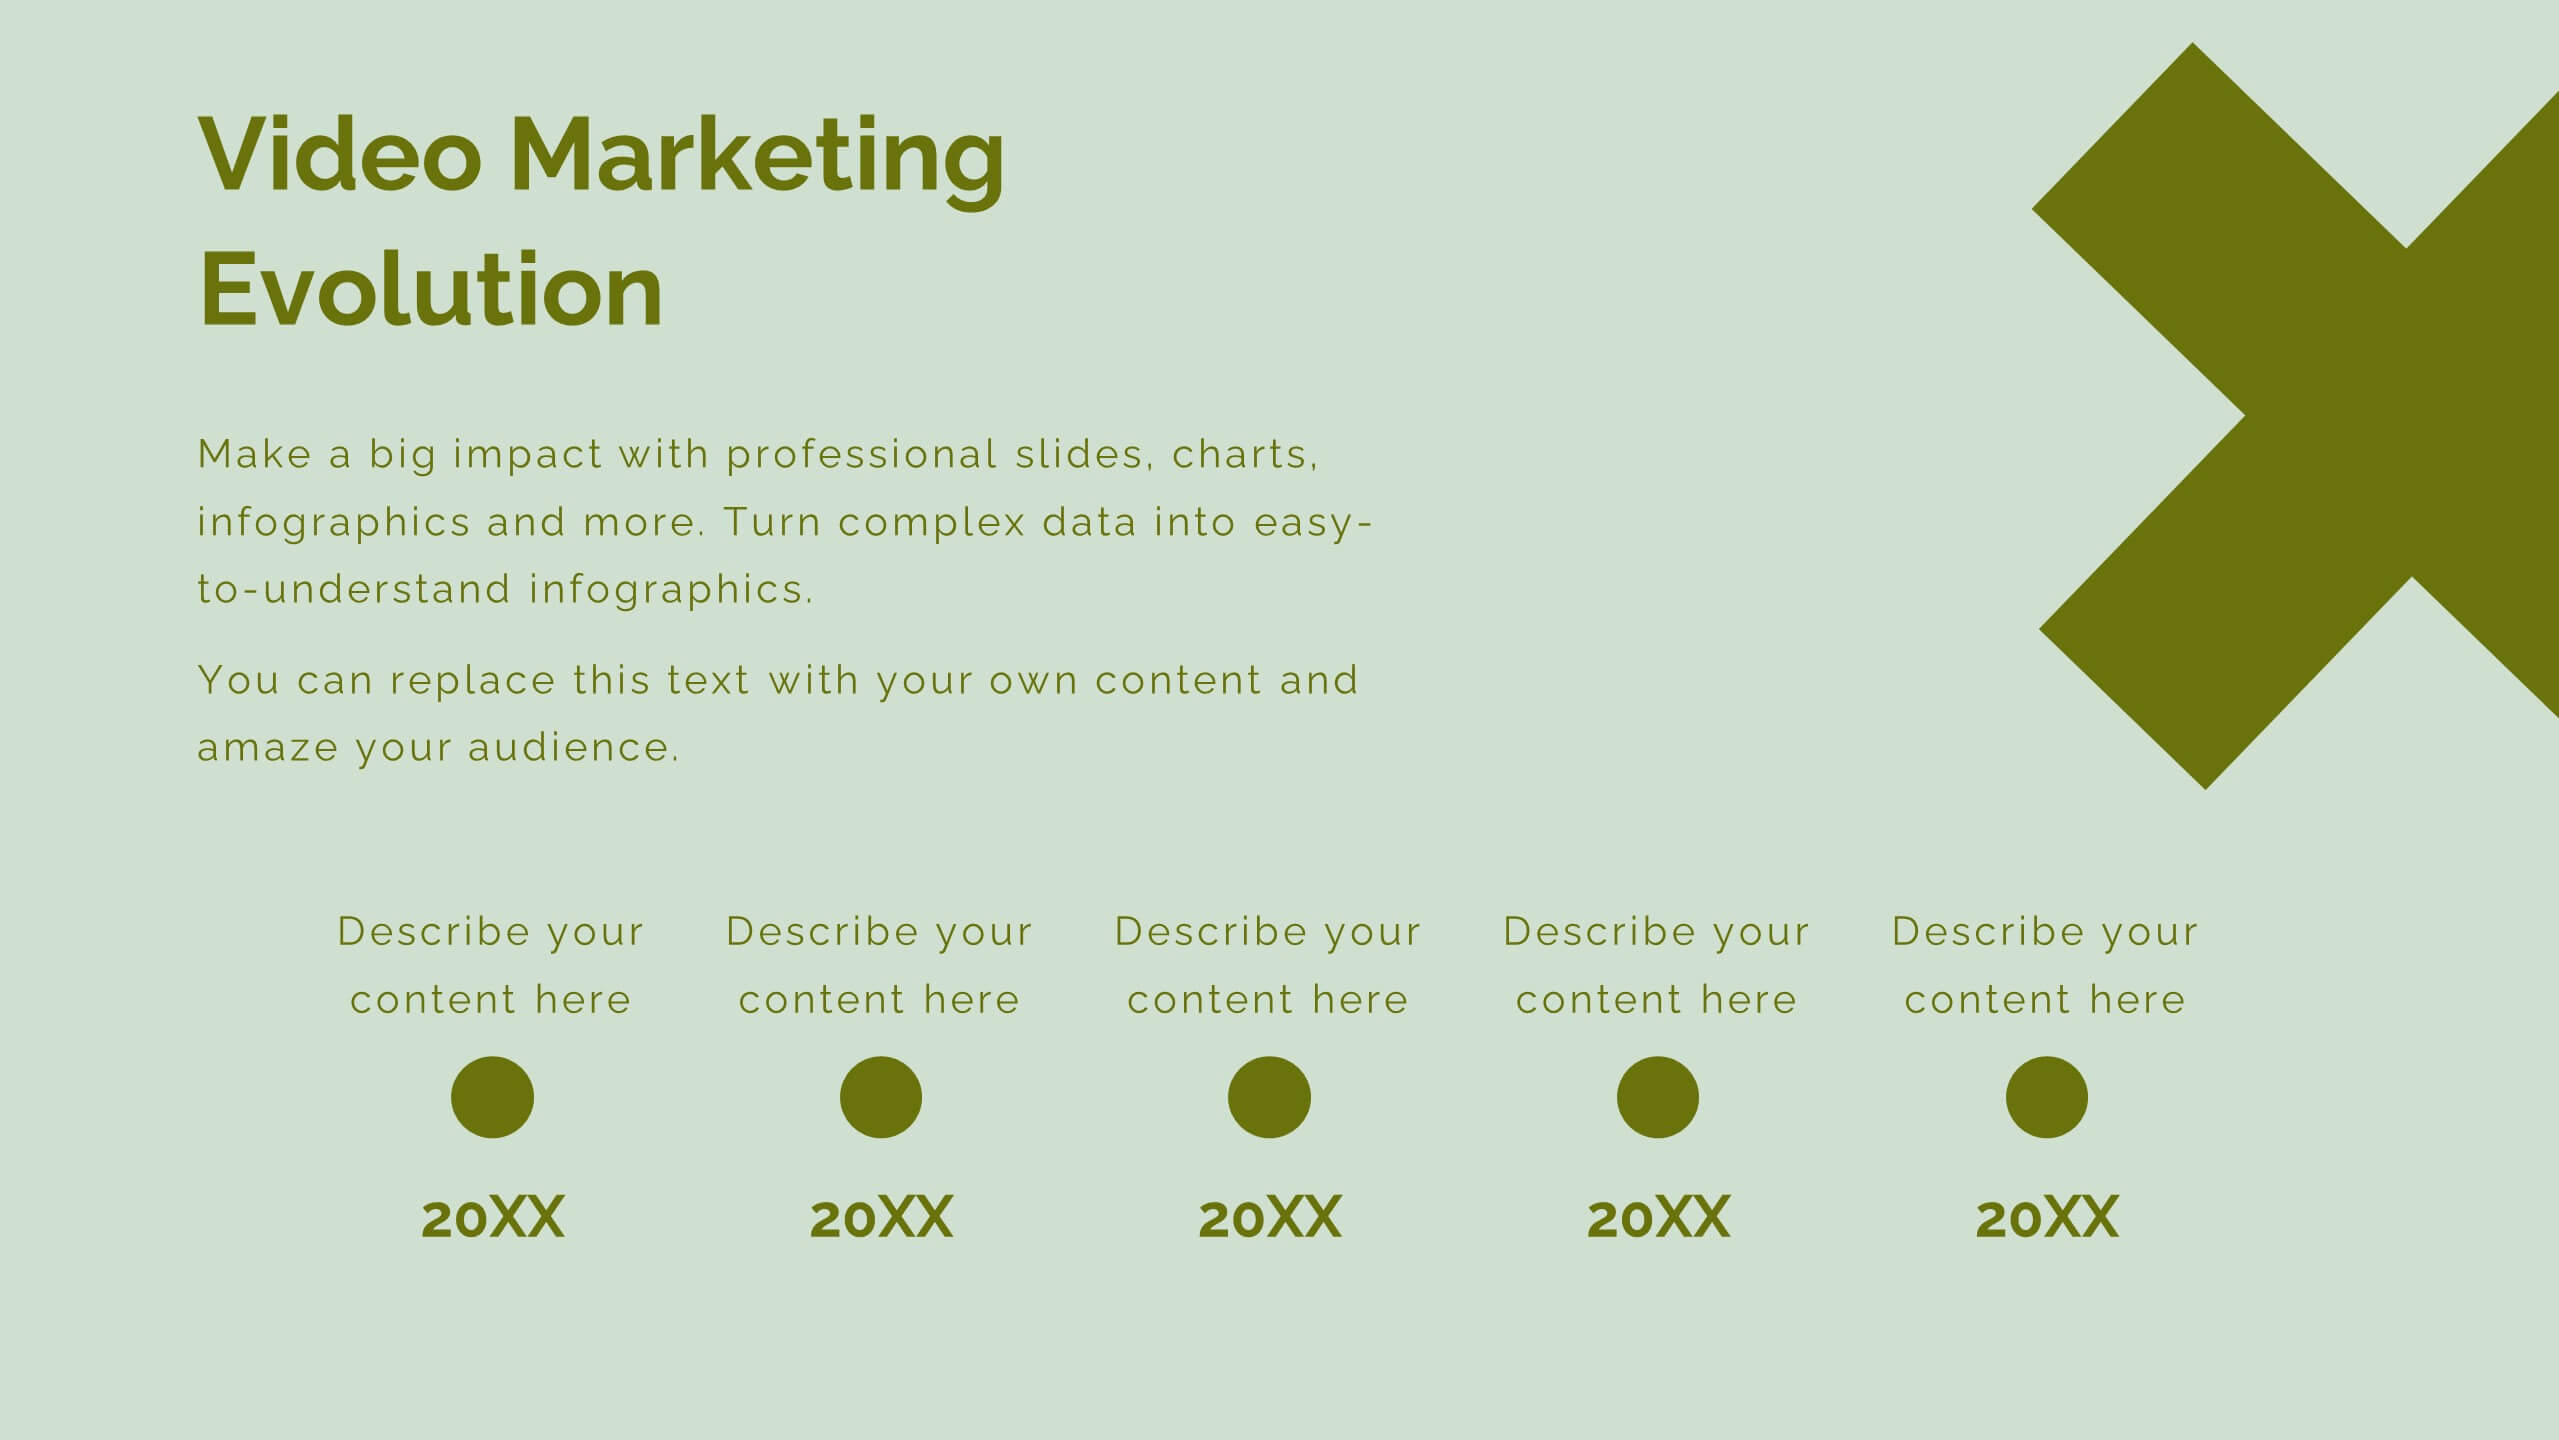
Future Planning and Next Steps Strategy Presentation
Map out your goals with clarity using the Future Planning and Next Steps Strategy Presentation. This slide features a sleek four-step curved timeline with editable icons and labels, ideal for outlining strategic actions or project phases. Easily customize each stage to match your business objectives. Compatible with PowerPoint, Keynote, and Google Slides.


5 diapositivas
Annual Overview Report Template Presentation
Bring your yearly achievements to life with this sleek and structured layout designed for clarity and impact. Ideal for summarizing company performance, milestones, and future goals, it organizes data into easy-to-follow visuals. Fully editable and compatible with PowerPoint, Keynote, and Google Slides for a smooth presentation experience.


5 diapositivas
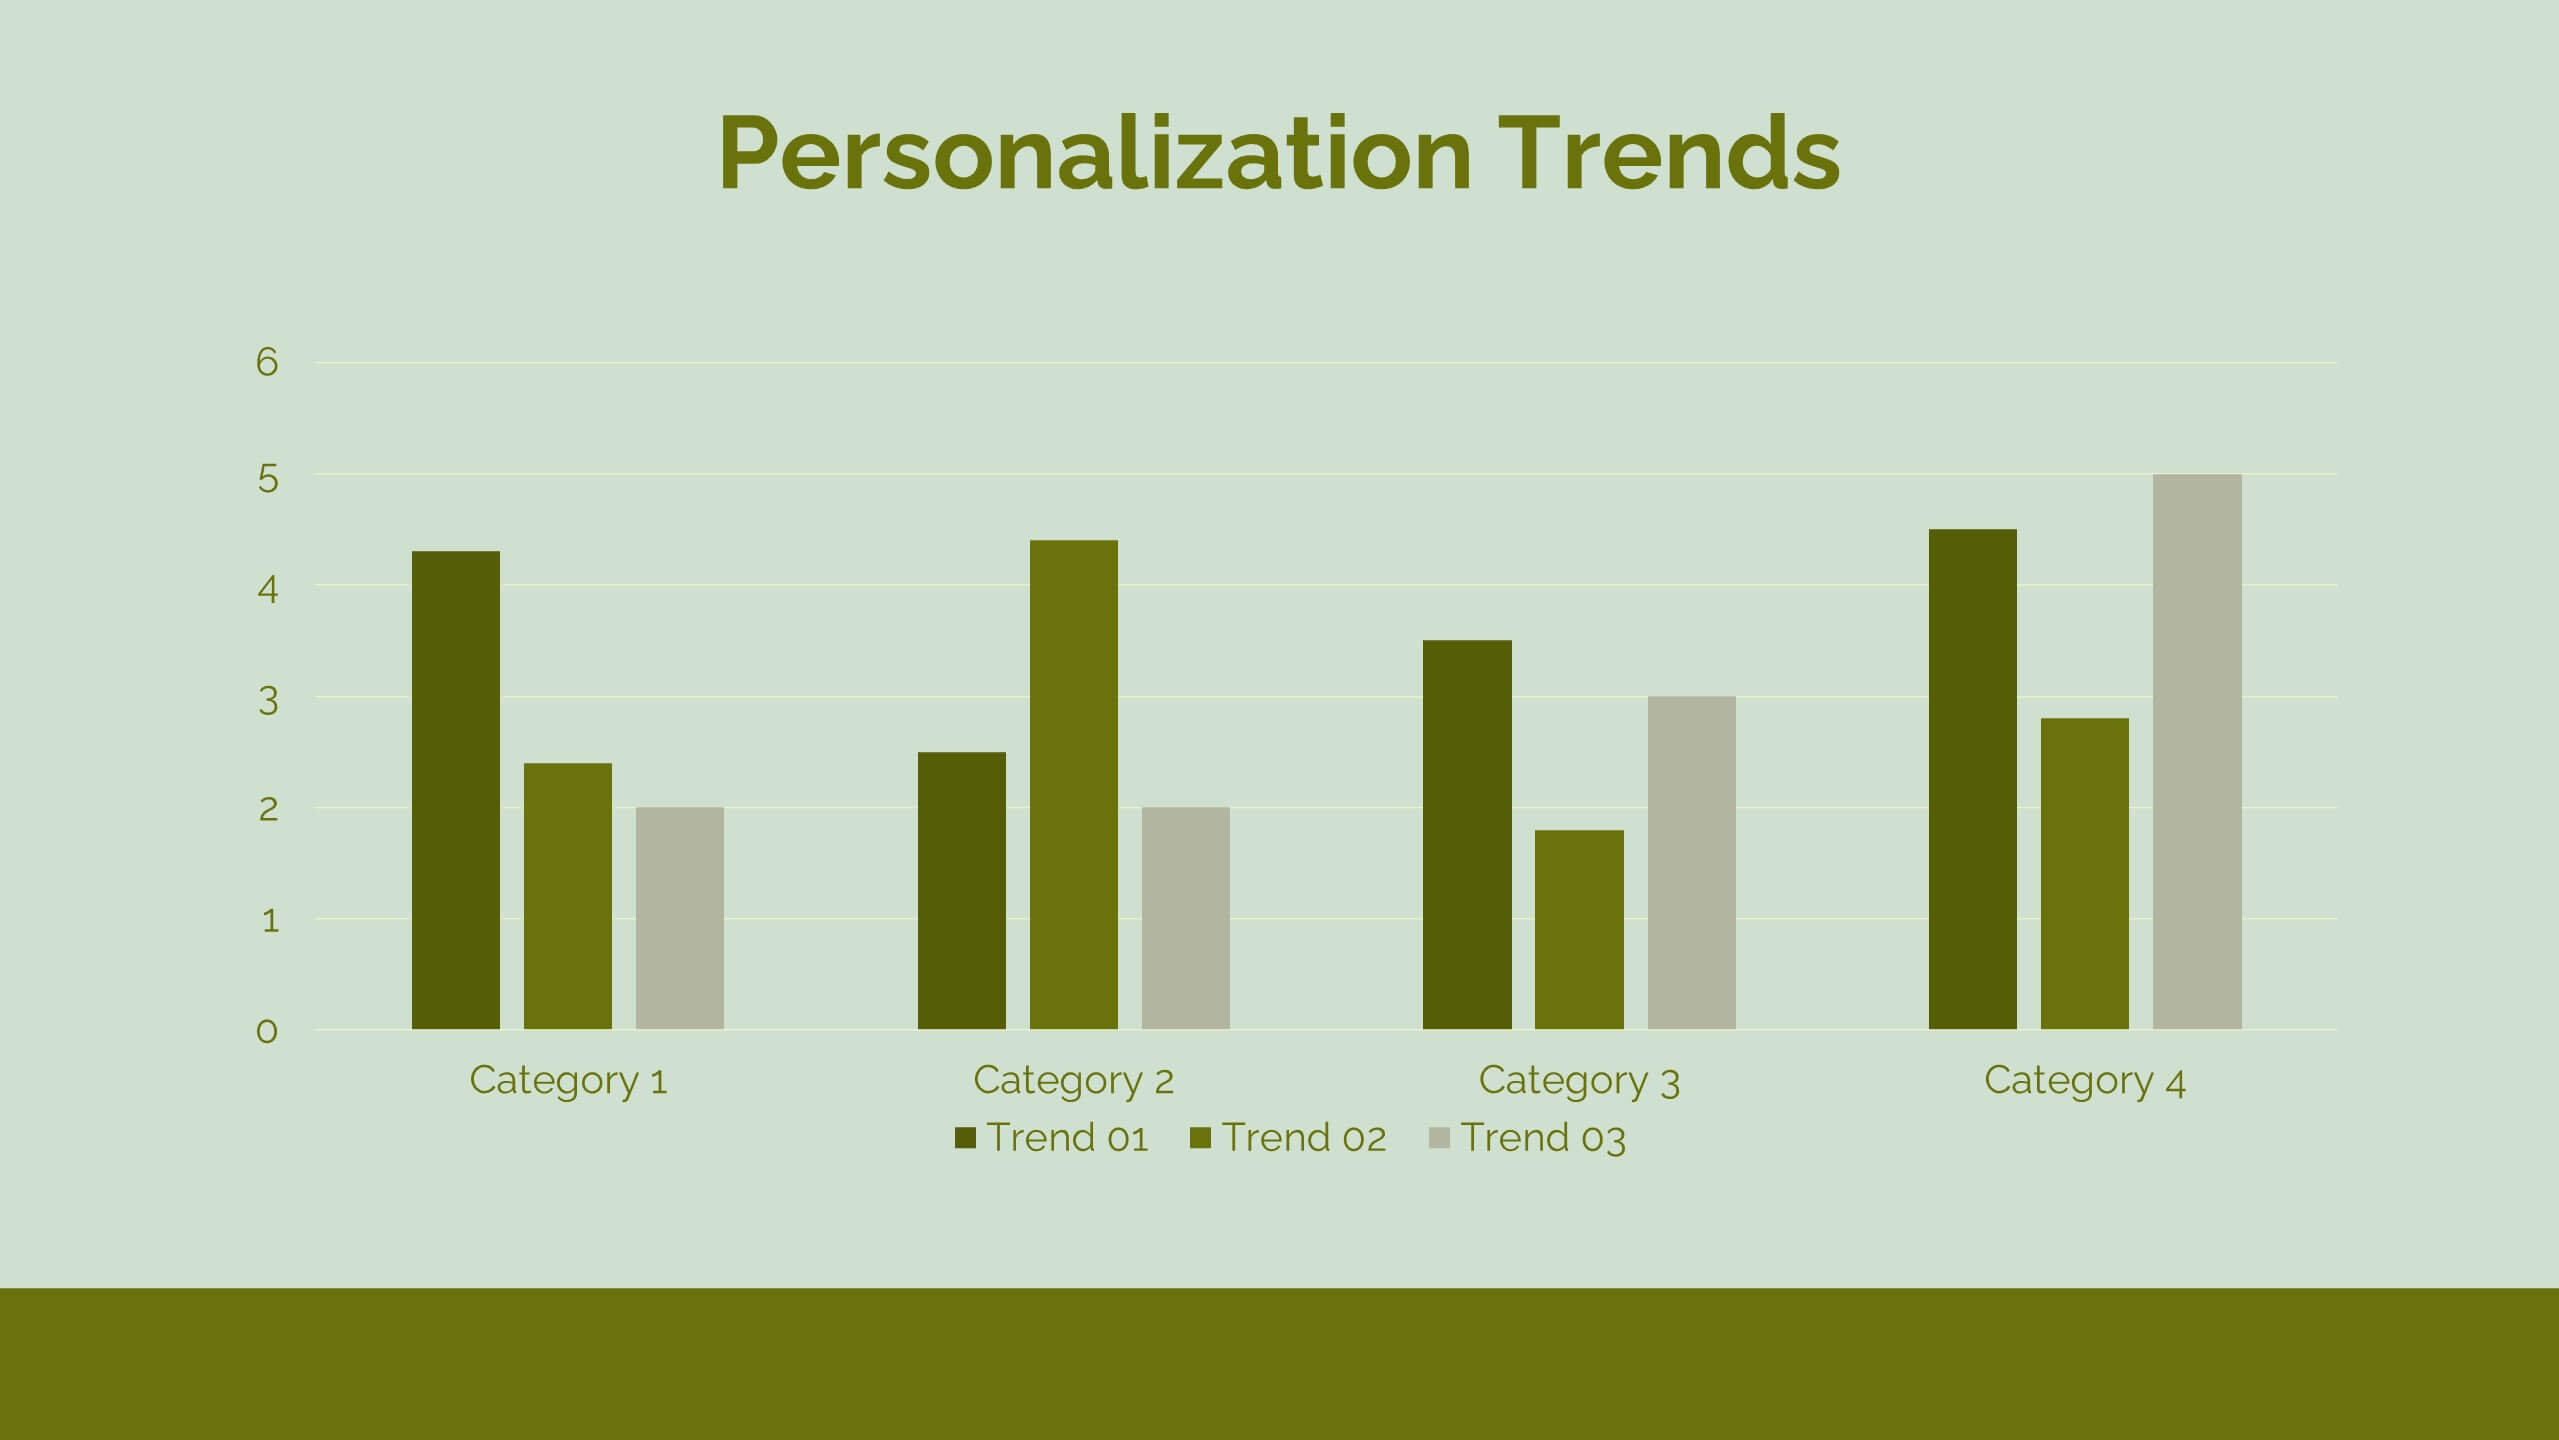
Yearly Employee Performance Review Presentation
Celebrate your team’s progress with a modern, data-rich design that’s clear, visual, and professional. This template makes it easy to present yearly performance metrics, individual achievements, and growth comparisons through engaging charts and infographics. Perfect for annual reports and reviews. Compatible with PowerPoint, Keynote, and Google Slides for effortless editing.


8 diapositivas
Airline Business Strategy Presentation
Leverage key insights into the aviation sector with the "Aviation Industry Market Analysis" presentation template. This design allows professionals in the aviation industry to effectively communicate market trends and forecasts. Its compatibility with PowerPoint, Keynote, and Google Slides ensures a versatile use across different platforms, making it ideal for industry analyses, investor meetings, or internal strategy discussions.


4 diapositivas
USA, Canada & Mexico Business Reach Presentation
Showcase your regional presence with the USA, Canada & Mexico Business Reach Presentation. This slide helps you pinpoint key business activities or initiatives across North America using colorful map markers and customizable icons. Ideal for market updates or growth plans. Fully editable in Canva, PowerPoint, and Google Slides.


6 diapositivas
Business Concepts Using Geometric Layouts Presentation
Present your key business ideas with this structured, modern layout featuring six colorful geometric segments. Ideal for showcasing strategies, goals, or processes with visual clarity. Each section allows for brief insights with clean iconography. Fully editable in PowerPoint, Google Slides, Keynote, and Canva—perfect for professional, client-facing presentations.


2 diapositivas
Detailed Buyer Profile Analysis Layout Presentation
Showcase a clear snapshot of your customer insights with this Detailed Buyer Profile Analysis Layout. This modern slide helps you outline bios, goals, and key traits using labeled icons, progress bars, and a visual profile section. Ideal for marketing teams, persona development, and product targeting. Fully editable in PowerPoint, Keynote, and Google Slides.


6 diapositivas
Corporate Sustainability Management Presentation
Step into the future of business with our Corporate Sustainability Management Presentation template. Perfect for strategists seeking to integrate eco-friendly practices, this template facilitates effective communication of sustainability goals and initiatives. It’s a powerful tool for illustrating how environmental strategies can be interwoven with business objectives to foster long-term growth. Tailored for presentations on PowerPoint, Keynote, and Google Slides, it helps leaders inspire action and commitment to sustainability across their organizations.


6 diapositivas
Profit Threshold Break-Even Calculation Presentation
Illustrate financial performance with this profit threshold timeline. The layout spans from big loss to high profit, marking each stage with flag icons and editable labels. Ideal for break-even analysis, sales strategies, or ROI comparisons. Easily customizable in PowerPoint, Keynote, and Google Slides to match your brand’s visual identity.


8 diapositivas
Company Vision and Strategic Direction Presentation
Present your company’s long-term goals with clarity using the Company Vision and Strategic Direction Presentation. This clean, icon-led layout helps communicate your vision, focus areas, and roadmap in a linear, easy-to-follow format. Ideal for executive updates, investor decks, or team briefings. Compatible with PowerPoint, Canva, and Google Slides.


20 diapositivas
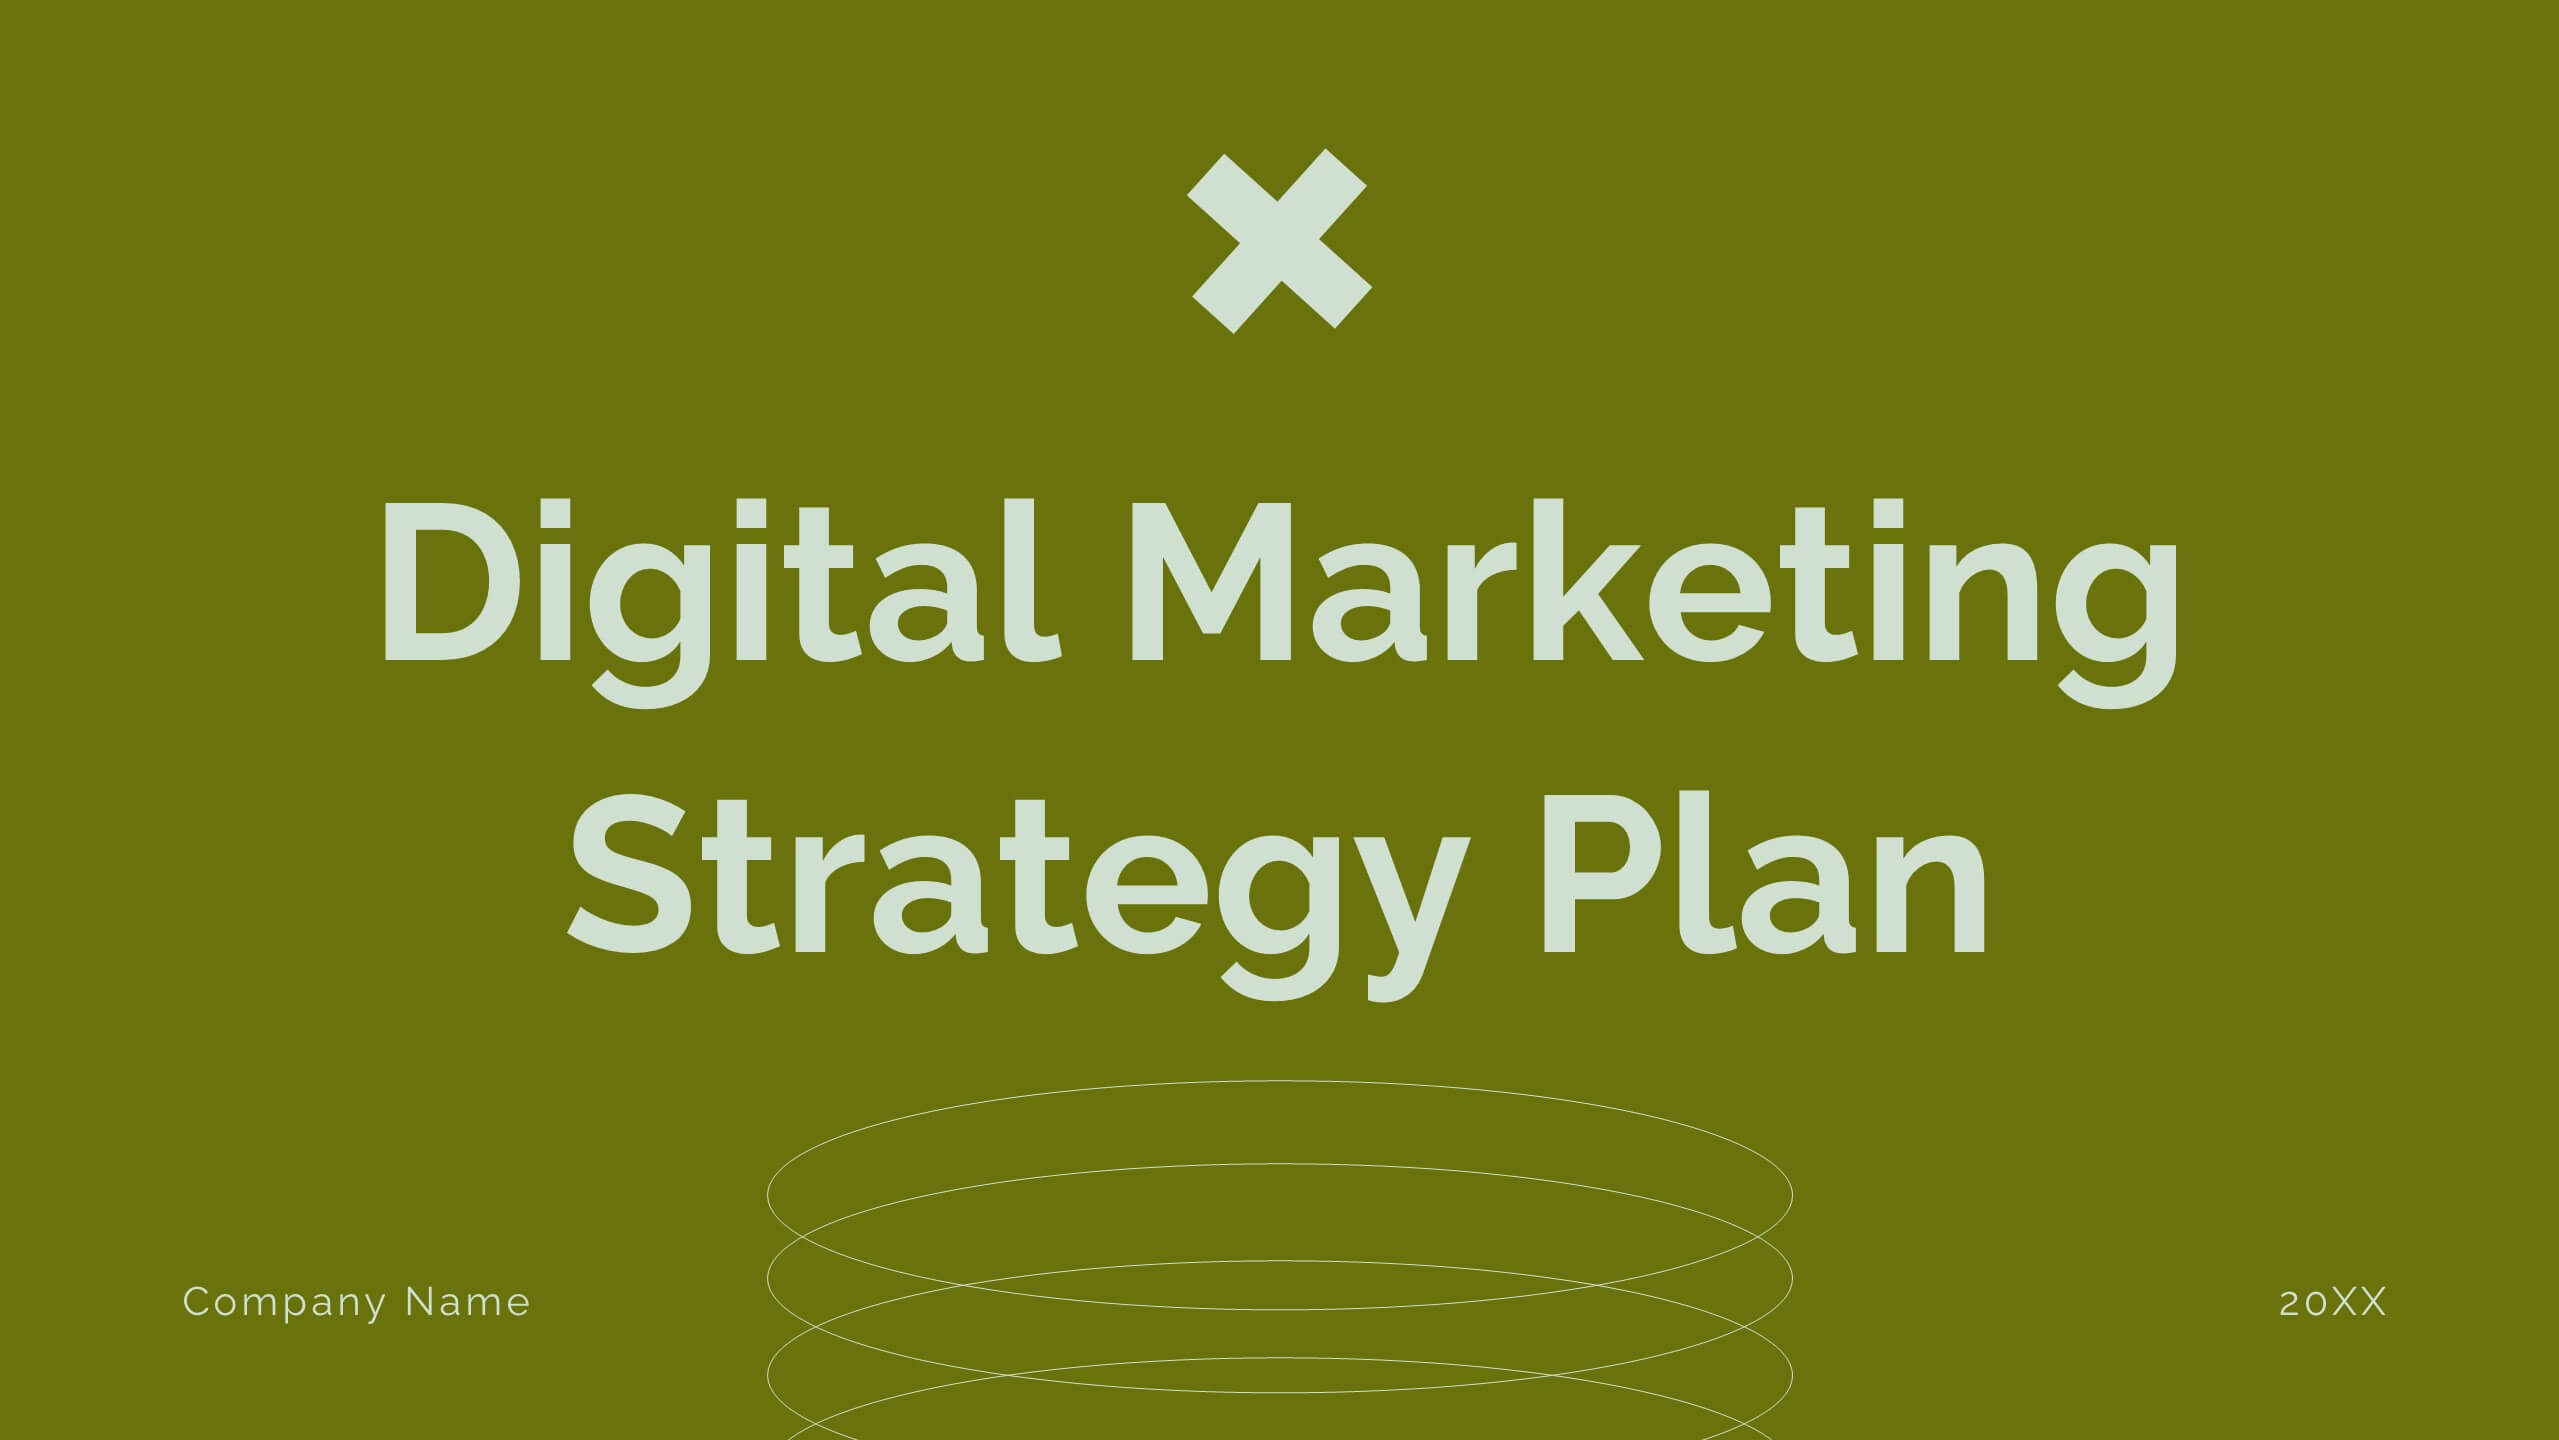
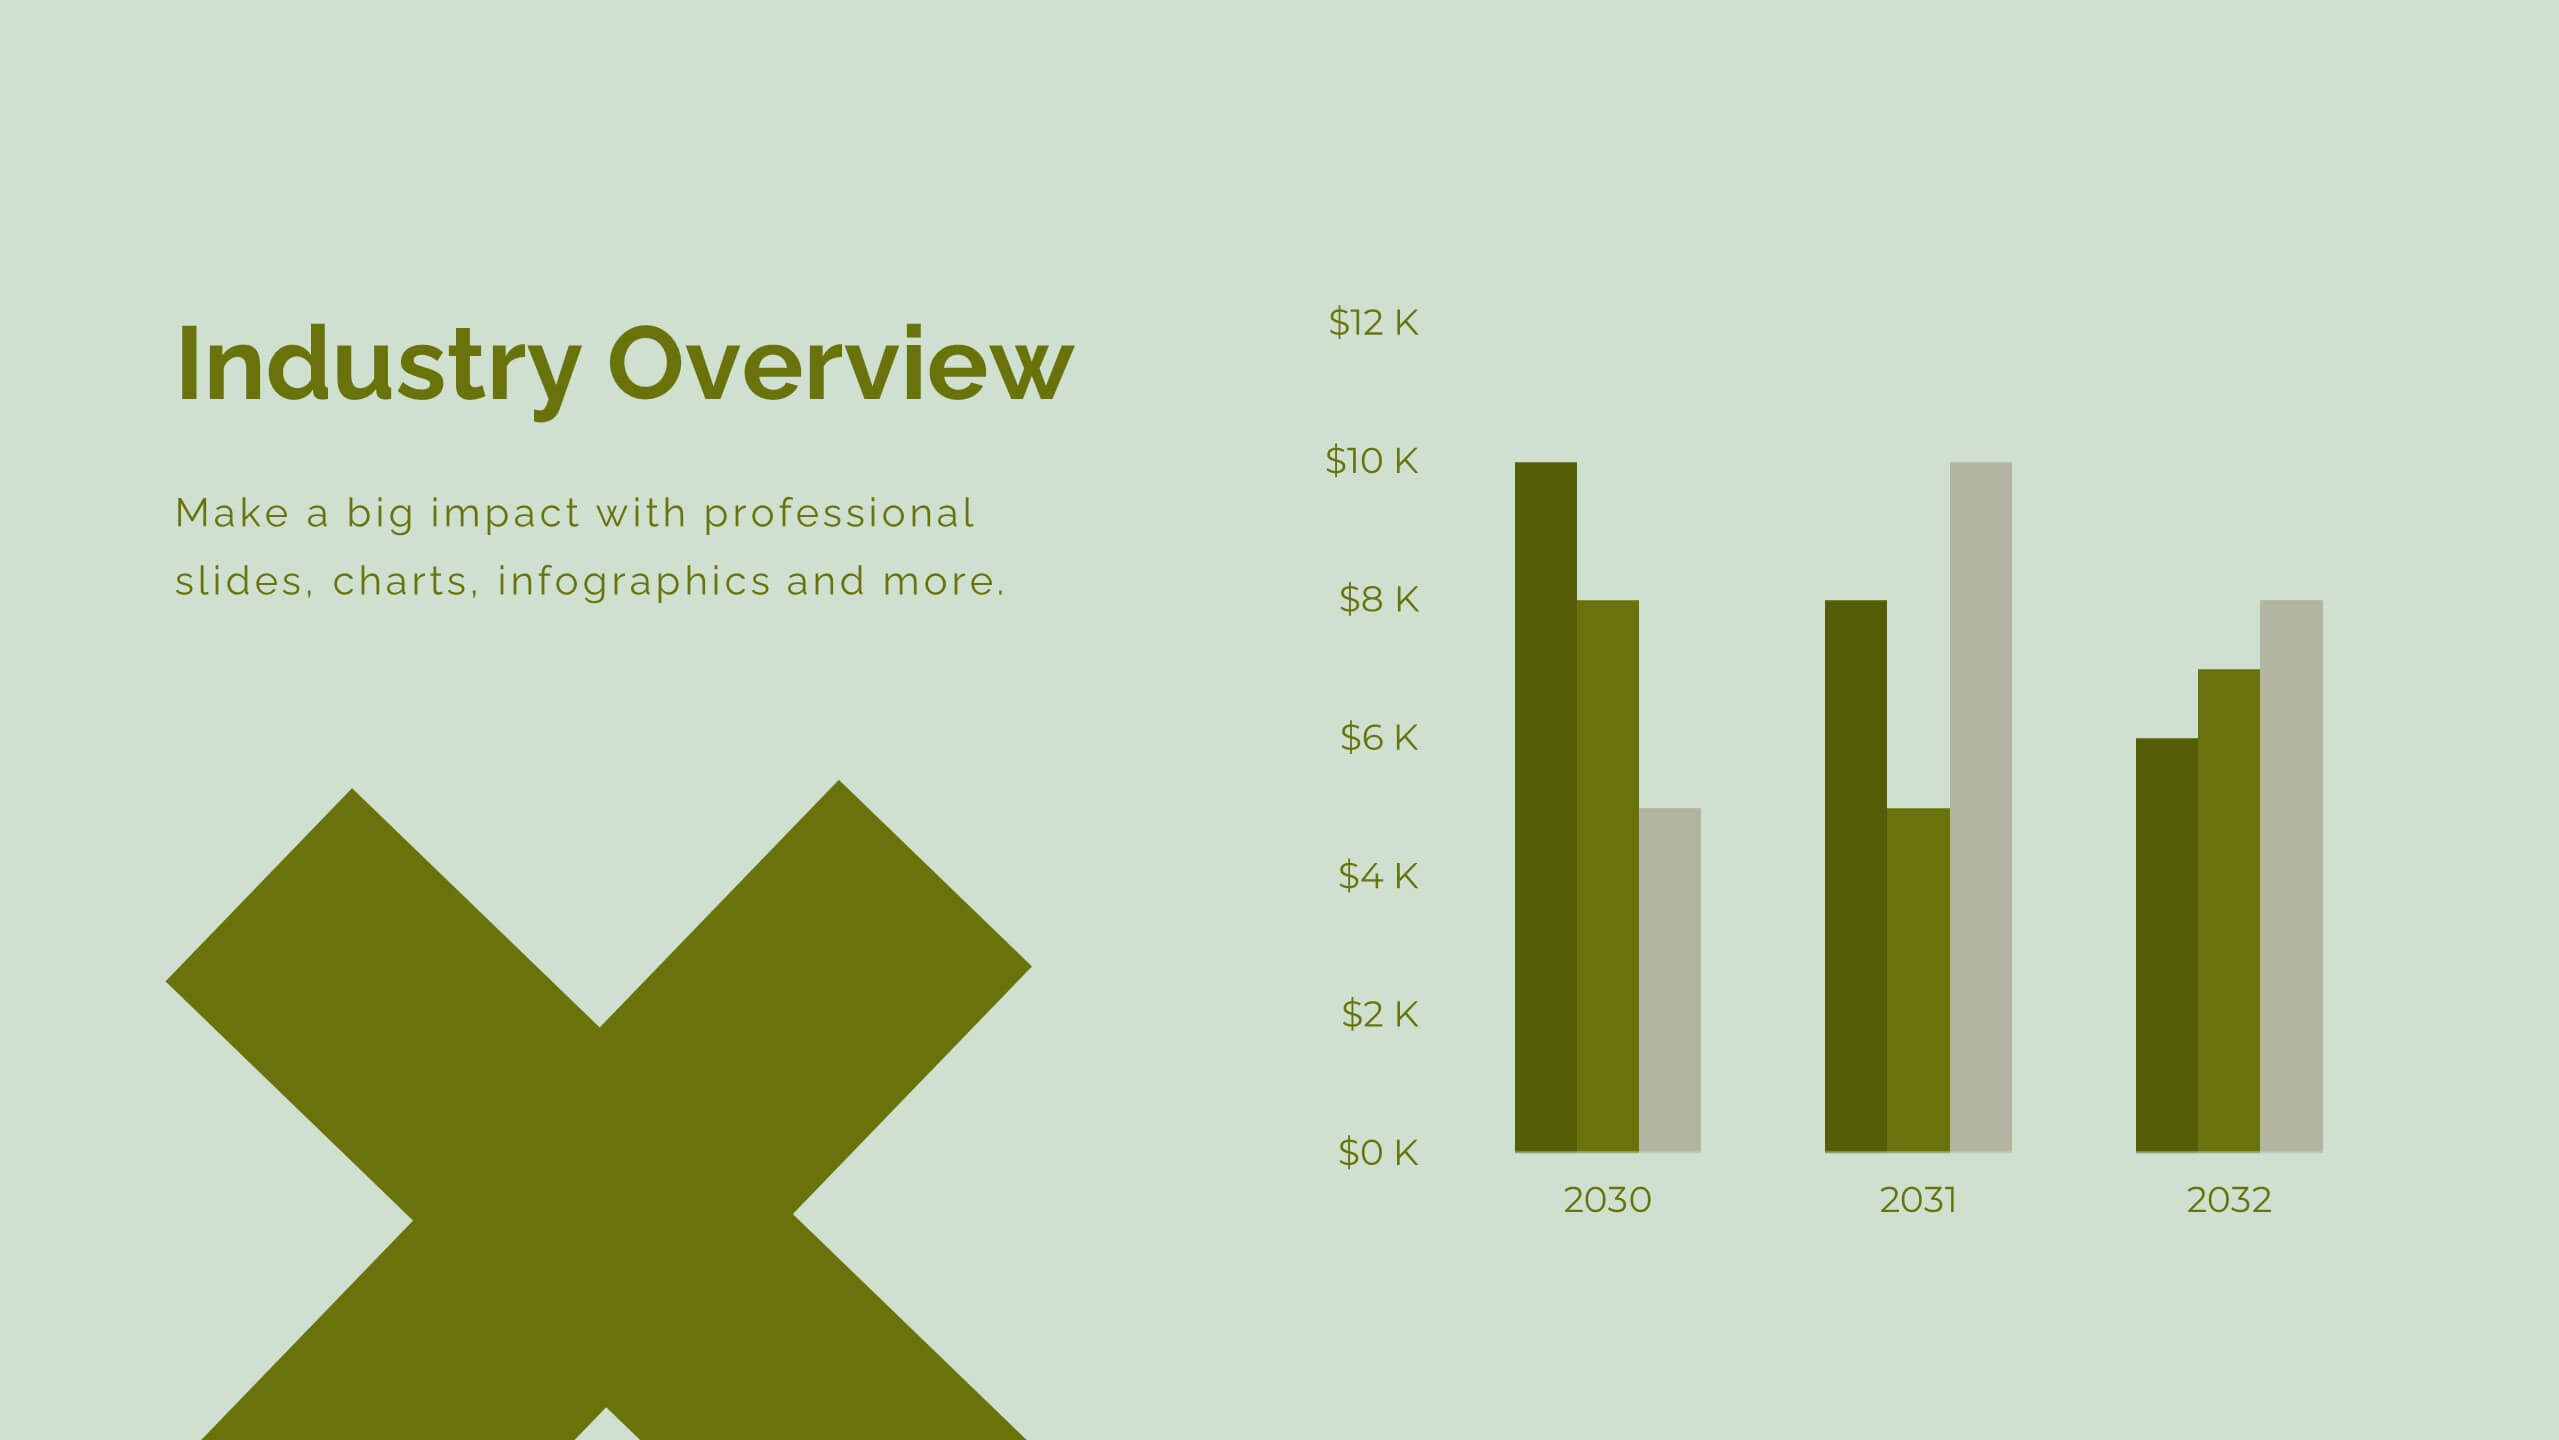
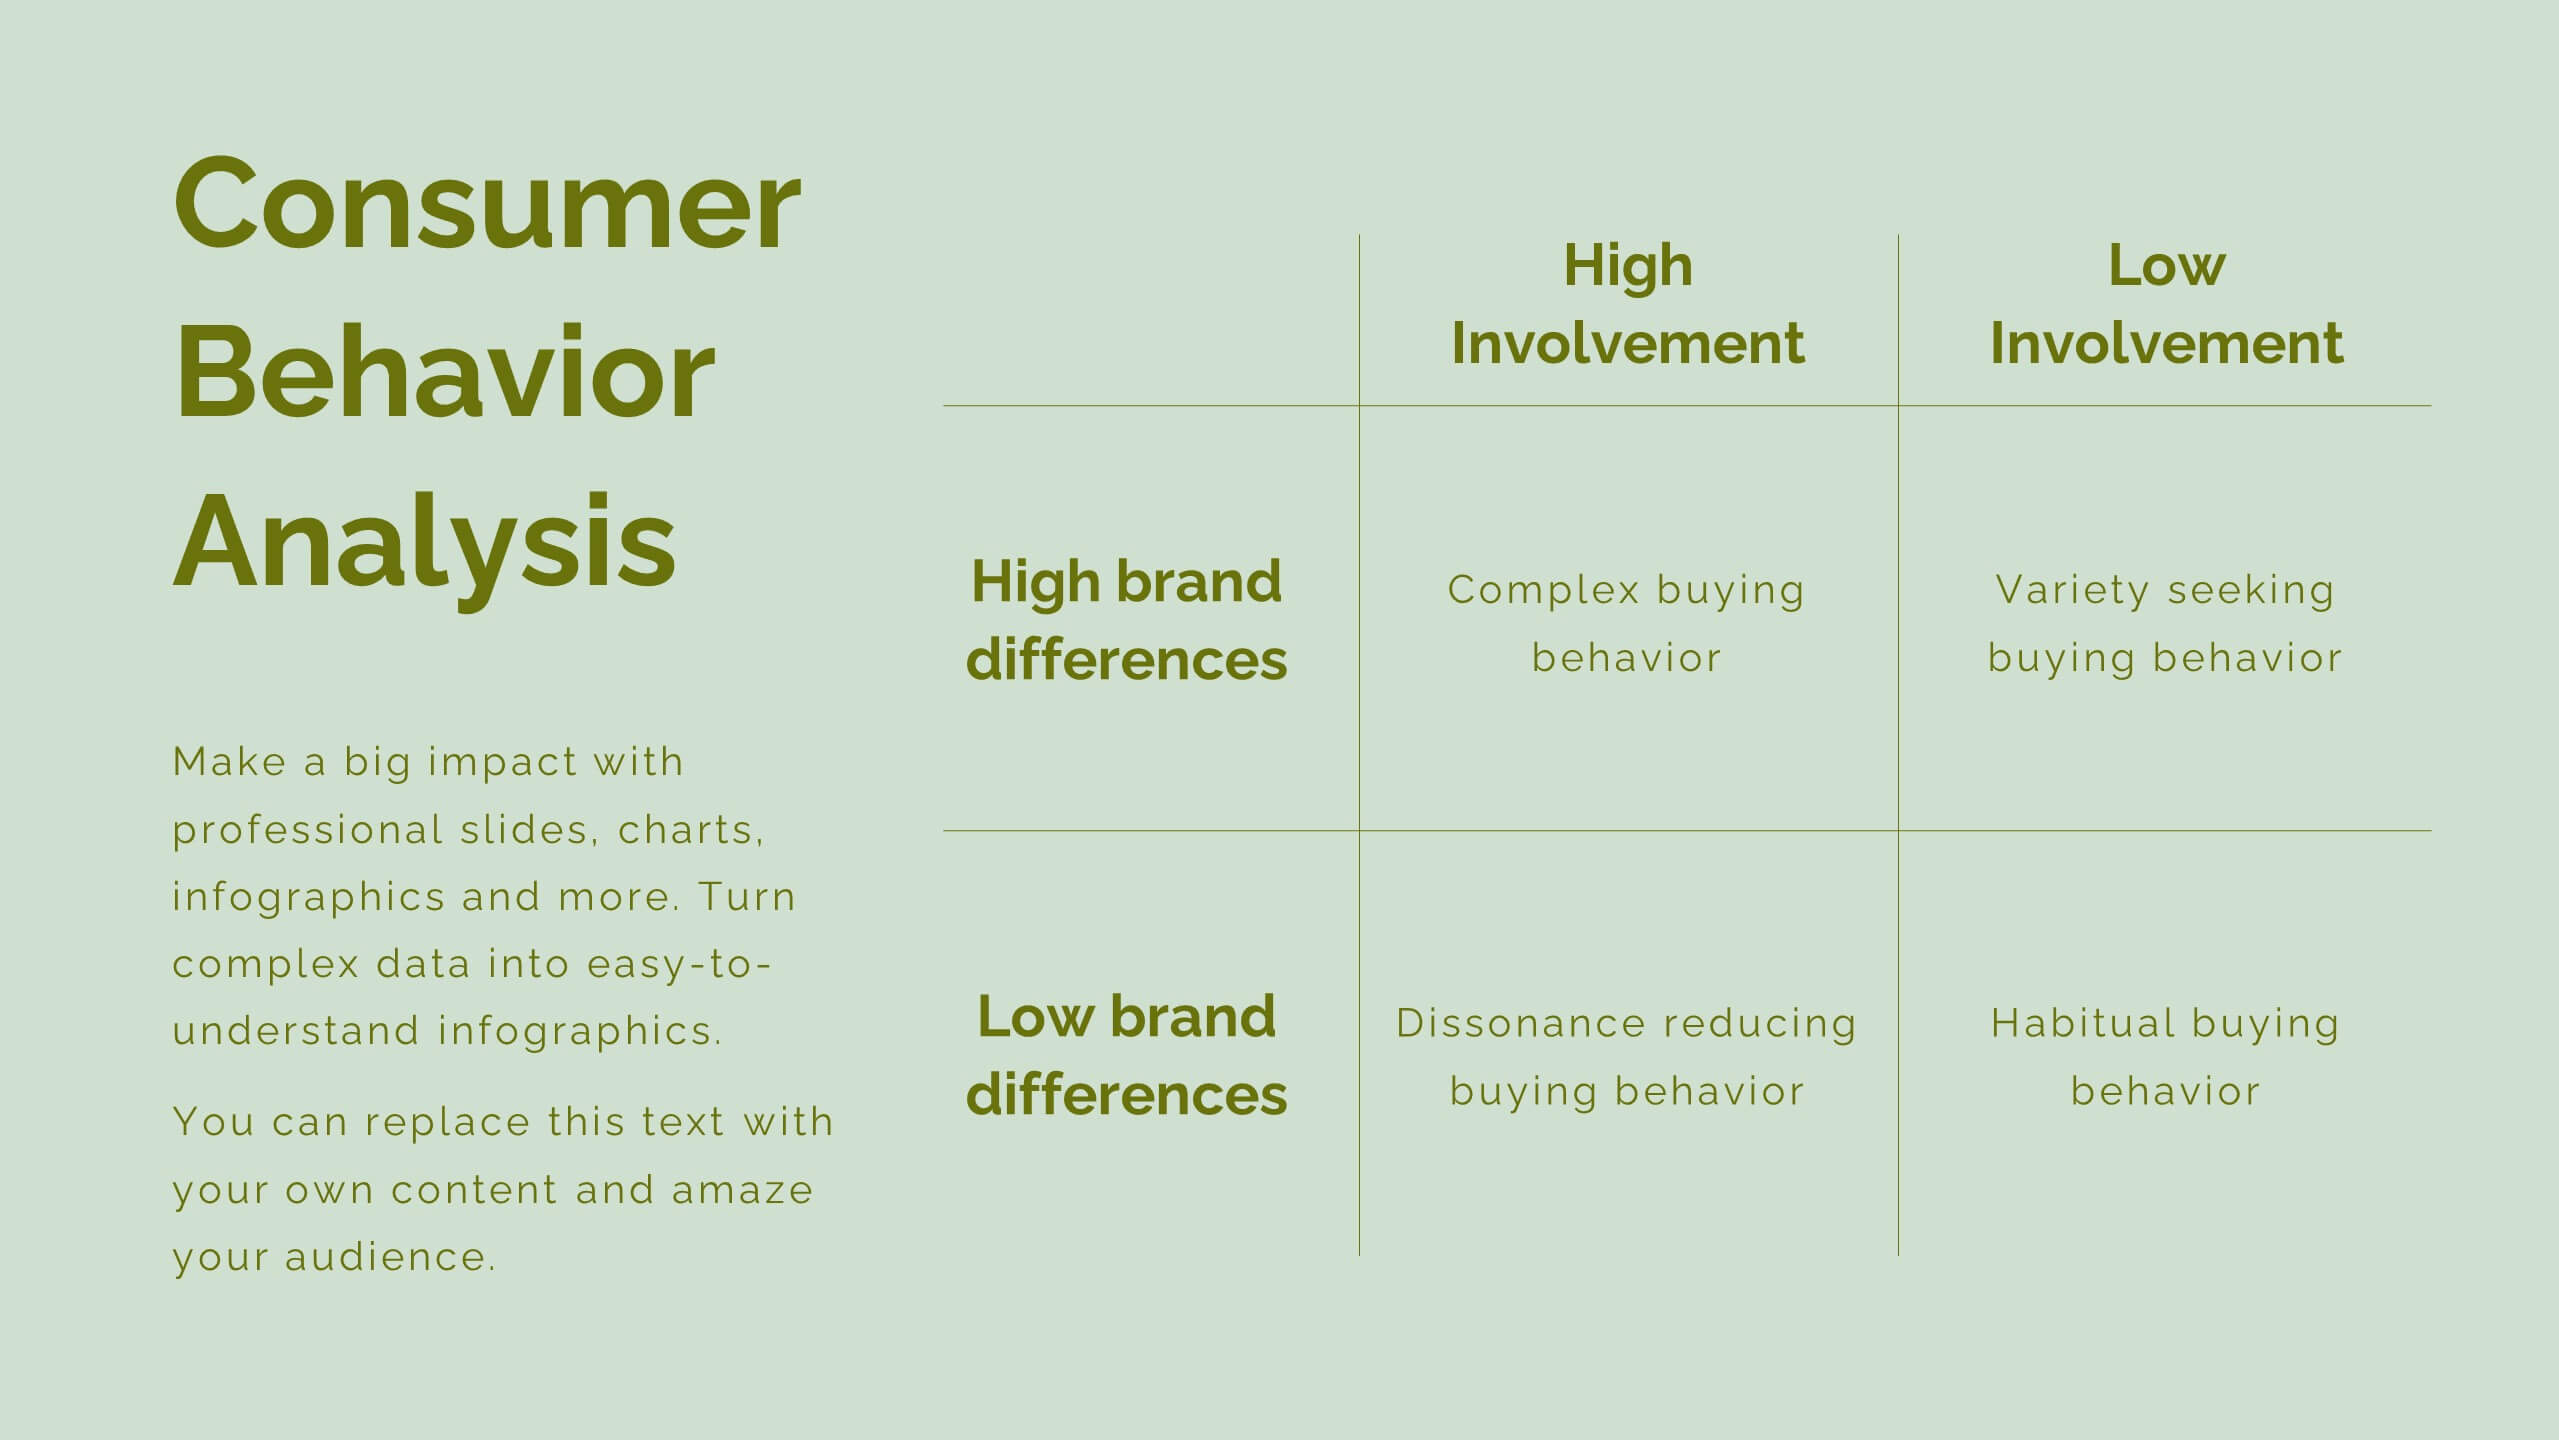
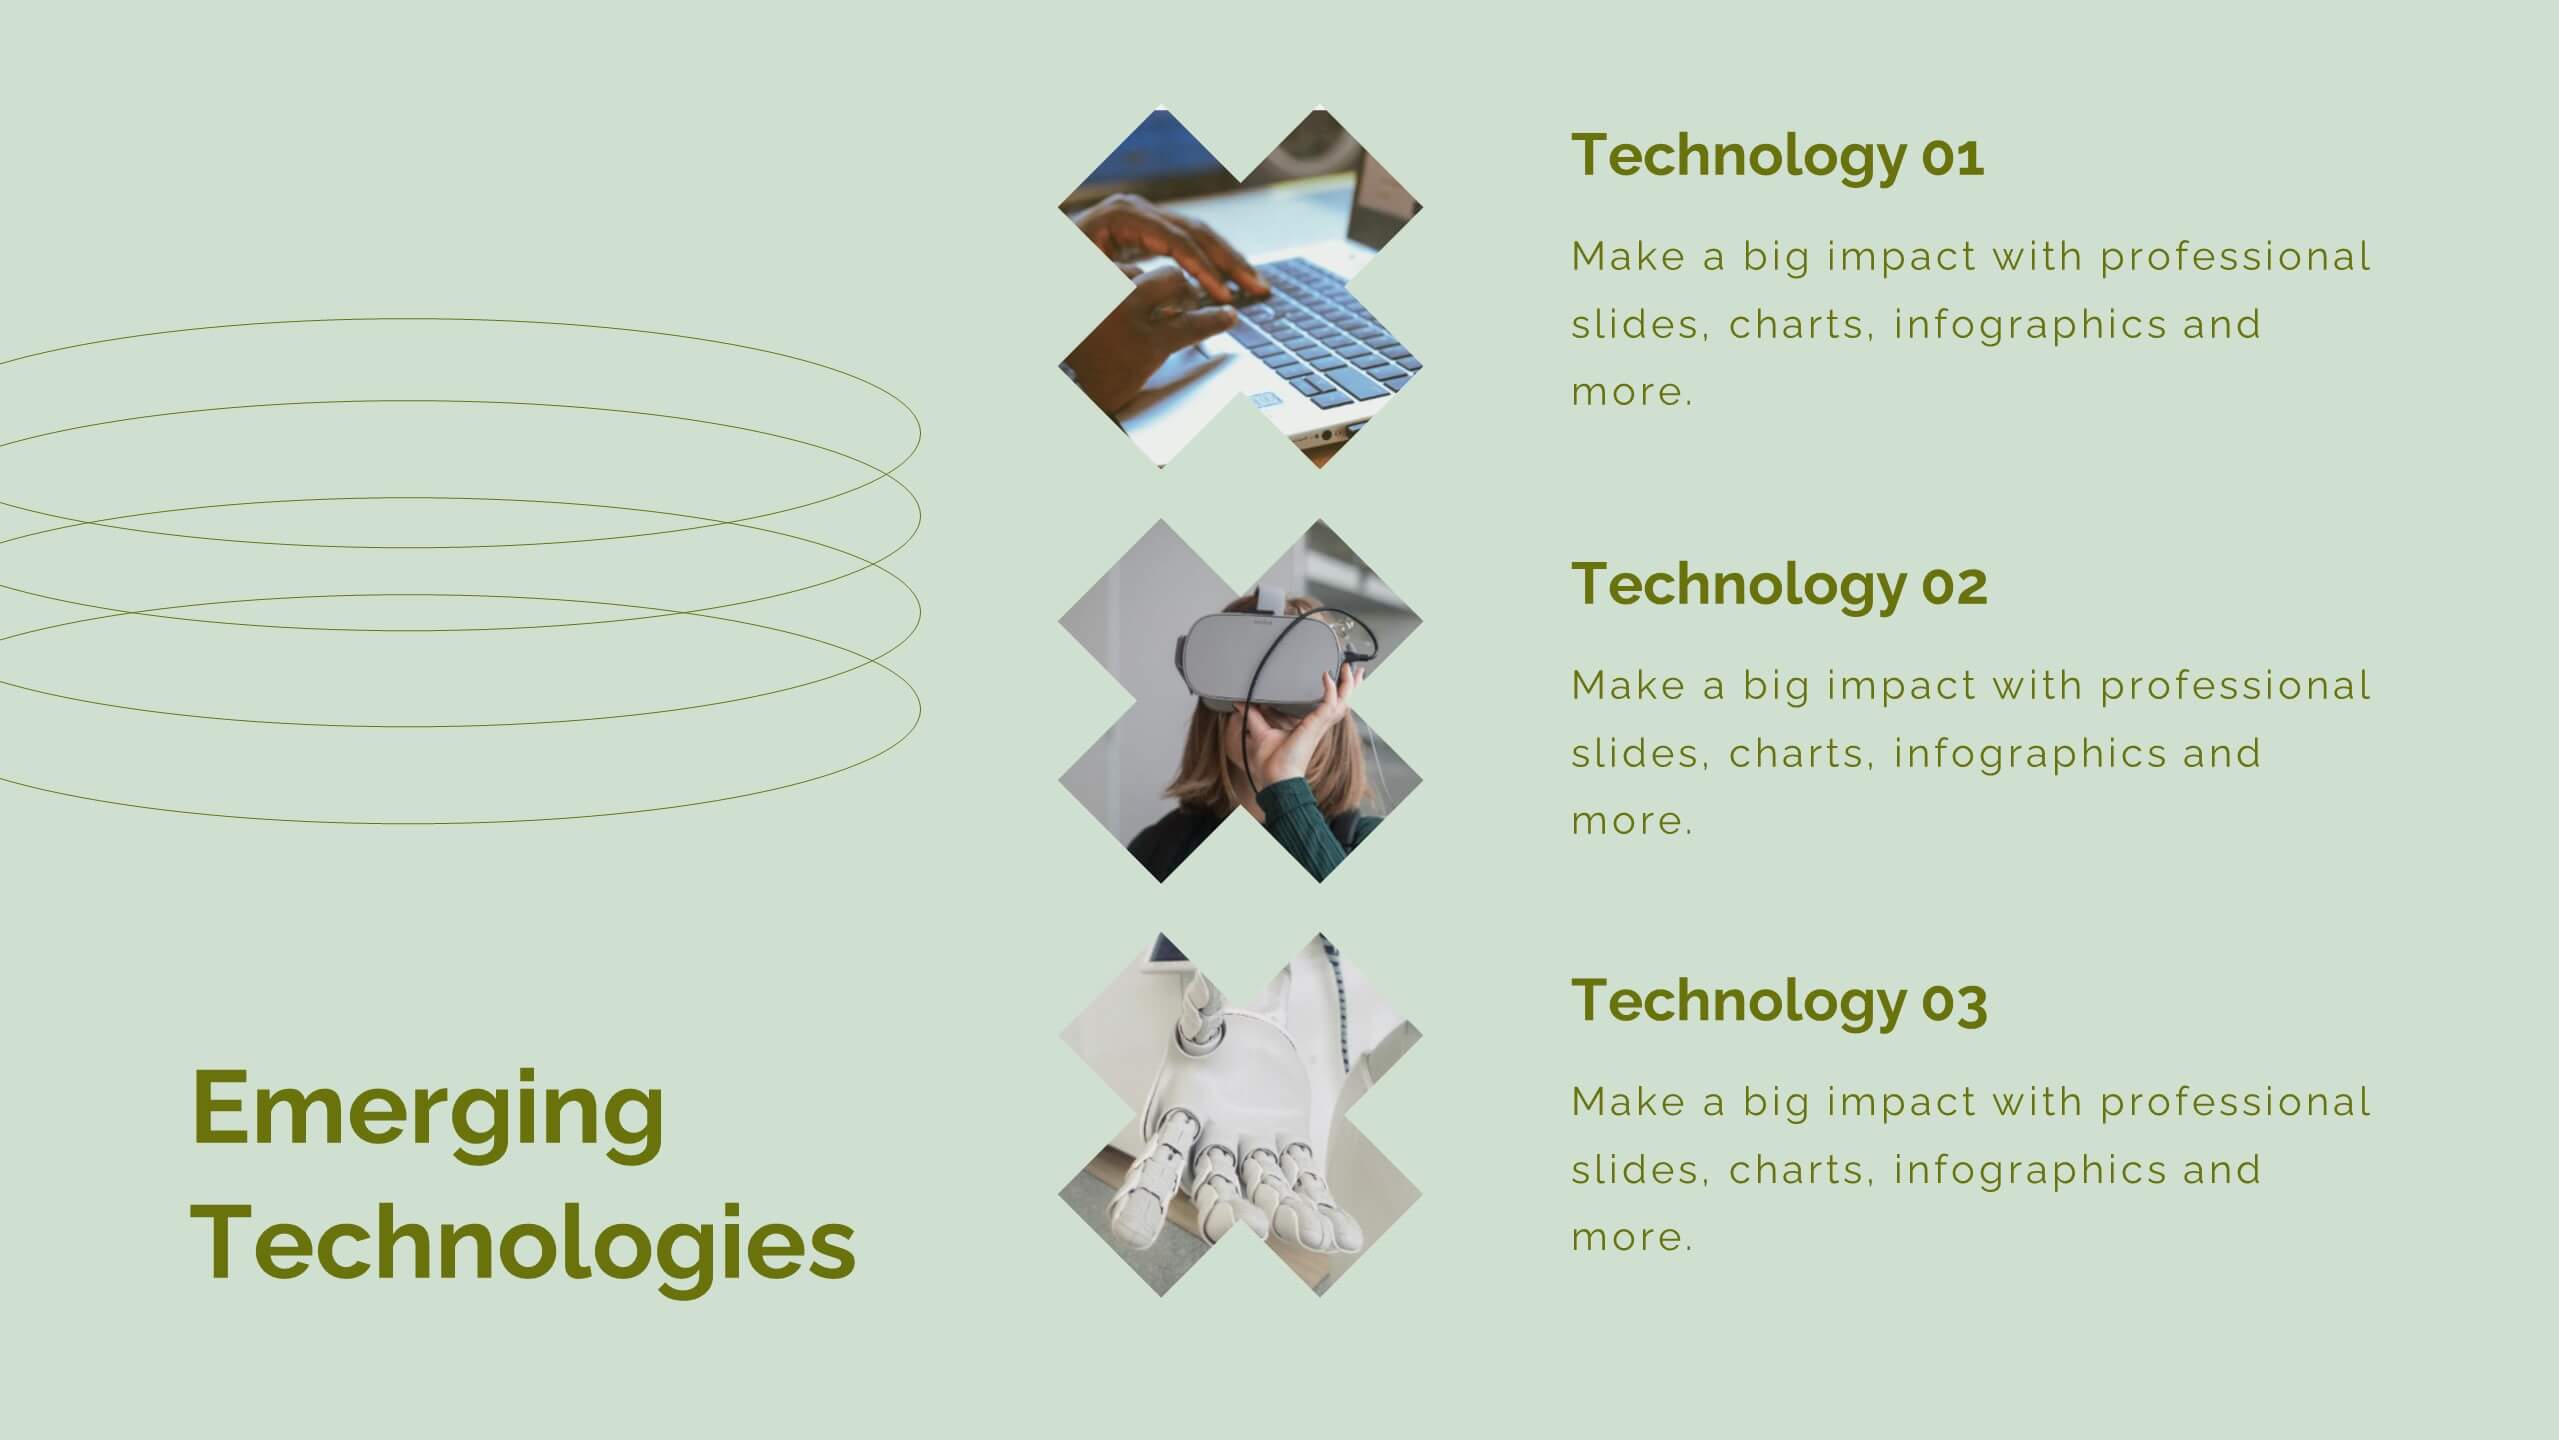
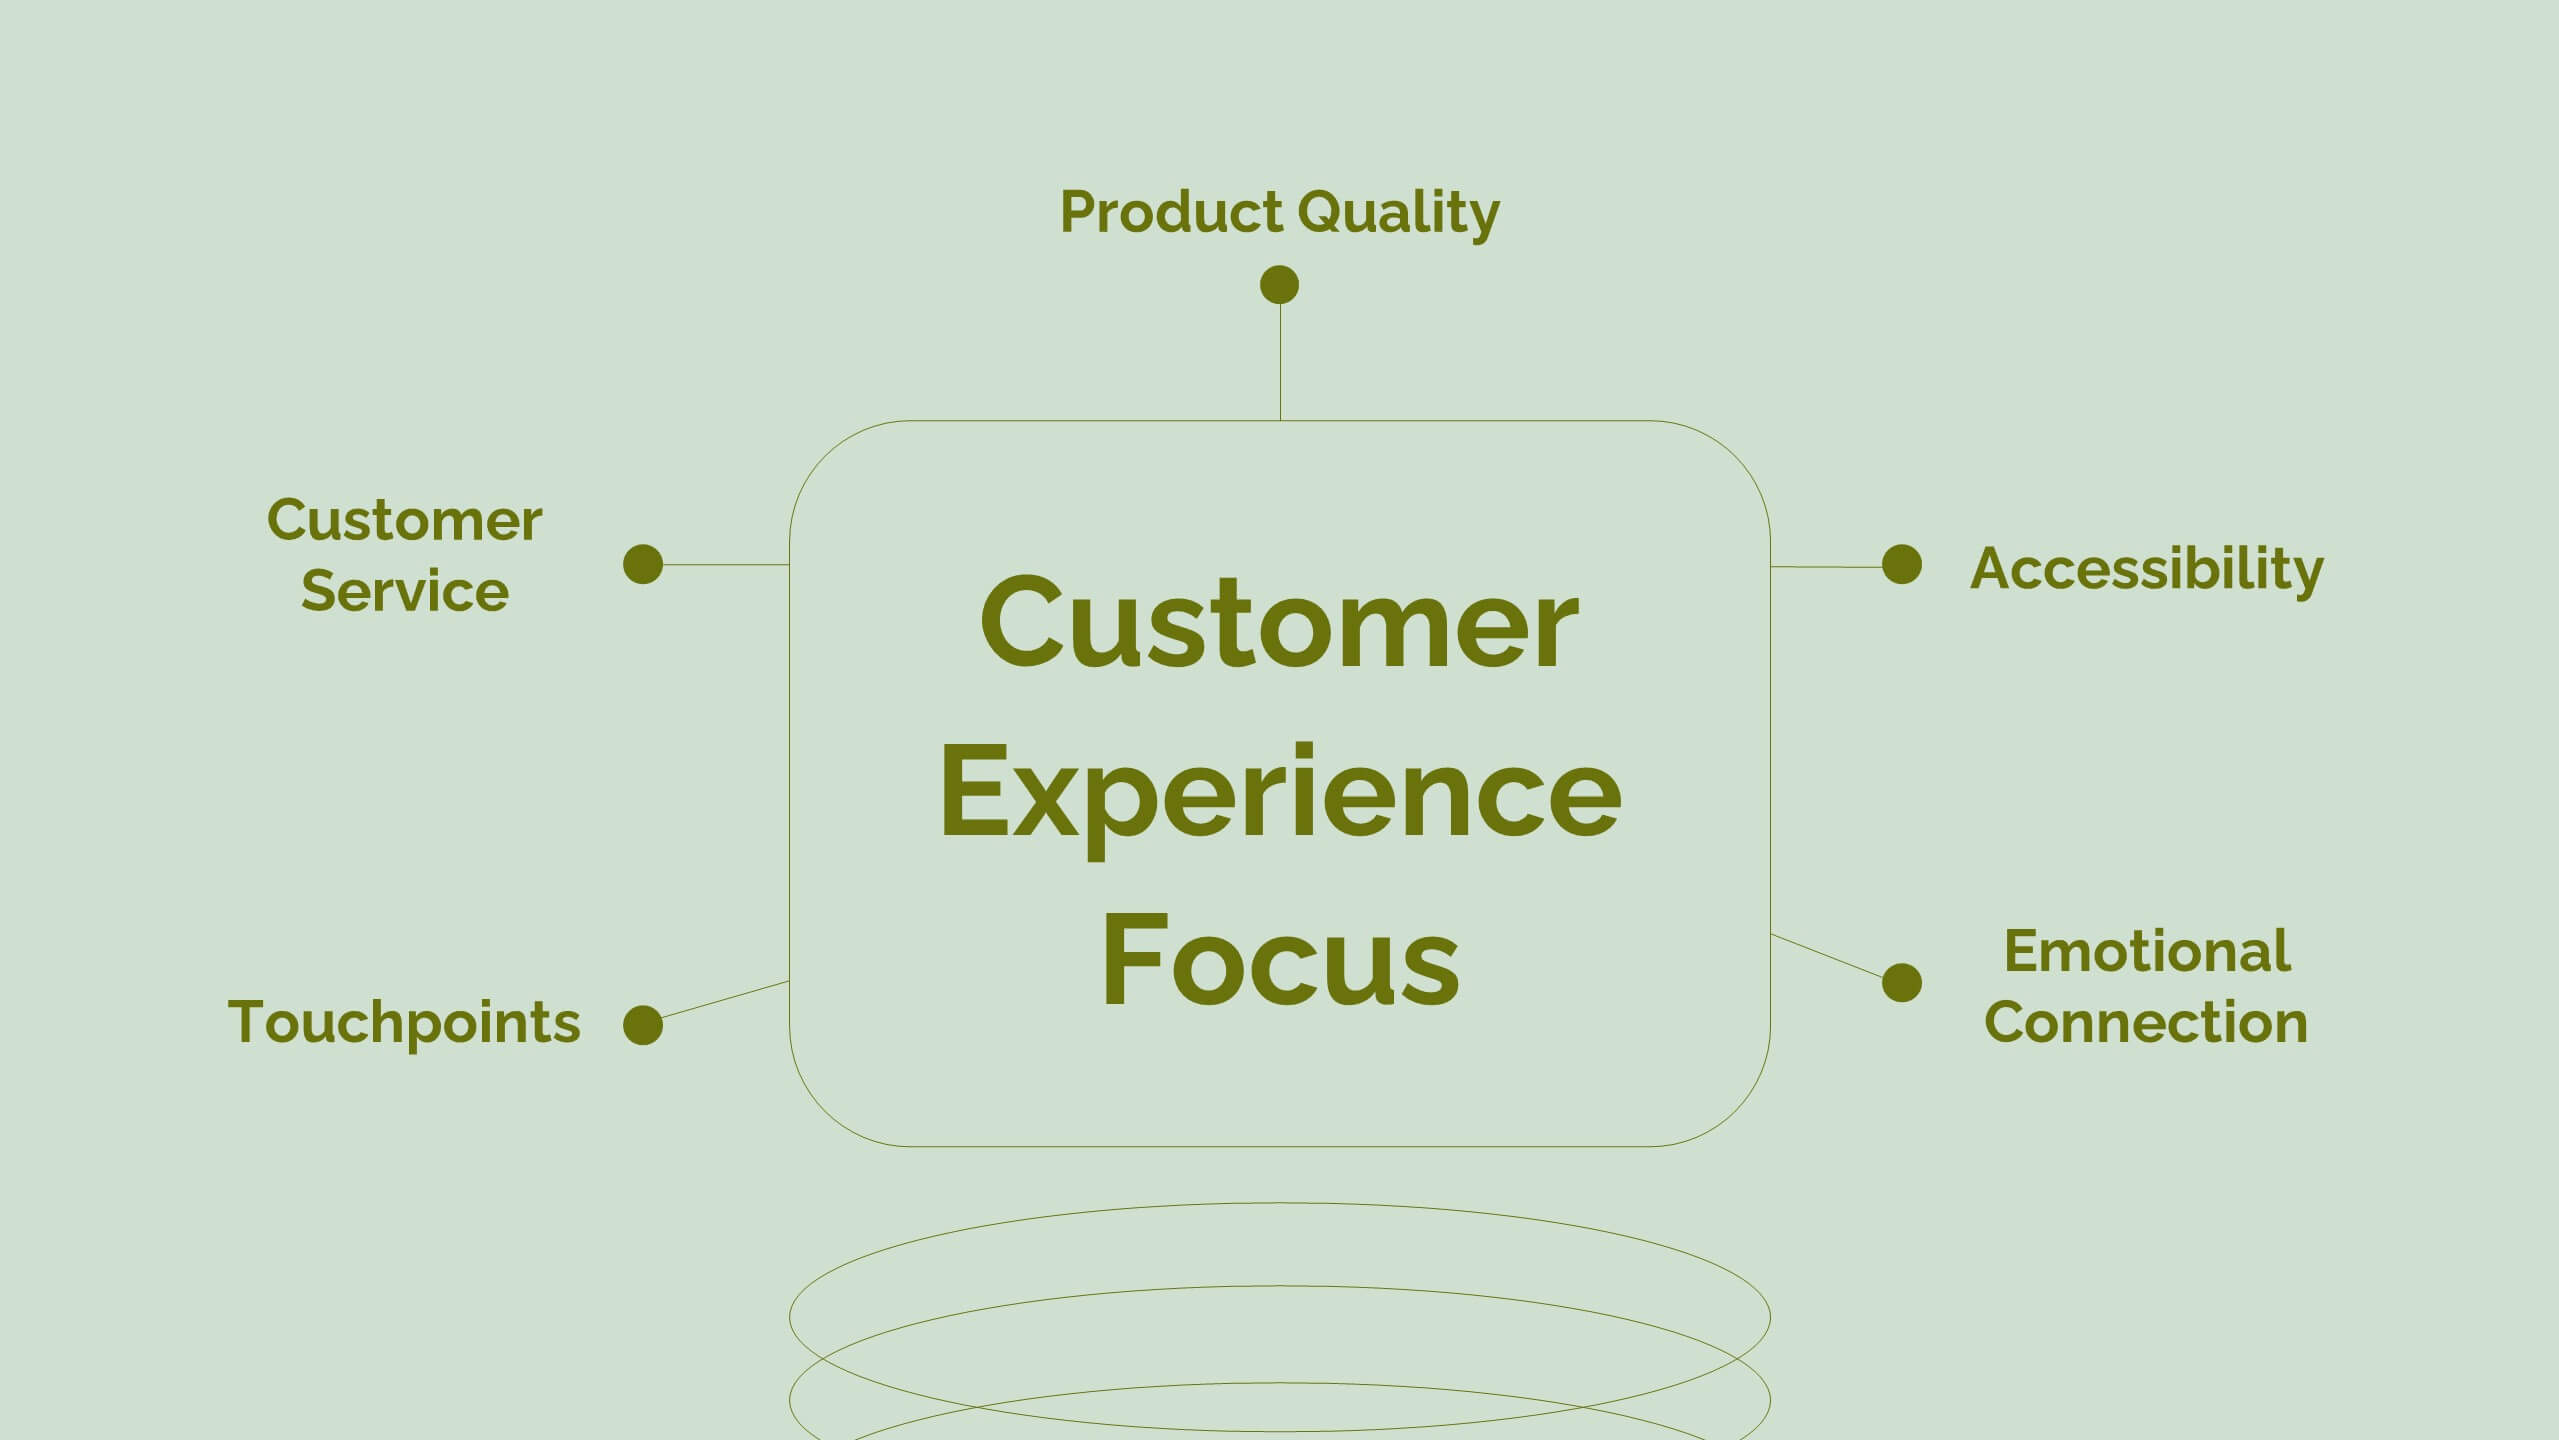
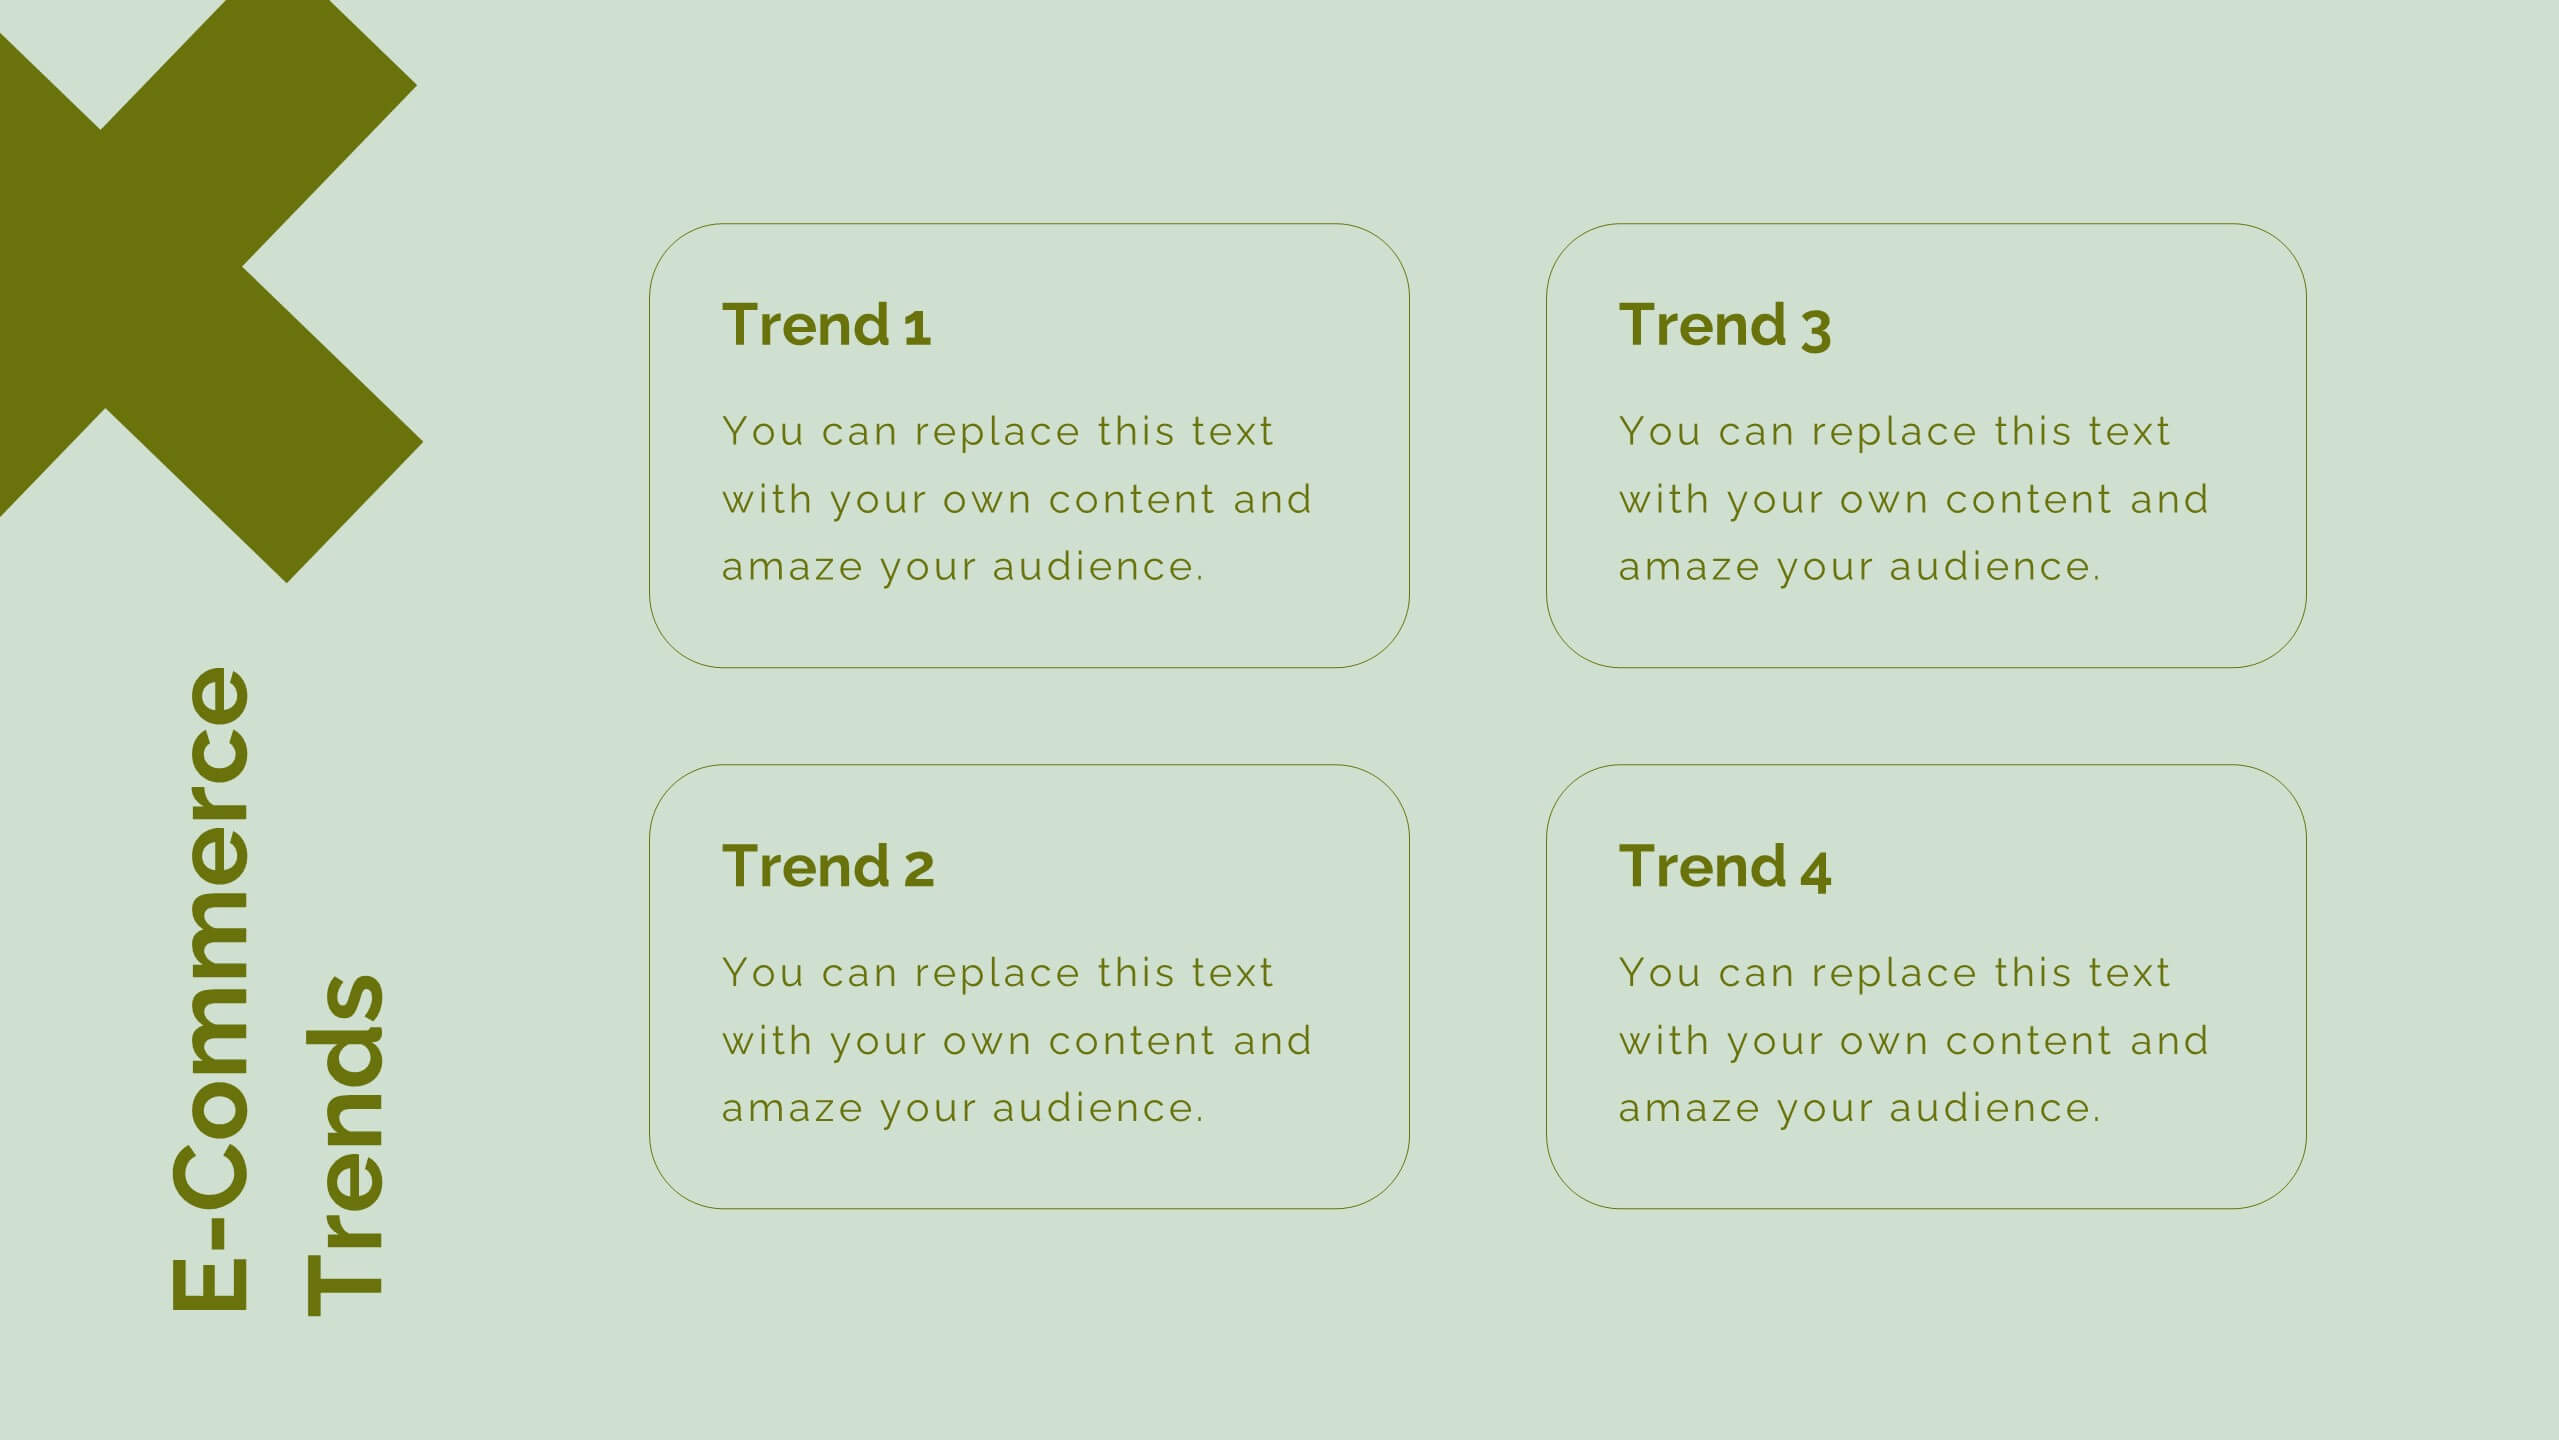
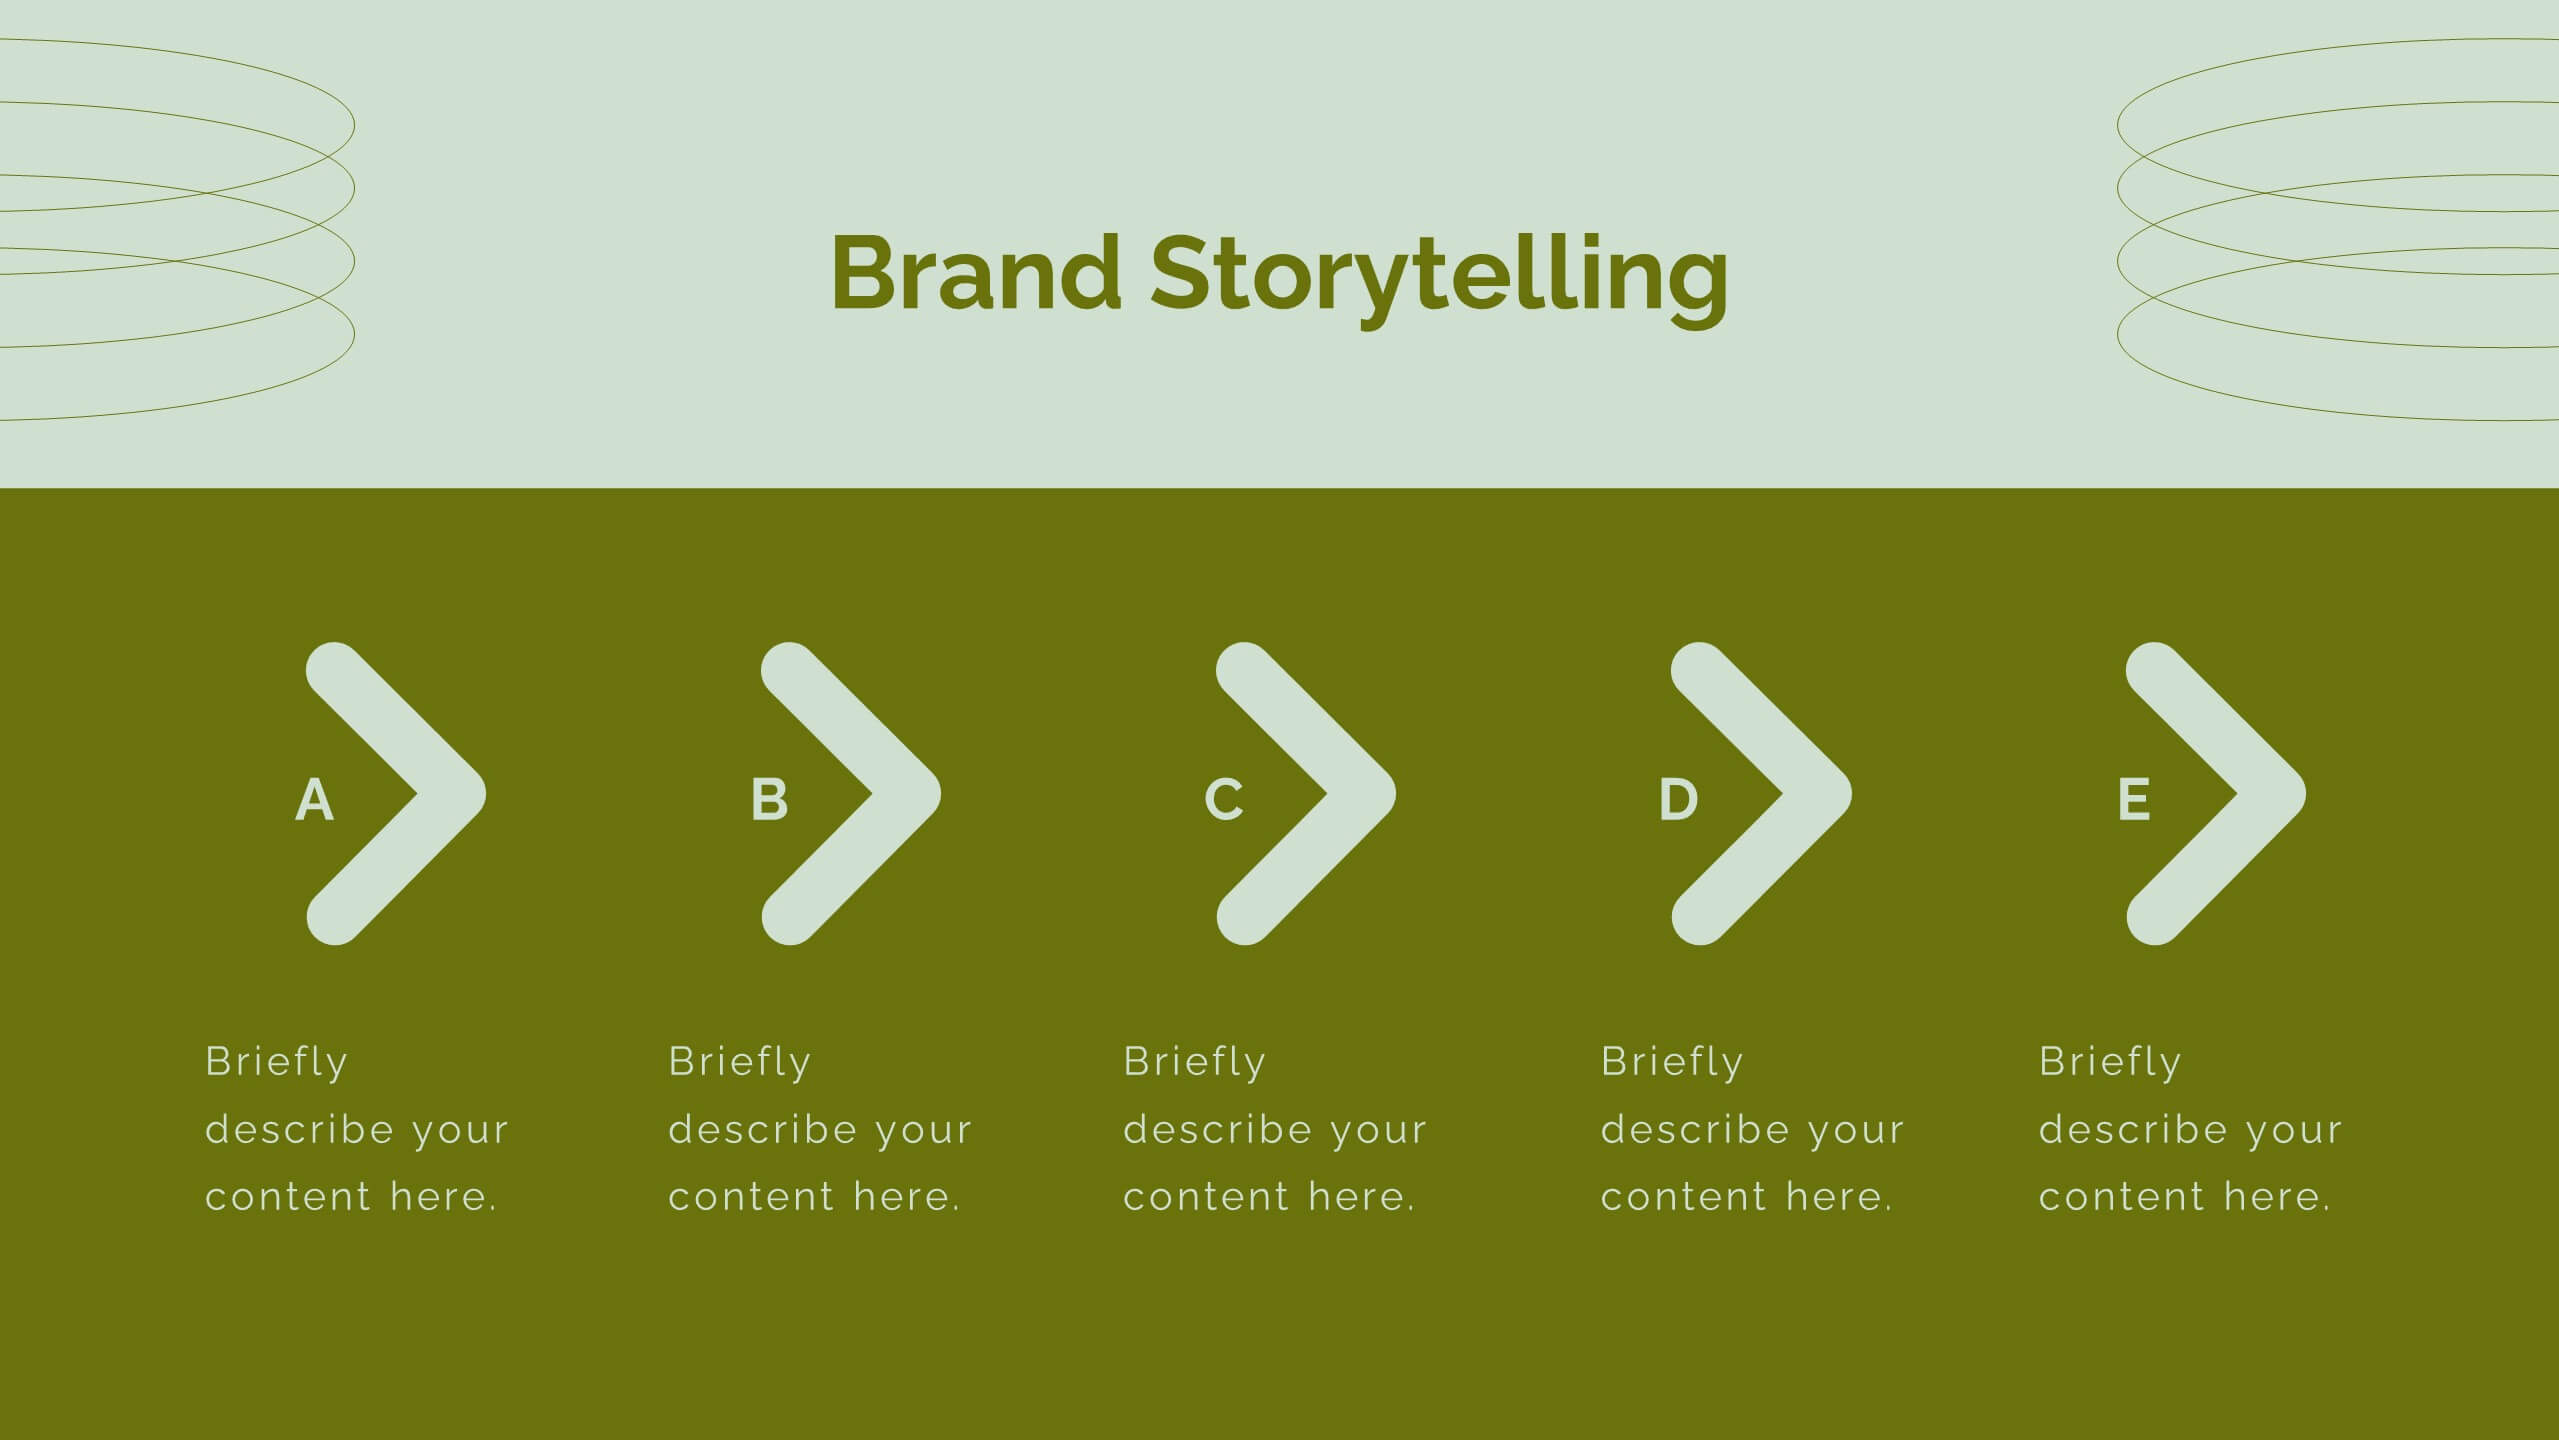
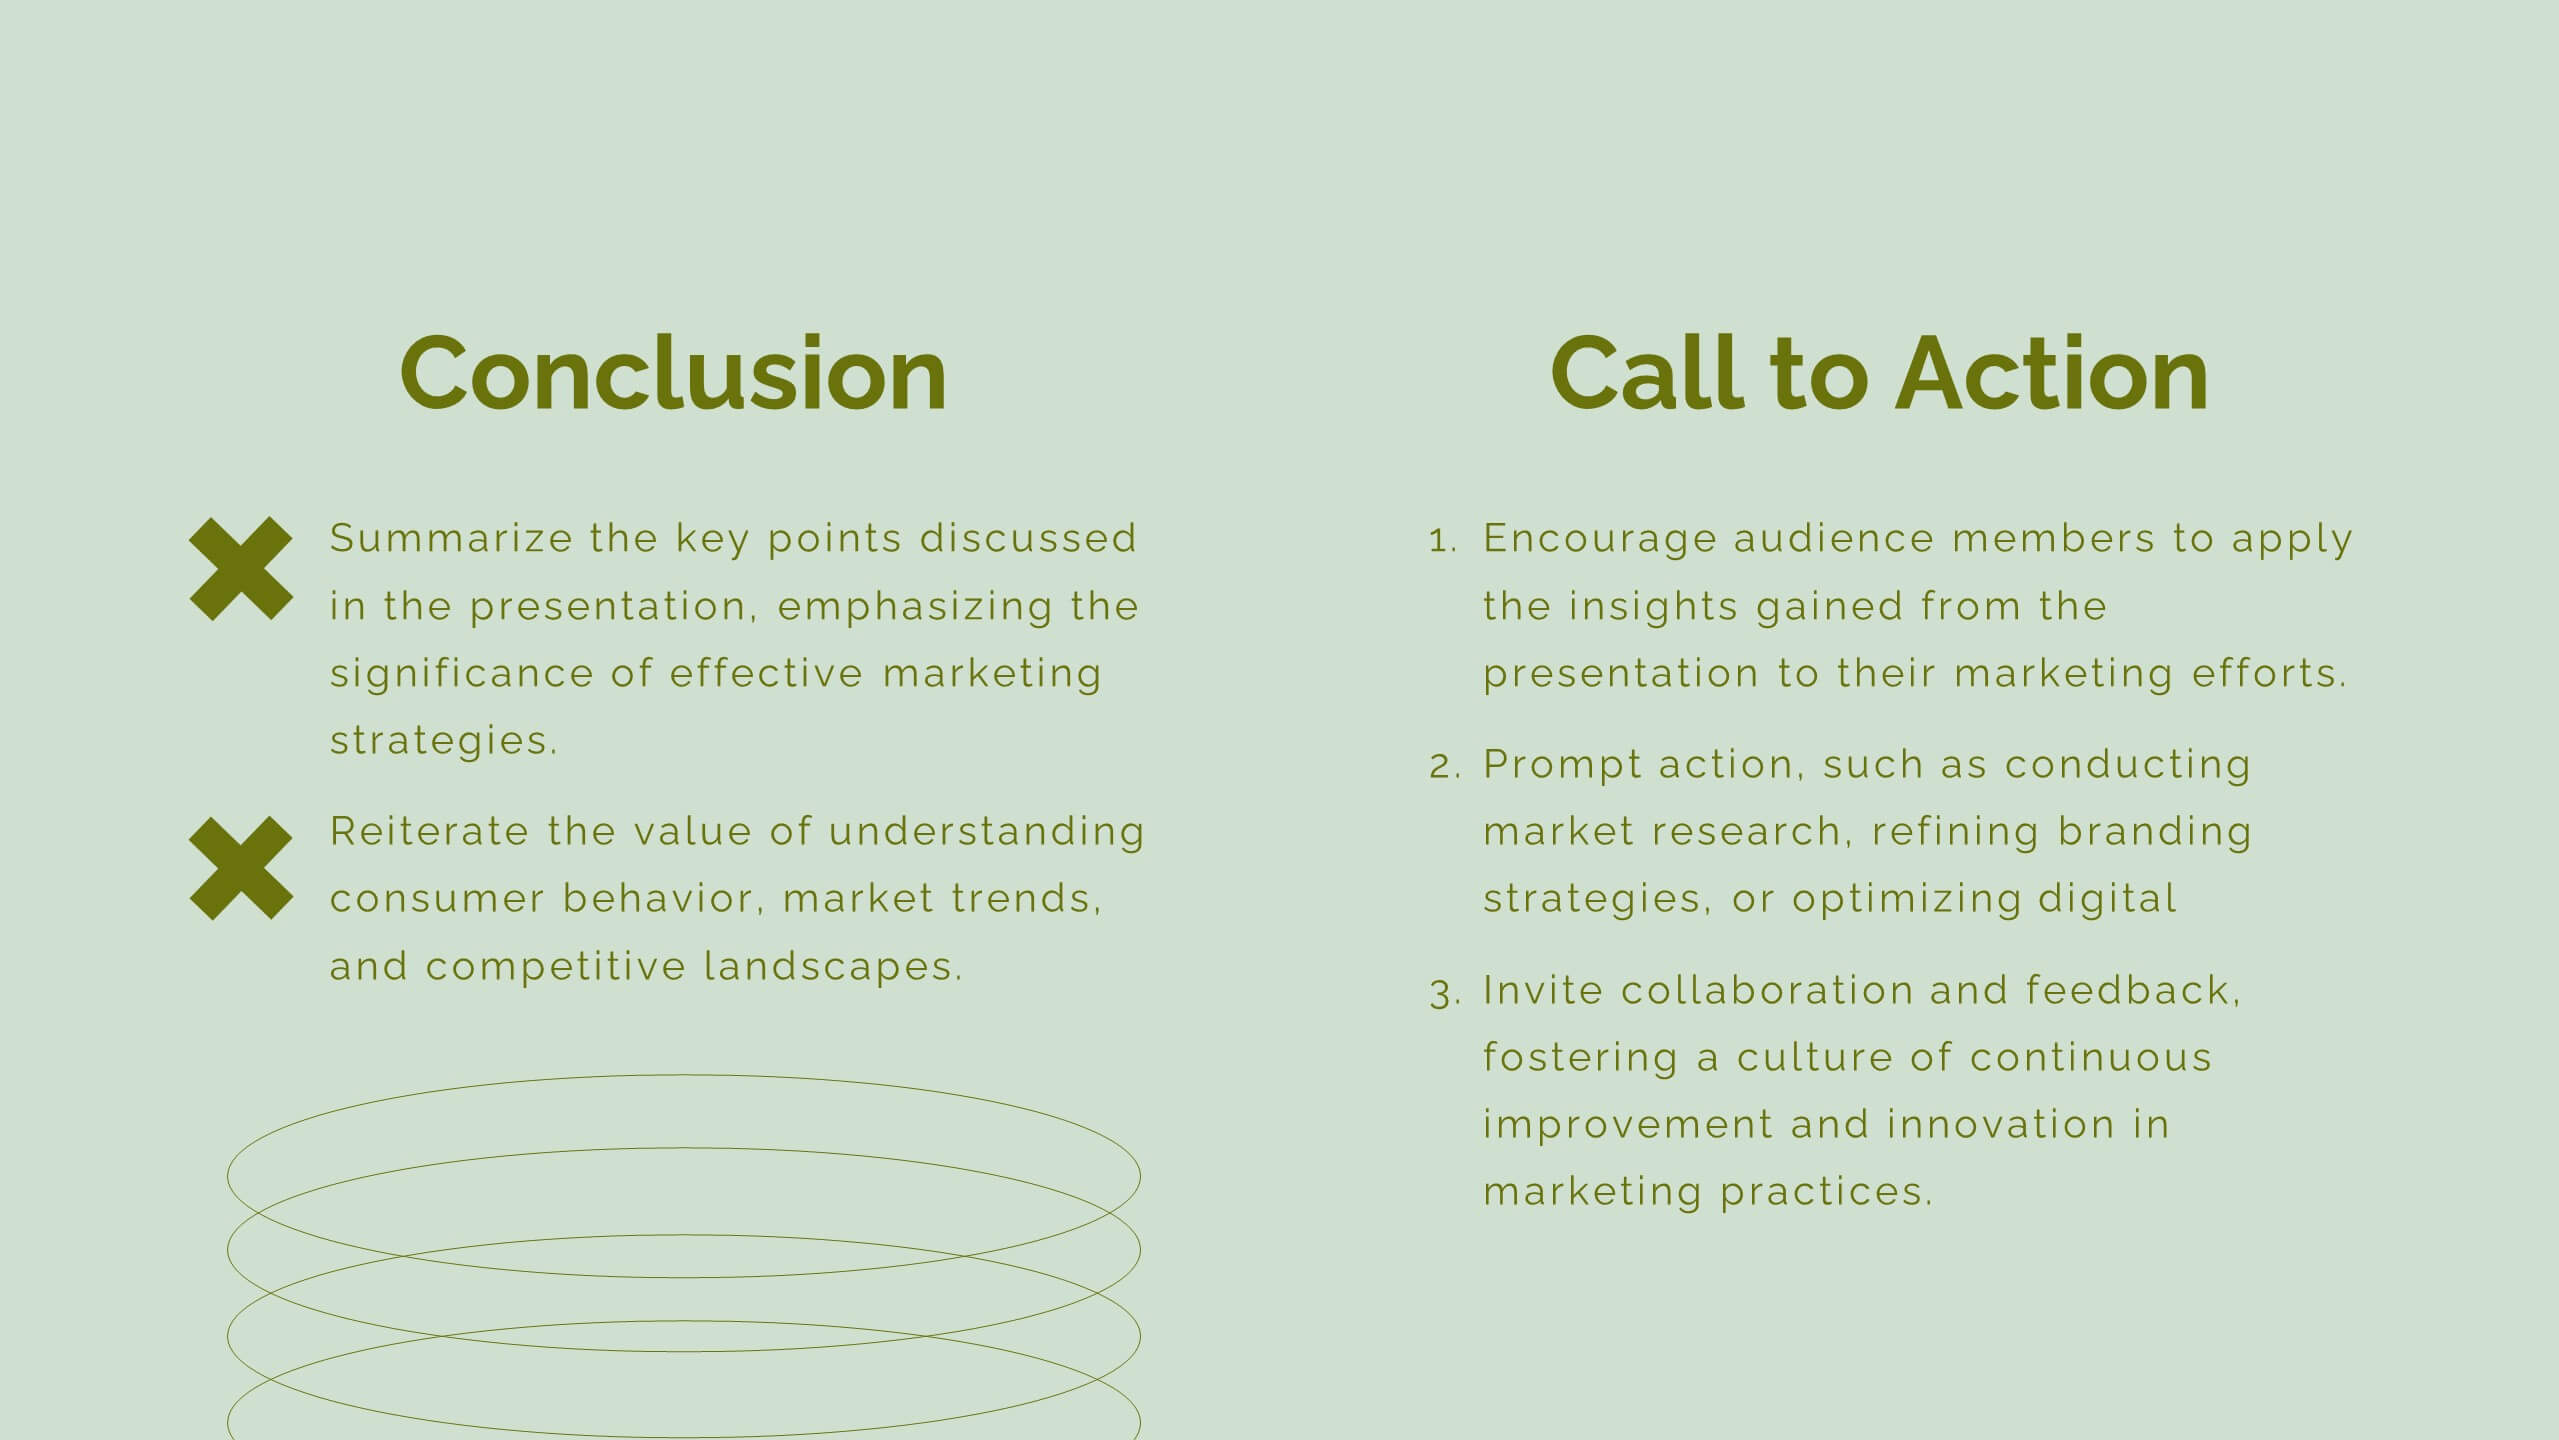
Aura Digital Marketing Strategy Plan Presentation
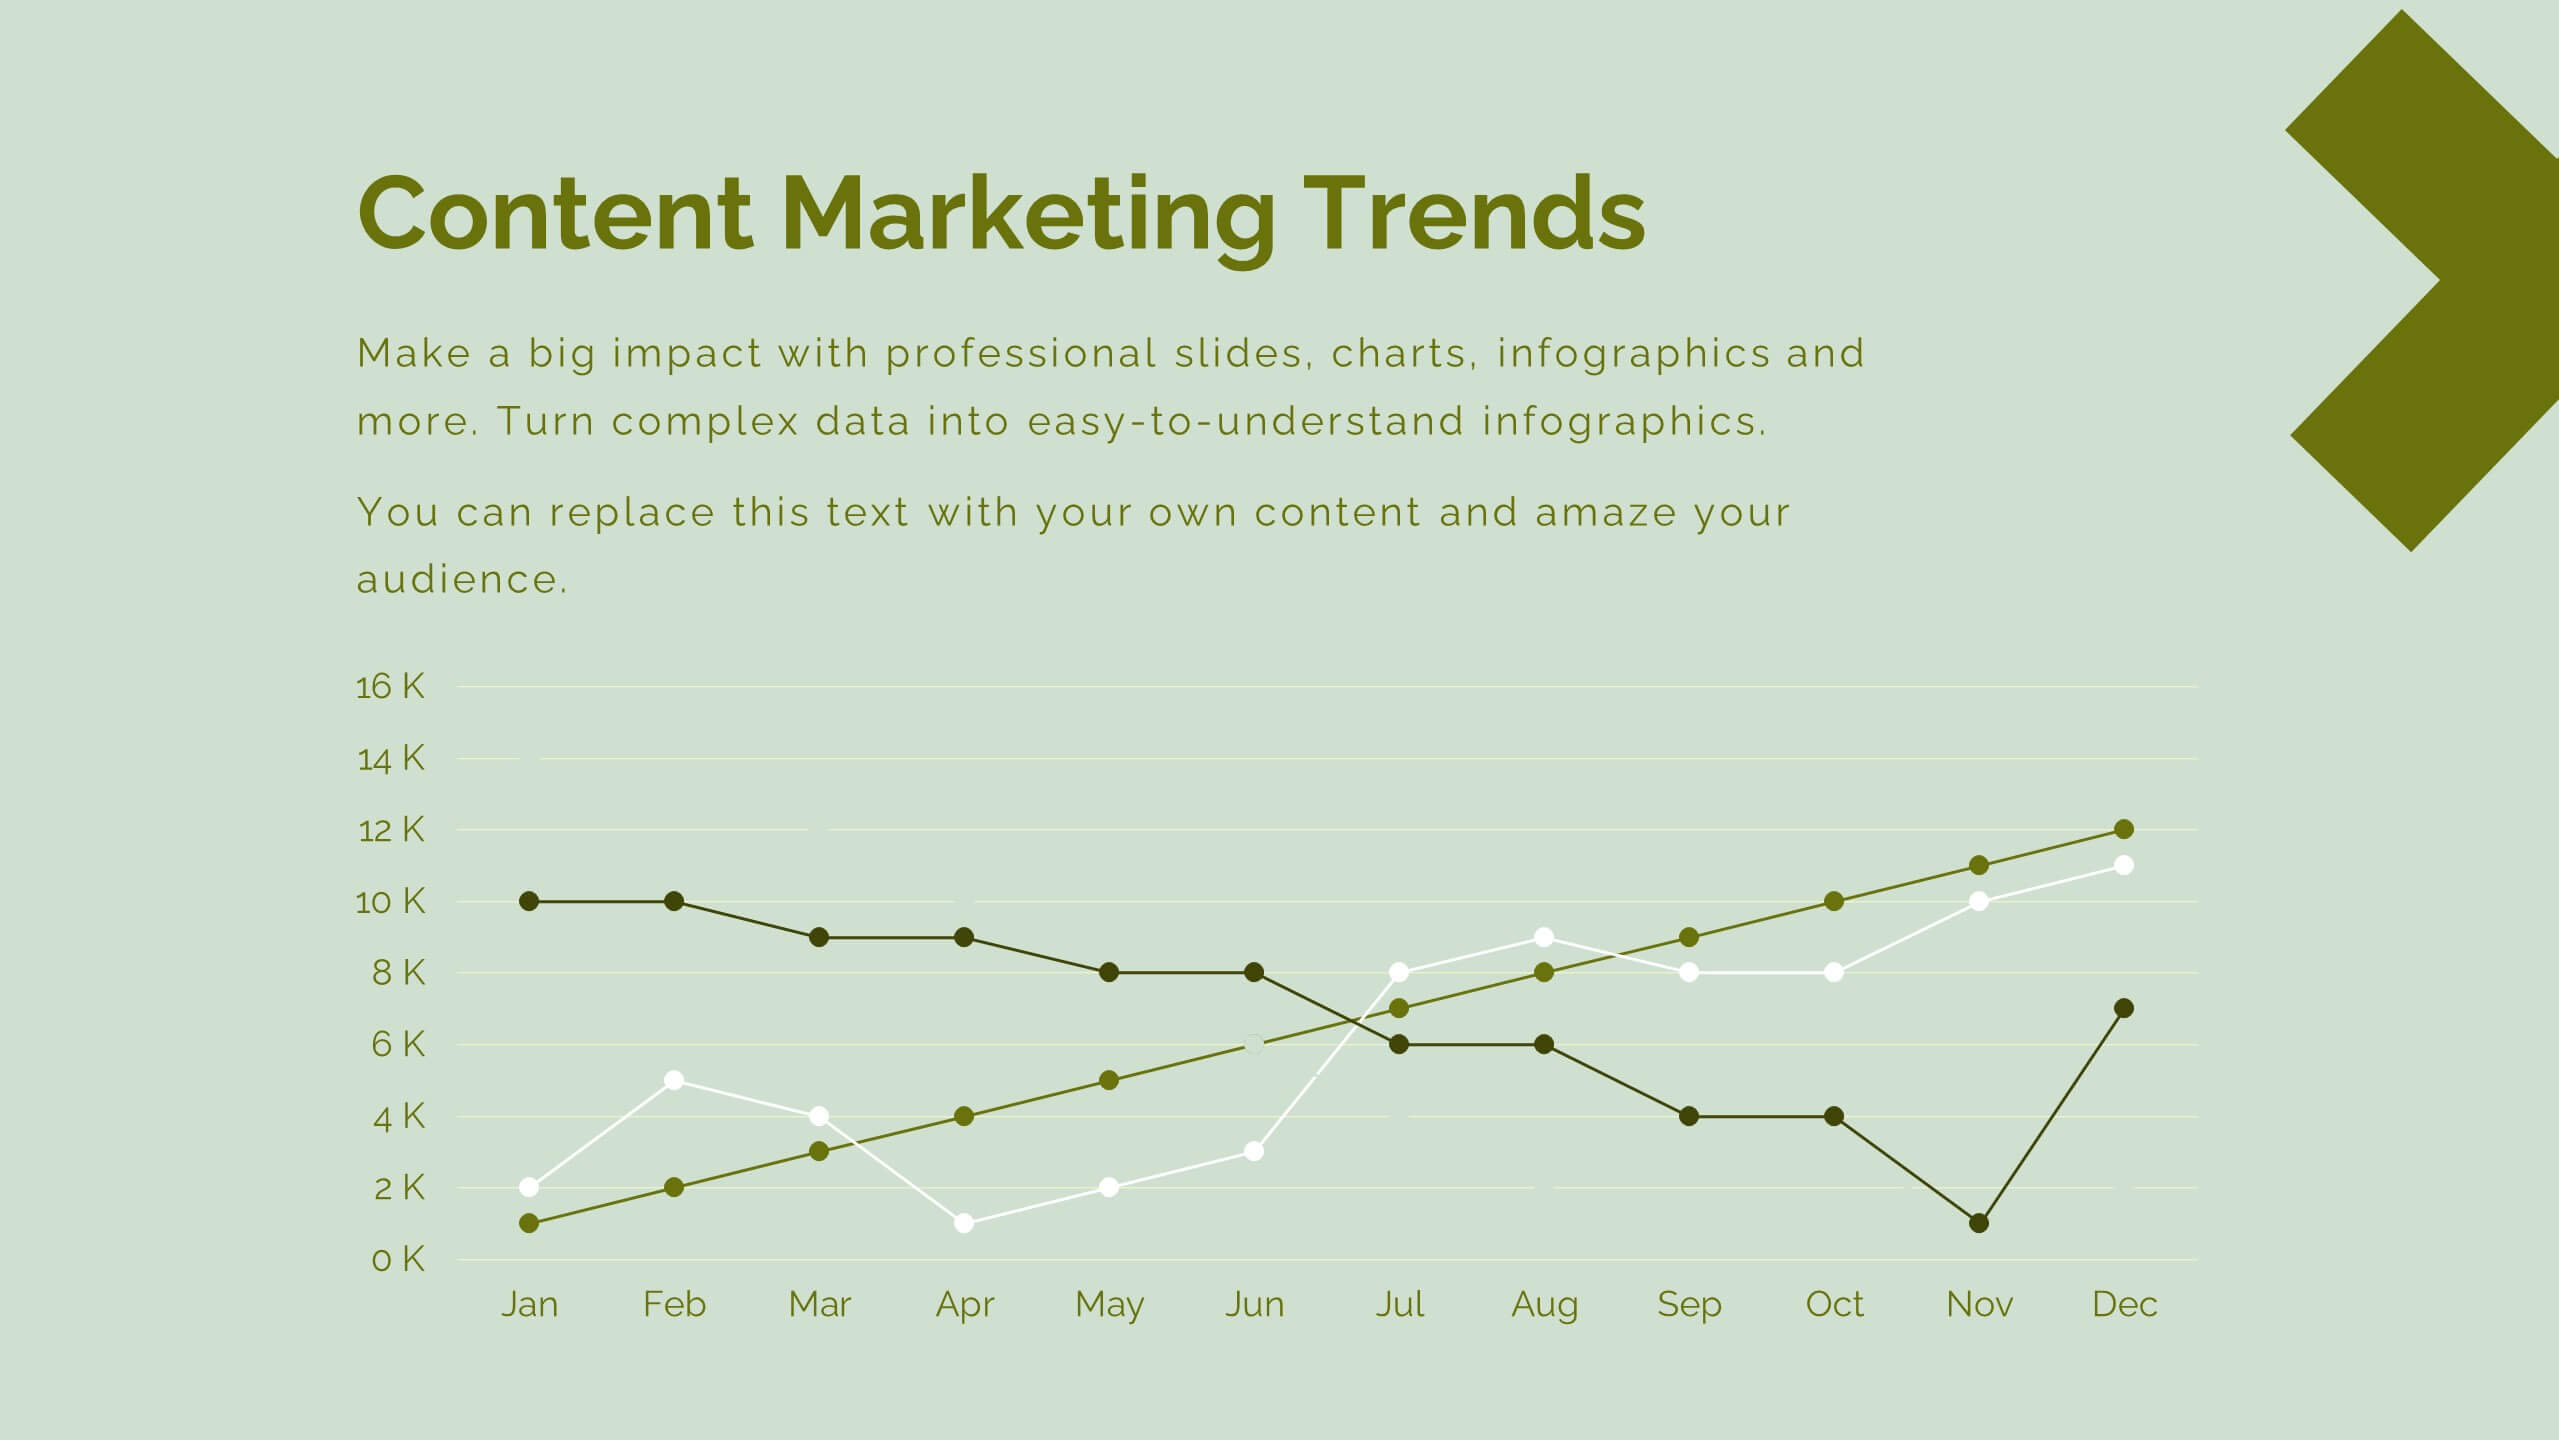
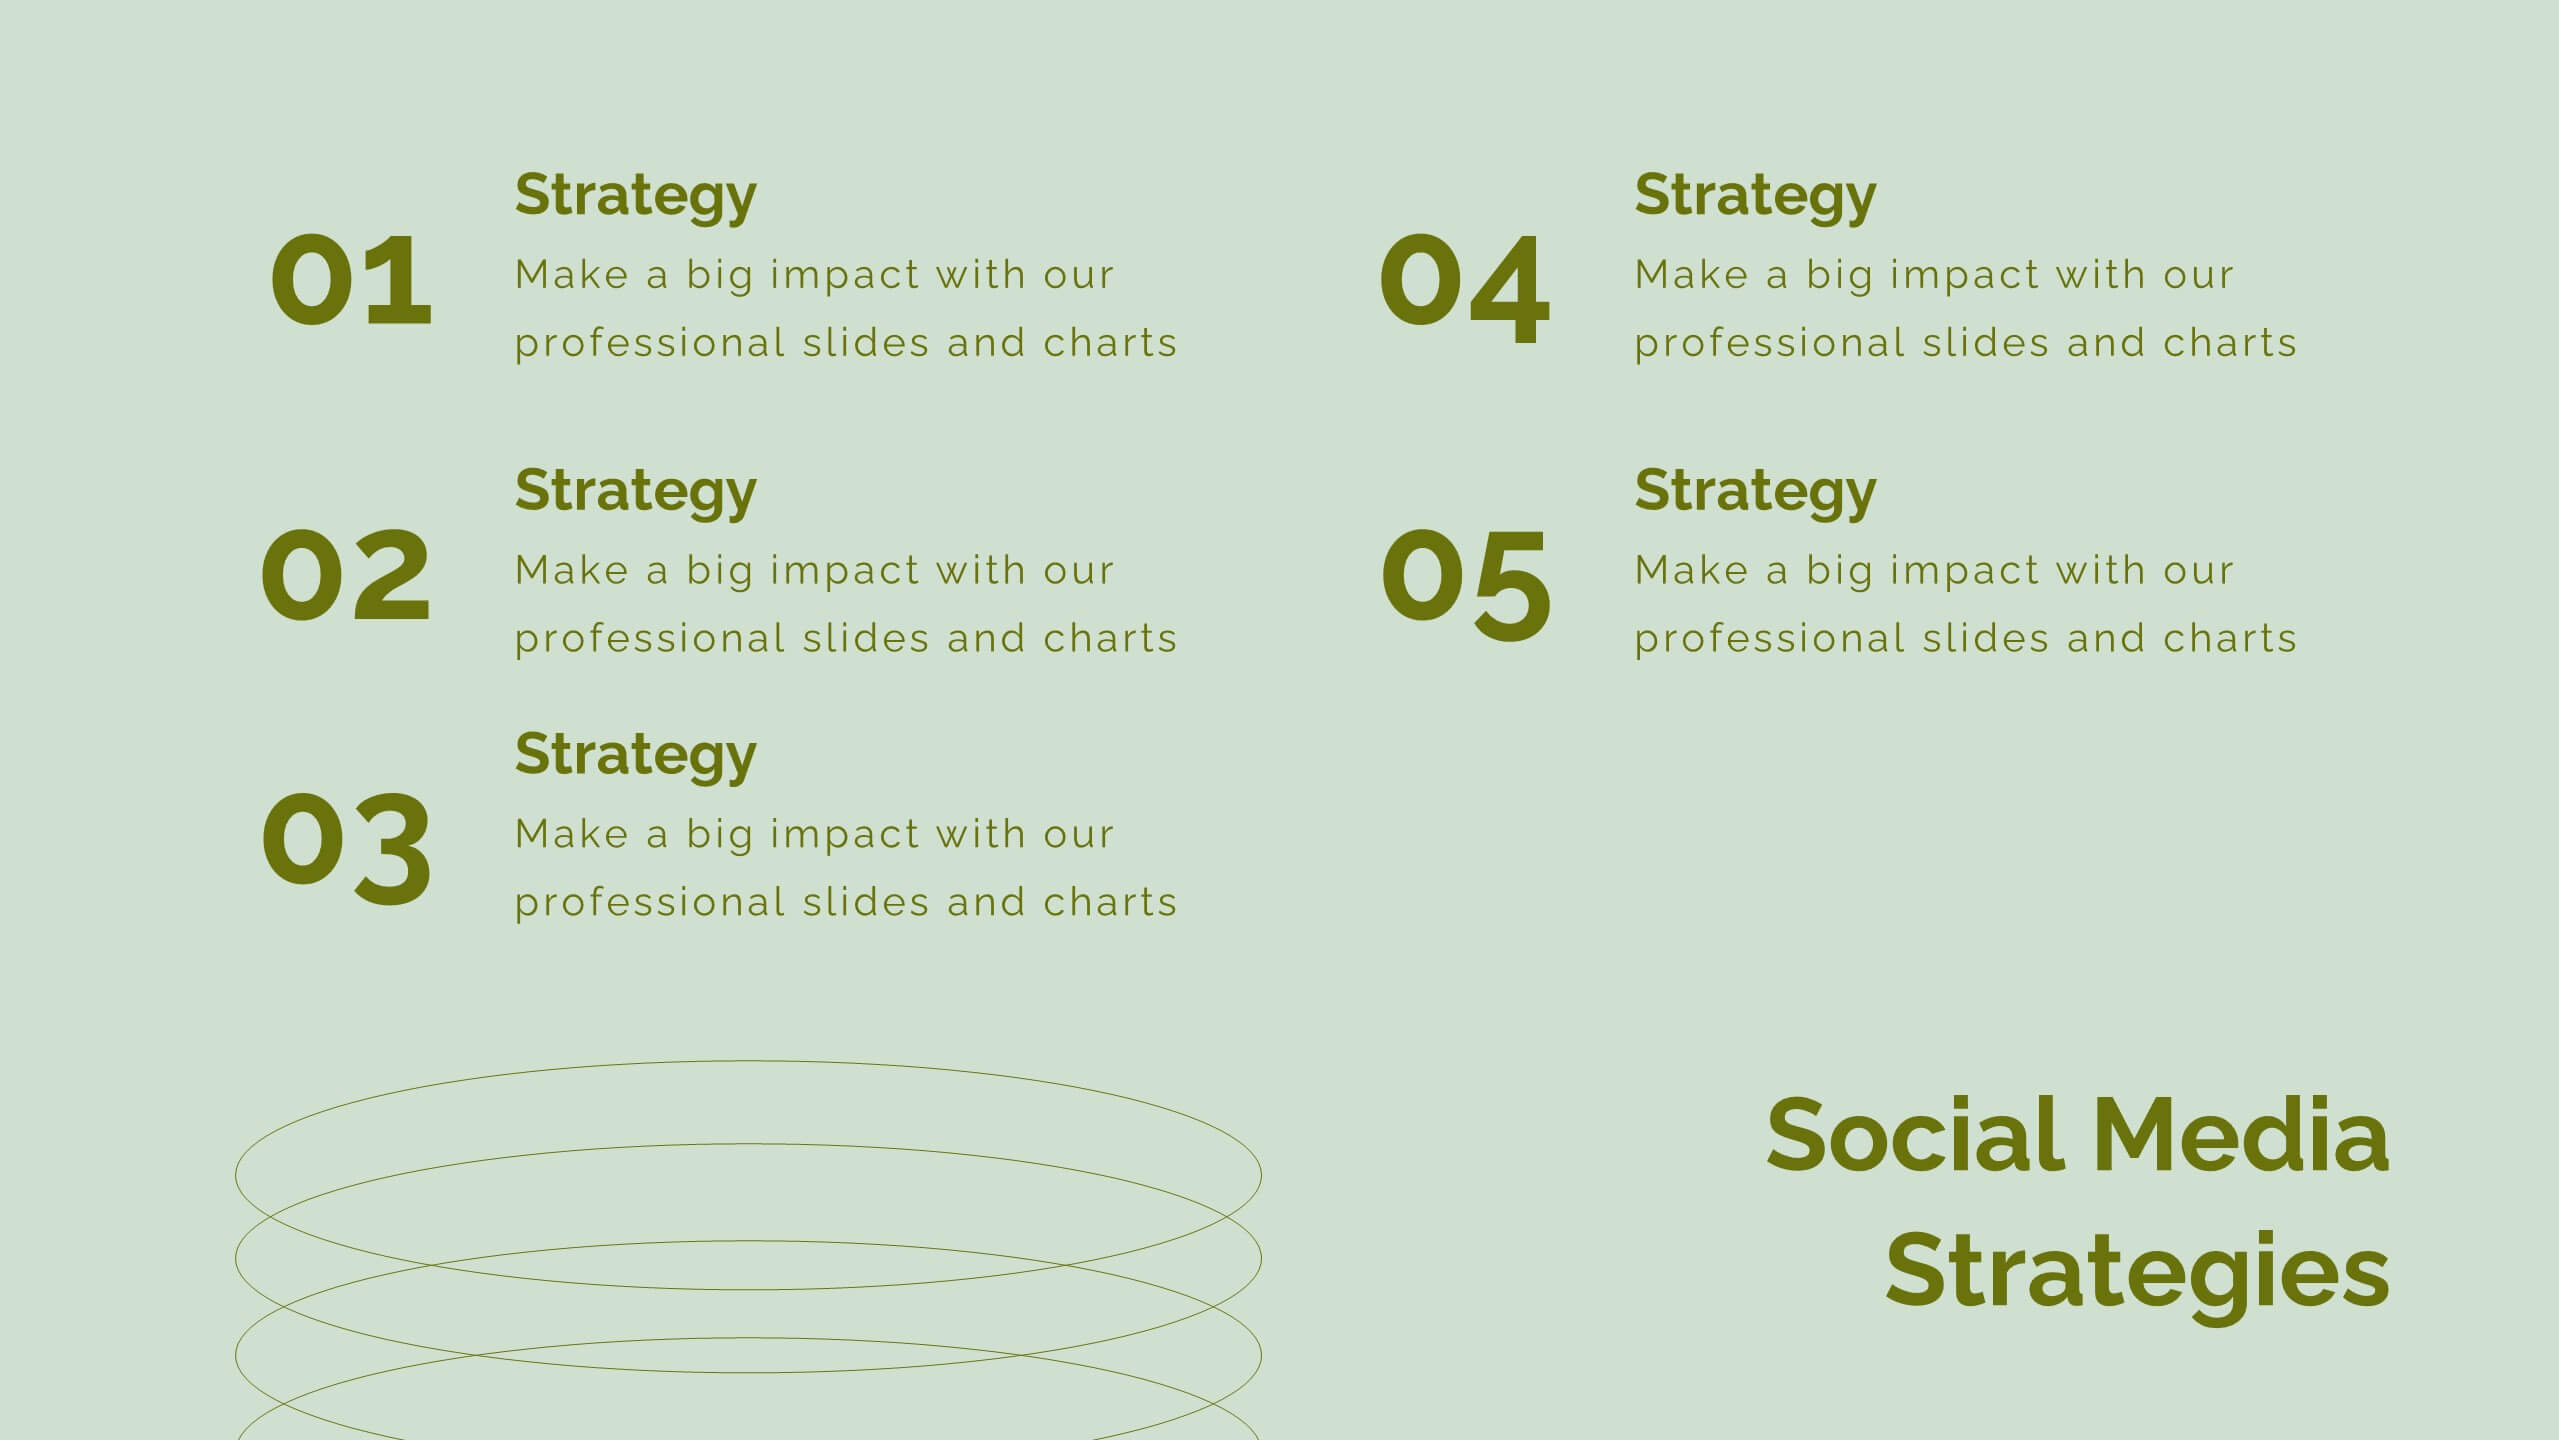
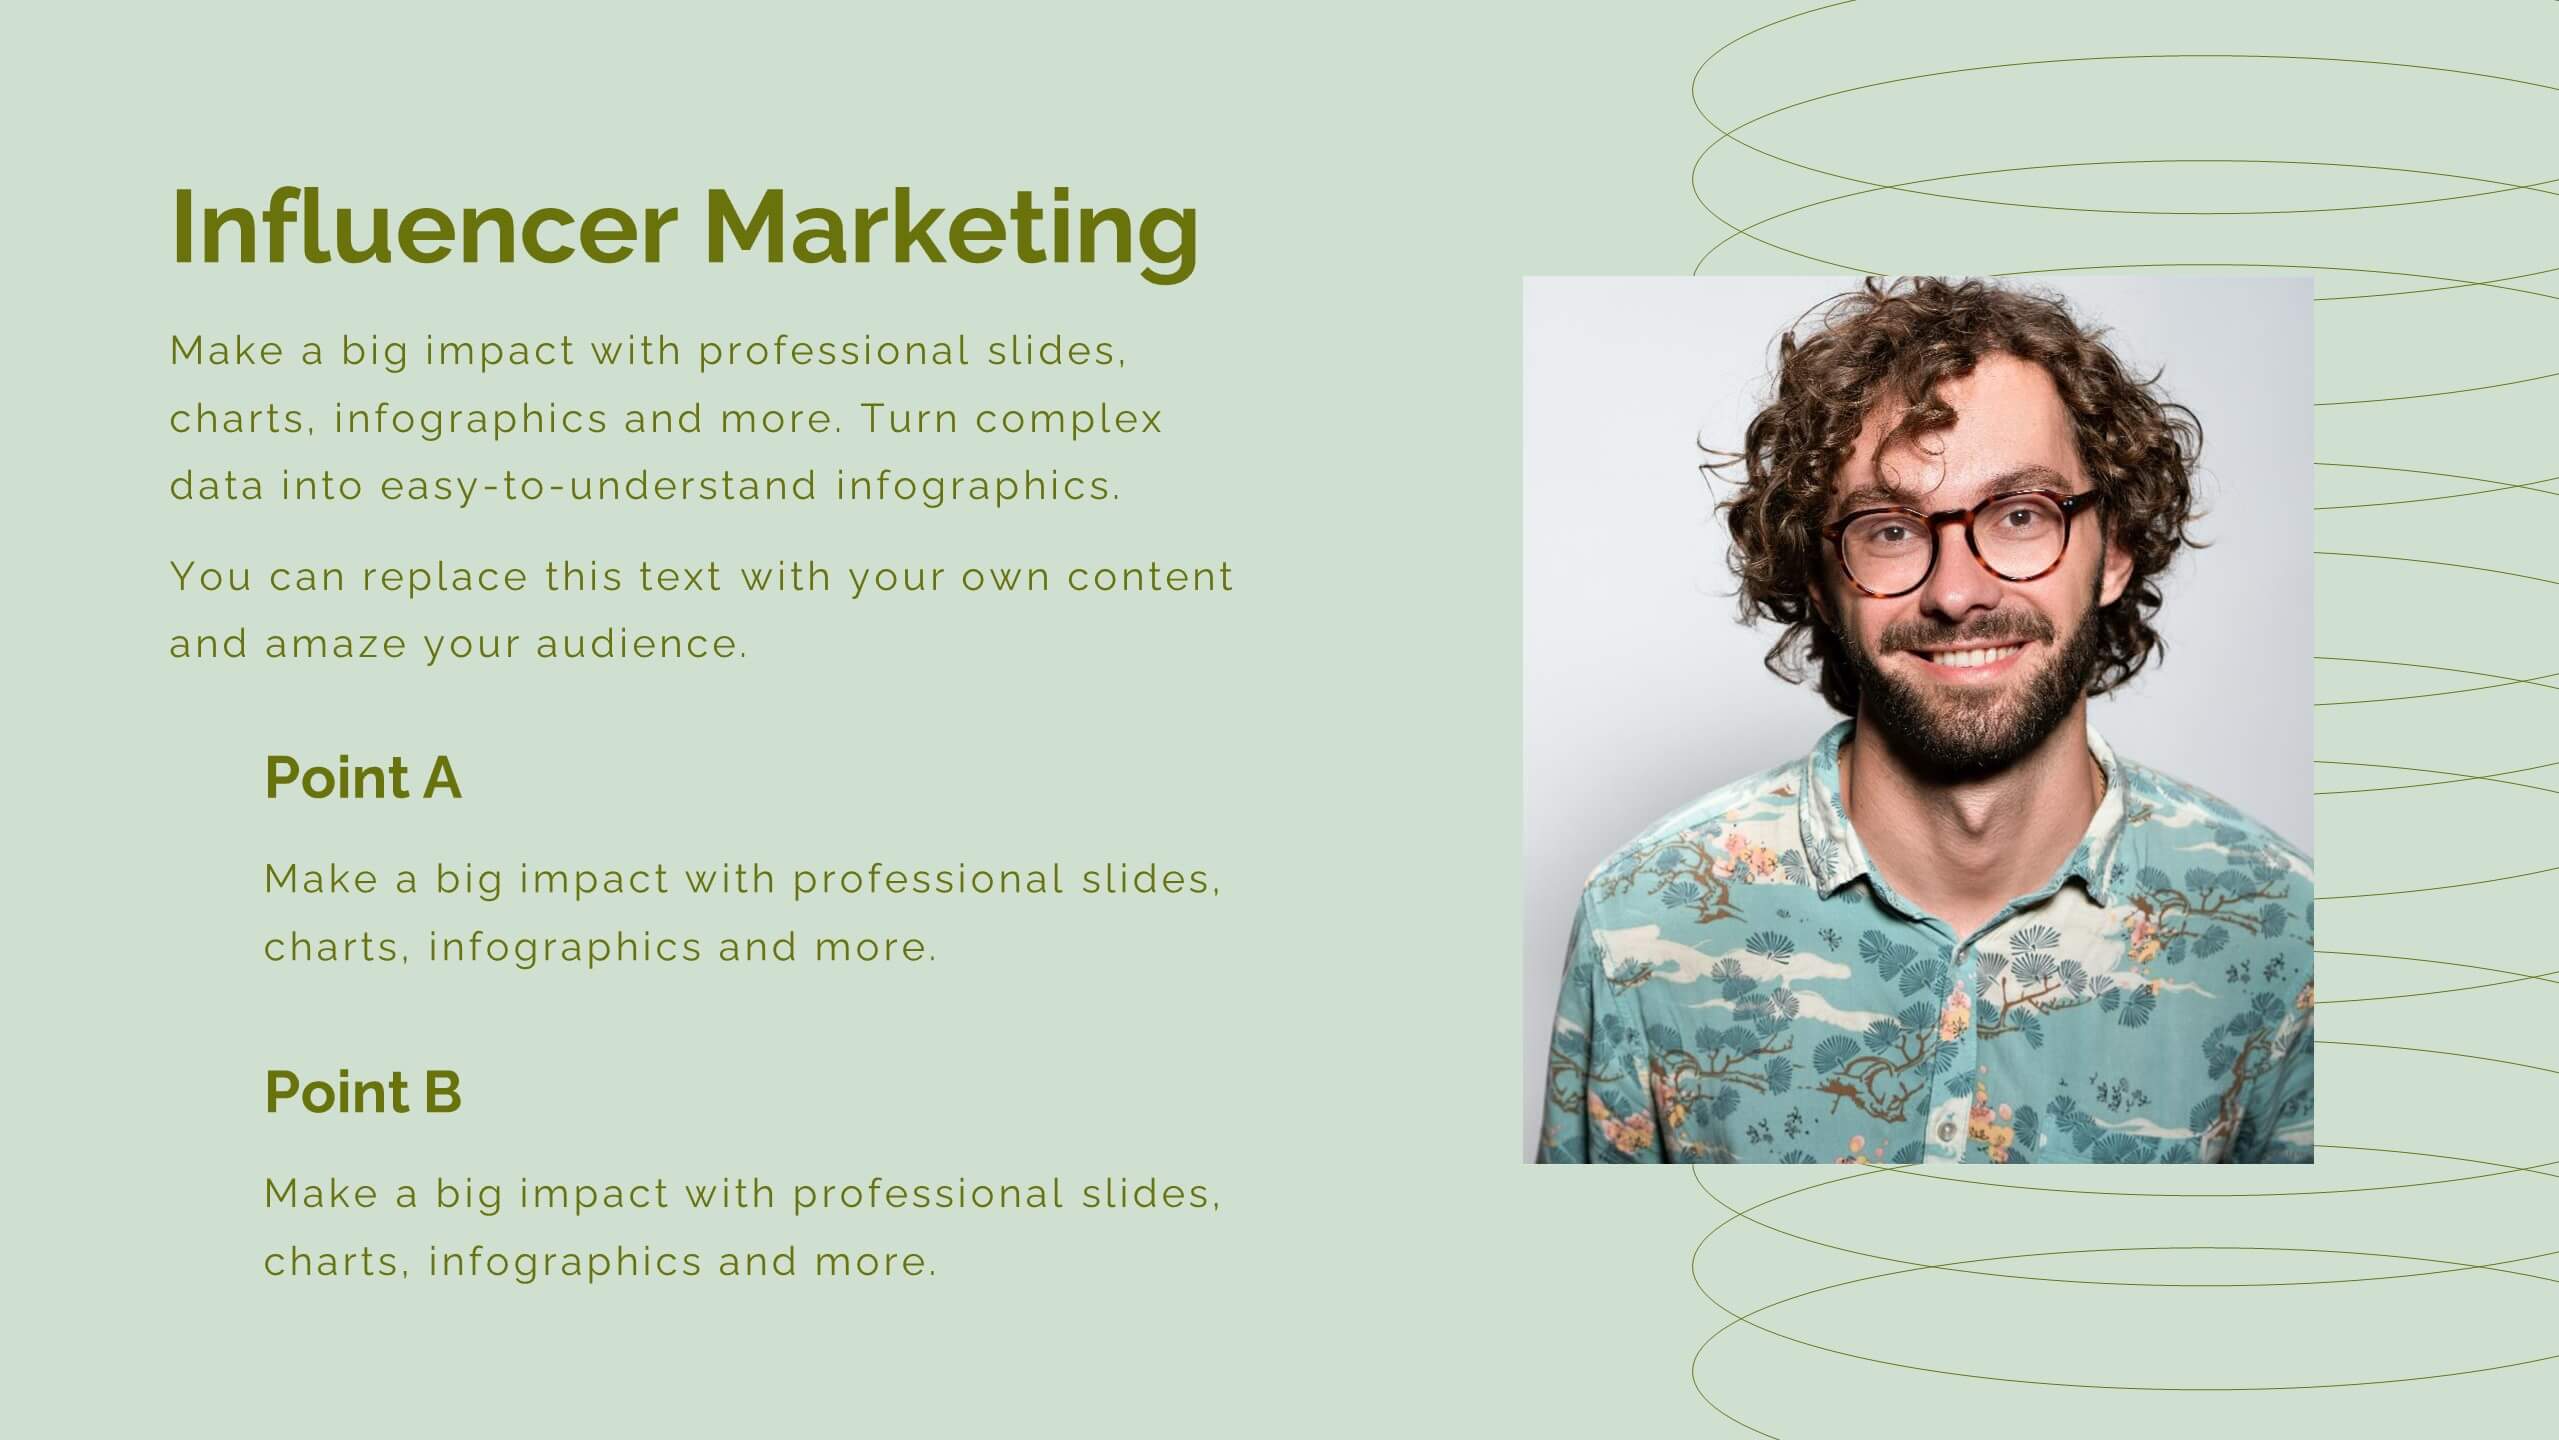
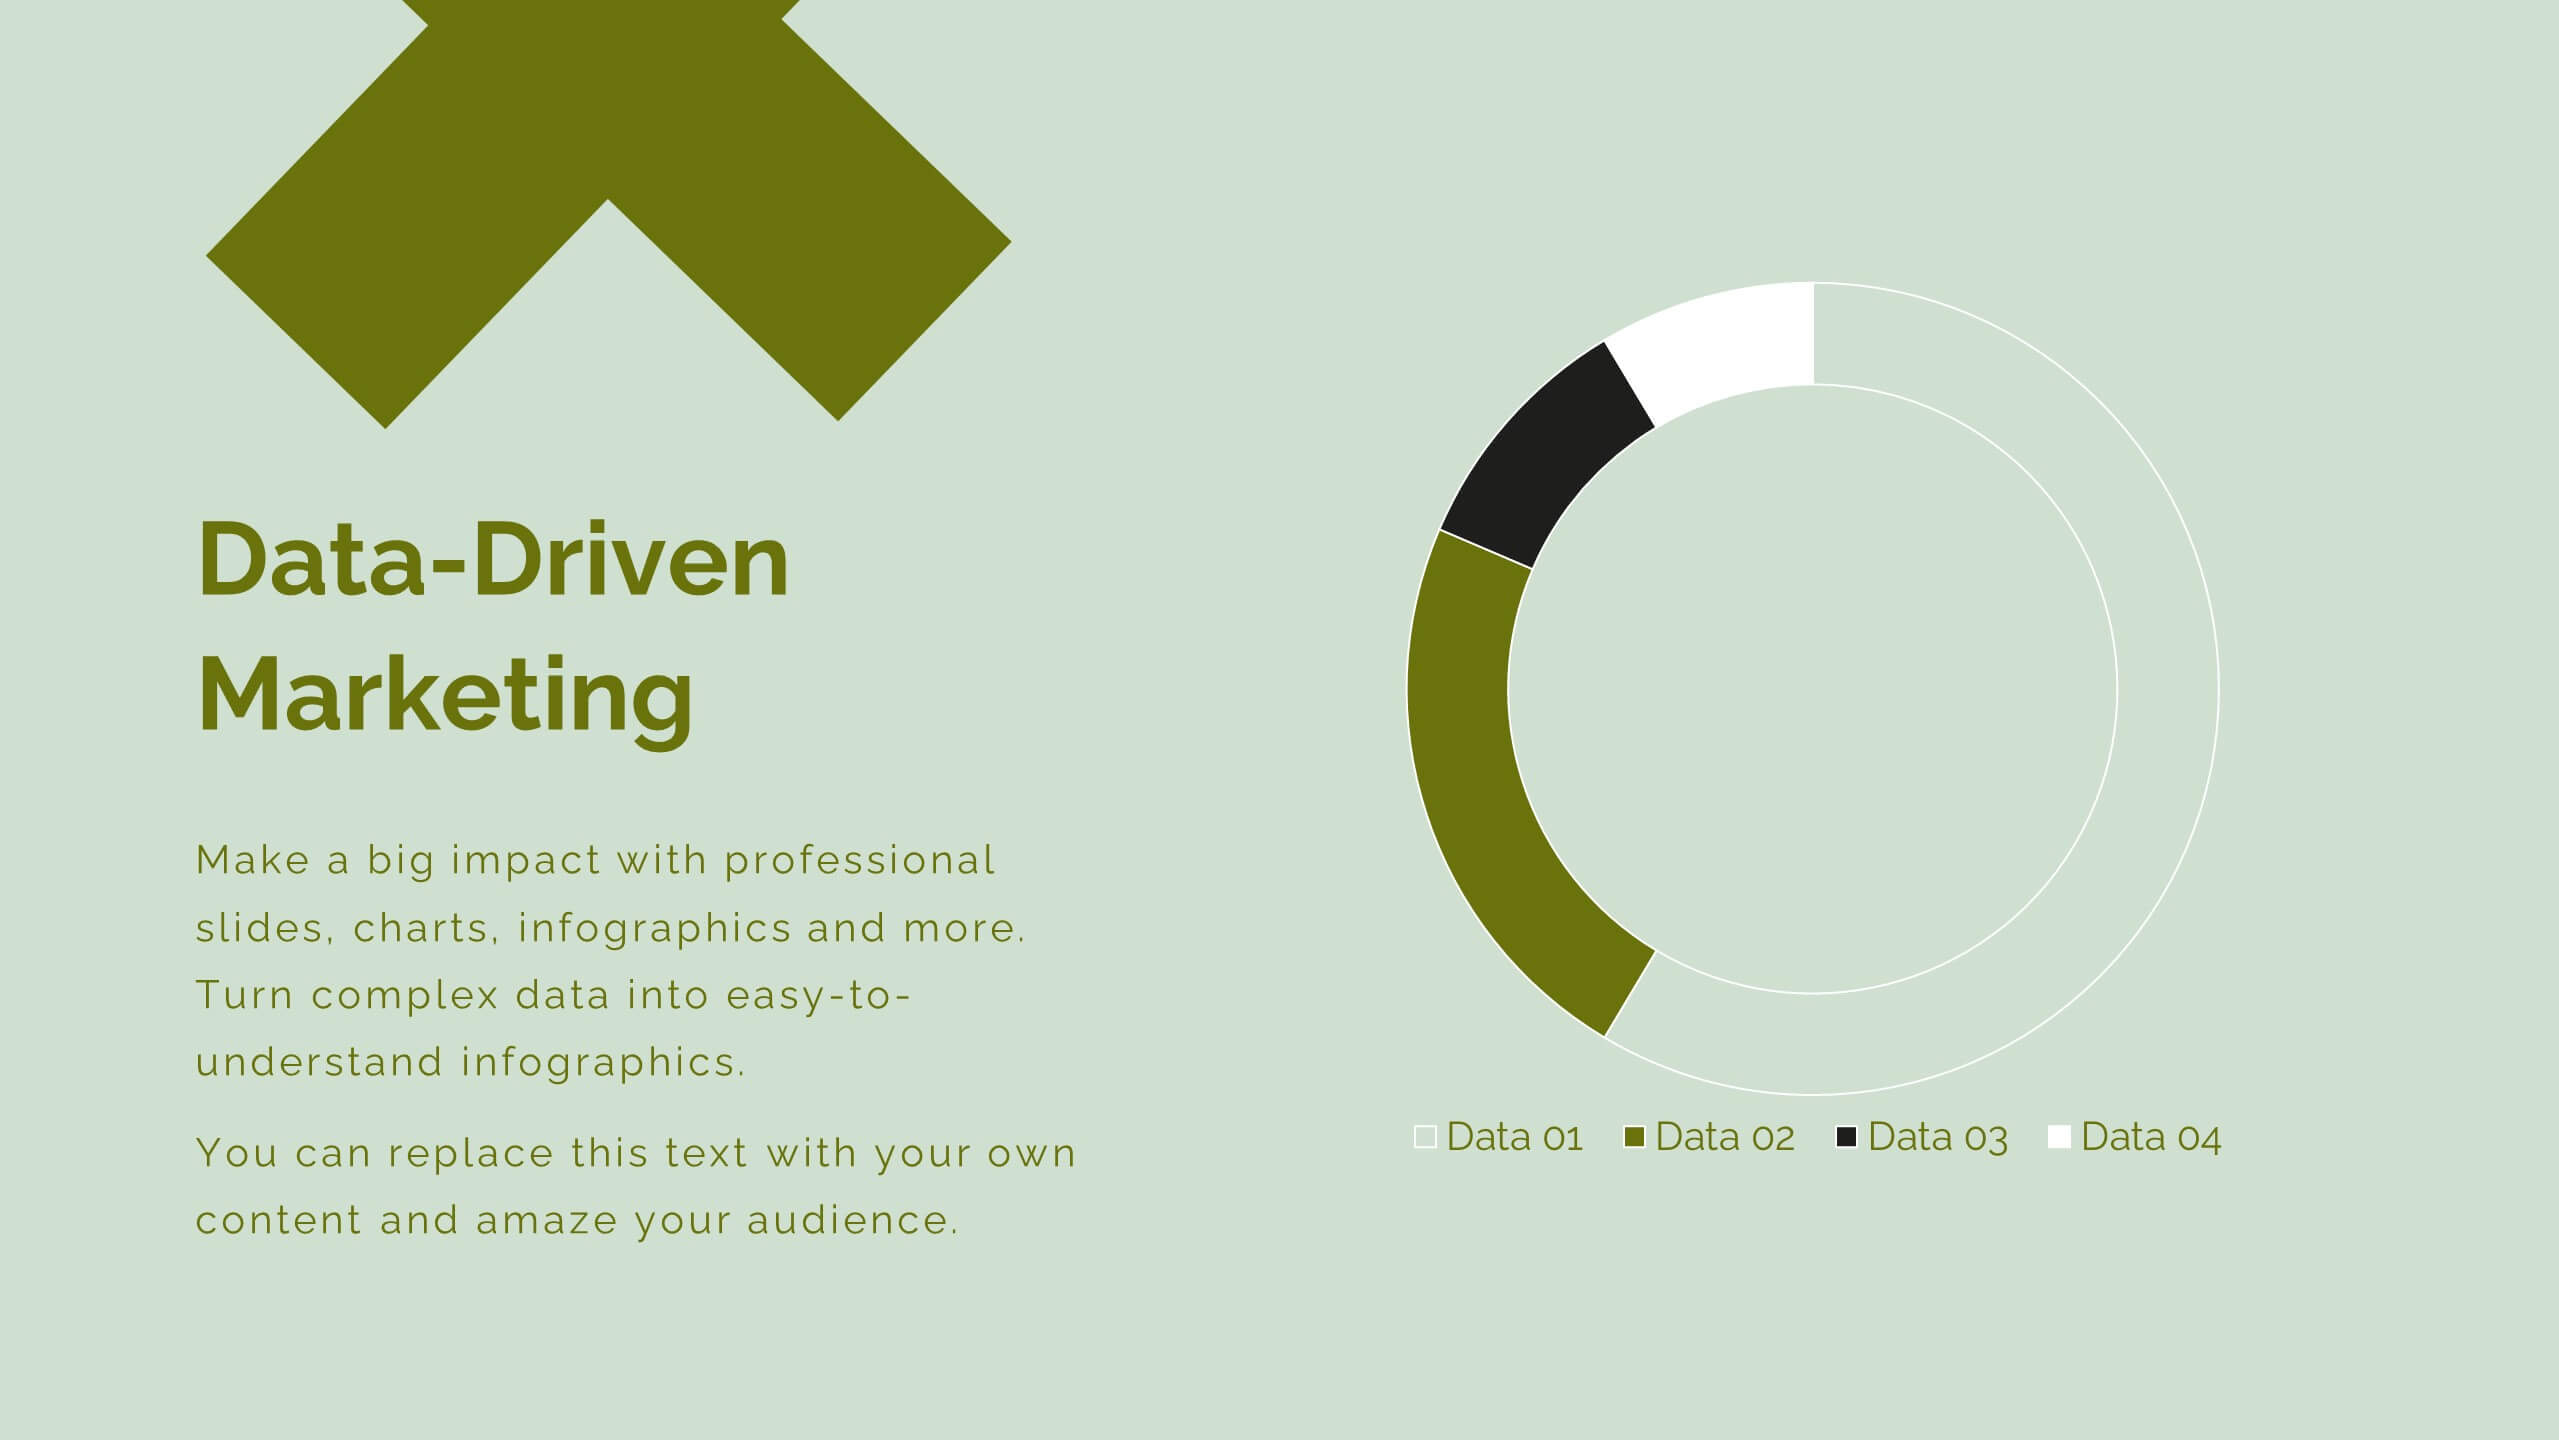
Revamp your digital marketing strategies with this dynamic template! Covering everything from industry overviews and consumer behavior analysis to emerging technologies and social media strategies, this template has it all. Perfect for creating compelling presentations that highlight data-driven marketing and brand storytelling. Compatible with PowerPoint, Keynote, and Google Slides.


5 diapositivas
Big Data Interpretation and Metrics Presentation
Break down complex data into digestible segments with the Big Data Interpretation and Metrics Presentation. Featuring a puzzle-inspired layout, this template is ideal for illustrating interconnected data points, analytics strategies, or metric-based frameworks. Fully customizable in PowerPoint, Keynote, and Google Slides.


21 diapositivas
Eureka Startup Growth Plan Presentation
Present your startup growth plan effectively with this sleek, dynamic presentation template designed for innovators and entrepreneurs. With its vibrant color scheme and streamlined layout, it simplifies complex data, ensuring your audience stays engaged. The template offers slides for showcasing your mission, market analysis, business strategies, and revenue projections. Dedicated sections highlight team profiles, target audience insights, and funding goals, providing a comprehensive view of your growth trajectory. Use the timeline slides to map out milestones and visually articulate your progress. Fully customizable in PowerPoint, Google Slides, and Keynote, it adapts effortlessly to your specific needs, enabling you to communicate your vision with clarity. Ideal for pitching to investors, presenting at conferences, or internal strategic planning, this template equips you with the tools to drive home your ideas with professionalism and style. Empower your growth journey with a presentation that reflects your startup’s potential.