


Características


¿Tienes alguna pregunta?
Recomendar
20 diapositivas
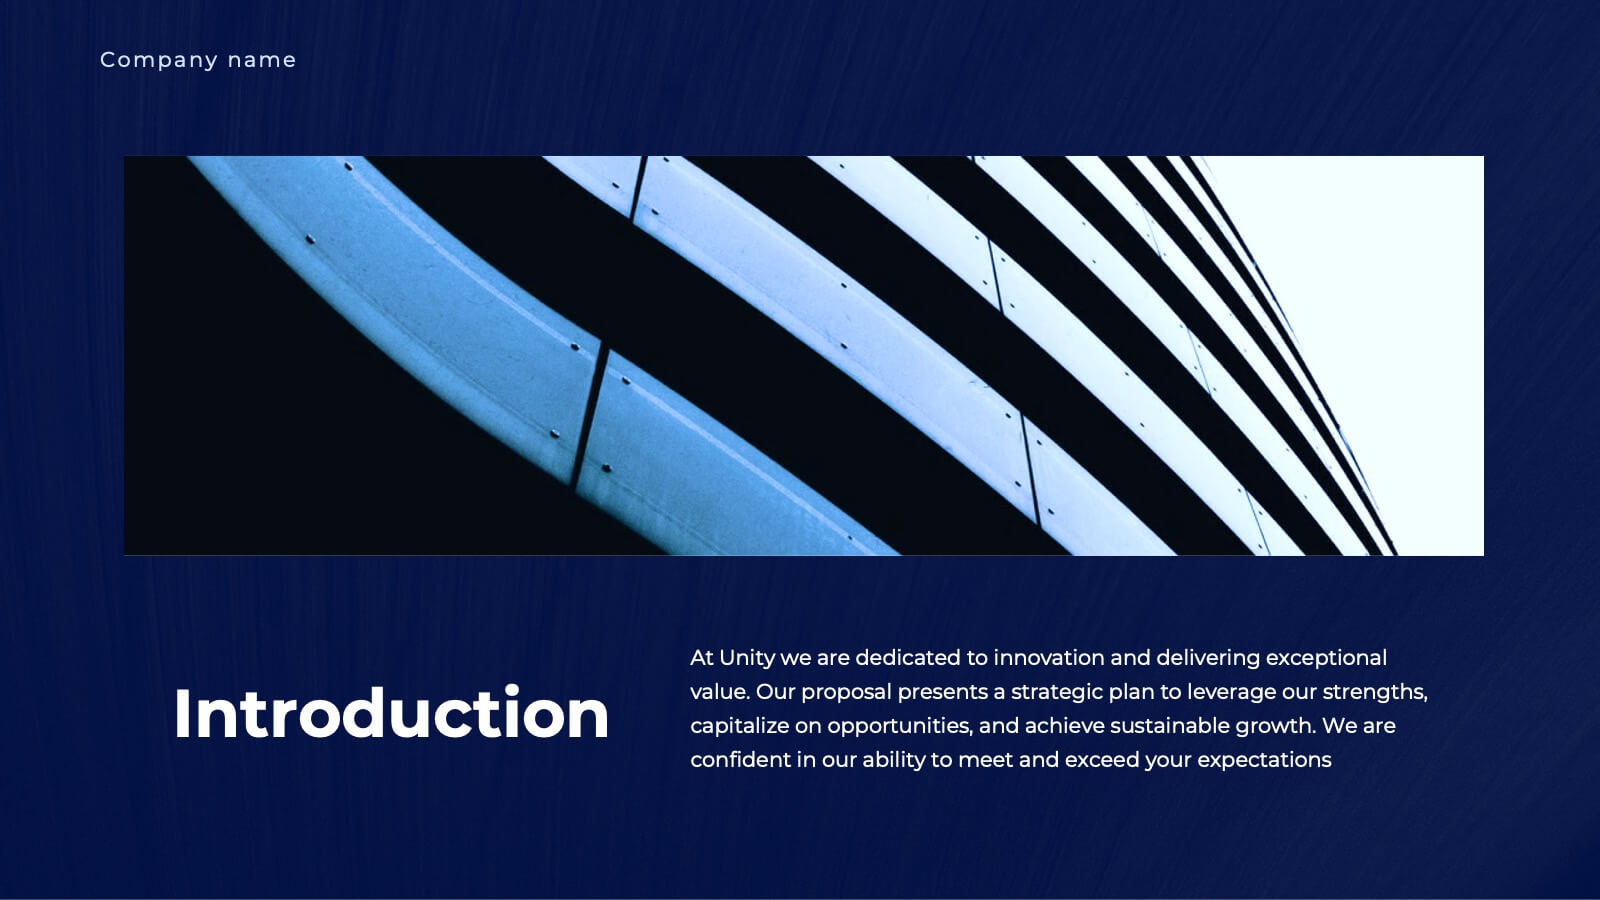
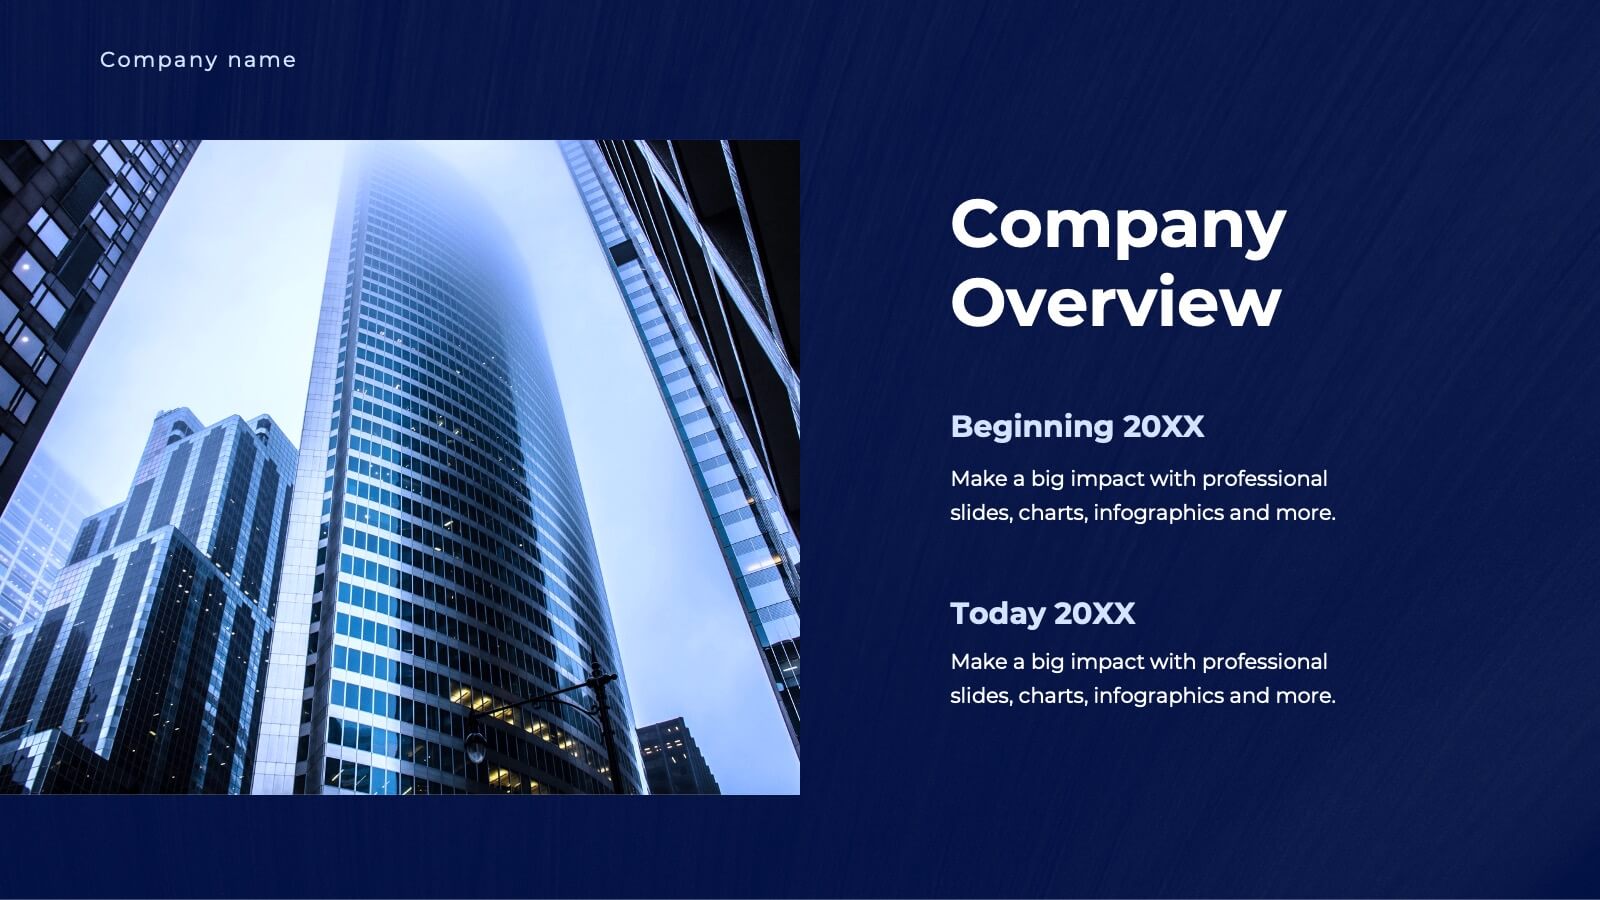
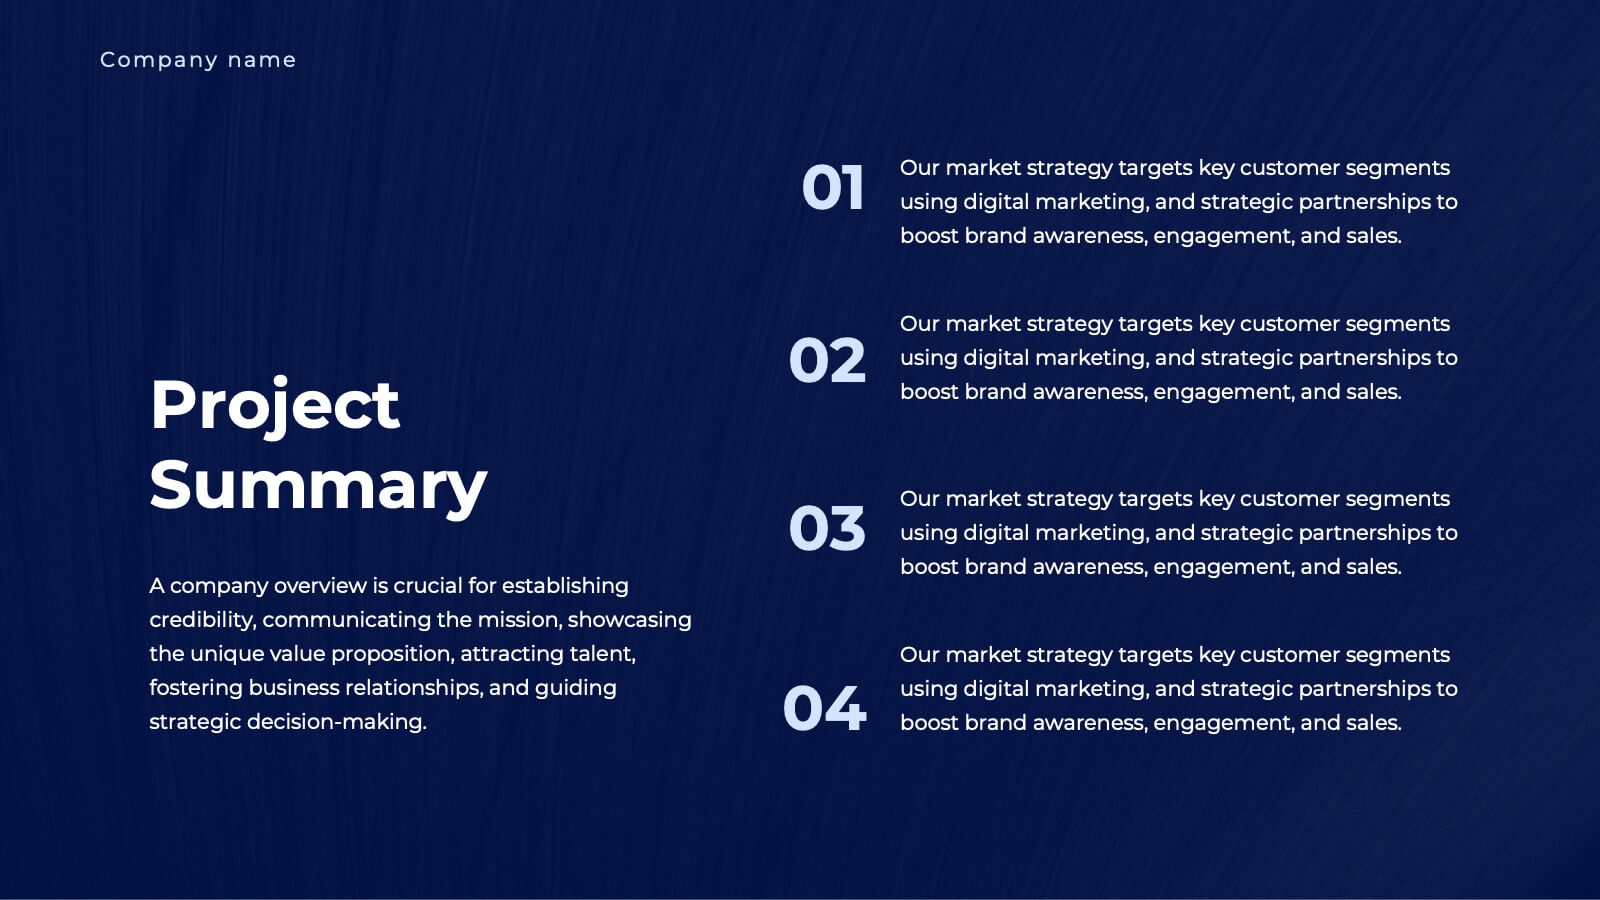
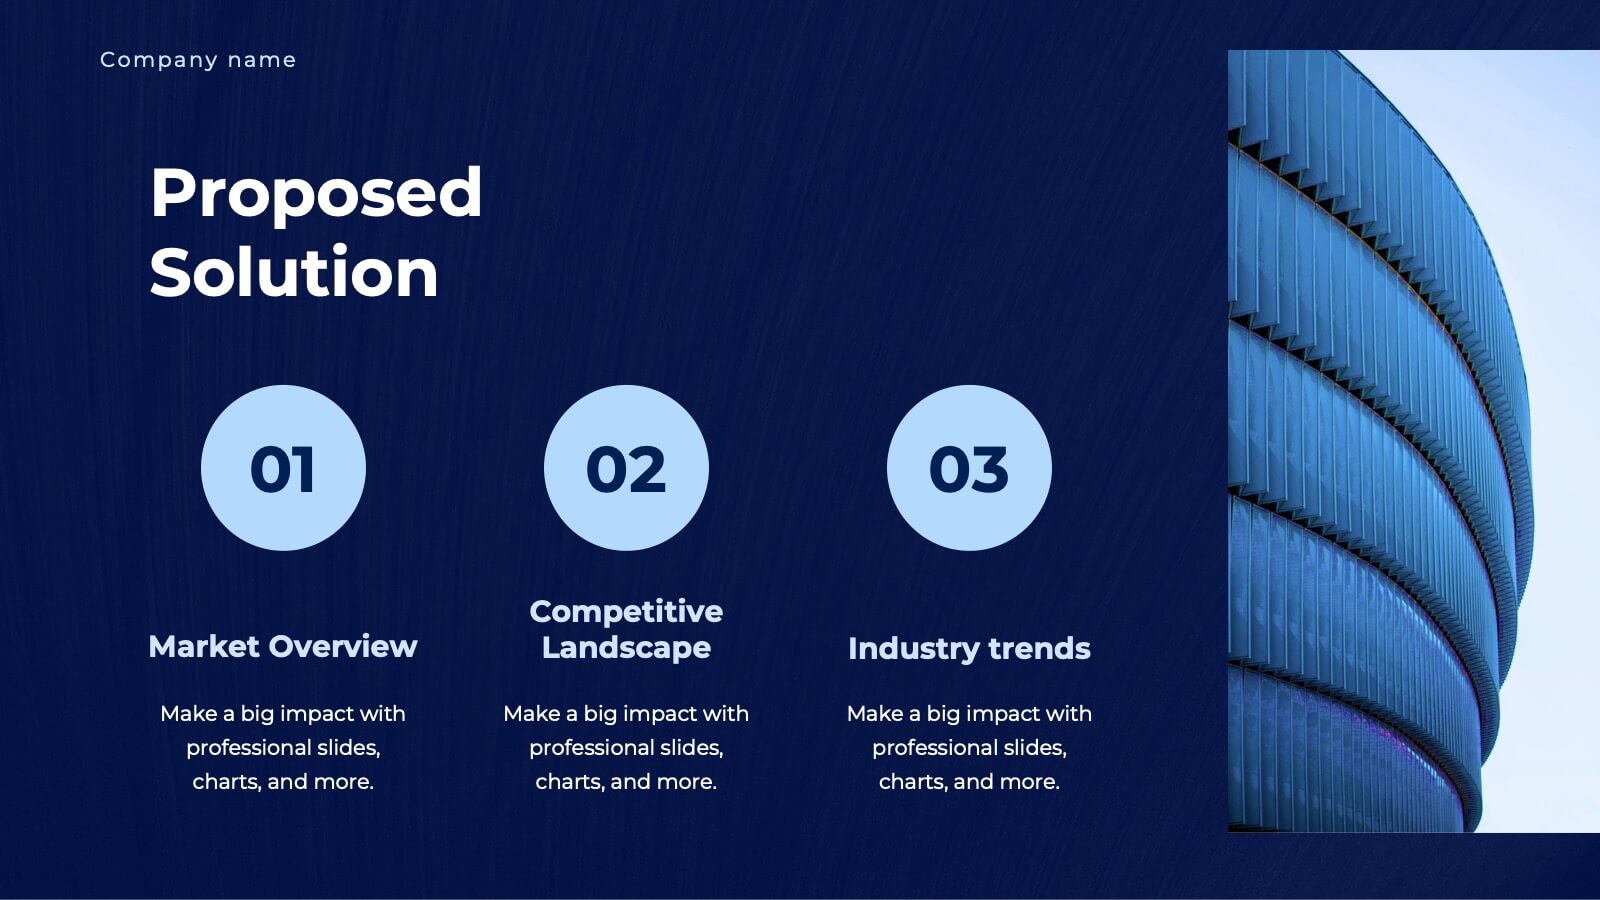
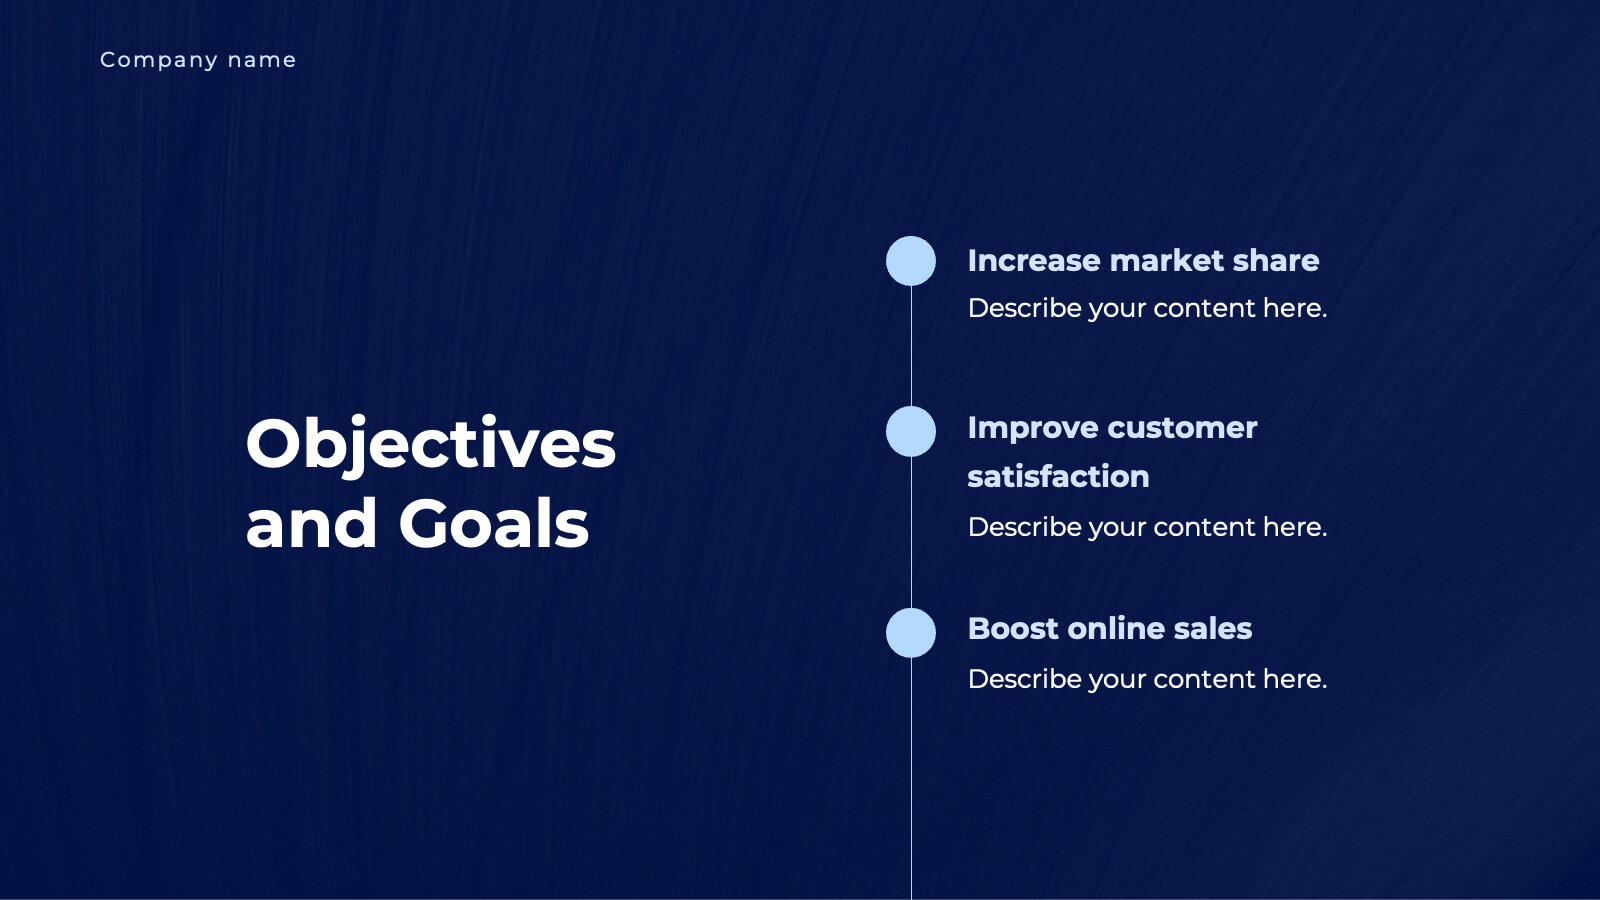
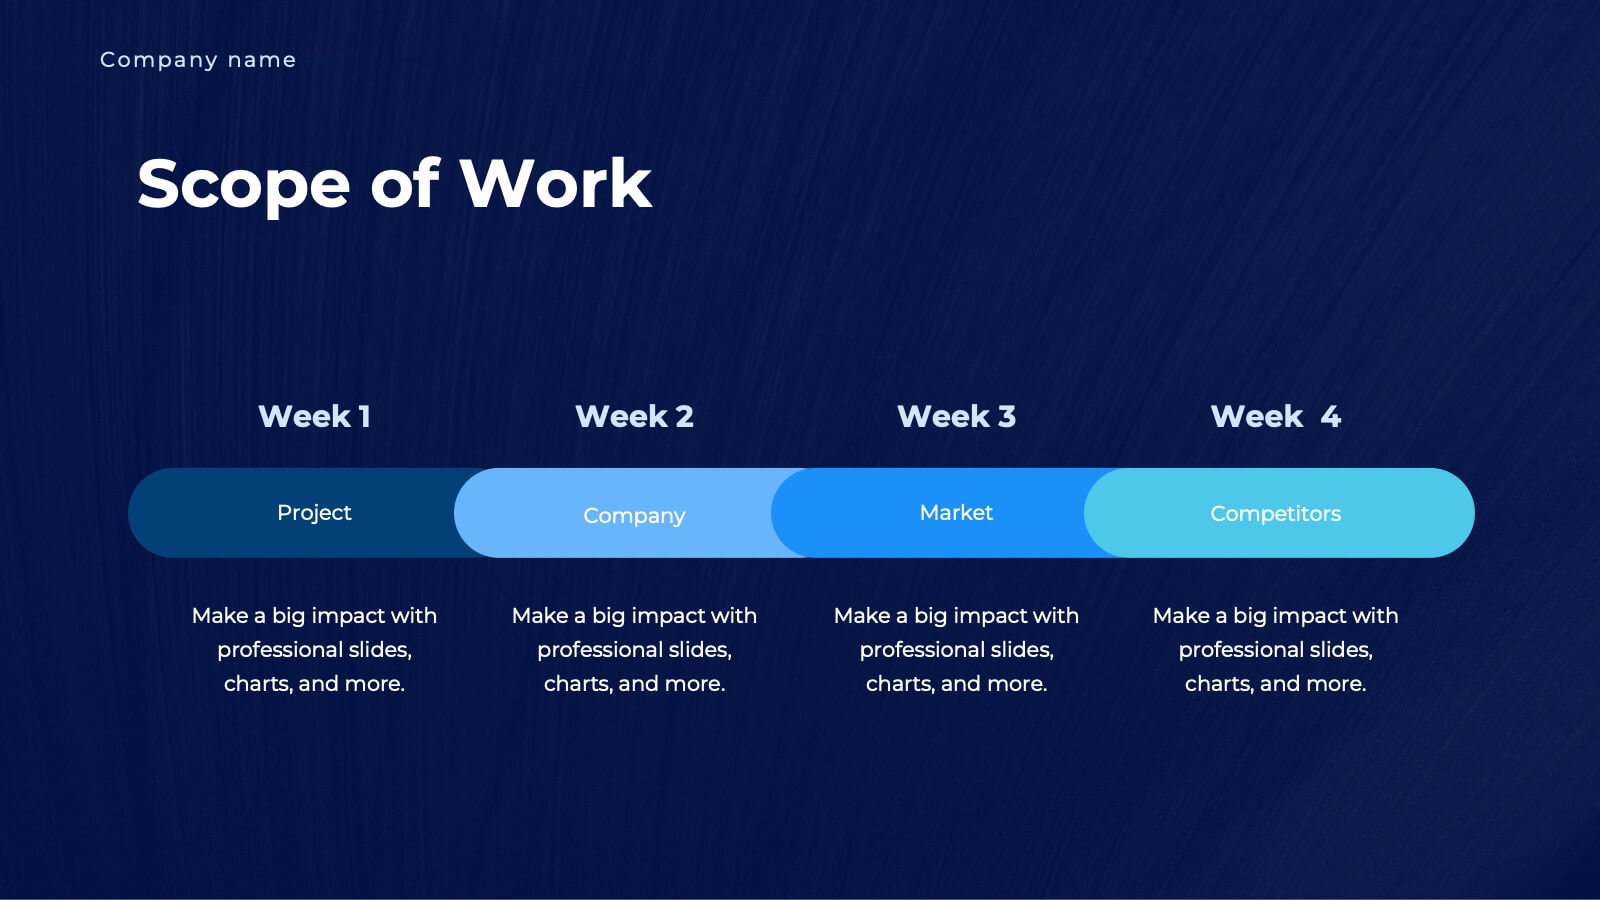
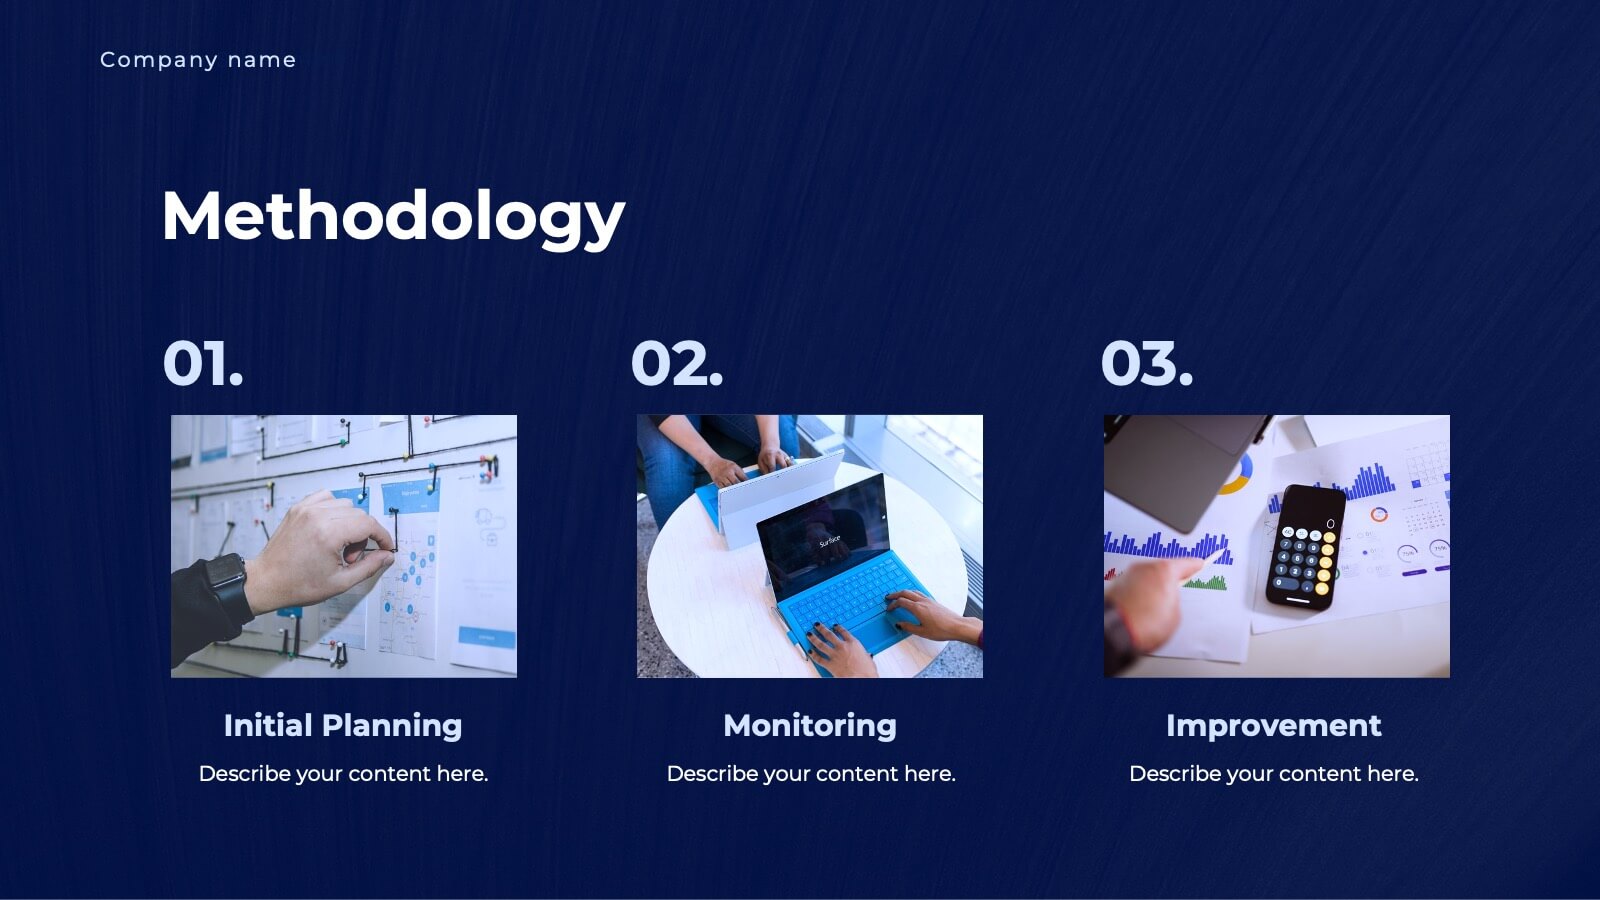
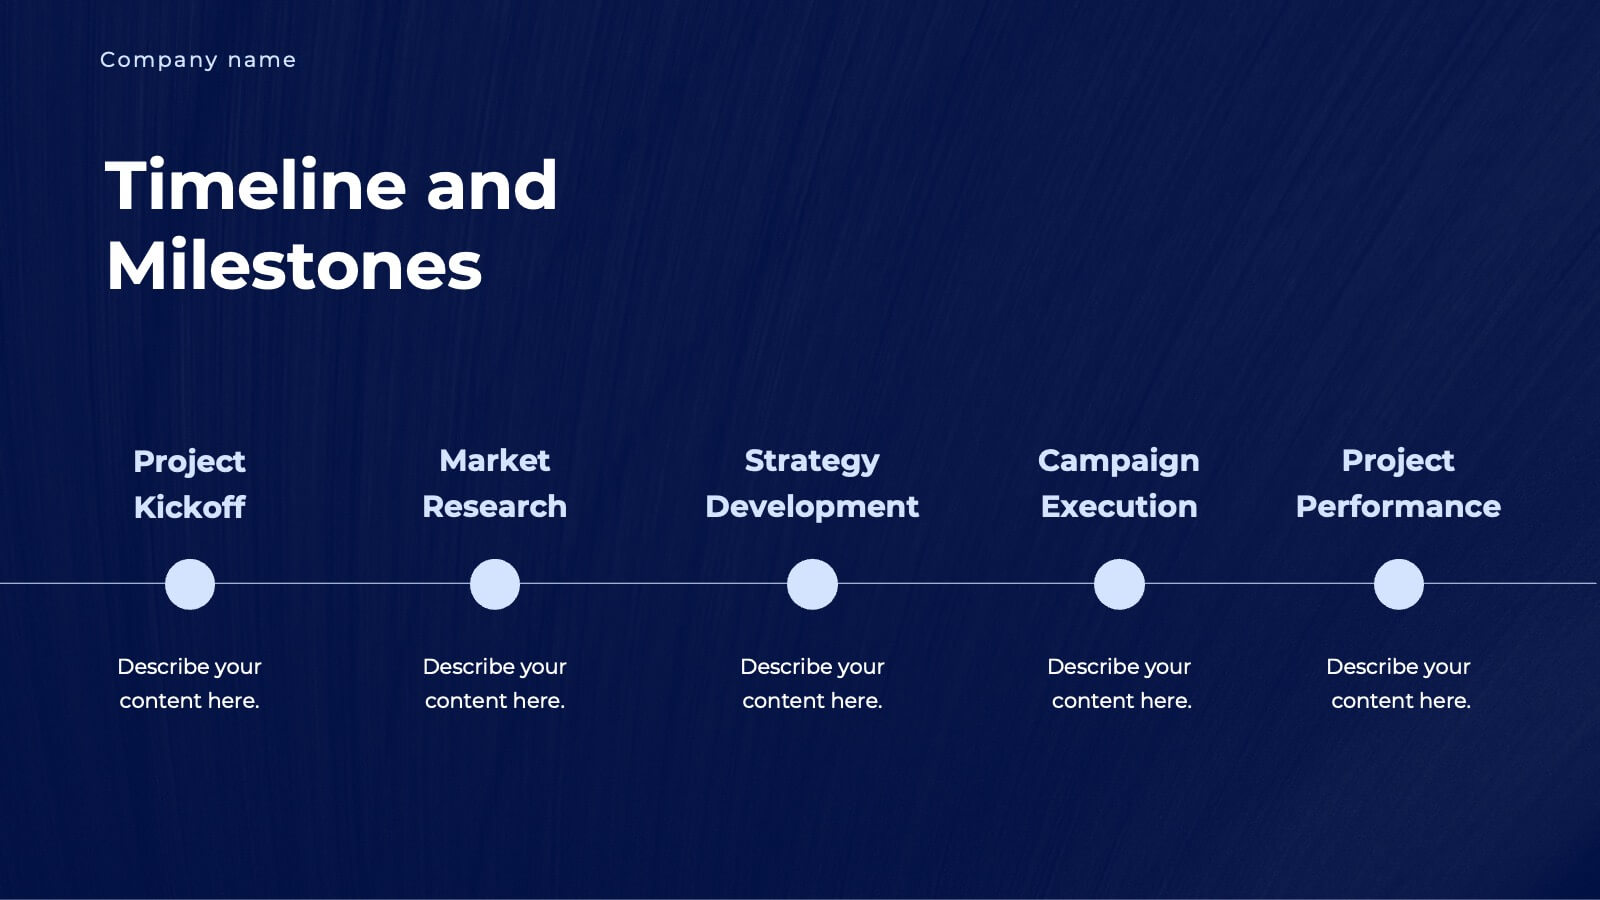
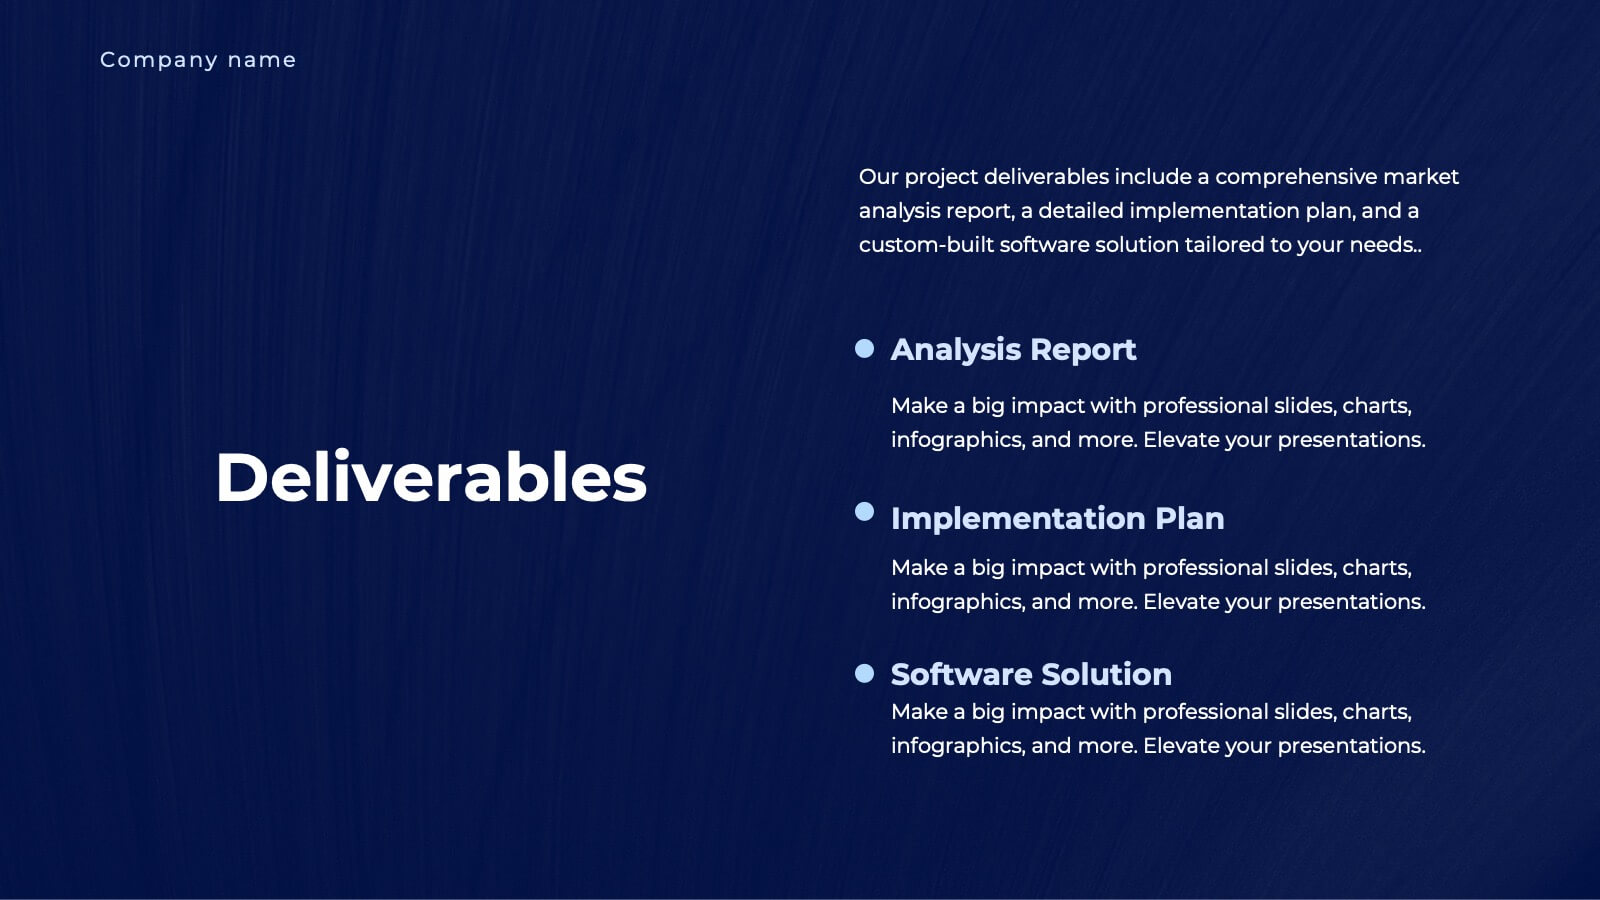
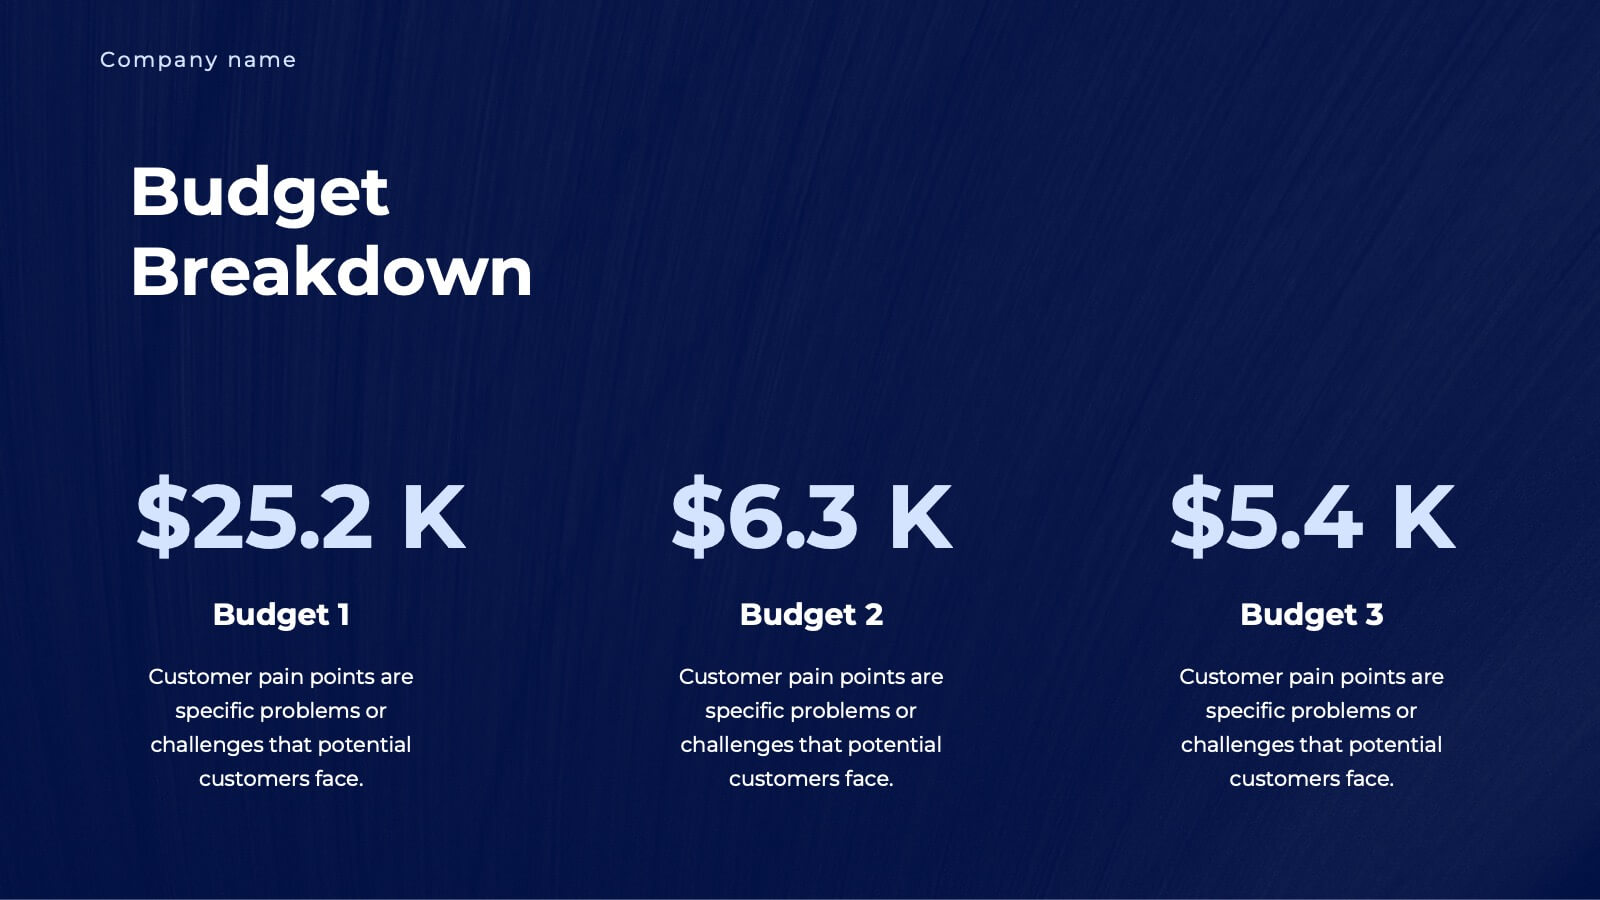
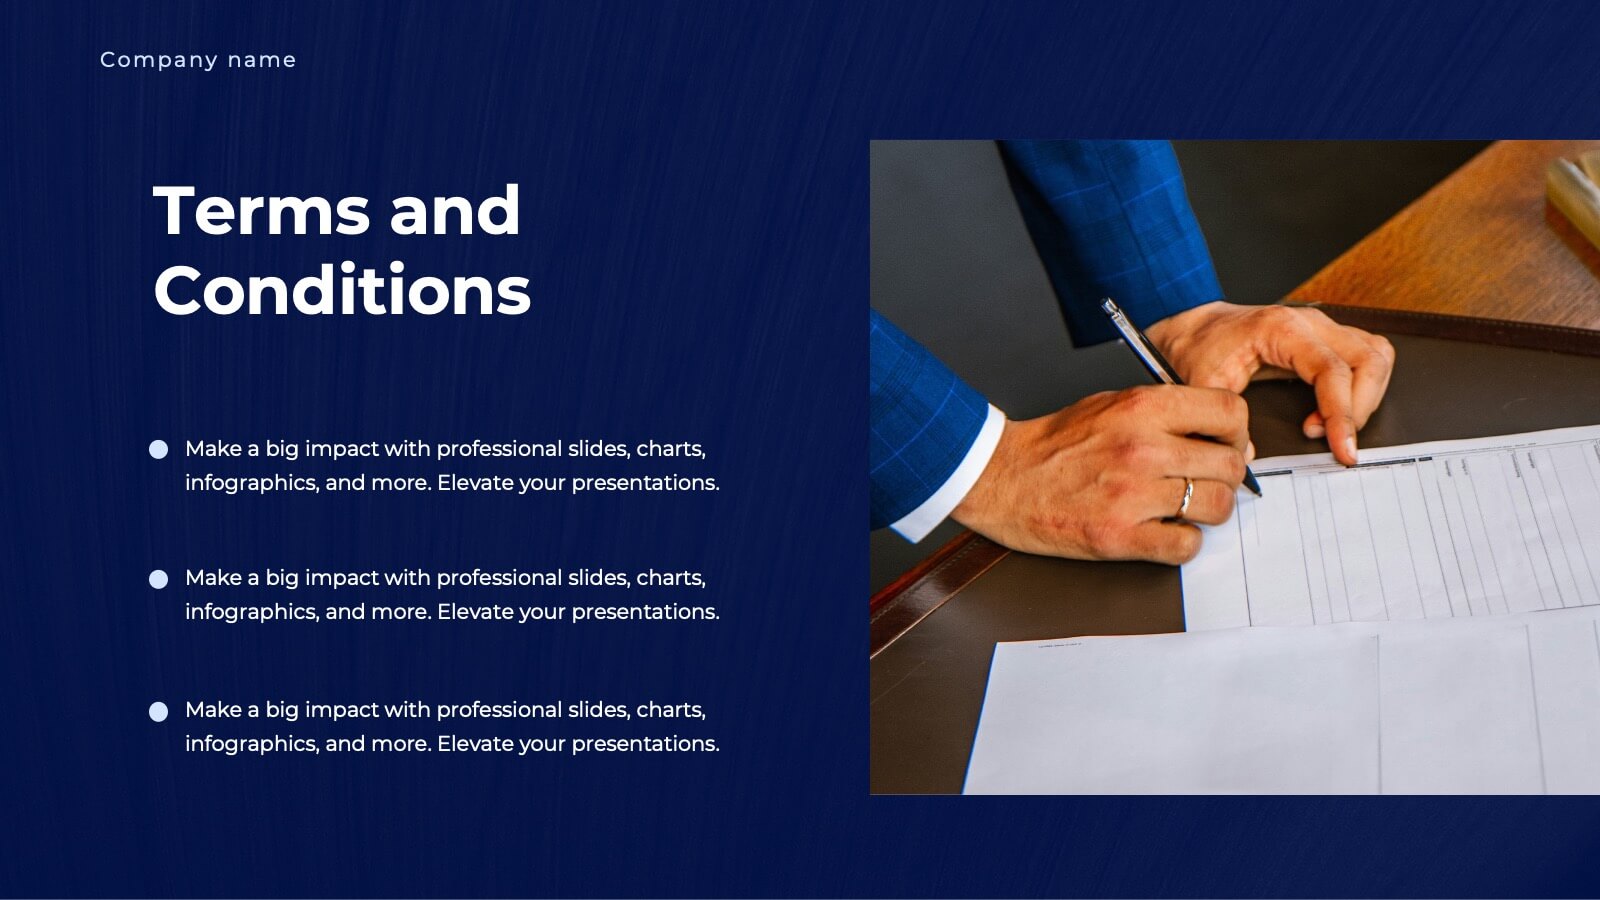
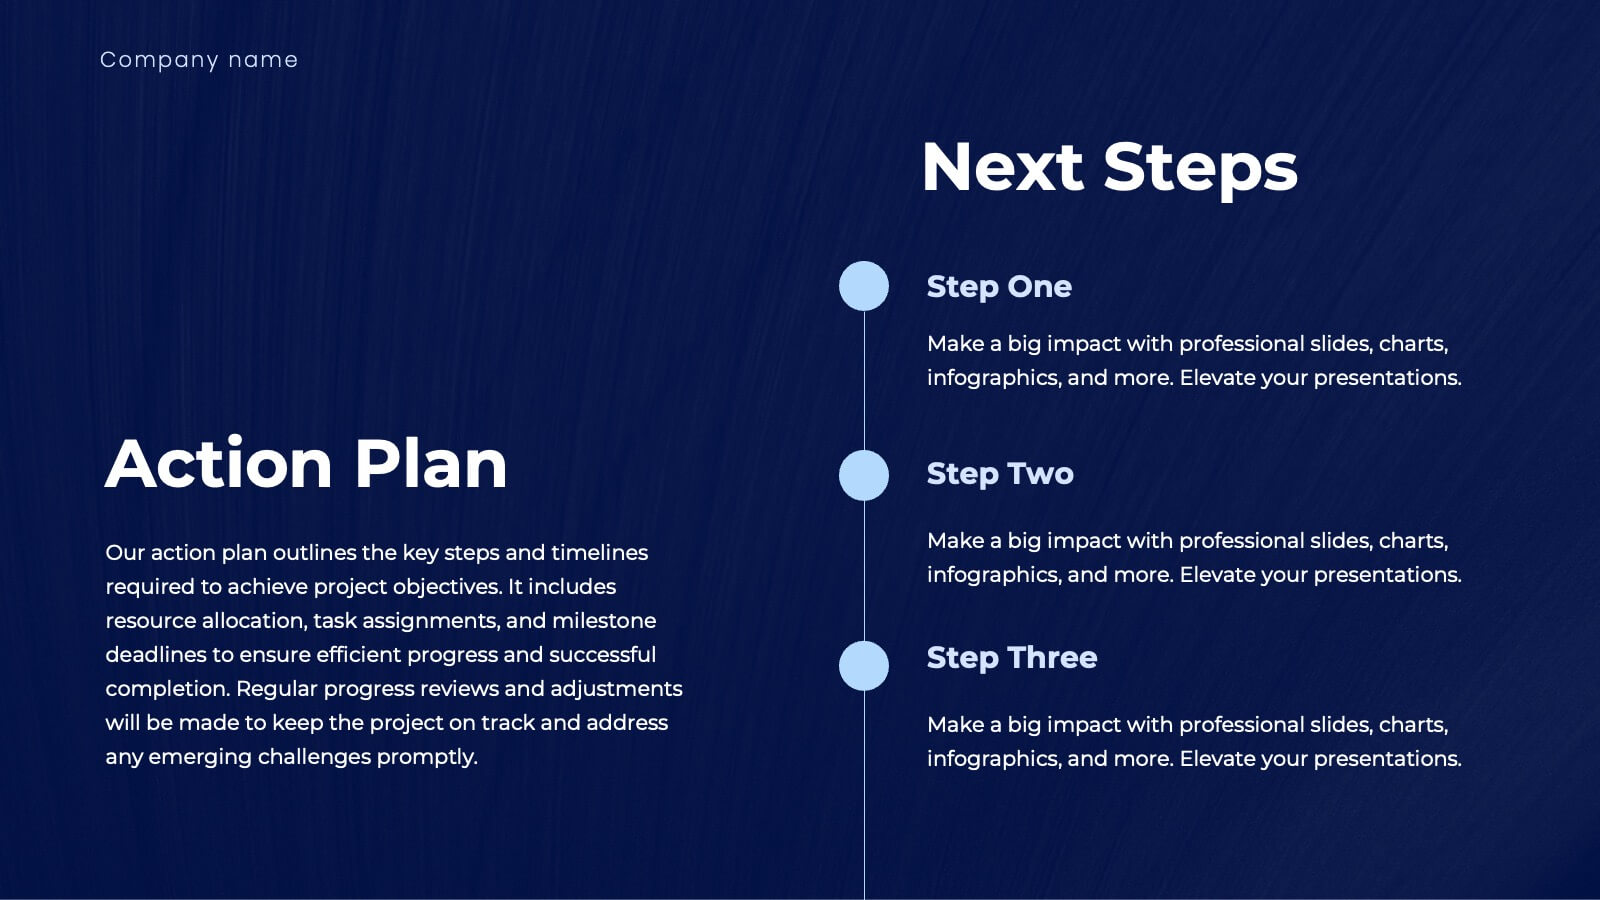
Unity Business Proposal Presentation
Take your business proposals to the next level with this elegant and comprehensive template! Perfect for presenting company overviews, project summaries, and detailed solutions. Ideal for business professionals looking to impress clients and stakeholders. Compatible with PowerPoint, Keynote, and Google Slides, this template ensures your proposals are impactful and professional.


4 diapositivas
Data Breach Prevention Planning Deck Presentation
Stop breaches before they start with this clean, visual data protection slide. Designed to help teams outline risks, access controls, and mitigation steps, this template makes complex security workflows easy to present. A great fit for compliance reviews or cybersecurity briefings. Compatible with PowerPoint, Keynote, and Google Slides.


6 diapositivas
Probability Venn Diagram Infographic
This infographic template displays a set of Probability Venn Diagrams. These are visual tools used to represent the logical relationships between different sets of items, commonly utilized in statistics. They are perfect for presentations to explain concepts like intersections, unions, and complements of sets. Each Venn diagram in the image varies in complexity and color scheme, providing a range of options to illustrate how individual sets overlap or differ, which is useful in showing probabilities, possible logical relations, and more. These diagrams can be especially helpful in business or academic settings where data relationships need to be clarified visually.


7 diapositivas
Fishbone Diagram Infographic Presentation Template
A Fishbone diagram, also called a cause-and-effect diagram, is a tool used to identify and analyze the potential causes of a particular problem or issue. It is named for its shape, which looks like a fish skeleton with the problem or effect as the head and the various causes as the bones. This template includes a variety of different fishbone diagrams, which are representations of fish skeletons that help show you the different causes of a problem. This template is easy to use and you can add your own information to make it look just how you want, and show how different causes are connected.


3 diapositivas
Organized Bullet Point Summary Presentation
Present key facts clearly with the Organized Bullet Point Summary Presentation. Designed for structured communication, this layout visually breaks down your main points with icons, color blocks, and percentage highlights. Perfect for reporting metrics, comparing ideas, or prioritizing tasks. Fully editable in PowerPoint, Keynote, and Google Slides.


5 diapositivas
Body System Overview Presentation
Visually explain key human body systems with this clean and modern slide. Each section highlights a different organ with labeled points (A–D) for easy reference. Ideal for health education, medical briefings, or anatomy lessons. Fully editable in PowerPoint, Keynote, or Google Slides to suit any professional or academic need.


12 diapositivas
Investment and Financial Portfolio Analysis Presentation
Visualize your data with confidence using this Investment and Financial Portfolio Analysis Presentation. Designed to help finance professionals showcase quarterly performance, allocated budgets, total selling ratios, and project earnings in one powerful slide. With customizable charts including bar graphs, pyramids, and pie charts, you can present complex numbers in a clean and compelling way. Fully editable in PowerPoint, Keynote, and Google Slides.


8 diapositivas
Directional Diagram with Progress Arrows Presentation
Showcase milestones, track development, or visualize progress with the Directional Diagram with Progress Arrows Presentation. This modern layout features arrow-based steps, making it ideal for roadmaps, process stages, or timeline breakdowns. Customize labels, icons, and colors to suit your message. Fully editable in PowerPoint, Google Slides, and Canva.


7 diapositivas
Technology Infographic Presentation Template
A technology infographic is a visual representation of information or data related to technology. The purpose of this template is to present your complex information in a simple, easy-to-understand manner. This template contains pre-designed layouts and images that can be used to structure your content in a variety of ways. This template is perfect to use to help explain technology-related topics such as software, hardware, cybersecurity, and more. Infographics are commonly used in the technology industry to help educate people about the latest trends, products, and services.


7 diapositivas
Anatomy Infographic Presentation Template
Anatomy infographics are visual representations of the different systems and structures of the human body. They are designed to convey complex information in an easily manner and visually appealing way. Our anatomy template include images, diagrams, and text to provide an overview of the different systems of the human body, such as the skeletal, muscular, and cardiovascular systems. Our template can be used for a variety of purposes, including education, medical training, and patient education. The text, colors and images can be easily modified to suit your needs and preferences!


4 diapositivas
Social Media Analytics Dashboard Presentation
Easily monitor and report on your content performance with the Social Media Analytics Dashboard Presentation. This sleek, modular layout combines key metrics like items, uploads, comments, and feeds with a vertical bar chart to visualize insights across platforms. Ideal for campaign reviews, stakeholder updates, or team reporting. Fully customizable in PowerPoint, Keynote, and Google Slides.


7 diapositivas
Demographic Data Infographic
Demographic data refers to information that characterizes the composition of a population or a specific group based on various socio-economic factors. Our demographic data infographic is not just a graphic, this is a powerful visualization that explores society and empowers decision-makers to understand, connect, and prosper. Prepare for an exhilarating journey through demographics, where data transforms into meaningful insights. Compatible with Powerpoint, Keynote, and Google Slides. This can be used for a variety of purposes, including market research, targeted marketing, policy development, resource allocation, urban planning, and more.


6 diapositivas
Life Insurance Infographic
Life insurance is a contract between an individual and an insurance company, where the insurance company agrees to pay a sum of money (the death benefit) to the designated beneficiaries upon the death of the insured person. This infographic template is designed to provide a clear and concise overview of what life insurance is, why it is important, and the different types of life insurance coverage available. This infographic aims to educate and inform individuals about the value of life insurance in protecting their loved ones and securing their financial future. This infographic is compatible with Powerpoint, Keynote, and Google Slides.


6 diapositivas
Business Benefits Highlights Presentation
Bring your business advantages to life with a vibrant, structured layout that captures attention instantly. This professional design helps you showcase key strengths, achievements, or milestones with clarity and impact. Ideal for company overviews or reports, it’s fully compatible with PowerPoint, Keynote, and Google Slides for easy customization and presentation.


5 diapositivas
The Future of Food Waste Infographics
Food Waste refers to the loss or disposal of food that is still edible or could have been consumed. These infographic template are designed with the aim of raising awareness, inspiring change, and empowering individuals and organizations to take action towards a more sustainable food system. These infographics are perfect for anyone interested in understanding the future trajectory of food waste and exploring potential solutions. With these infographic templates, create a presentation that inspires action and foster a collective commitment to combating food waste for a more sustainable future.


8 diapositivas
Funding Proposal and Investment Deck
Showcase your growth strategy with the Funding Proposal and Investment Deck Presentation. This slide design features a creative plant graphic to illustrate funding stages—perfect for investment overviews, revenue growth, or pitch decks. Each pot represents a stage of funding, with visual markers for financial milestones. Fully editable in PowerPoint, Keynote, and Google Slides.


7 diapositivas
Butterfly Visualization Layout Presentation
Bring balance and clarity to your data storytelling with a sleek, symmetrical design that connects ideas seamlessly. This presentation is ideal for visualizing comparisons, workflows, or interconnected topics in a clean and engaging format. Fully customizable and compatible with PowerPoint, Keynote, and Google Slides.