


Características


¿Tienes alguna pregunta?
Recomendar


26 diapositivas
Creative Programming Presentation
The process of Developing Software involves the development of everything from a simple application or web page to complex enterprise systems. Software development is a collaborative effort between developers, designers, and other stakeholders. This Creative Template is perfect for delivering presentations about the latest projects, apps and ideas. The simple layout allows you to focus on what matters most, your idea. Make your most important presentation spectacular with this template. With high-powered visual content and a smooth flow, you’ll keep your audience engaged from beginning to end!


26 diapositivas
Market Growth Tactics Presentation
Chart a path to success with our Market Growth Tactics presentation template, designed for seamless use in PowerPoint, Keynote, and Google Slides. This template is a vital asset for business strategists, marketing professionals, and consultants who aim to drive growth and capture market share. Our Market Growth Tactics template lays out a strategic framework for identifying and leveraging growth opportunities. It provides a comprehensive array of slides to showcase market analysis, competitive landscape, growth strategies, and execution plans. With customizable elements, you can tailor your presentation to reflect specific market insights and growth targets relevant to your audience. The template is crafted to facilitate clear communication of complex growth strategies, breaking them down into actionable steps with the aid of charts, graphs, and infographics. This helps to convey your message effectively, ensuring that your audience can visualize the growth journey and understand the tactics involved. Elevate your market growth presentations and become an authoritative voice in your industry with our SEO-optimized template, designed to engage, inform, and inspire action towards market expansion.


6 diapositivas
Supply & Freight Route Management Deck Presentation
Take your logistics reporting to the next level with this circular supply route diagram. Ideal for visualizing freight movement, delivery checkpoints, and warehouse coordination, this slide offers a clean and organized way to map your operational flow. Fully compatible with PowerPoint, Keynote, and Google Slides.


6 diapositivas
Shopping Pricing Tables Infographic
Pricing tables are visual tools commonly used on websites, product pages, and marketing materials to showcase different pricing options for products or services. This infographic template displays different pricing plans or packages offered by a business or service provider. This provides a clear comparison of features, benefits, and costs, helping viewers make informed decisions about which option best suits their needs and budget. This infographic is designed to help customers quickly compare features, costs, and benefits of each plan, aiding in their decision-making process. Compatible with Powerpoint, Keynote, and Google Slides.


7 diapositivas
Corporate Training Infographic
Enhance your corporate training program with our engaging Infographic, designed to succinctly communicate the key elements of effective employee development. Ideal for HR managers and corporate trainers, this Infographic provides a visual summary of training strategies and success metrics. Our Corporate Training Infographic includes sections on training goals, interactive learning approaches, progress tracking, and feedback collection. It's crafted to facilitate quick comprehension and retention of corporate training concepts, making it a perfect tool for internal communication and team meetings. The customizable layout allows you to highlight specific training outcomes, participant engagement, and the benefits of ongoing professional development. This SEO-friendly Infographic is tailored to attract professionals focused on boosting their team's performance and skills. Implement our Infographic to streamline your training processes and showcase the value of learning and development within your organization.


5 diapositivas
Business Introduction and Company Profile Presentation
Introduce your business with precision and clarity using this company profile layout. Highlight your mission, vision, and key insights alongside sleek visuals and structured content. Perfect for new client onboarding, internal briefings, or stakeholder presentations. Fully editable in PowerPoint, Keynote, and Google Slides for seamless, professional customization.


21 diapositivas
Werewolf Scientific Research Presentation
This scientific research presentation template is designed to streamline your research findings with clarity and precision. It features sections for literature review, methodology, data analysis, and key results, ensuring every detail is communicated effectively. Perfect for academic or scientific contexts, it’s fully customizable in PowerPoint, Keynote, and Google Slides.


4 diapositivas
Professional Team Profiles and Roles Presentation
Showcase your team with impact using the Professional Team Profiles and Roles Presentation. Ideal for company introductions, this slide highlights key members with photo, name, title, and a brief role description. Clean, modern layout makes it easy to customize in PowerPoint, Canva, or Google Slides to match your brand.


5 diapositivas
International Reach World Map Presentation
Bring your global story to life with a clean, modern layout that highlights key regions and data points in a visually engaging way. This presentation helps you showcase international impact, market presence, or worldwide performance with clarity and confidence. Fully compatible with PowerPoint, Keynote, and Google Slides.


6 diapositivas
IT Security and Data Protection
Safeguard your digital infrastructure with this sleek 6-step IT security infographic. Centered around a shield icon, this layout is ideal for cybersecurity briefings, data compliance protocols, and risk assessments. Fully customizable in PowerPoint, Keynote, and Google Slides—perfect for IT professionals and corporate tech teams.


4 diapositivas
Comparison Table for Features & Data
Easily compare key features with the Comparison Table for Features & Data Presentation. This layout displays a side-by-side visual of two options, products, or services—ideal for showcasing benefits, pricing tiers, or performance metrics. With three rows of comparison points, central icons, and clean headings, this template is fully editable in PowerPoint, Keynote, or Google Slides.


7 diapositivas
Company Vision Infographic
Discover a suite of Slide Templates designed to articulate strategic goals and company ethos. These templates vary in design, from minimalistic and professional layouts to vibrant and dynamic presentations. Each template integrates elements that allow for a clear depiction of objectives, facilitating effective communication across your organization. These templates are perfect for executives and team leaders looking to present long-term strategies and unify their team's vision. They come equipped with customizable features to align with your company’s branding, ensuring a coherent and impactful presentation. Ideal for corporate presentations, stakeholder meetings, and internal communications, these templates provide a sophisticated tool to express and reinforce your strategic direction.


10 diapositivas
Work Schedule Planning Slide
Visualize your team's daily workflow and time management with this clock-style work schedule slide. Perfect for highlighting shift changes, project timelines, or key work intervals. Fully editable and available for PowerPoint, Keynote, and Google Slides to match your project’s branding and scheduling needs.


6 diapositivas
PESTEL Environment Analysis Infographics
Elevate your strategic analysis presentations with our PESTEL Environment Analysis infographic template. Designed for PowerPoint, Keynote, and Google Slides, this template is a must-have for business strategists, analysts, and students alike. This template efficiently breaks down the complex components of PESTEL analysis - Political, Economic, Social, Technological, Environmental, and Legal factors. Each segment is given its own distinct space, making it easy to input and display your analysis in a clear, organized manner. The sophisticated and educational design of the template ensures that your content is both accessible and engaging. The diverse yet harmonious color palette of the template enhances its visual appeal, reflecting the multifaceted nature of PESTEL analysis. This makes it ideal for detailed presentations where clarity and aesthetics are key. Whether you're presenting to a classroom, a boardroom, or at a conference, this infographic template will help you convey your environmental analysis with professionalism and style.


12 diapositivas
Alphabet Learning and Education Presentation
Introduce concepts creatively with this bold "A"-shaped infographic designed for education topics. Each segment of the letter highlights a numbered point, making it ideal for step-by-step instructions, learning stages, or literacy development. Use it to simplify complex ideas visually. Fully editable in PowerPoint, Keynote, and Google Slides.


5 diapositivas
Large-Scale Data Strategy Template Presentation
Present your data strategy with clarity using this four-step triangle layout. Each triangle highlights a key phase, ideal for outlining processes like planning, cloud adoption, integration, and scalability. Clean icons and a modern design enhance communication. Fully editable and compatible with PowerPoint, Keynote, and Google Slides for flexible use.
20 diapositivas
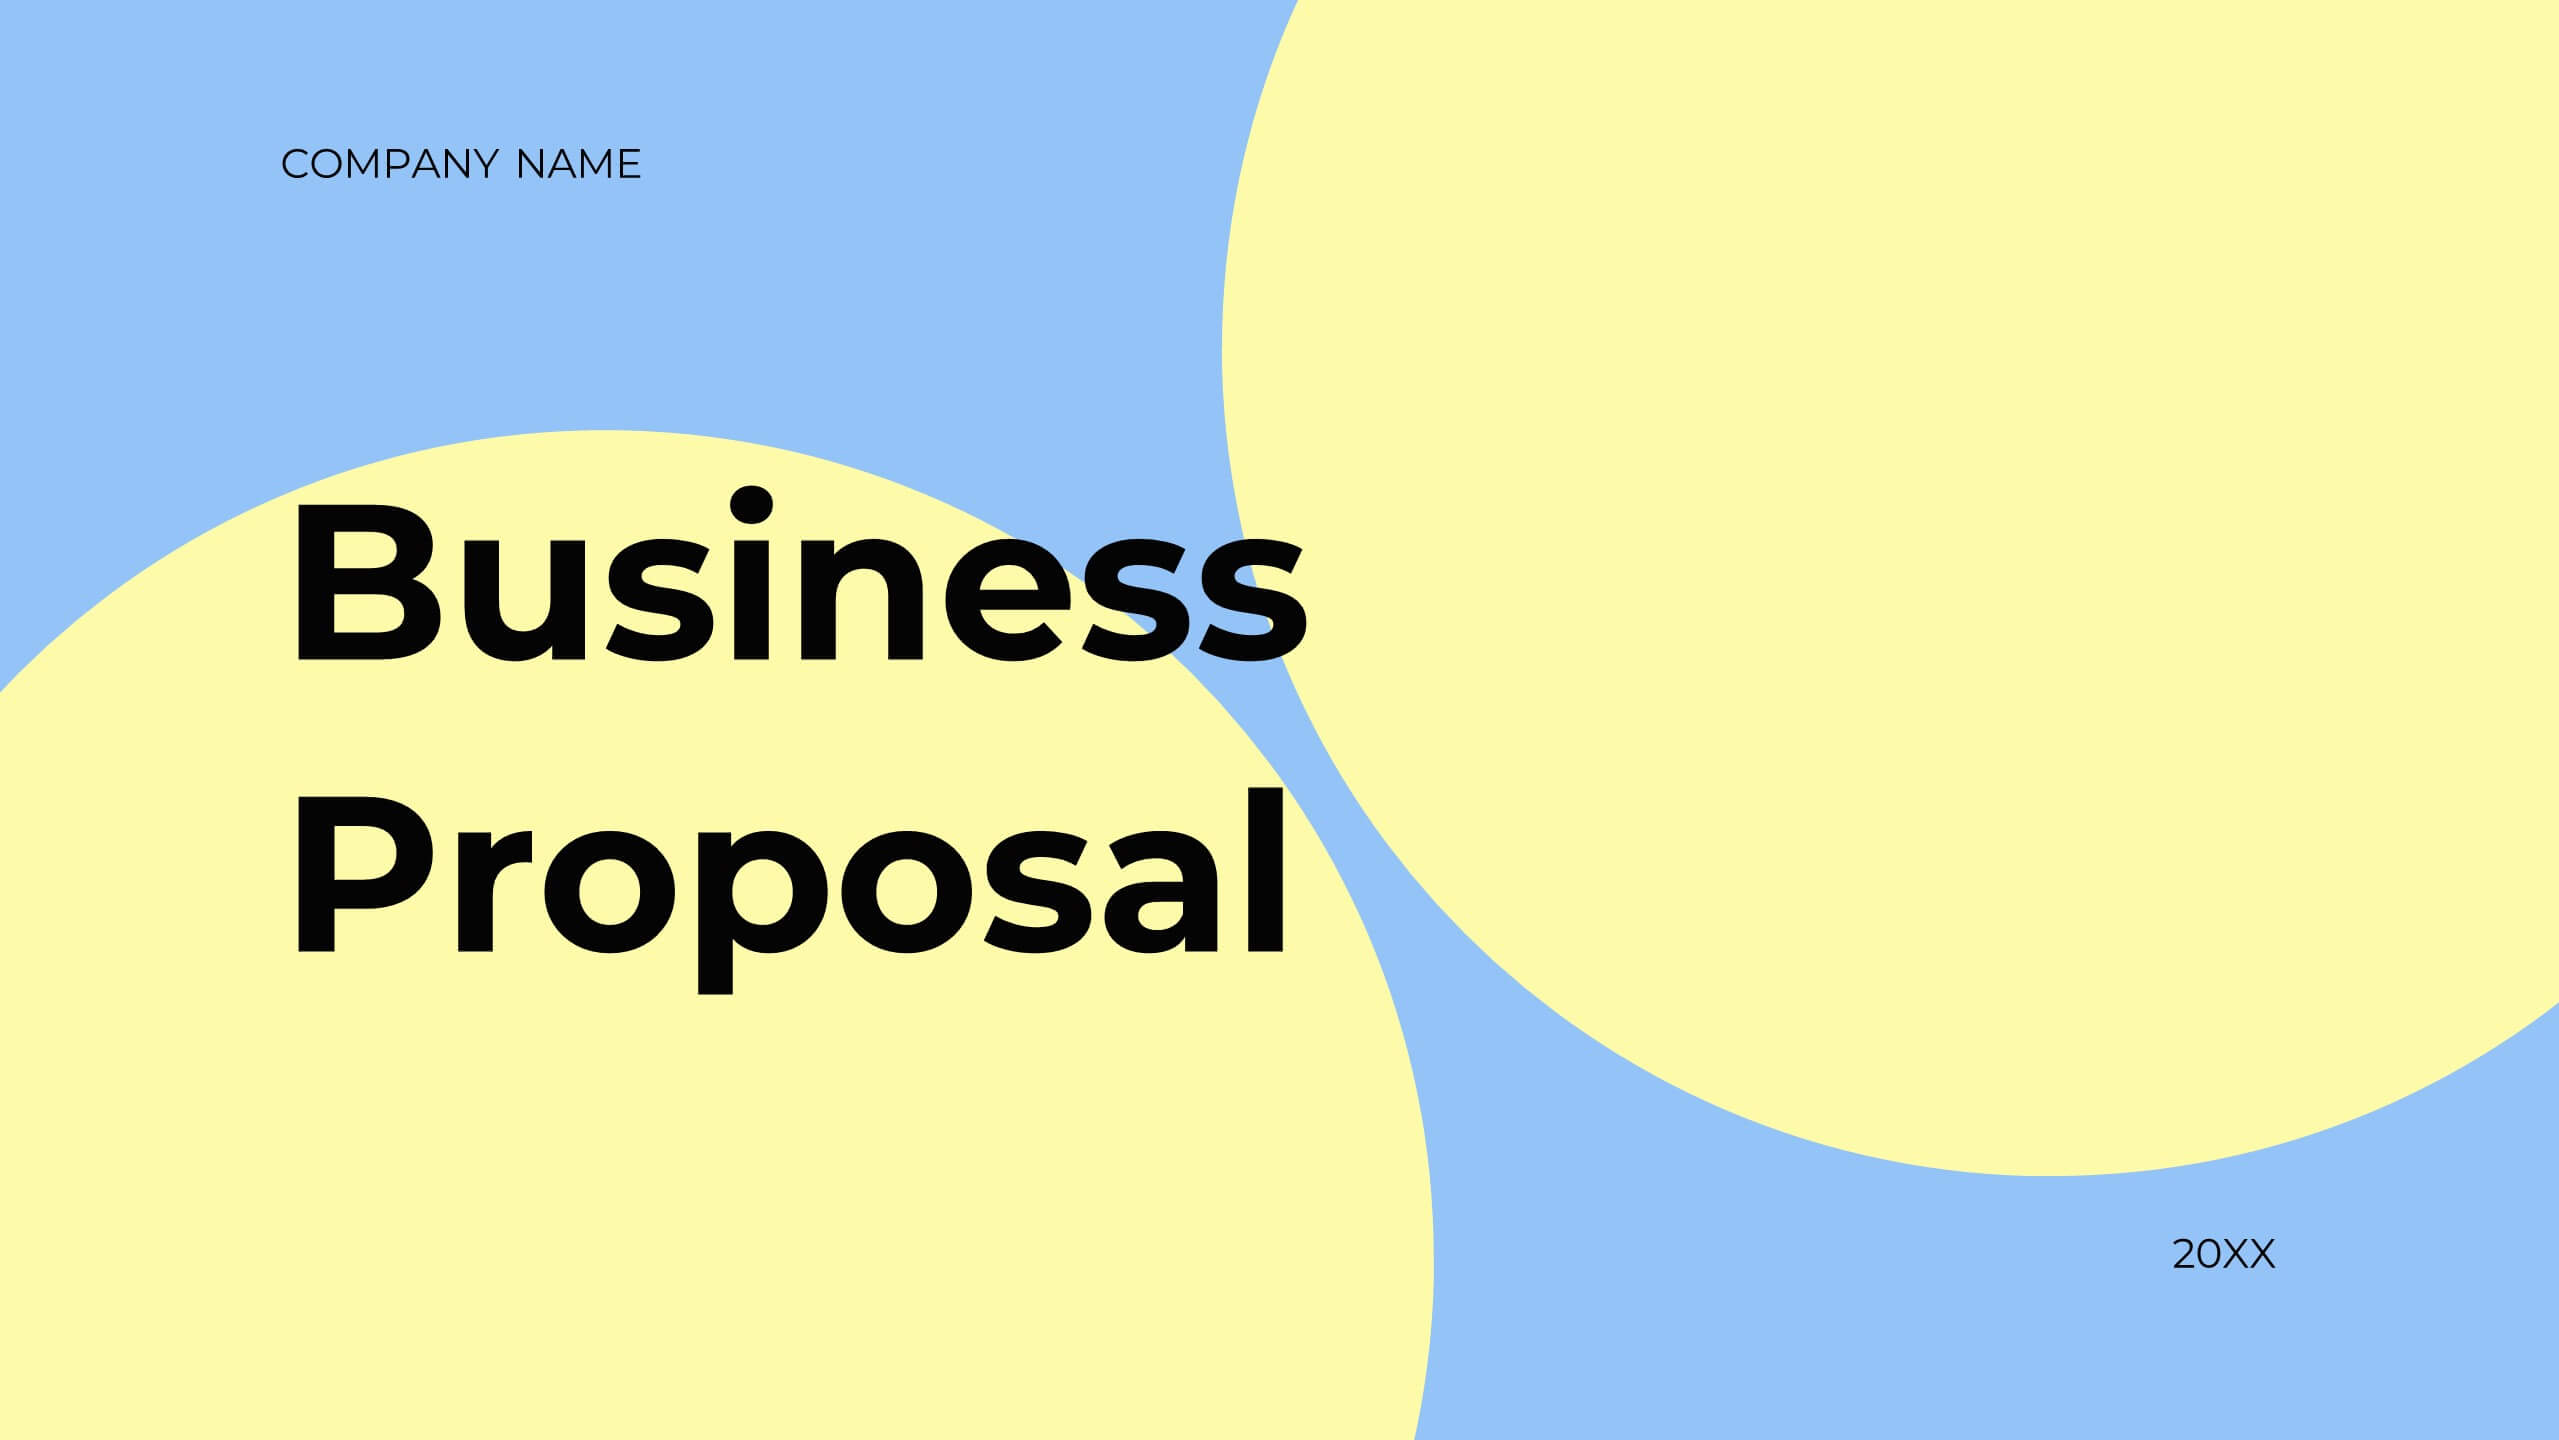
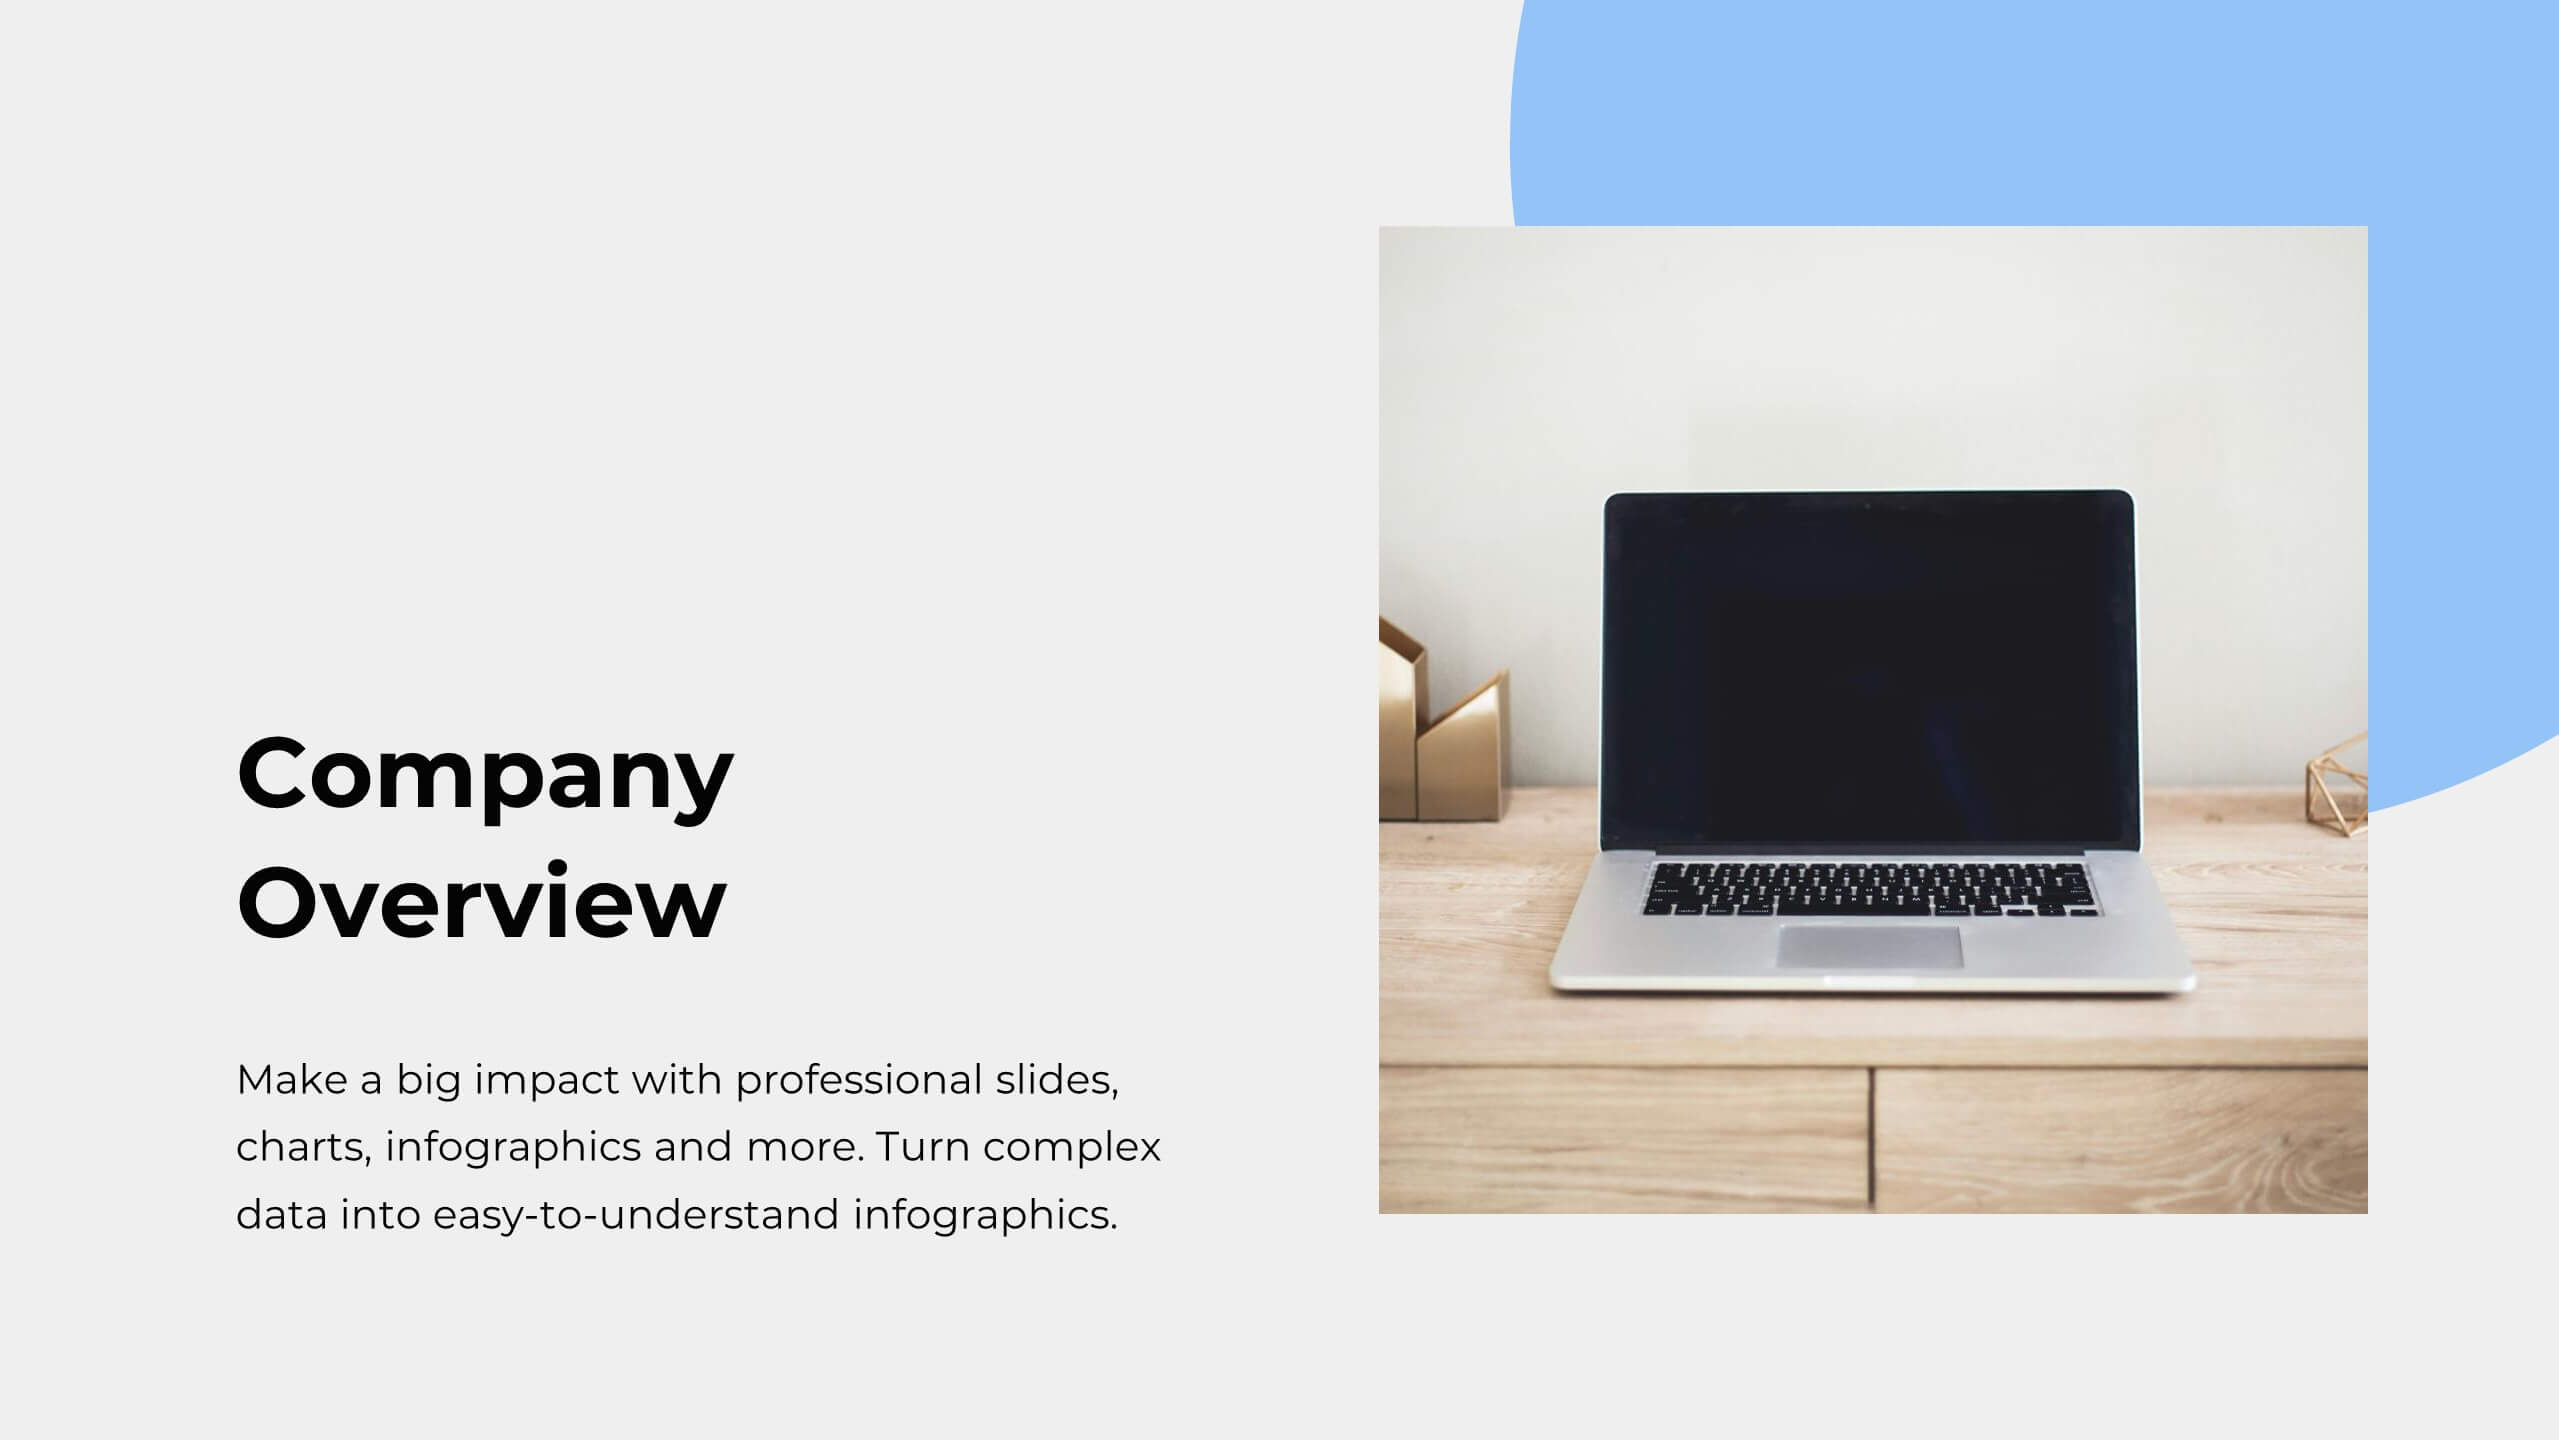
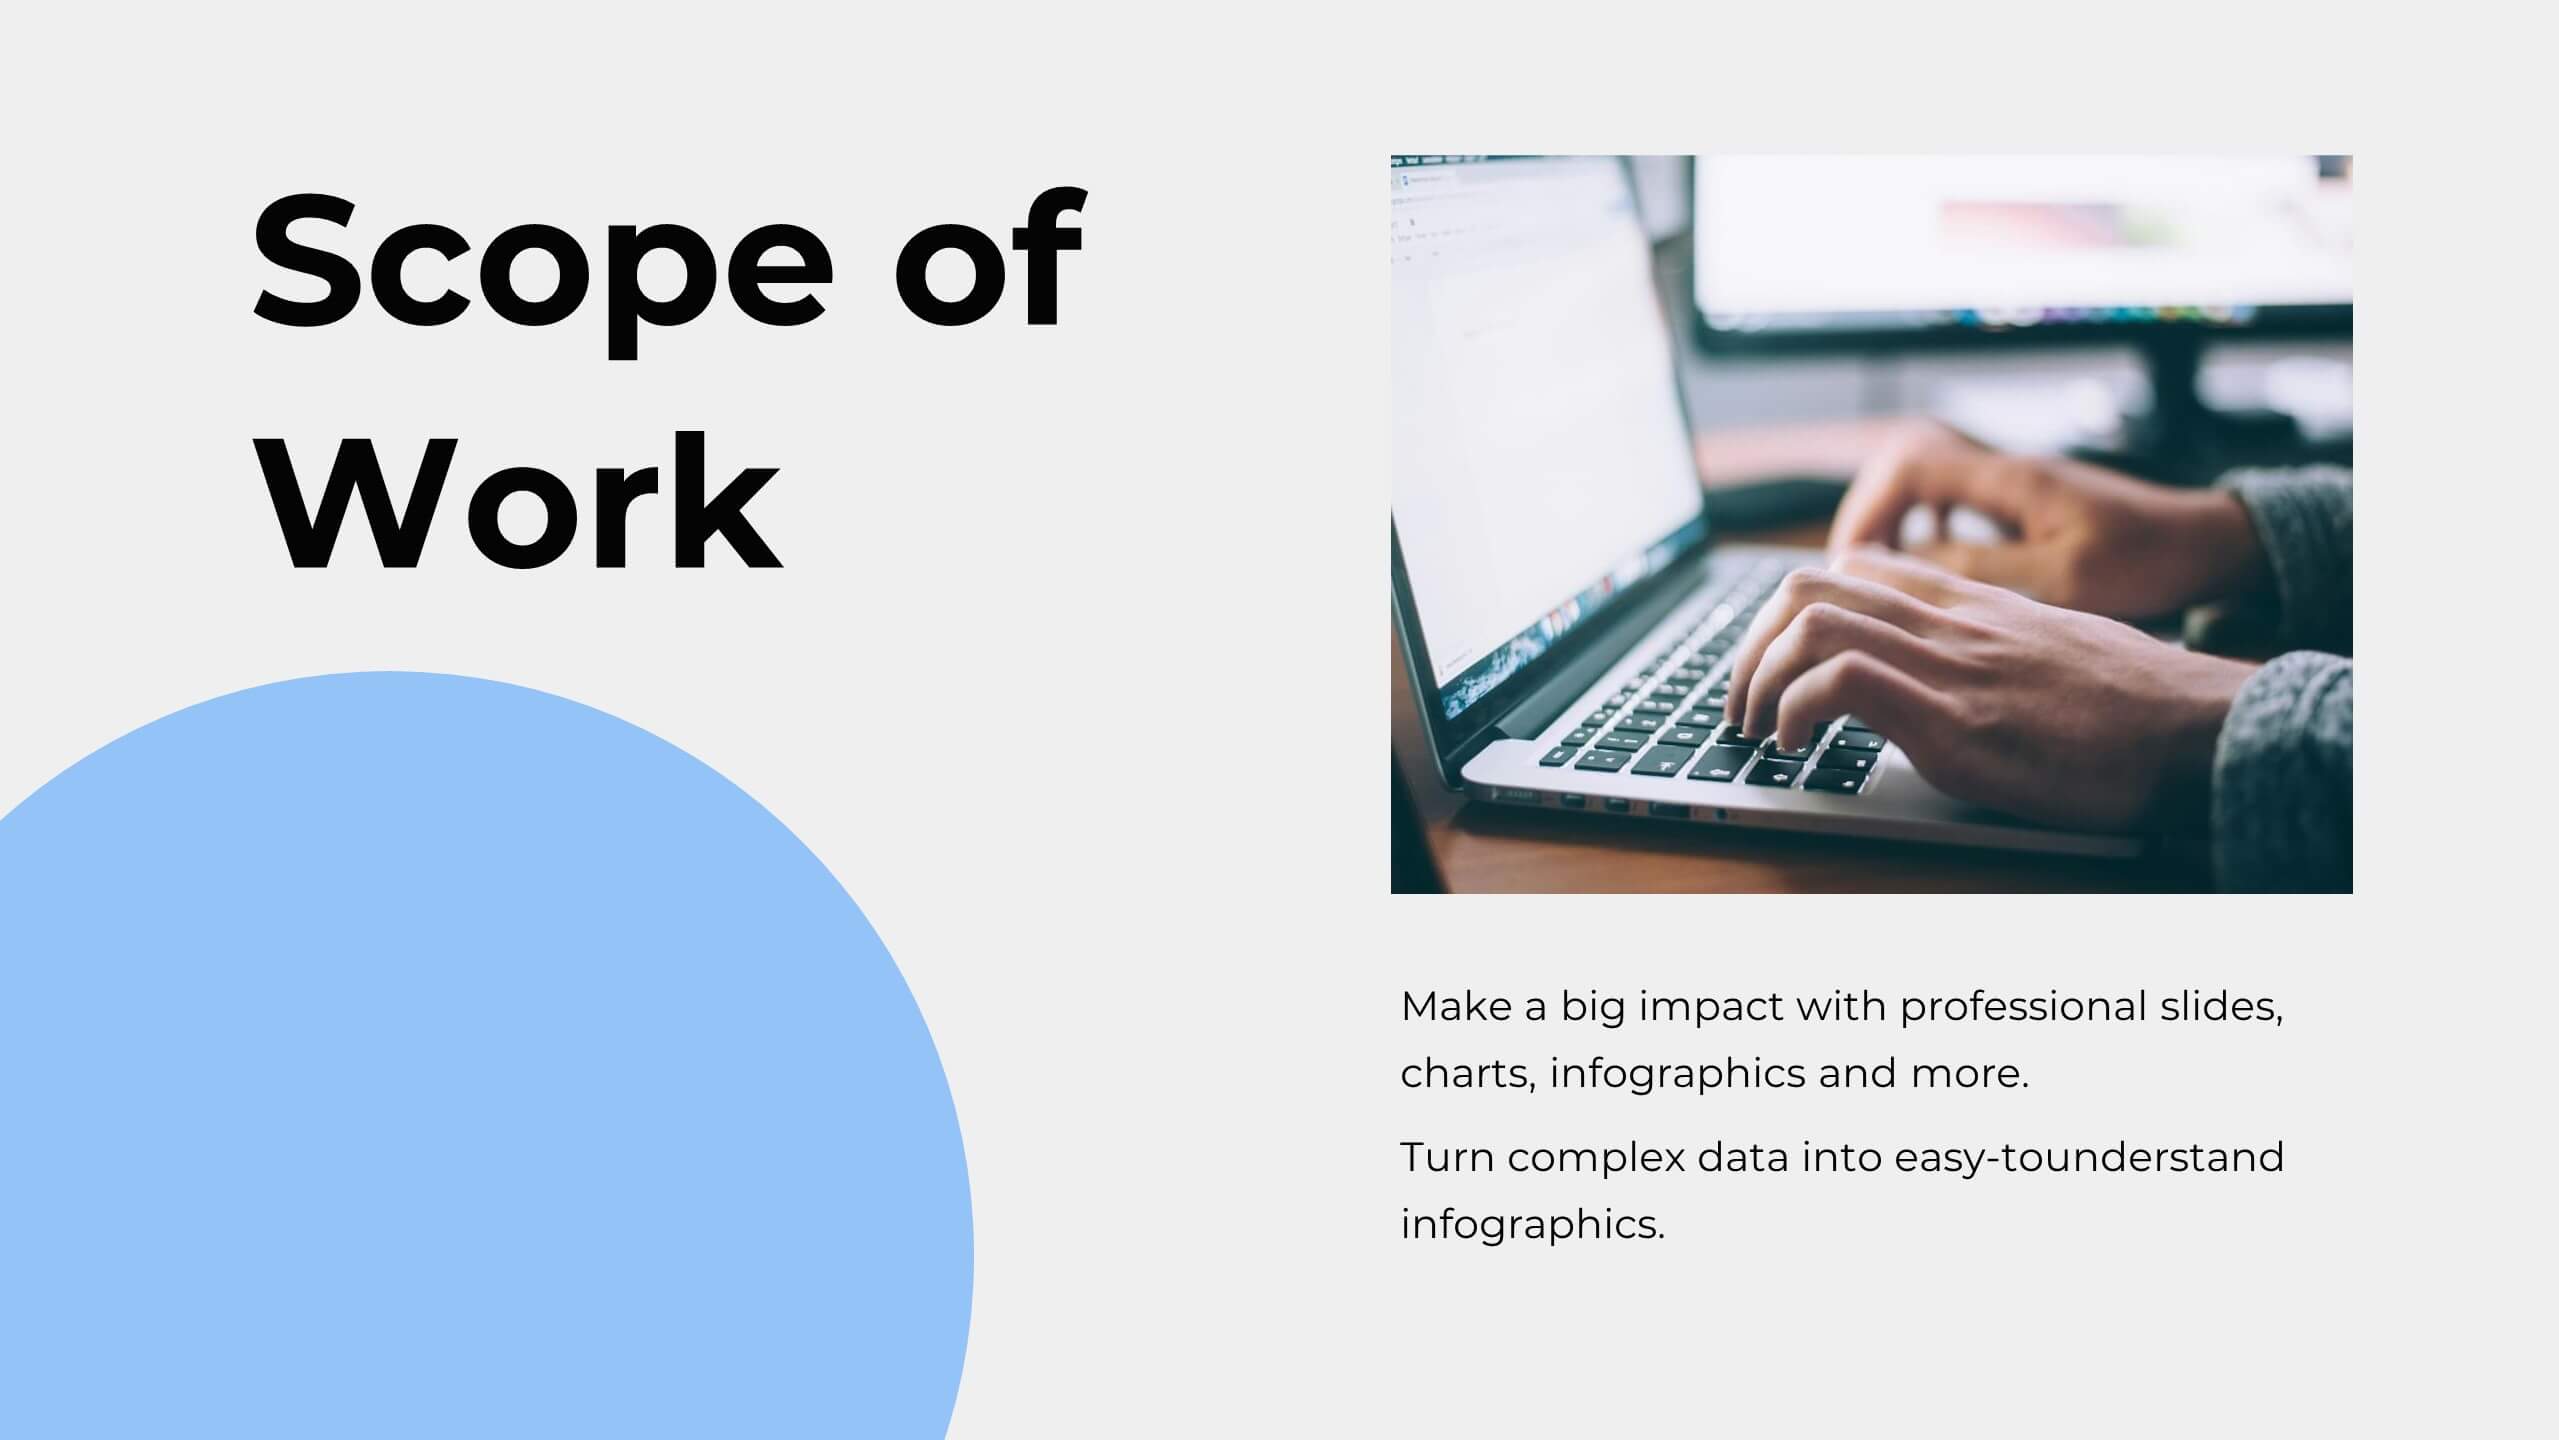
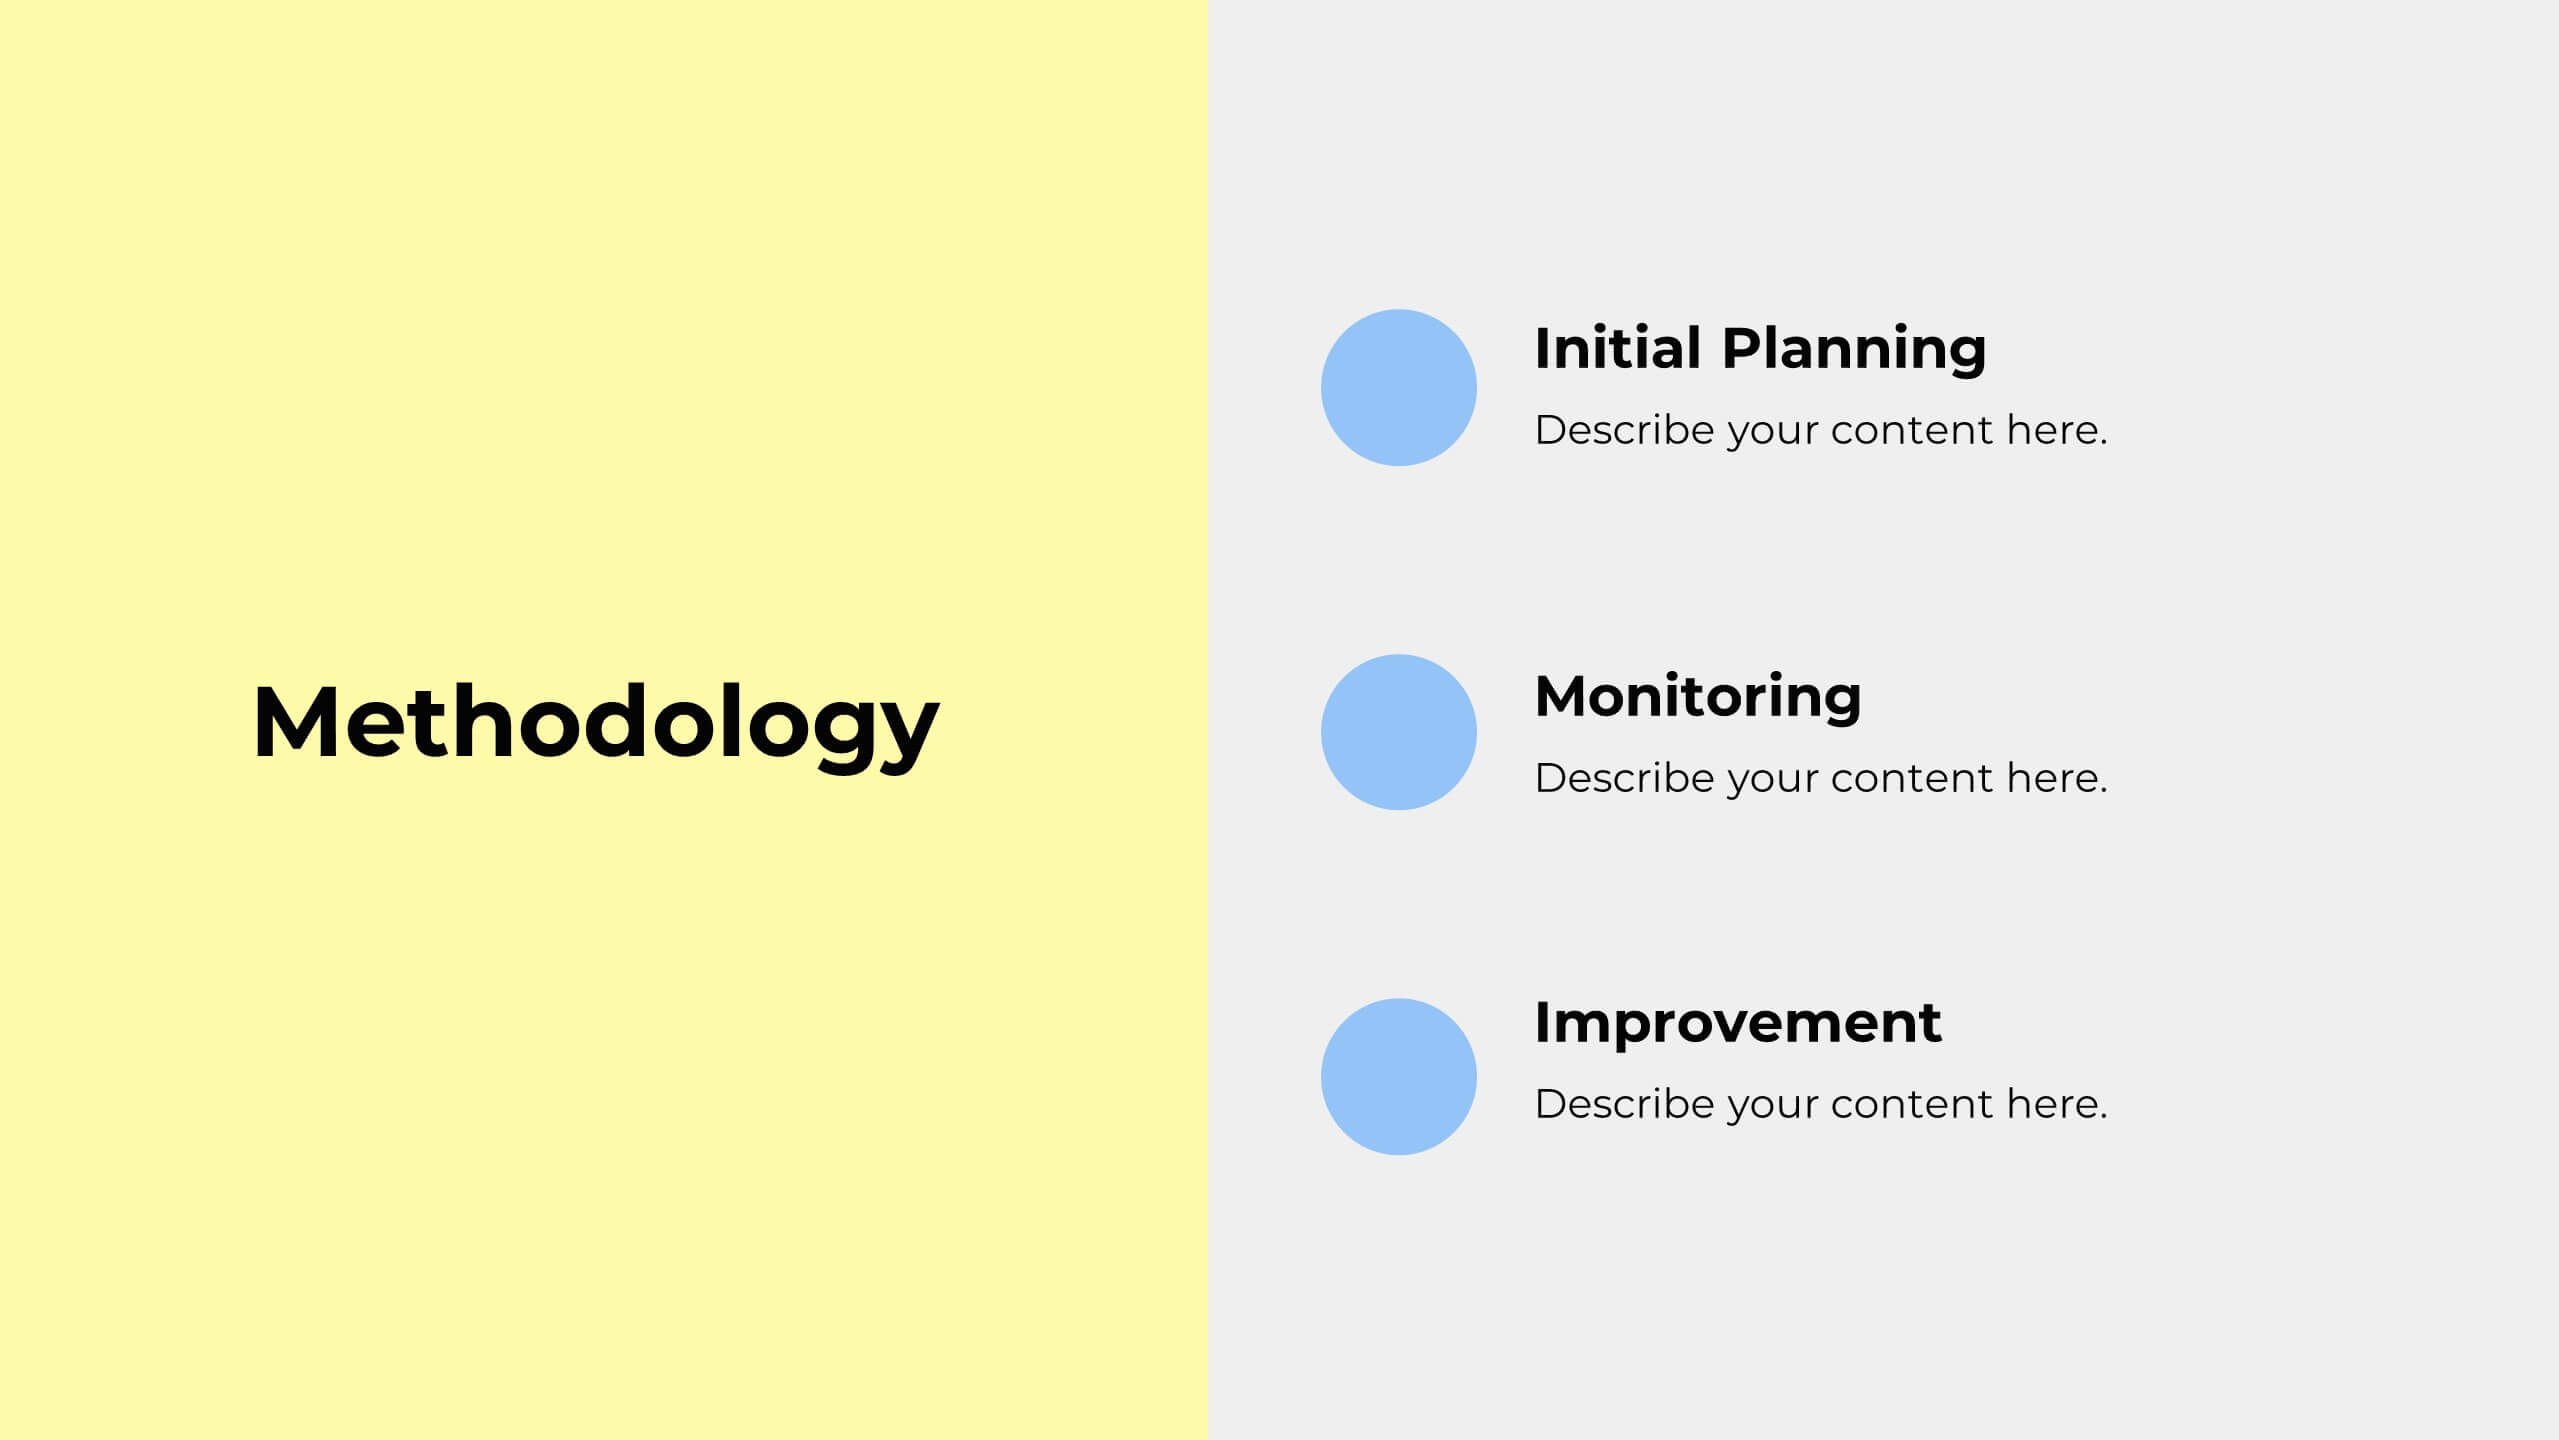
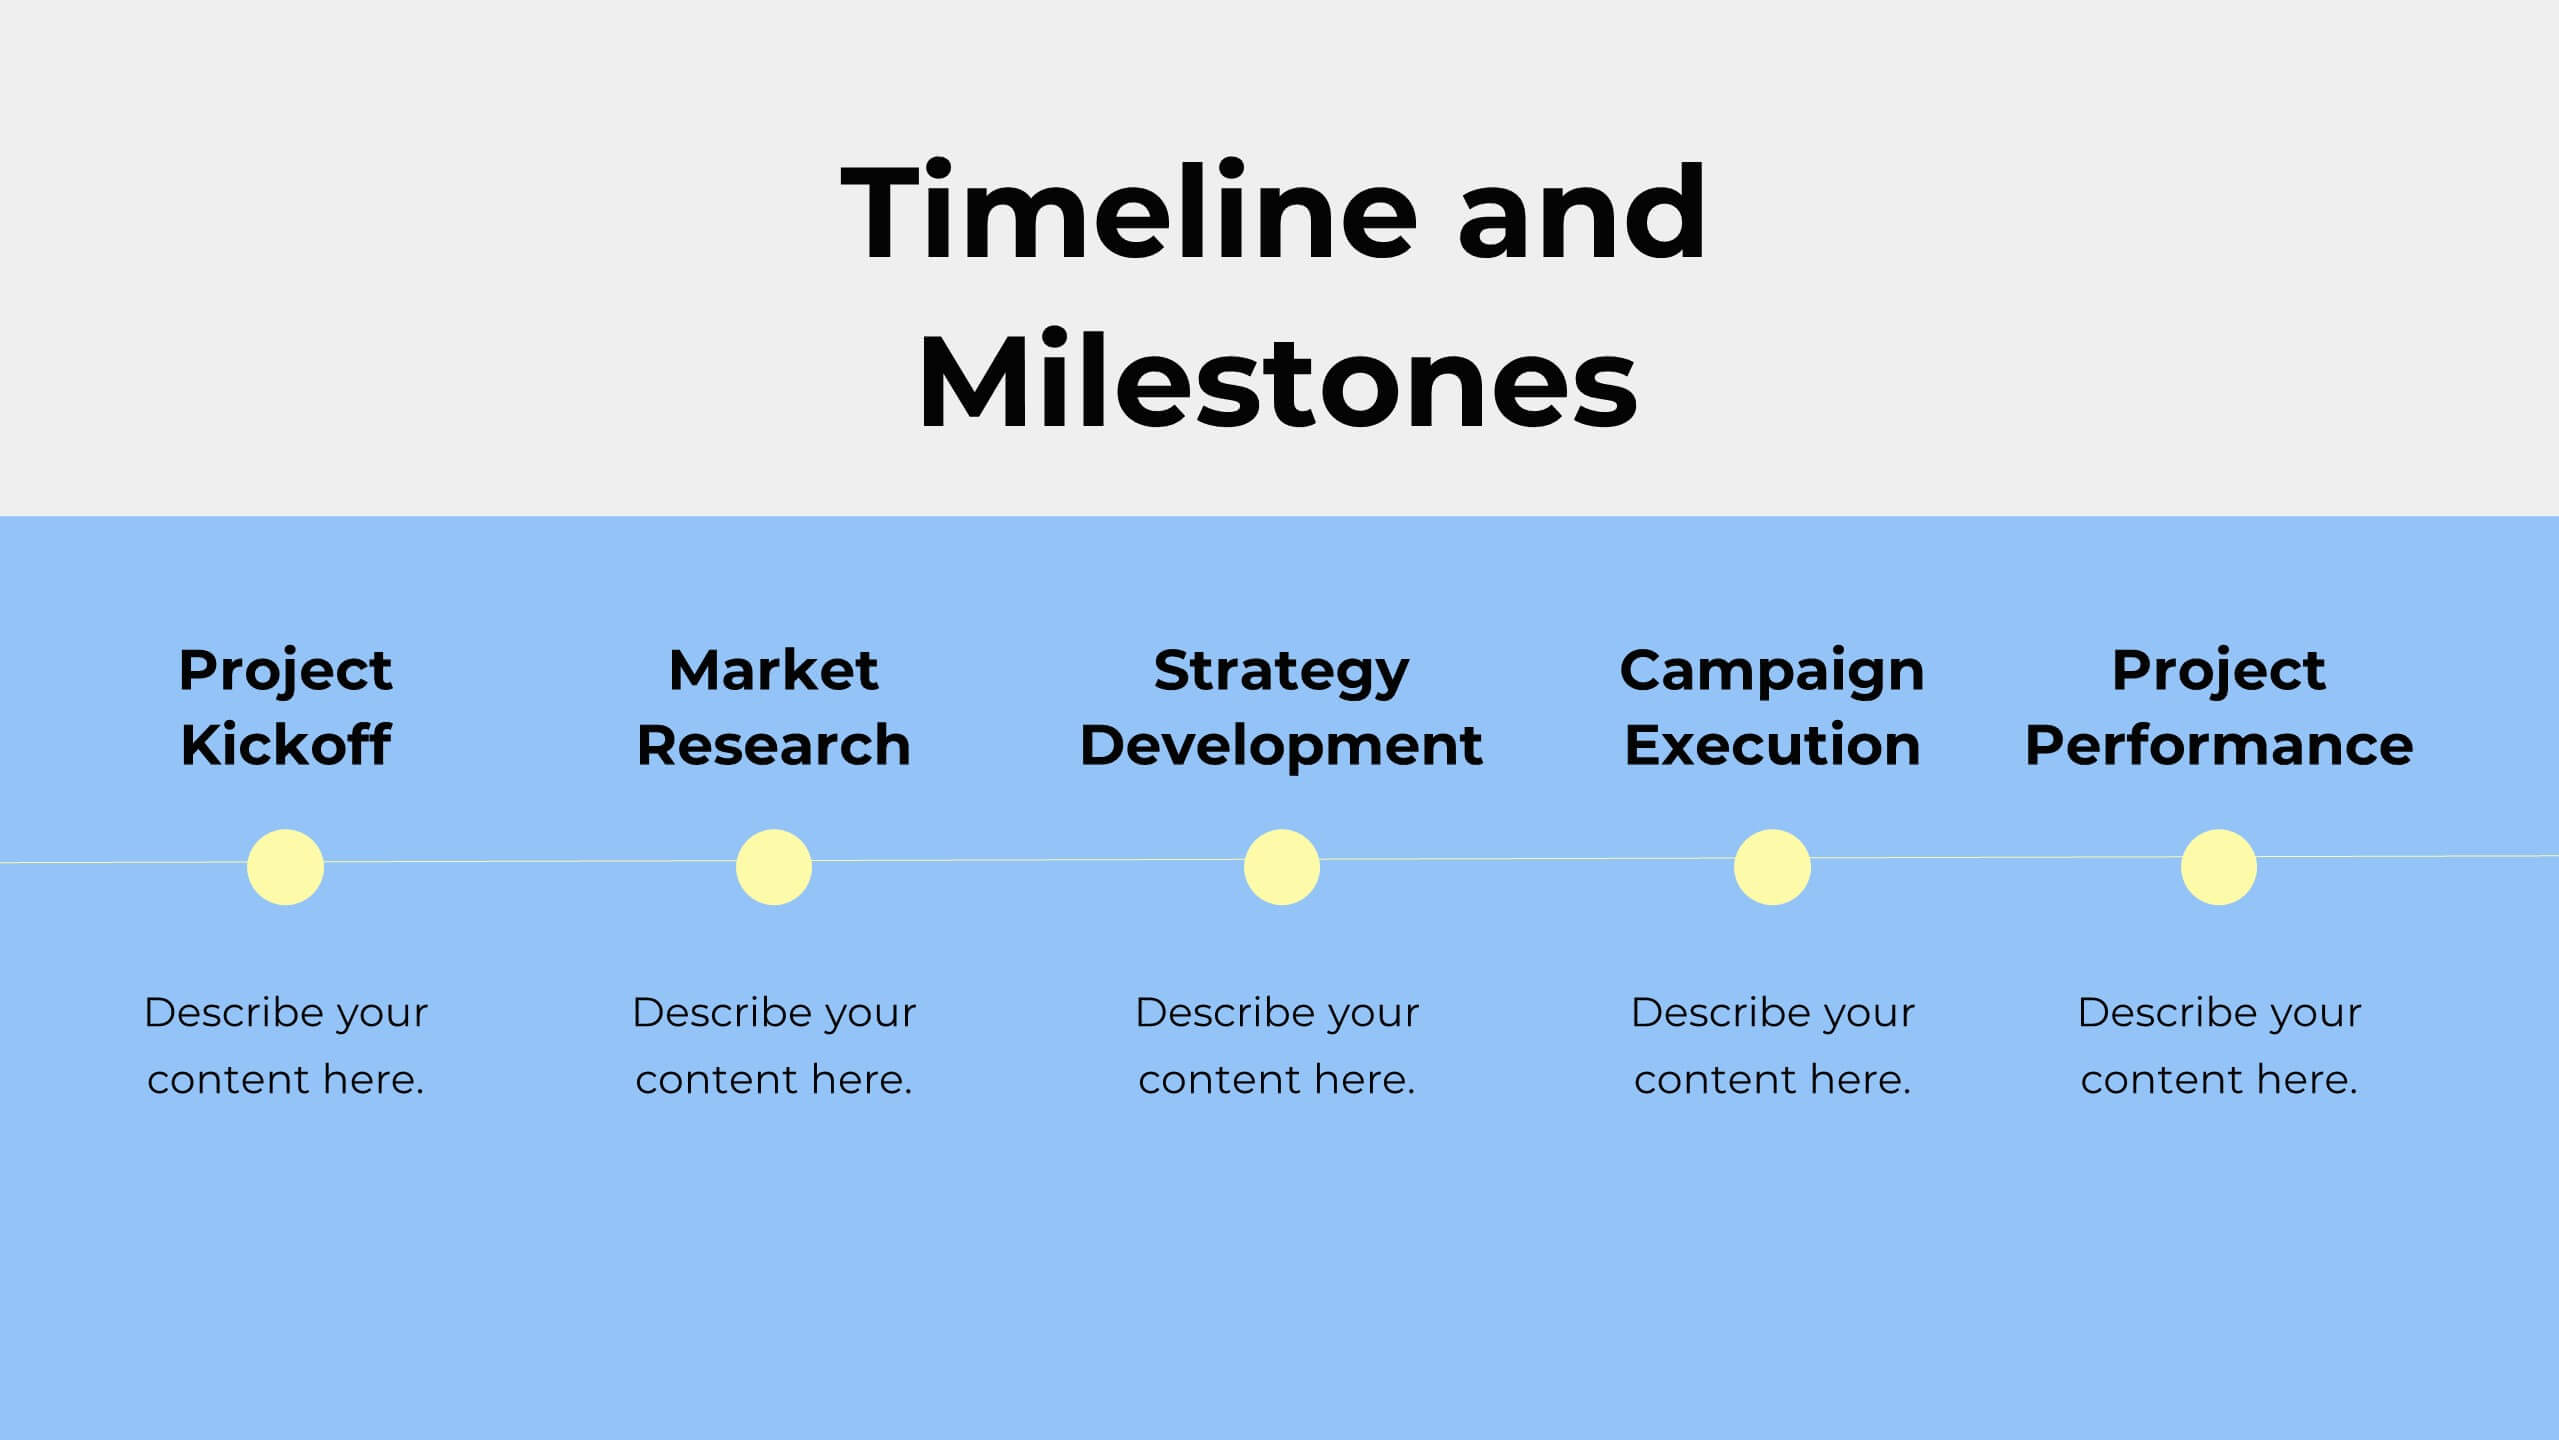
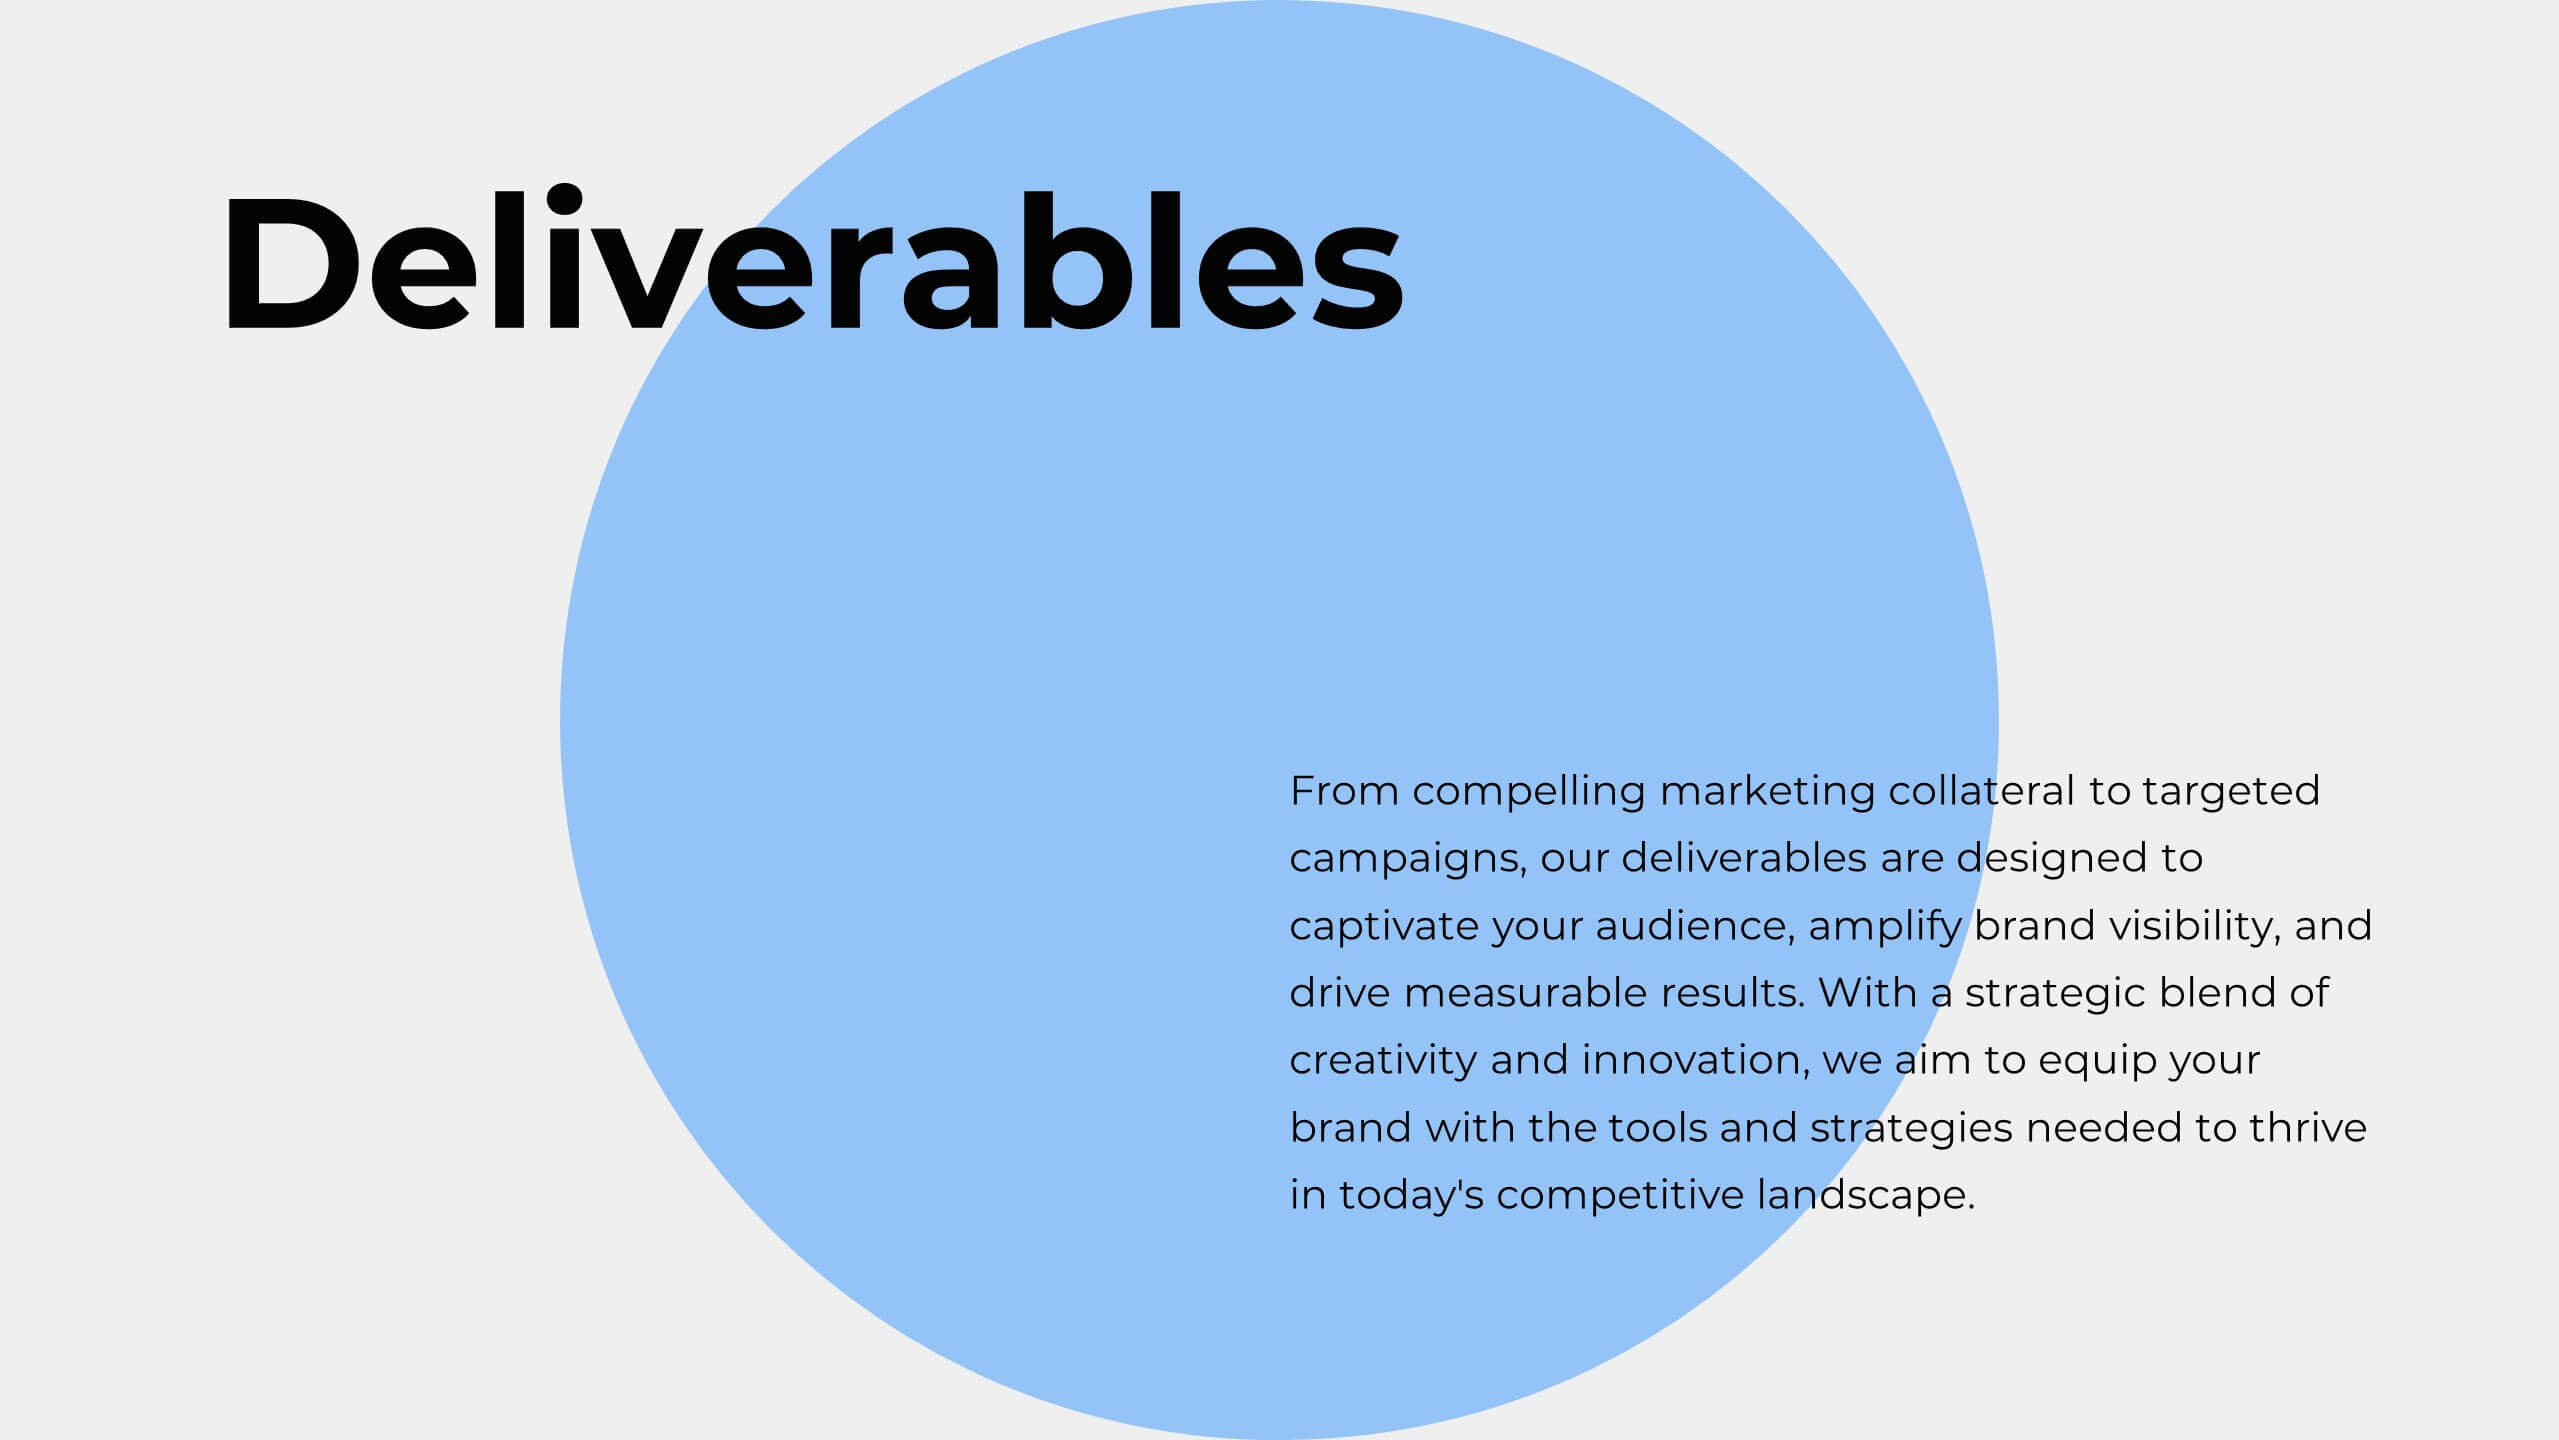
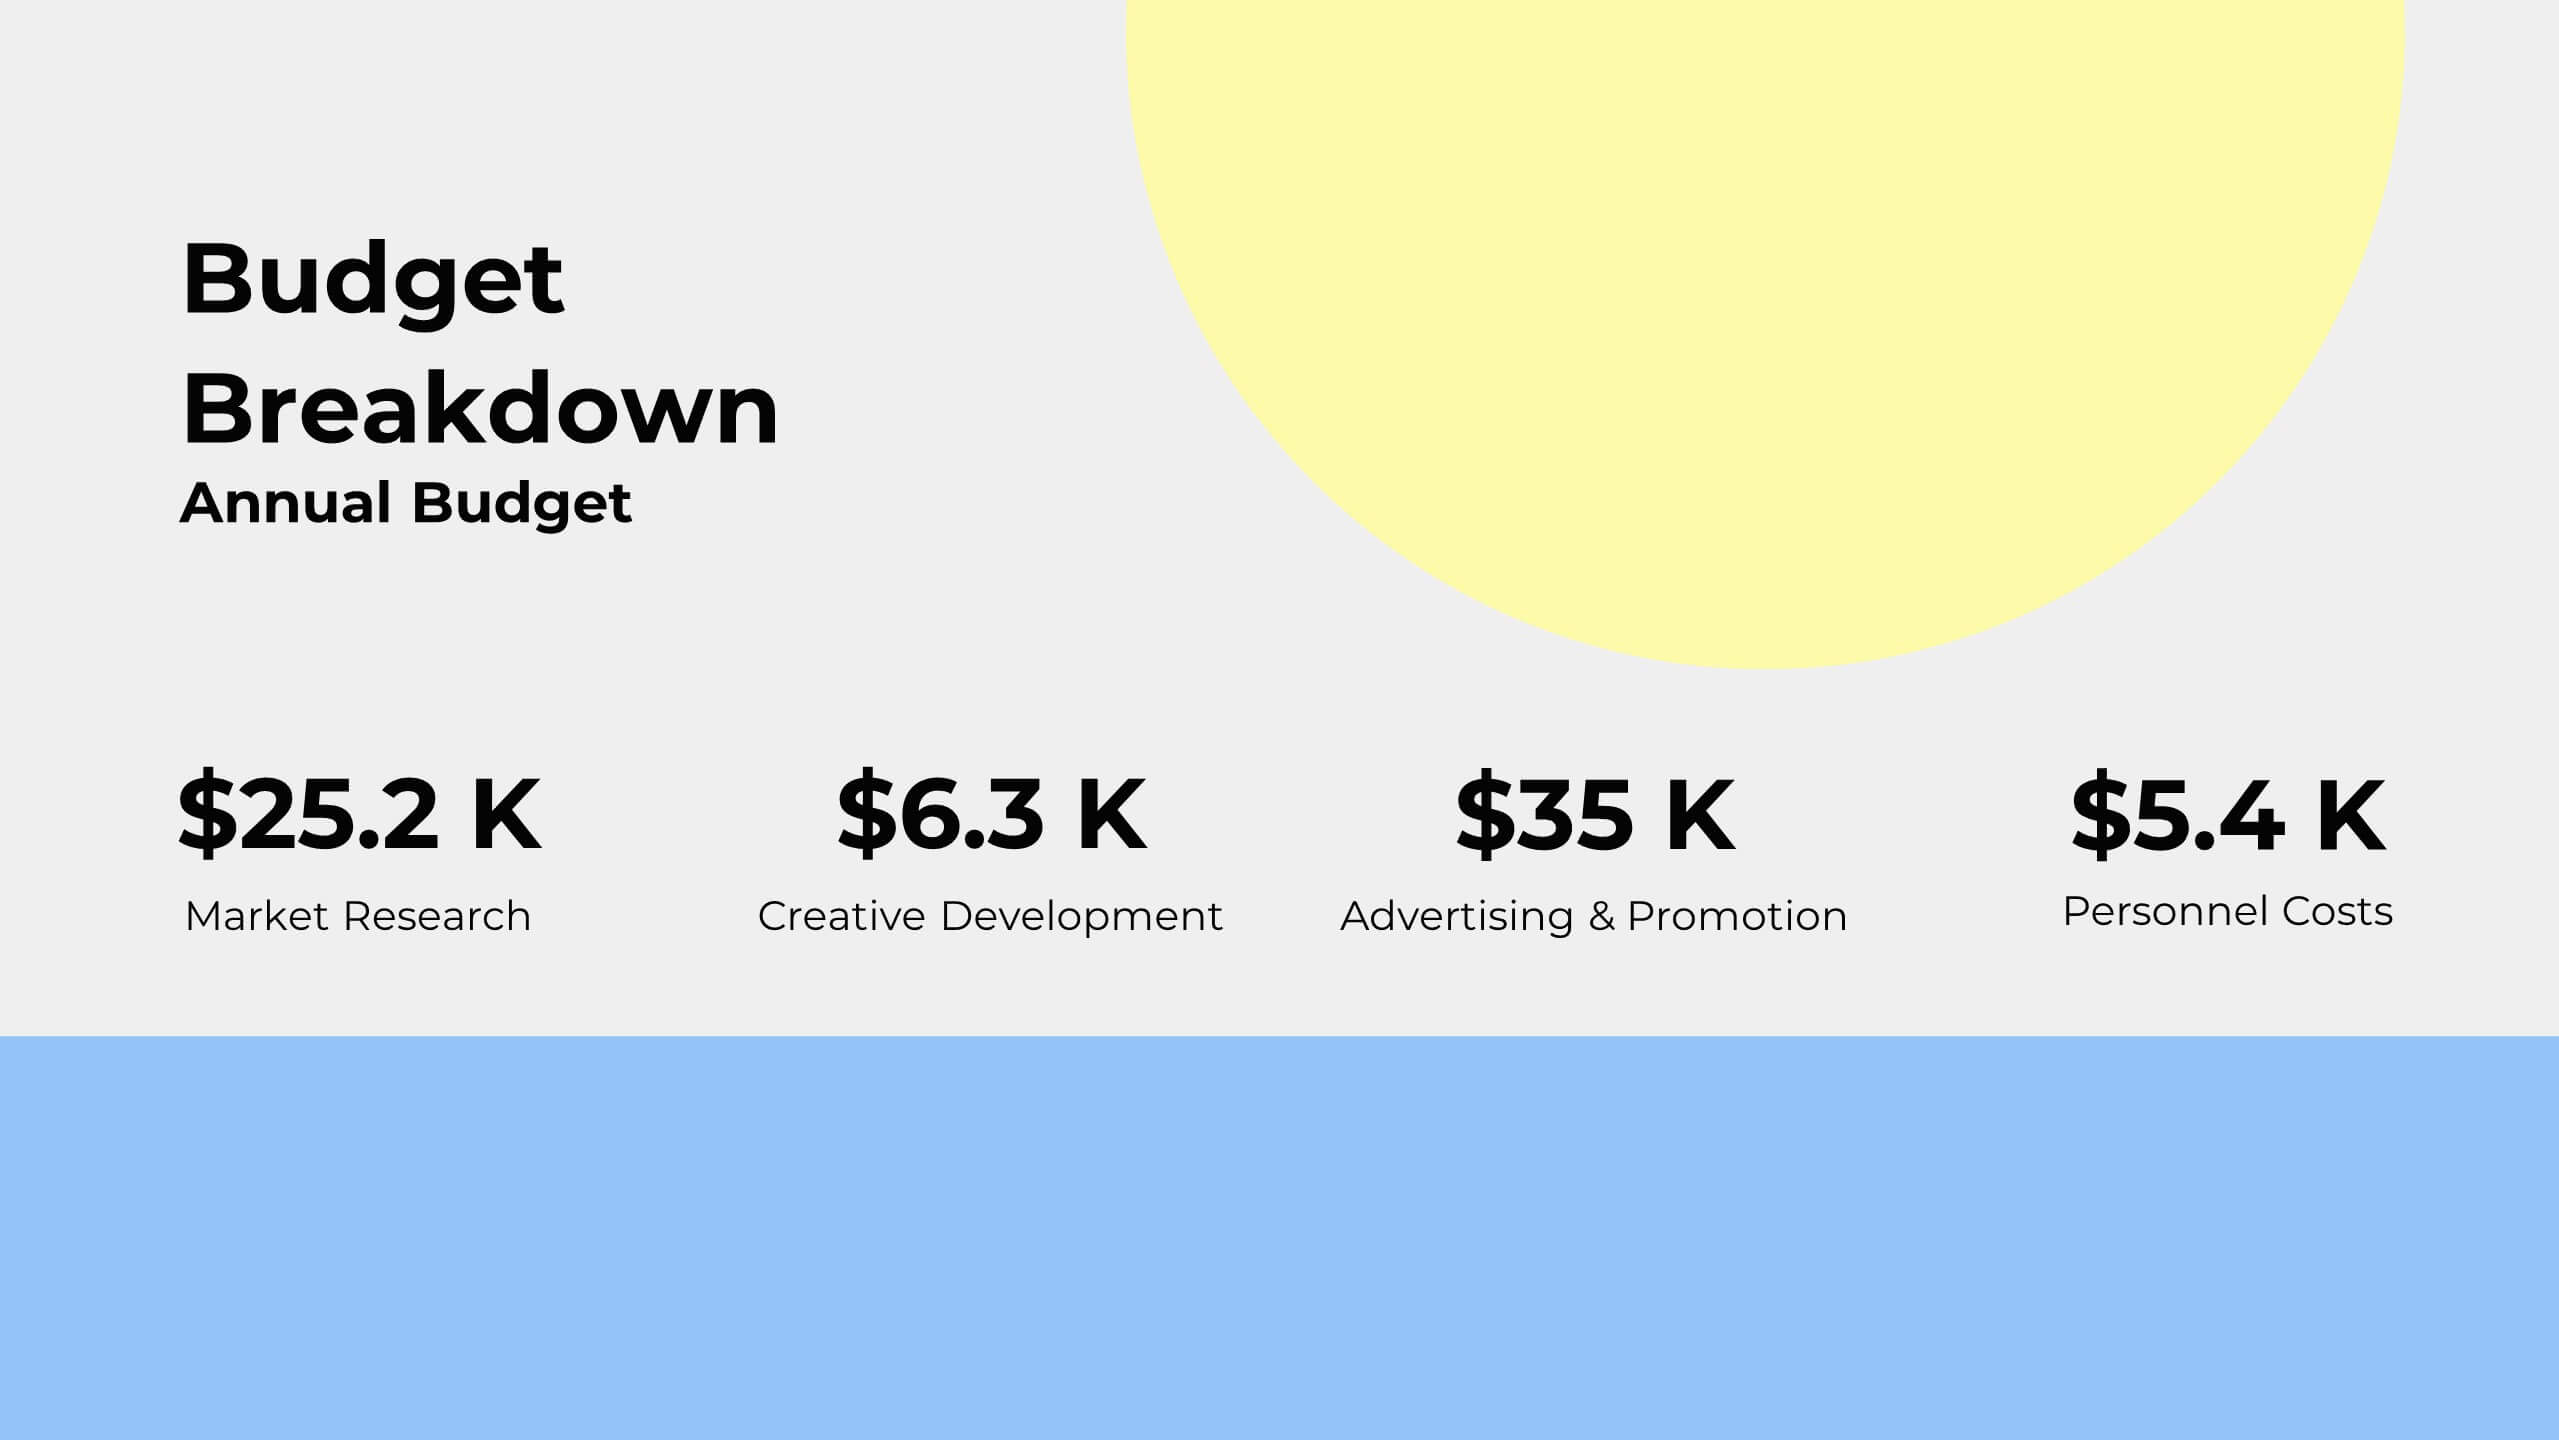
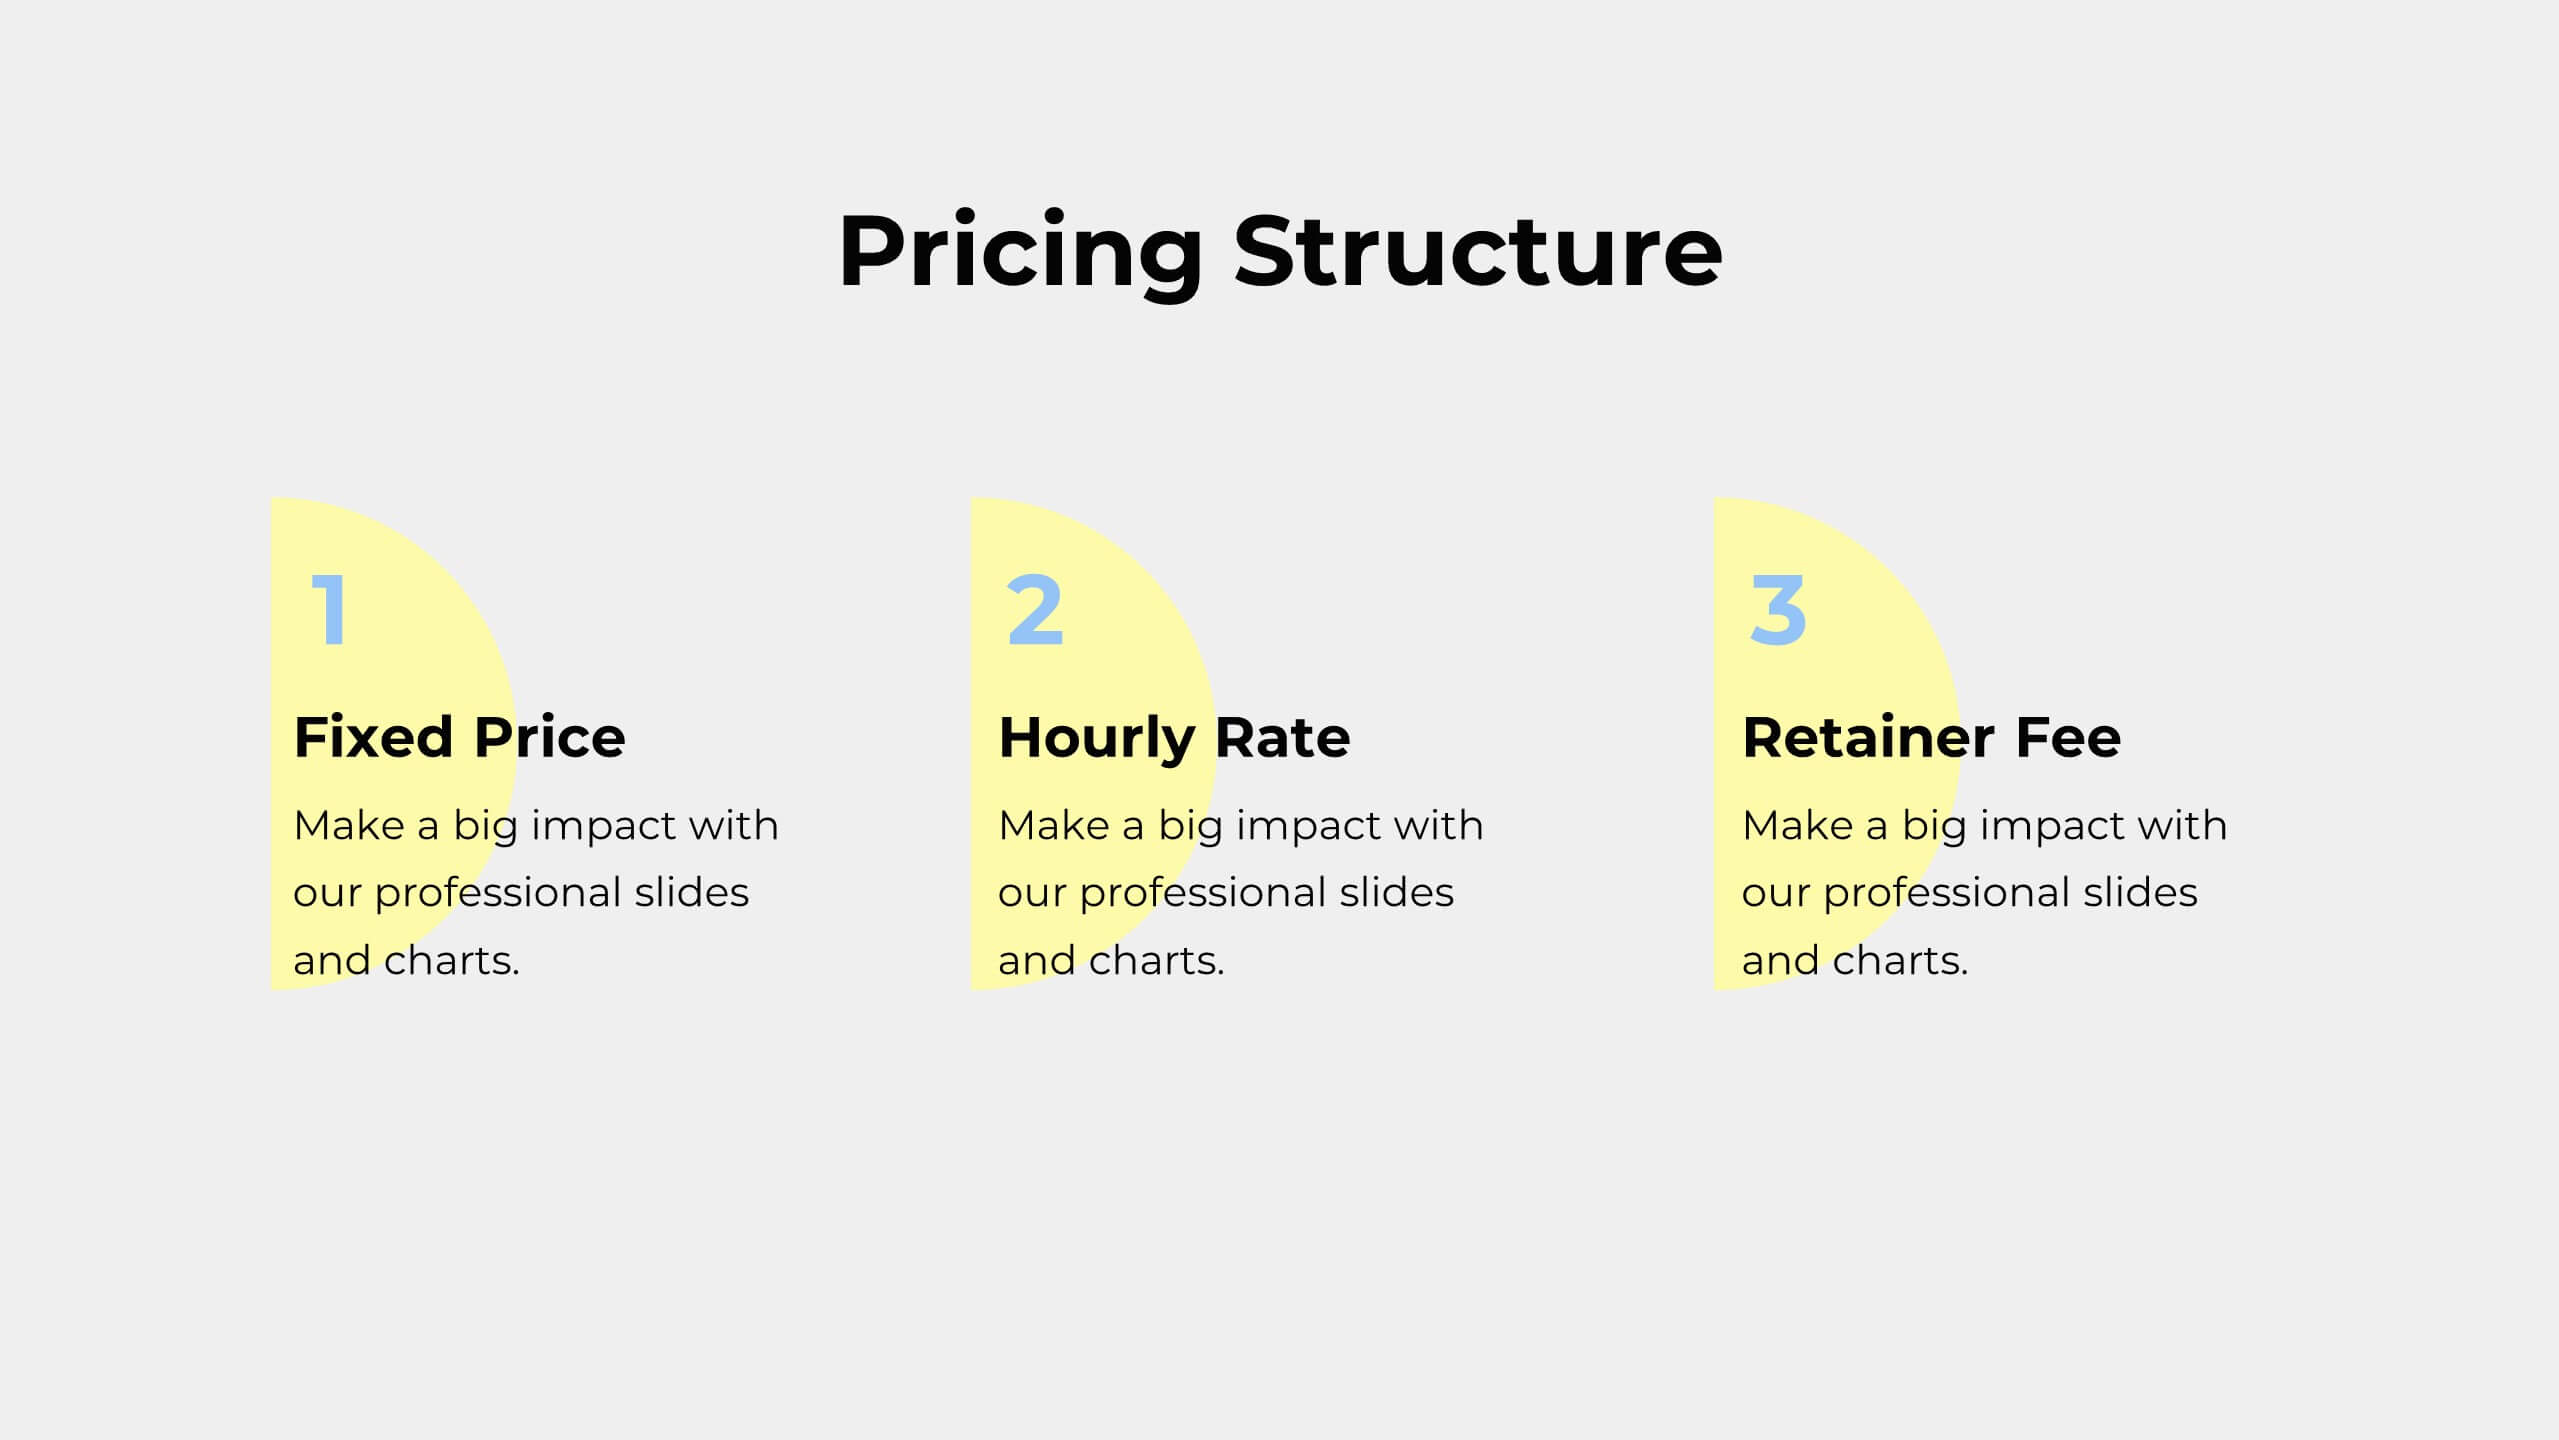
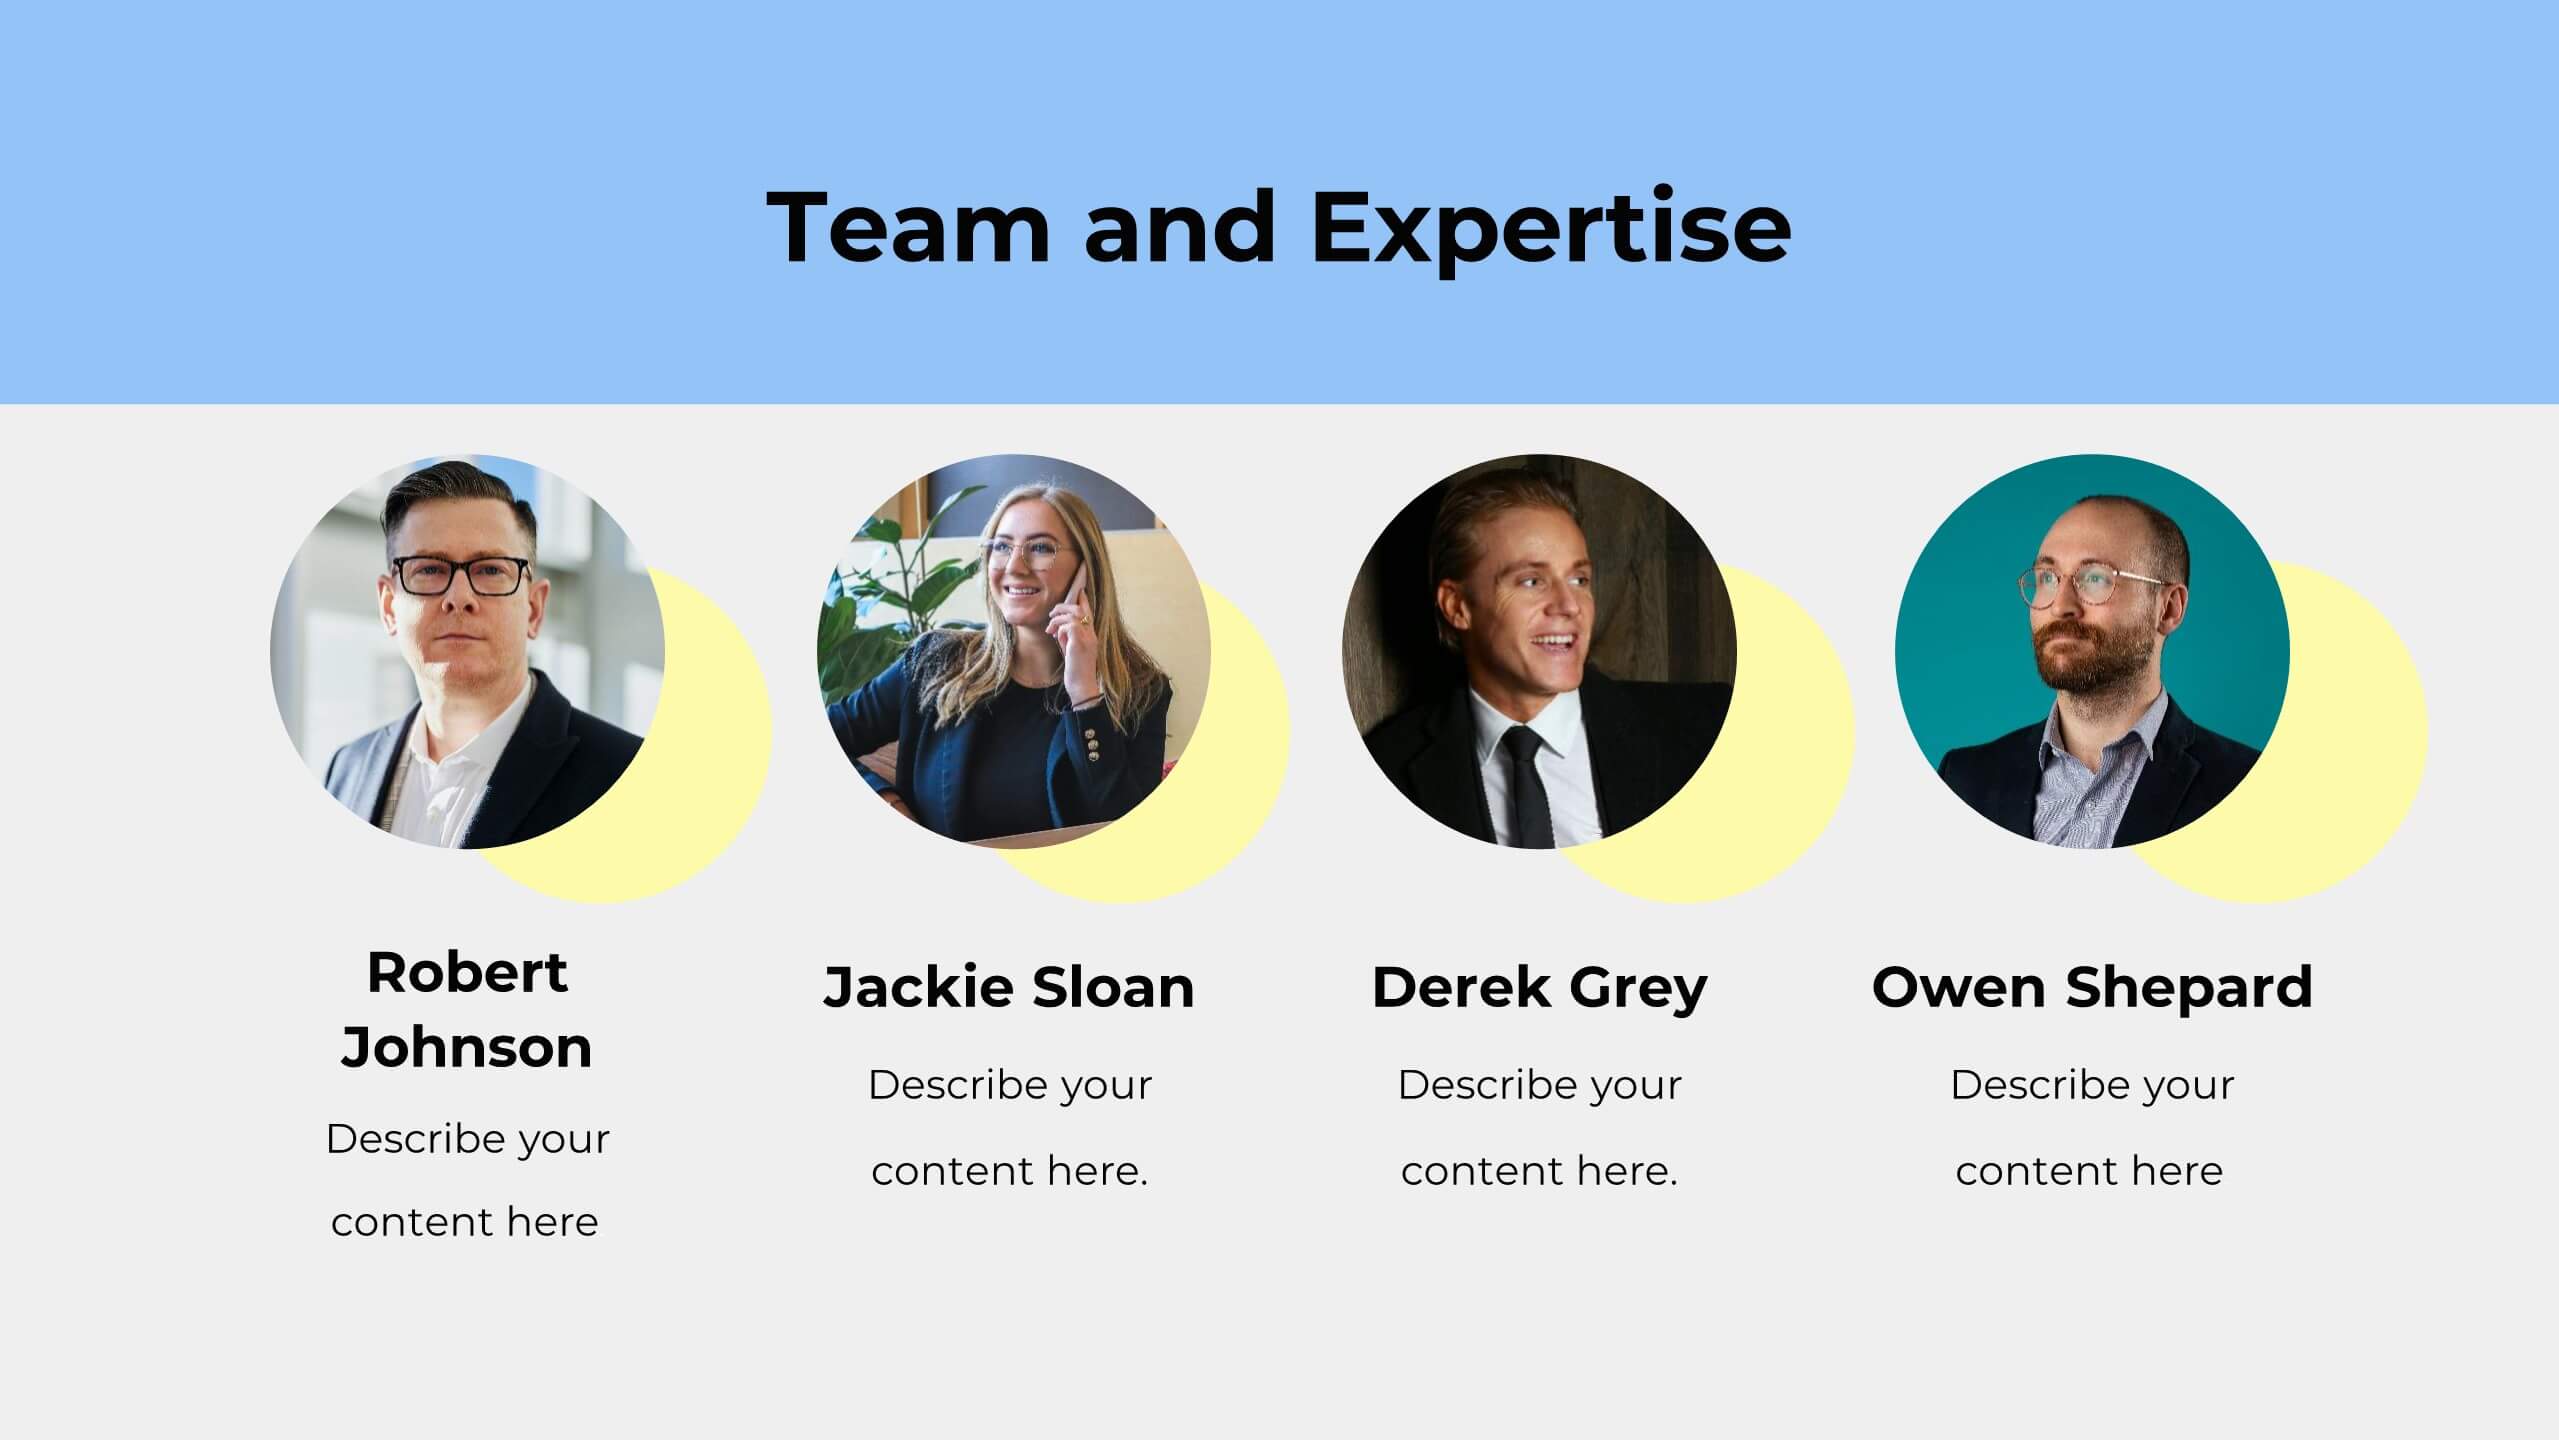
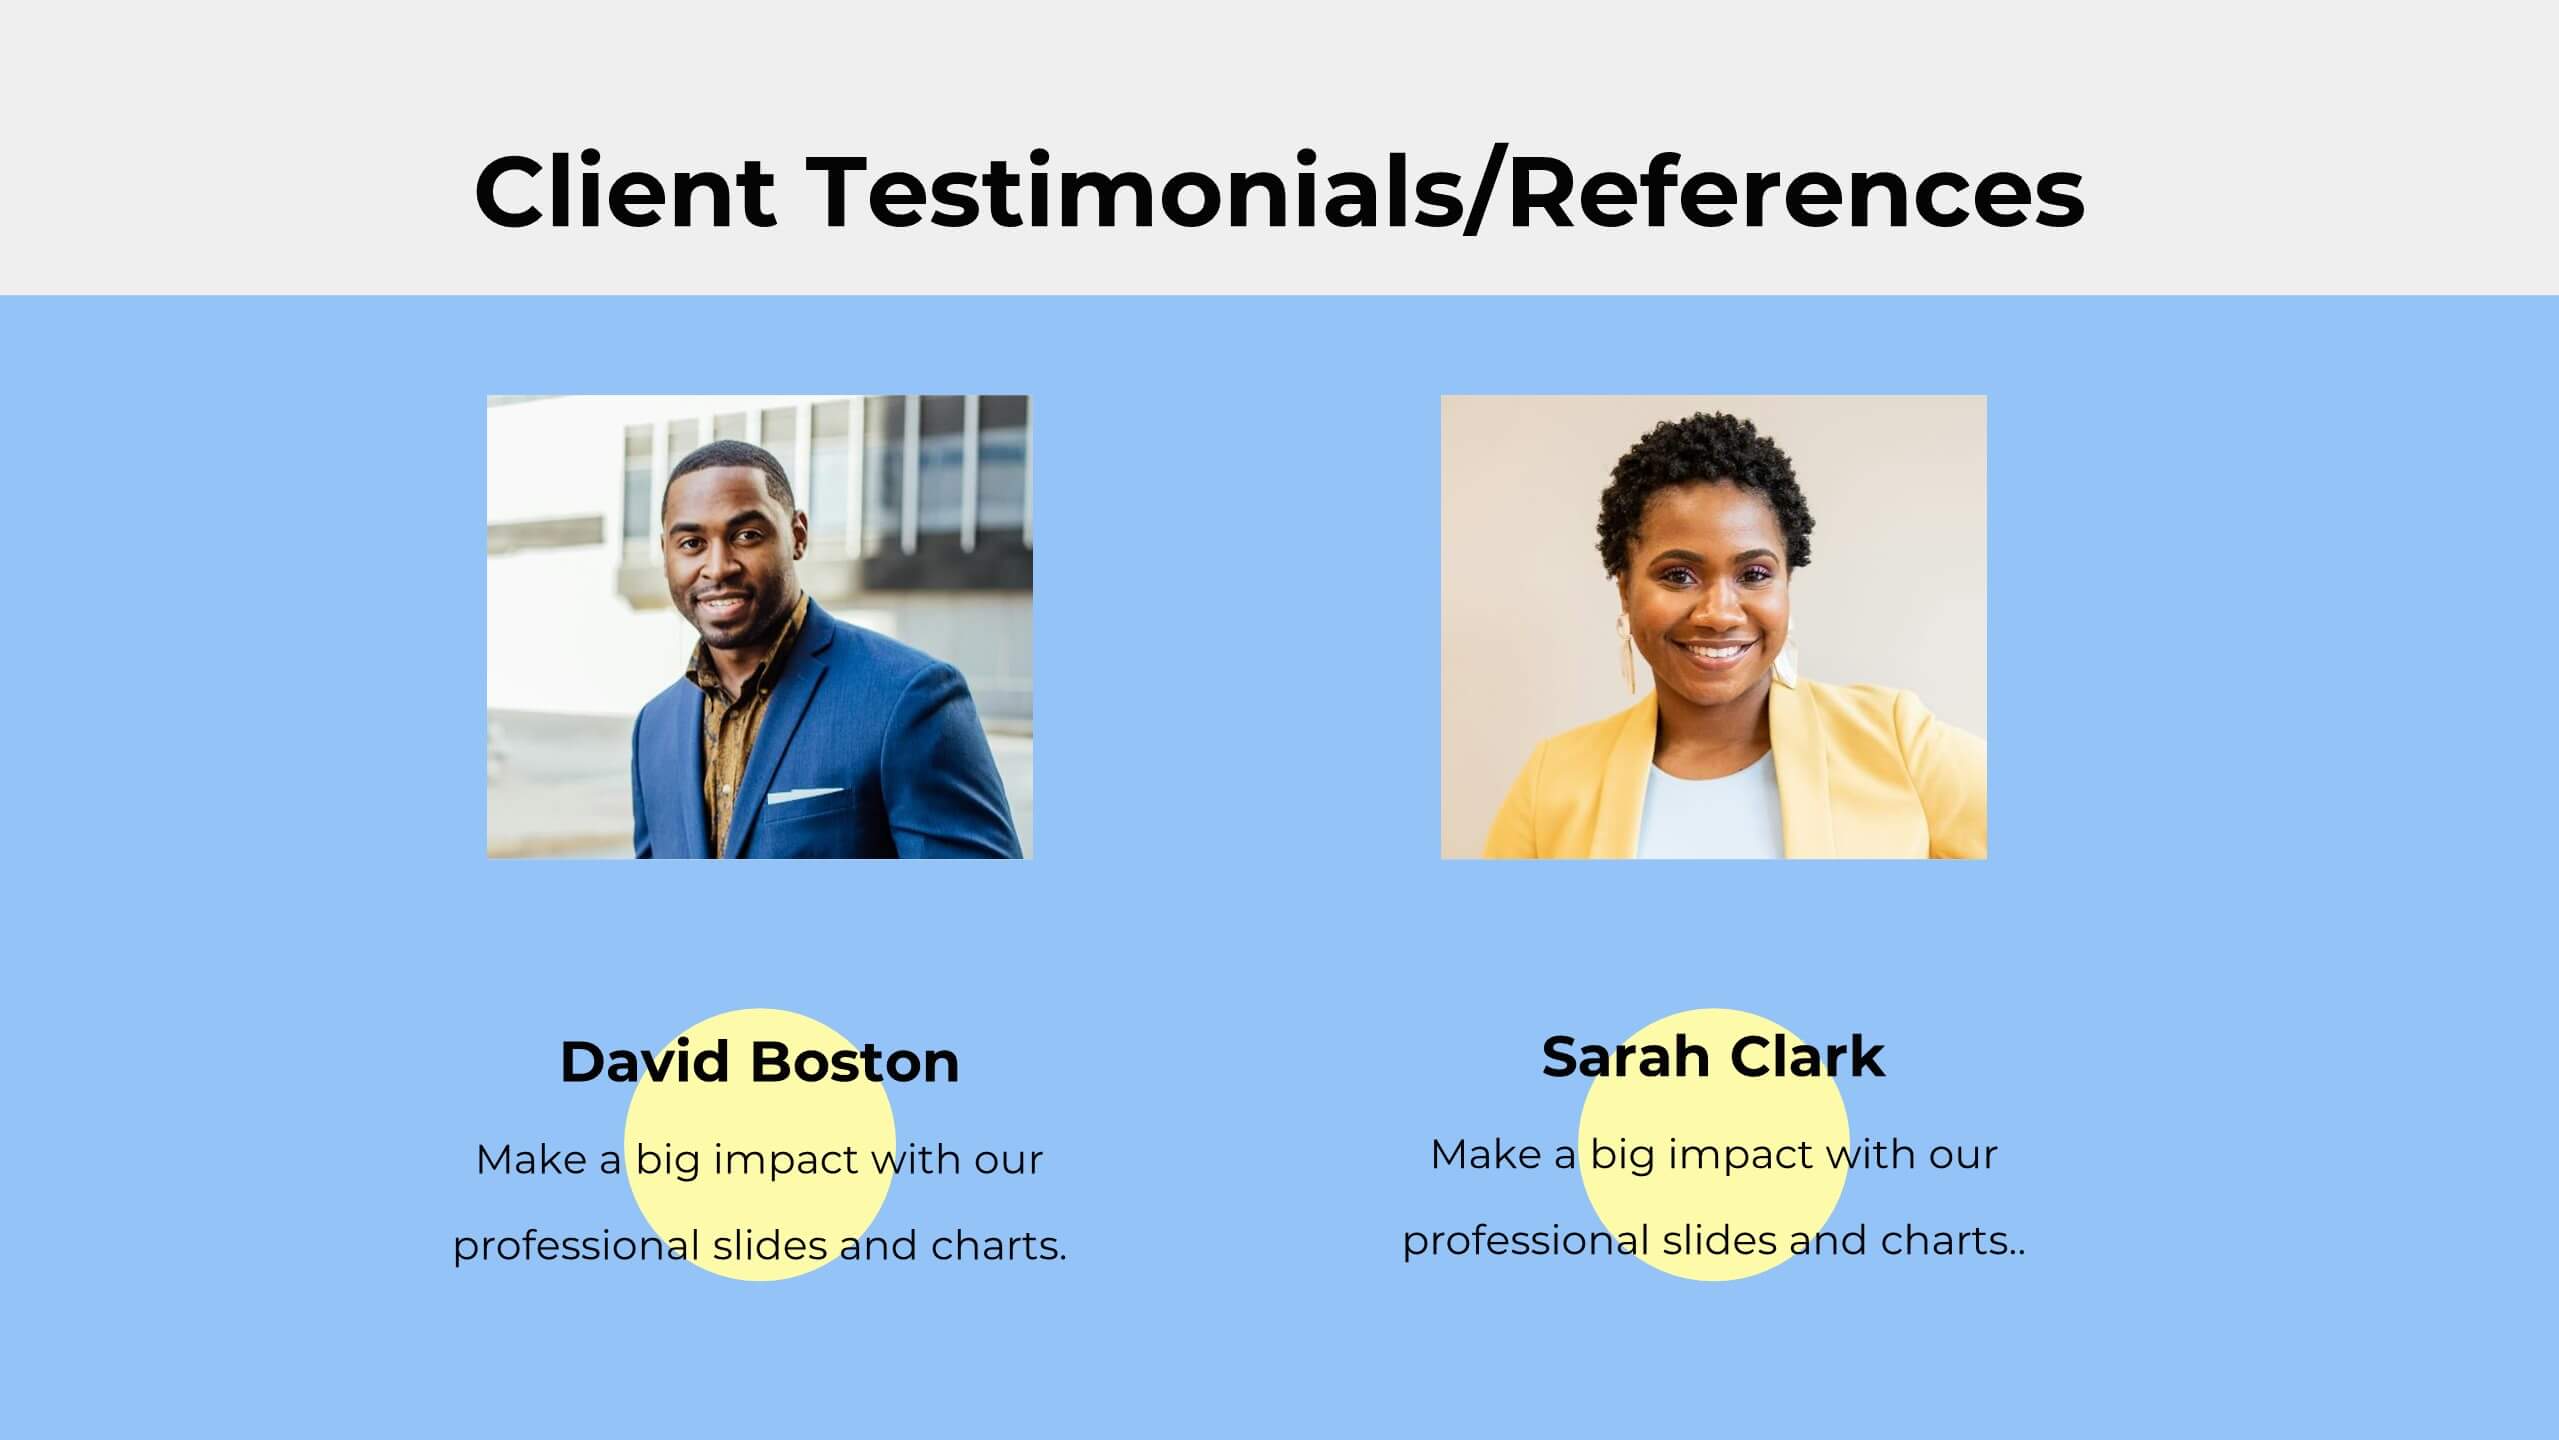
Inspire Business Proposal Presentation
Excite your audience with a compelling business proposal! This template includes sections for objectives, scope of work, timeline, budget, and more. Present your business plan clearly and effectively. Compatible with PowerPoint, Keynote, and Google Slides, it’s designed to impress stakeholders and secure approval for your project. Transform ideas into reality today!