


Características


¿Tienes alguna pregunta?
Recomendar


7 diapositivas
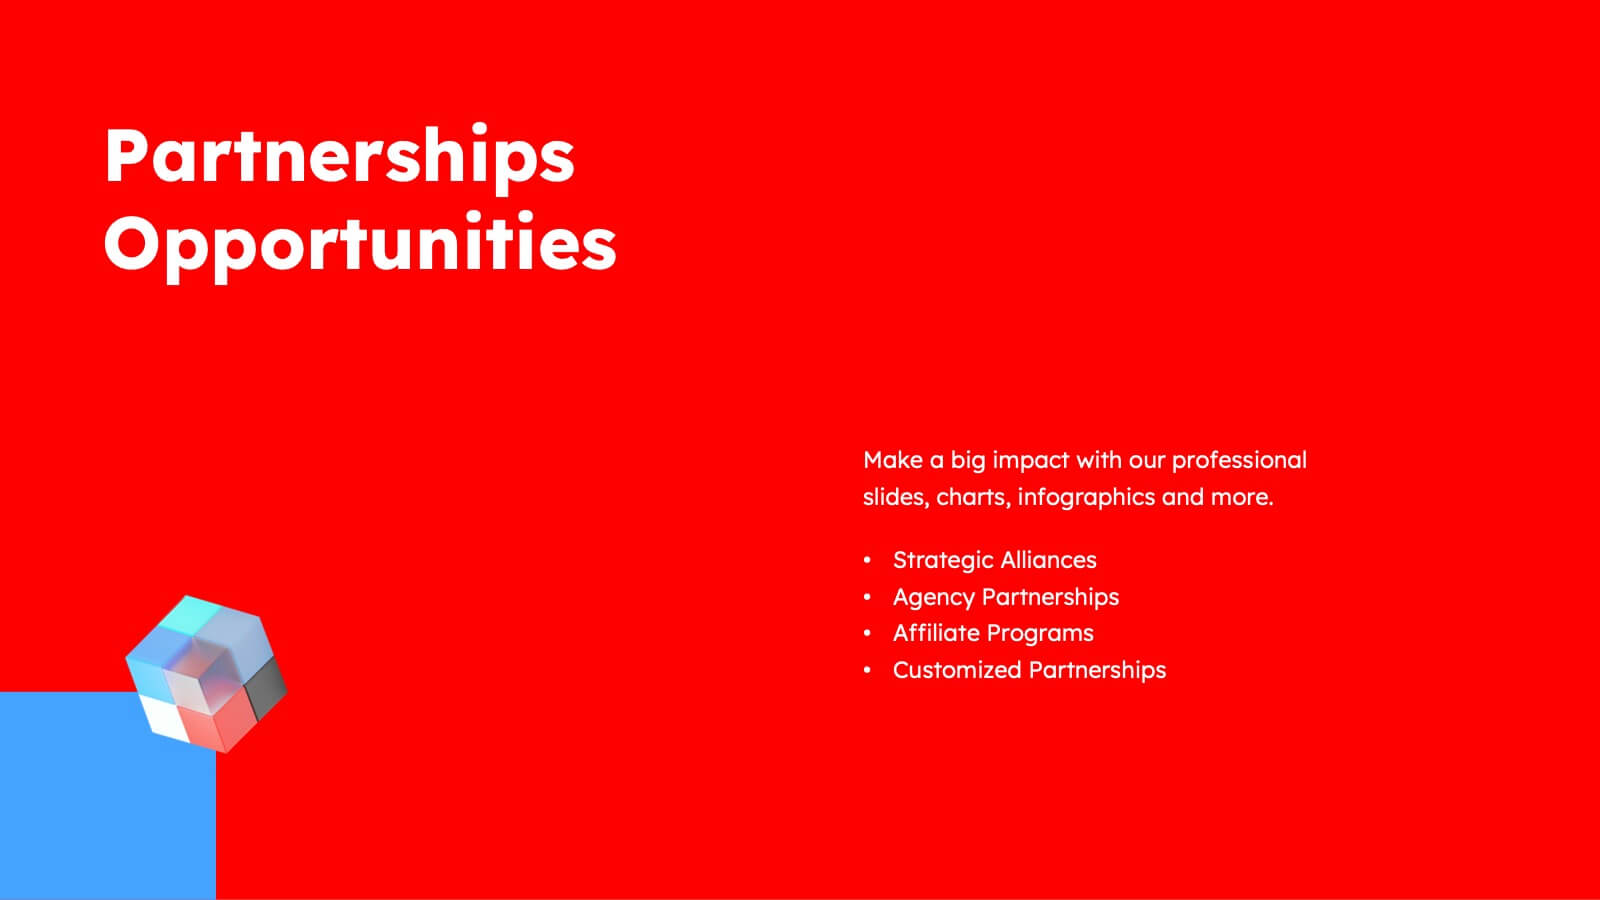
Agile Responsibility Assignment Infographic
Navigate the complexities of project responsibilities with the agile responsibility assignment infographic. Articulately designed using a palette of blue, yellow, brown, and white, this template brings clarity to task assignments in an agile environment. Ideal for project managers, scrum masters, or agile coaches, it provides a comprehensive view of roles and responsibilities. The matrix style not only adds visual appeal but also makes information absorption effortless. This infographic is an essential tool for ensuring team alignment and is seamlessly compatible with PowerPoint, Keynote, and Google Slides.
4 diapositivas
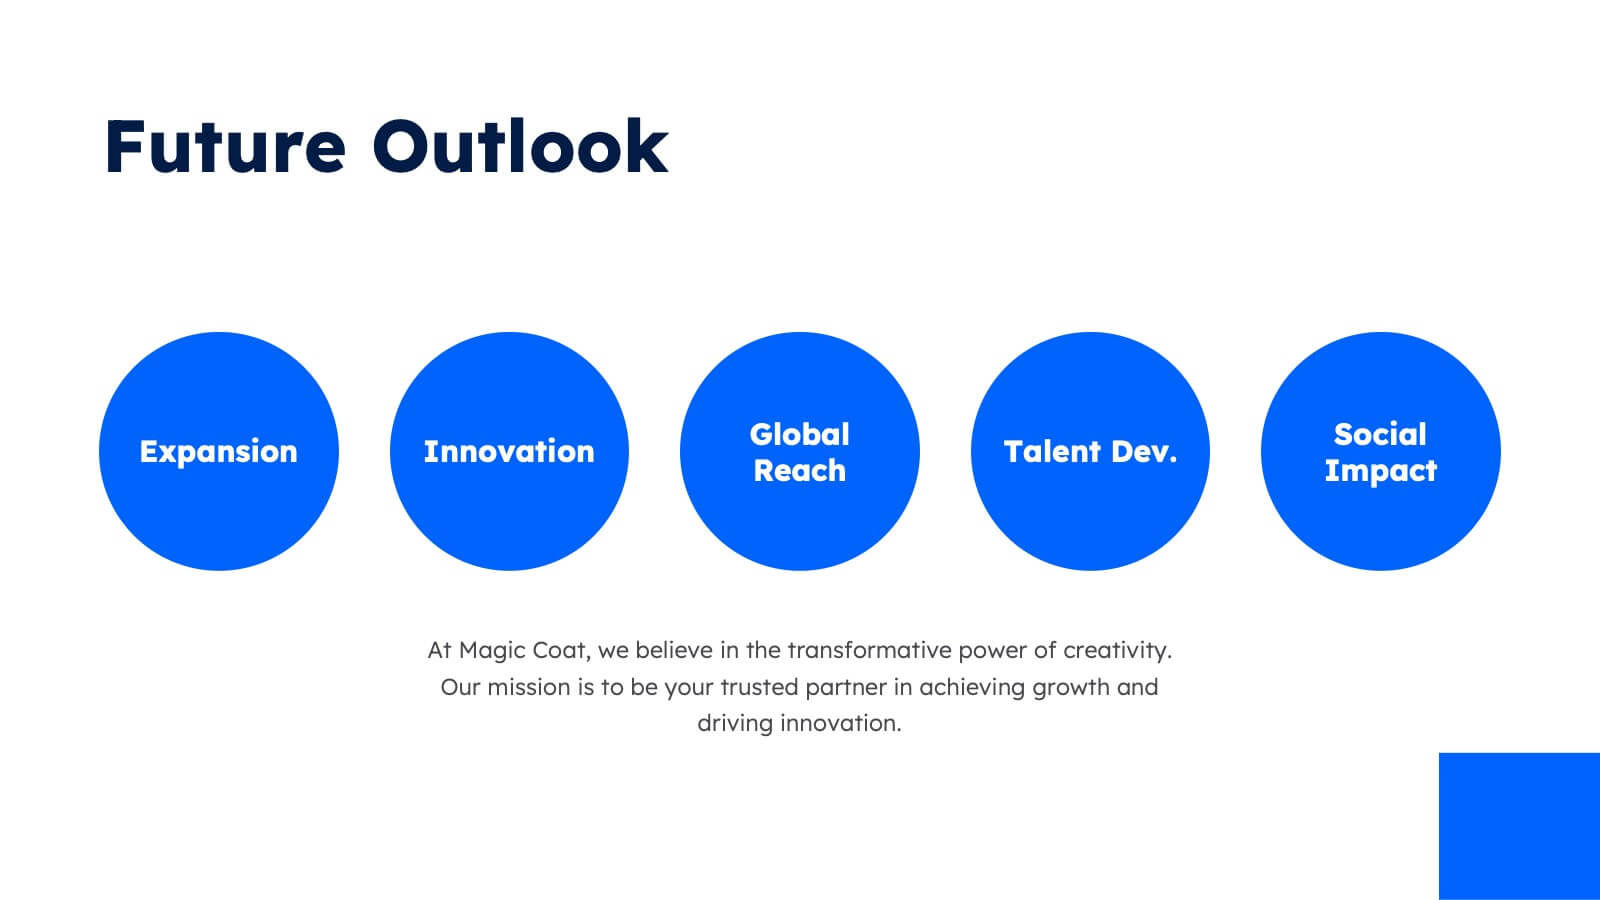
Growth Path Arrow Design Presentation
Rise with momentum as you visualize progress in a clean, modern layout built for showcasing goals, achievements, and forward movement. This presentation highlights each stage in a clear upward path, helping audiences follow your narrative with ease. Fully editable and compatible with PowerPoint, Keynote, and Google Slides.


4 diapositivas
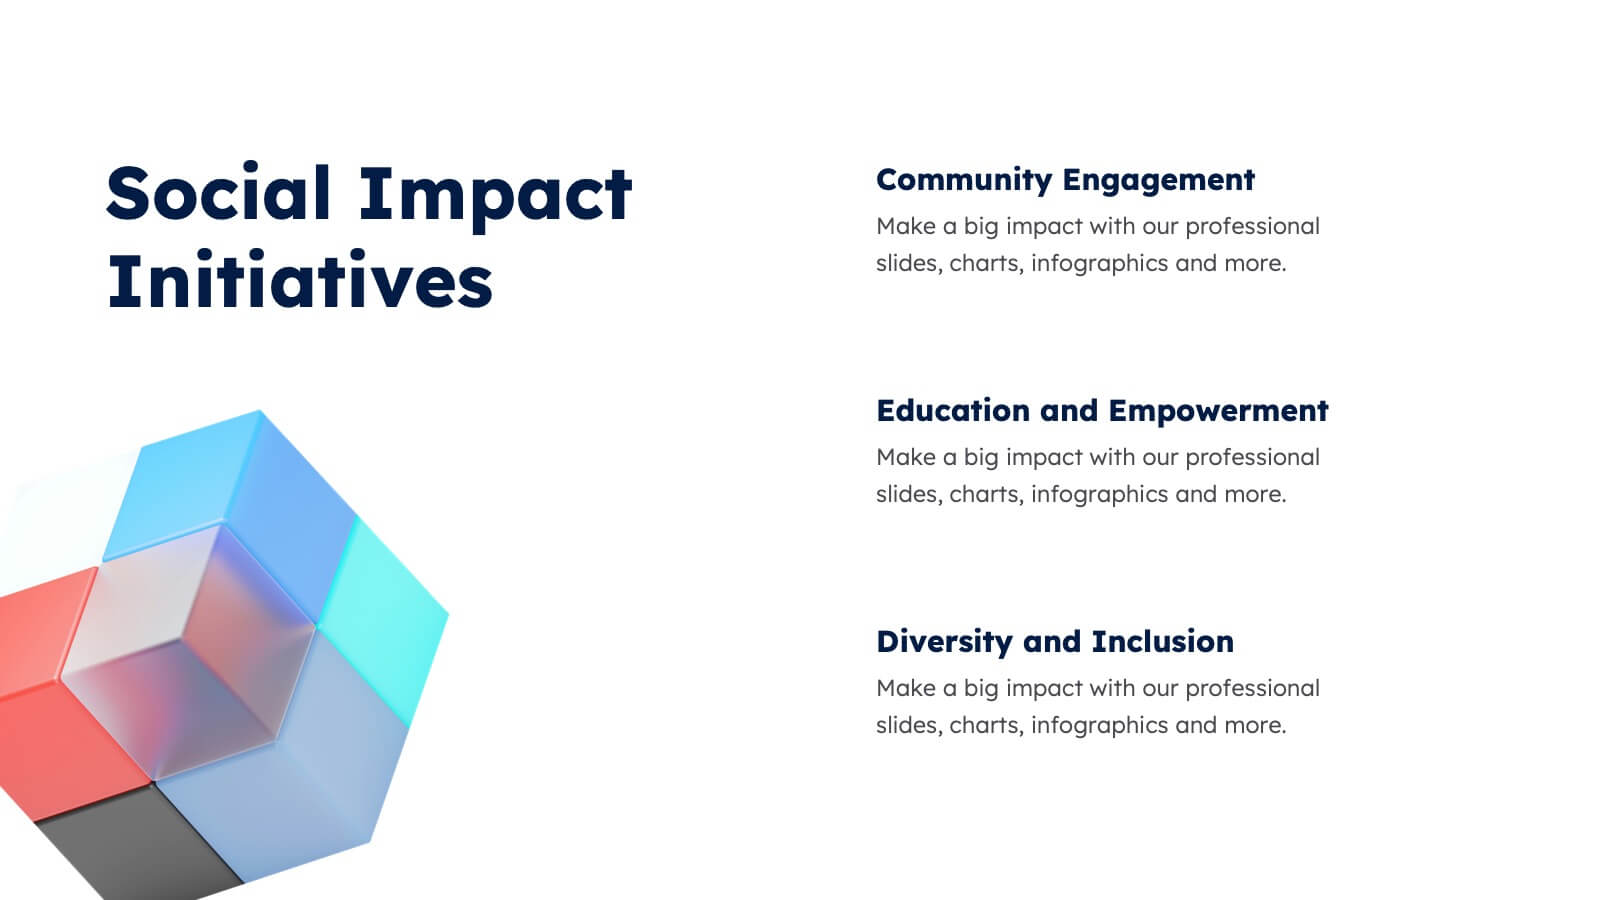
Sales Conversion with AIDA Stages Presentation
This modern presentation breaks down the AIDA model—Attention, Interest, Desire, and Action—using clean 3D cube visuals. Perfect for sales teams and marketers aiming to explain conversion funnels clearly. Fully customizable in Canva, making it easy to adapt to any brand or campaign strategy. Ideal for pitch decks and workshops.

22 diapositivas
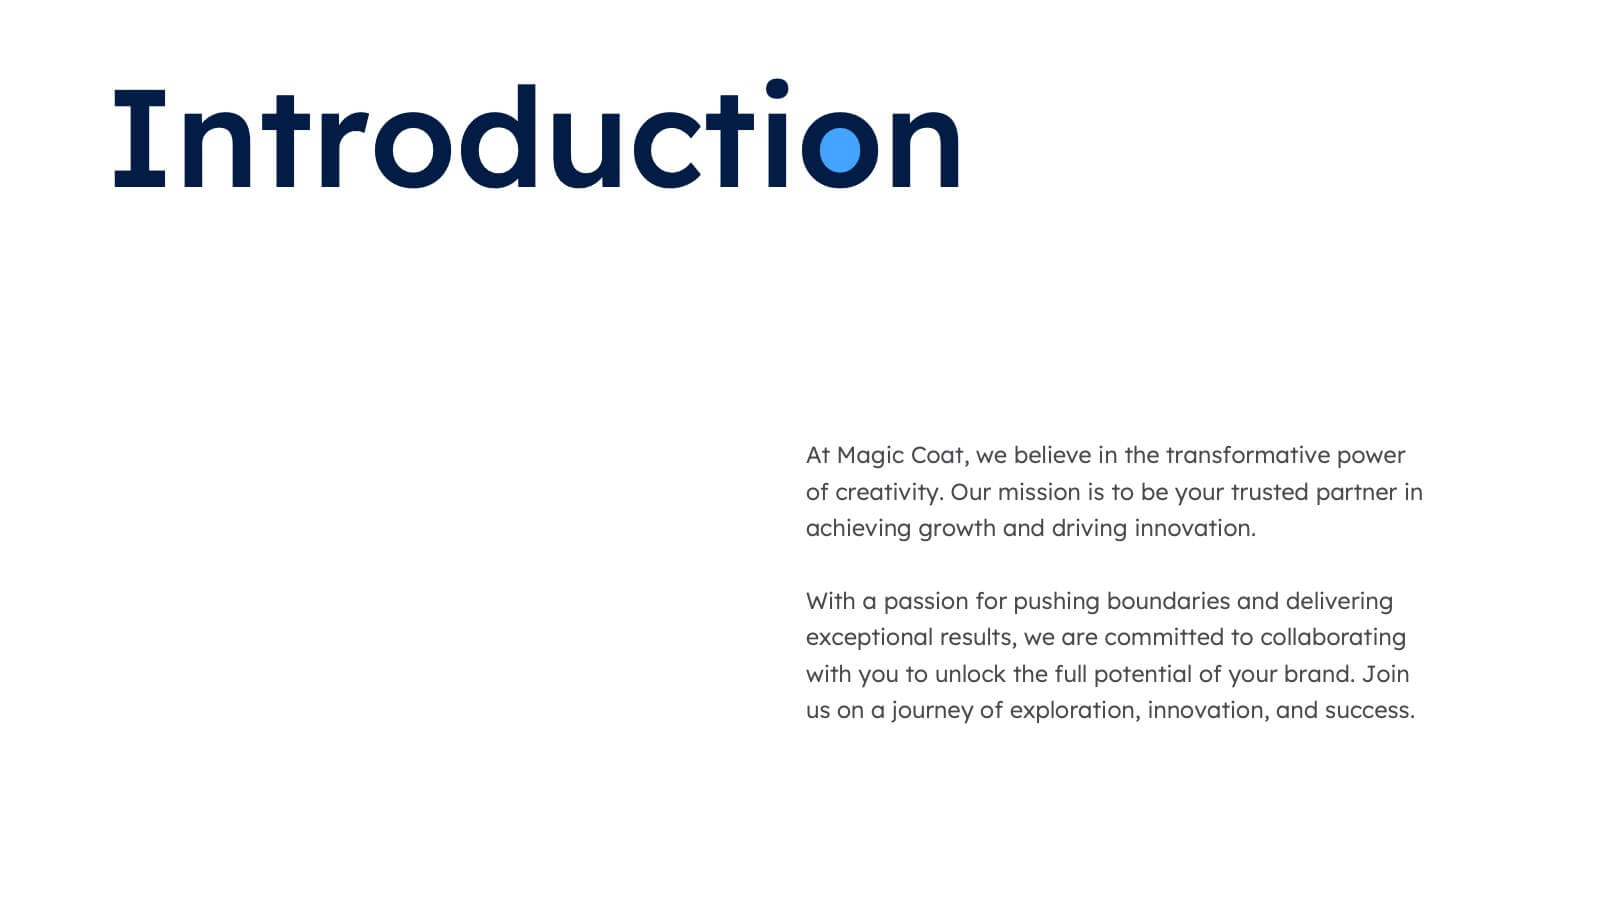
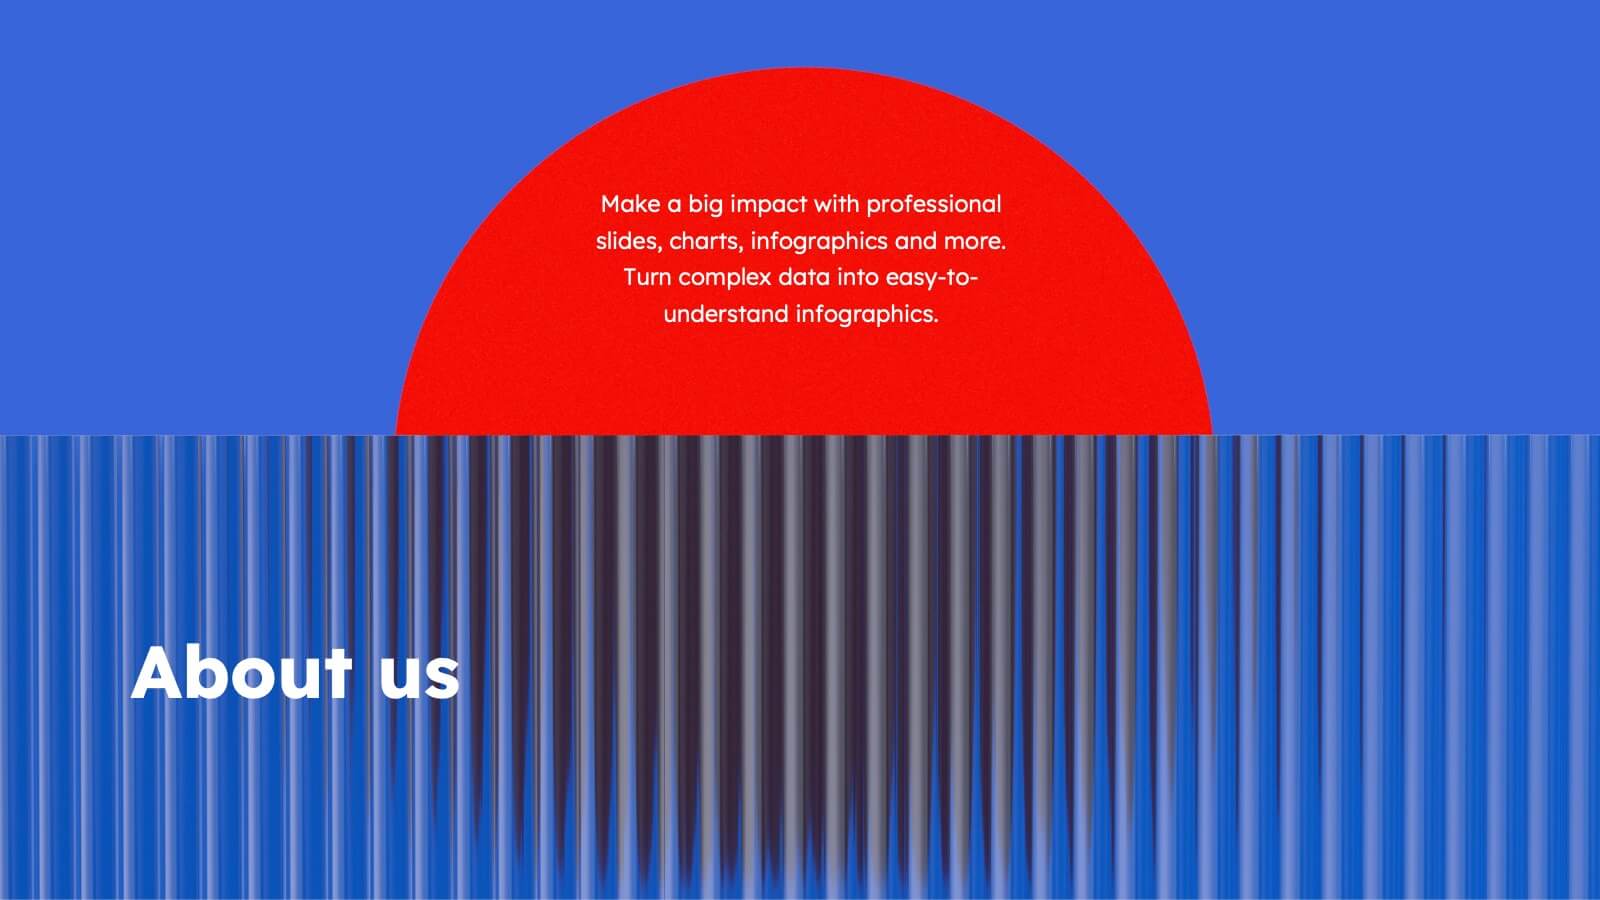
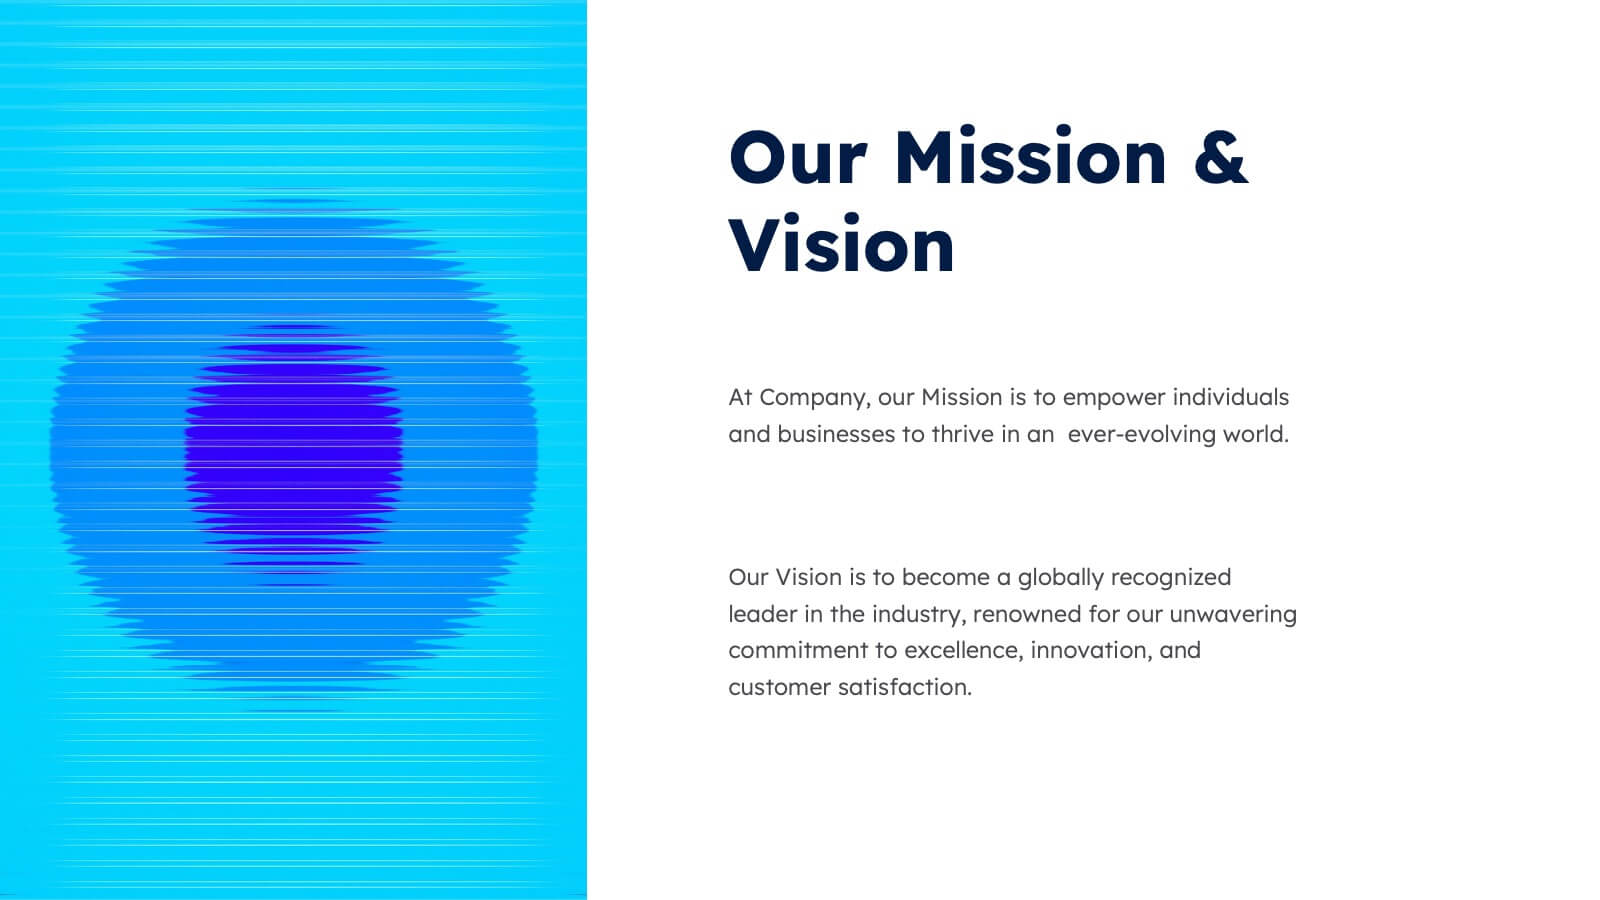
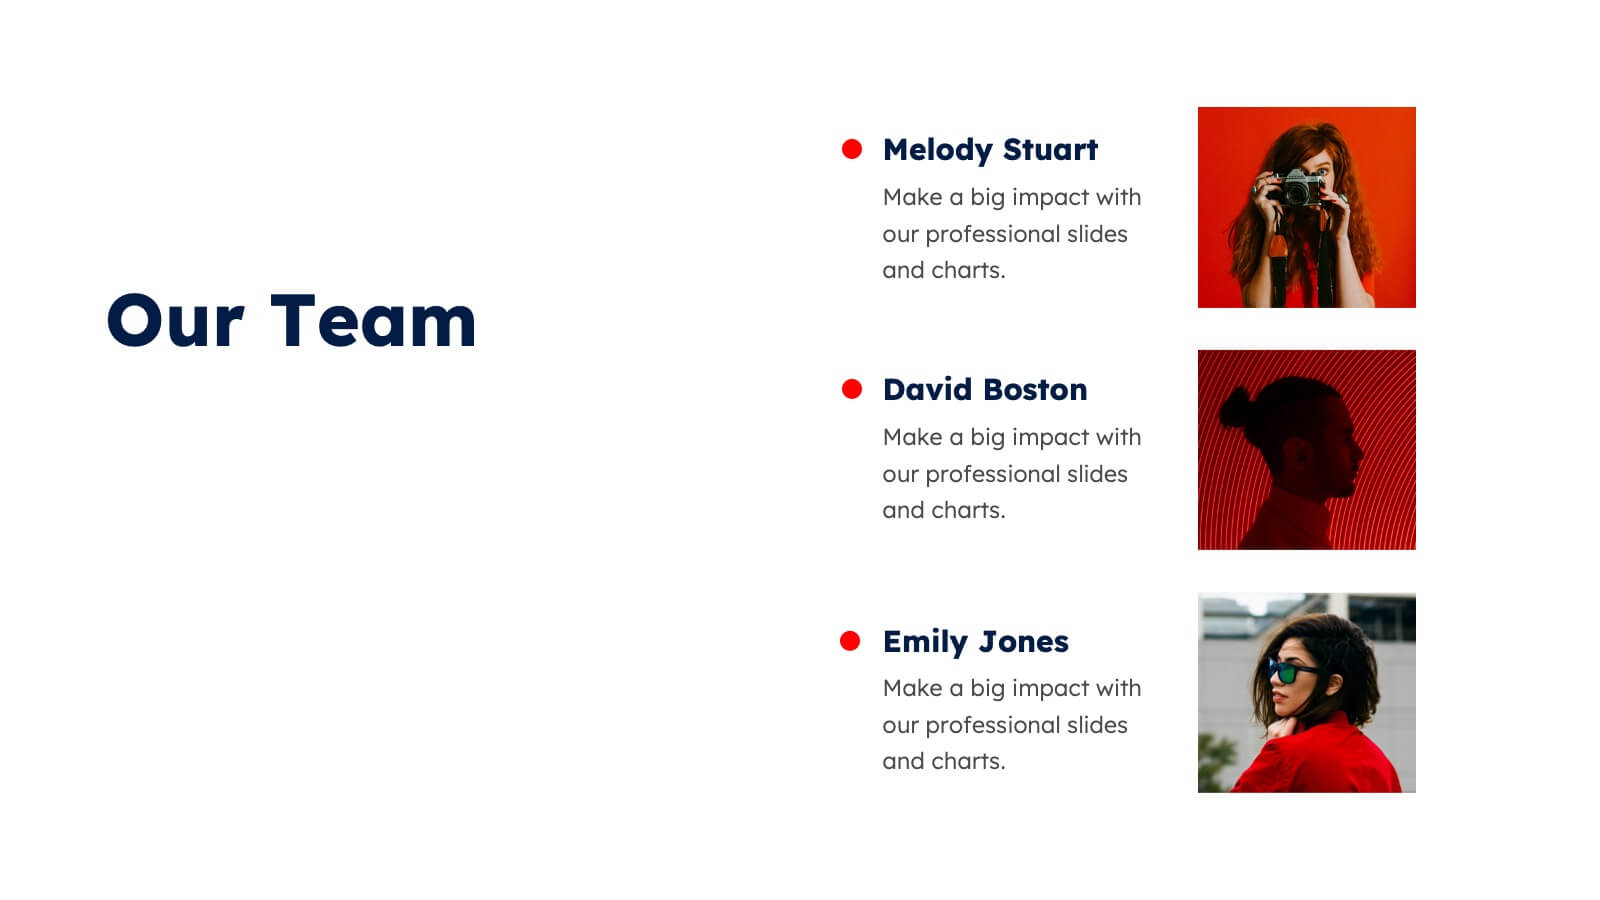
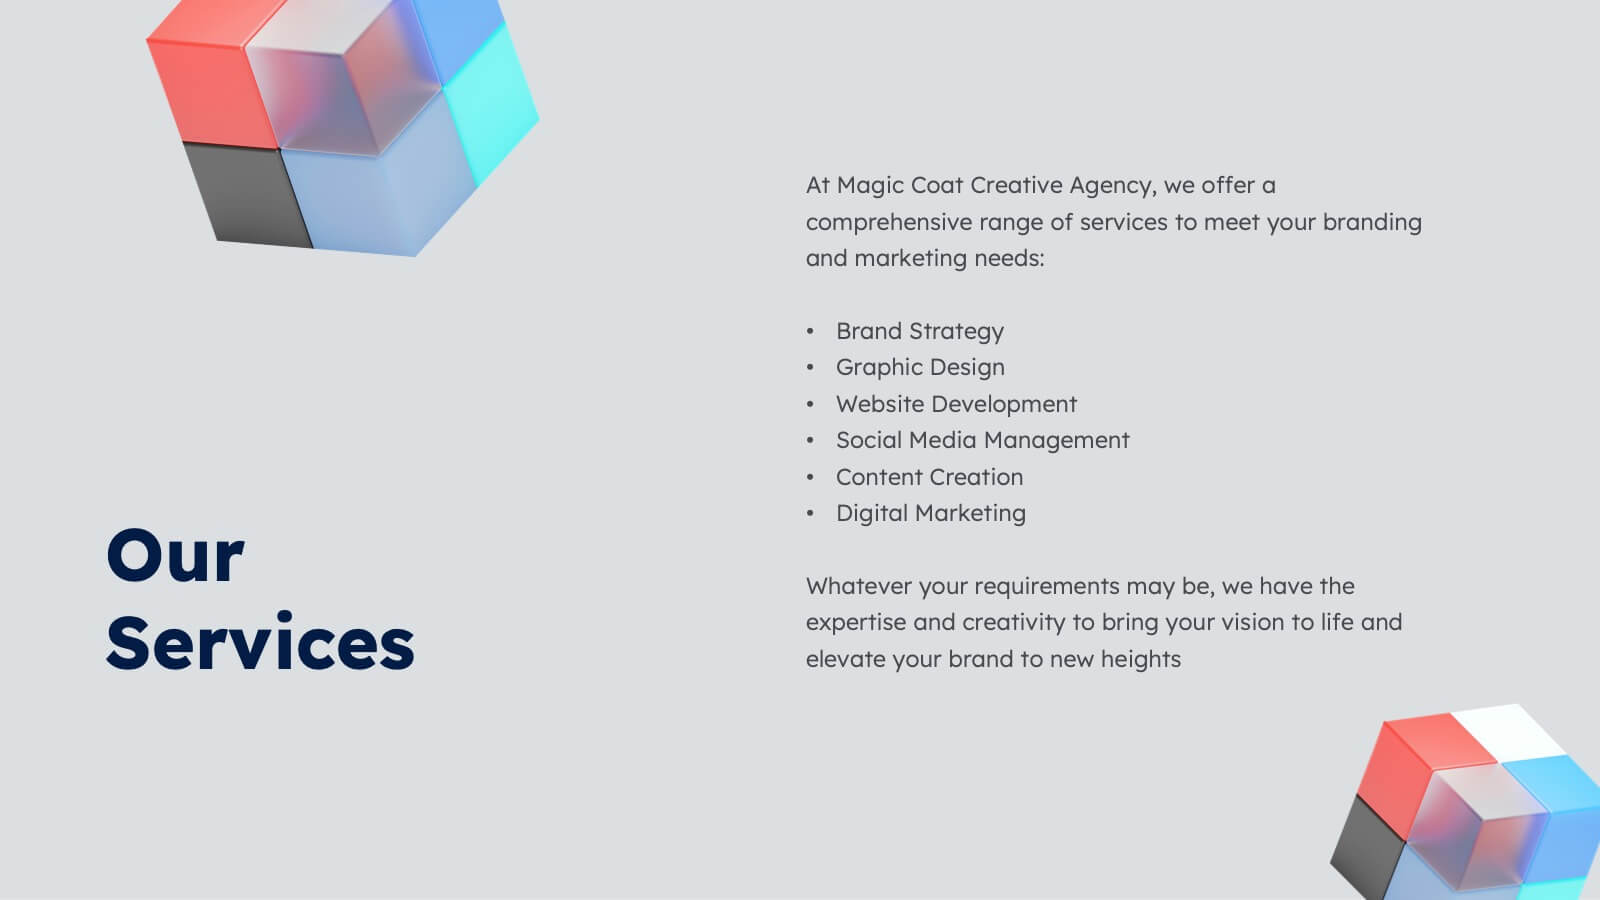
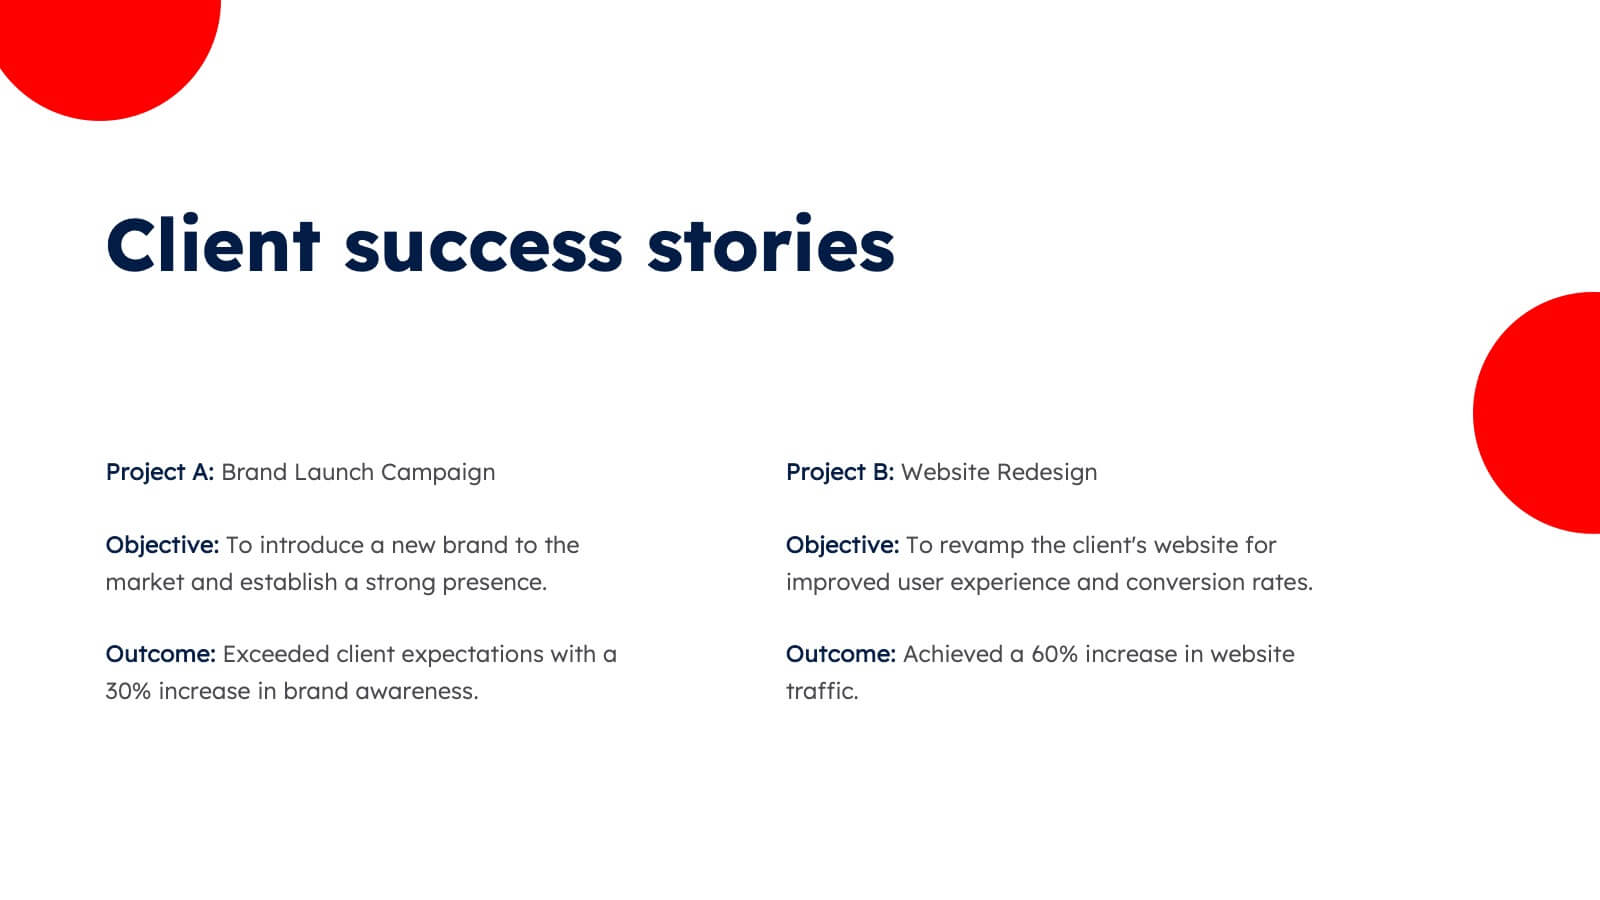
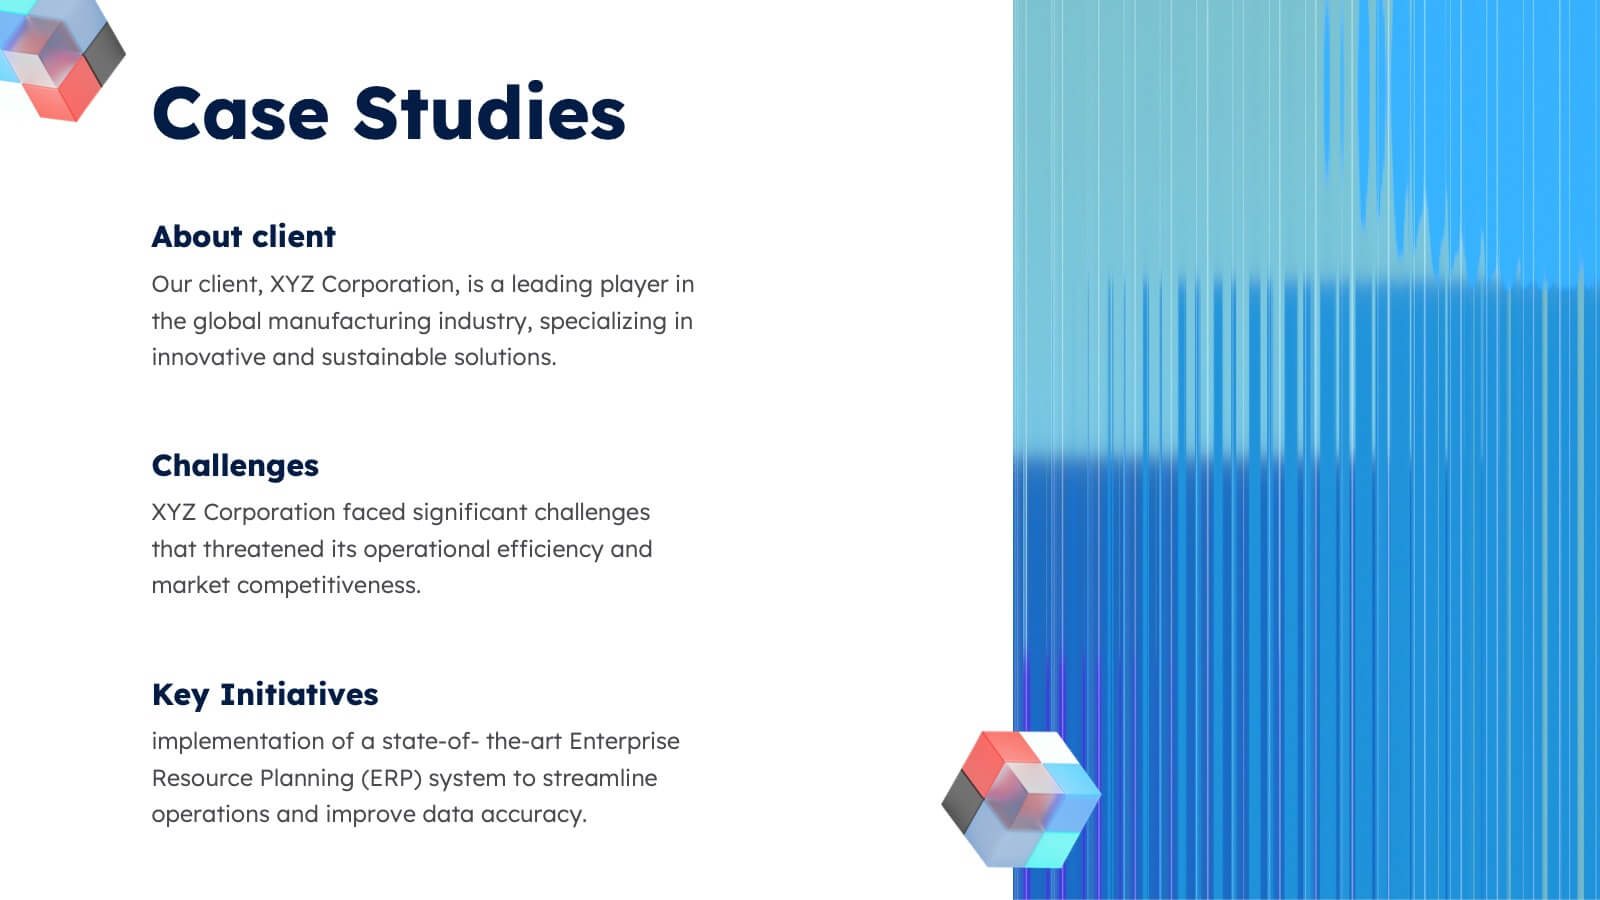
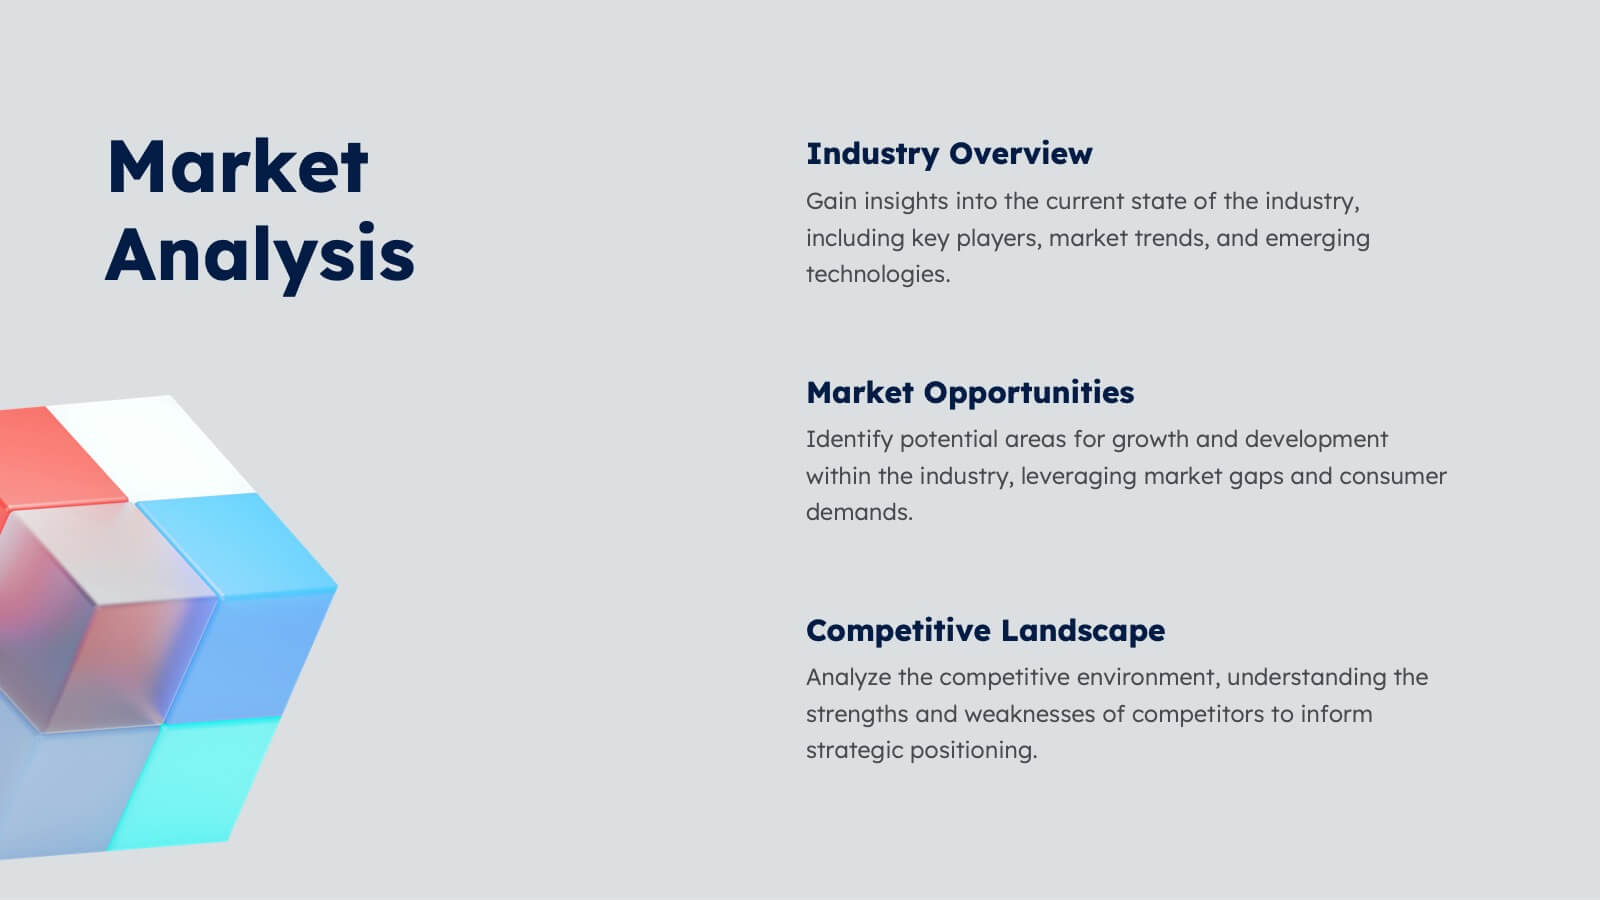
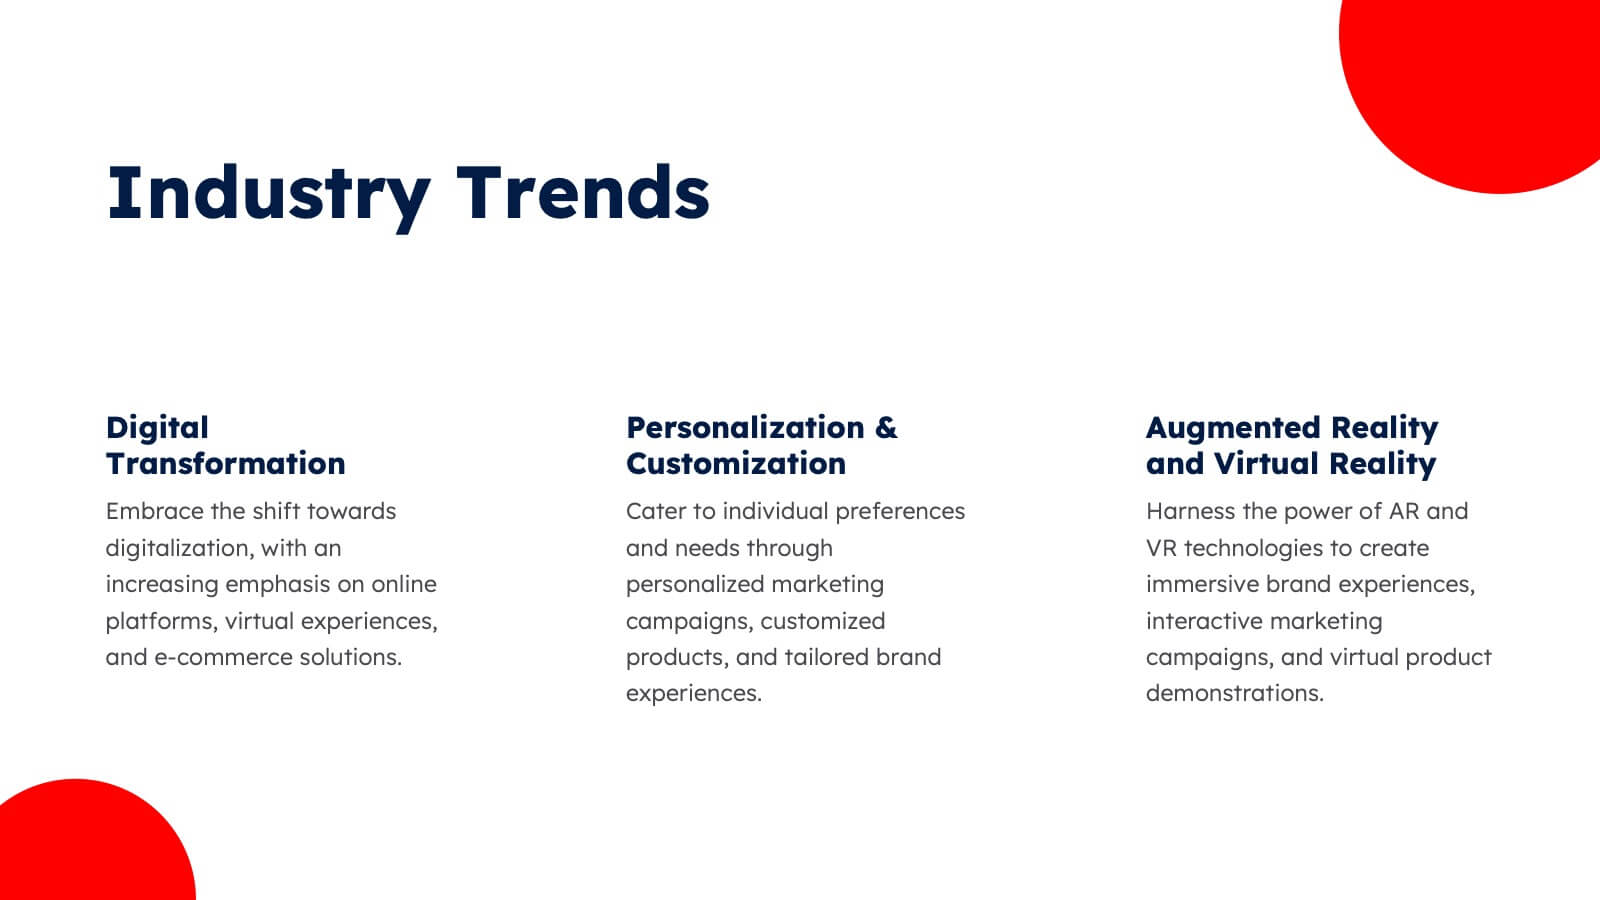
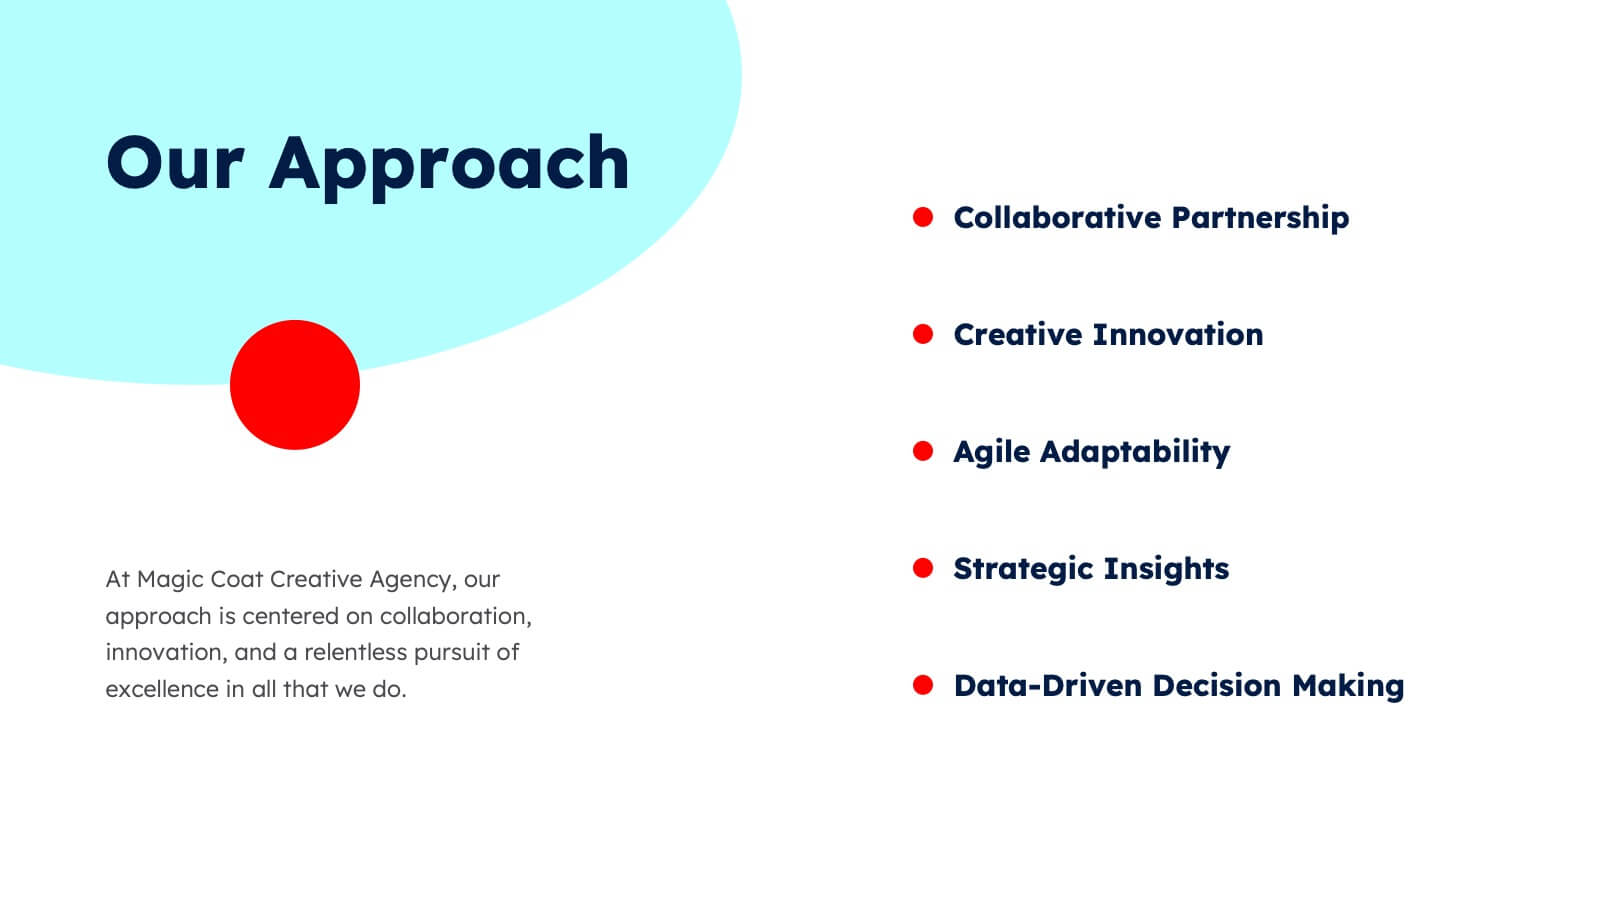
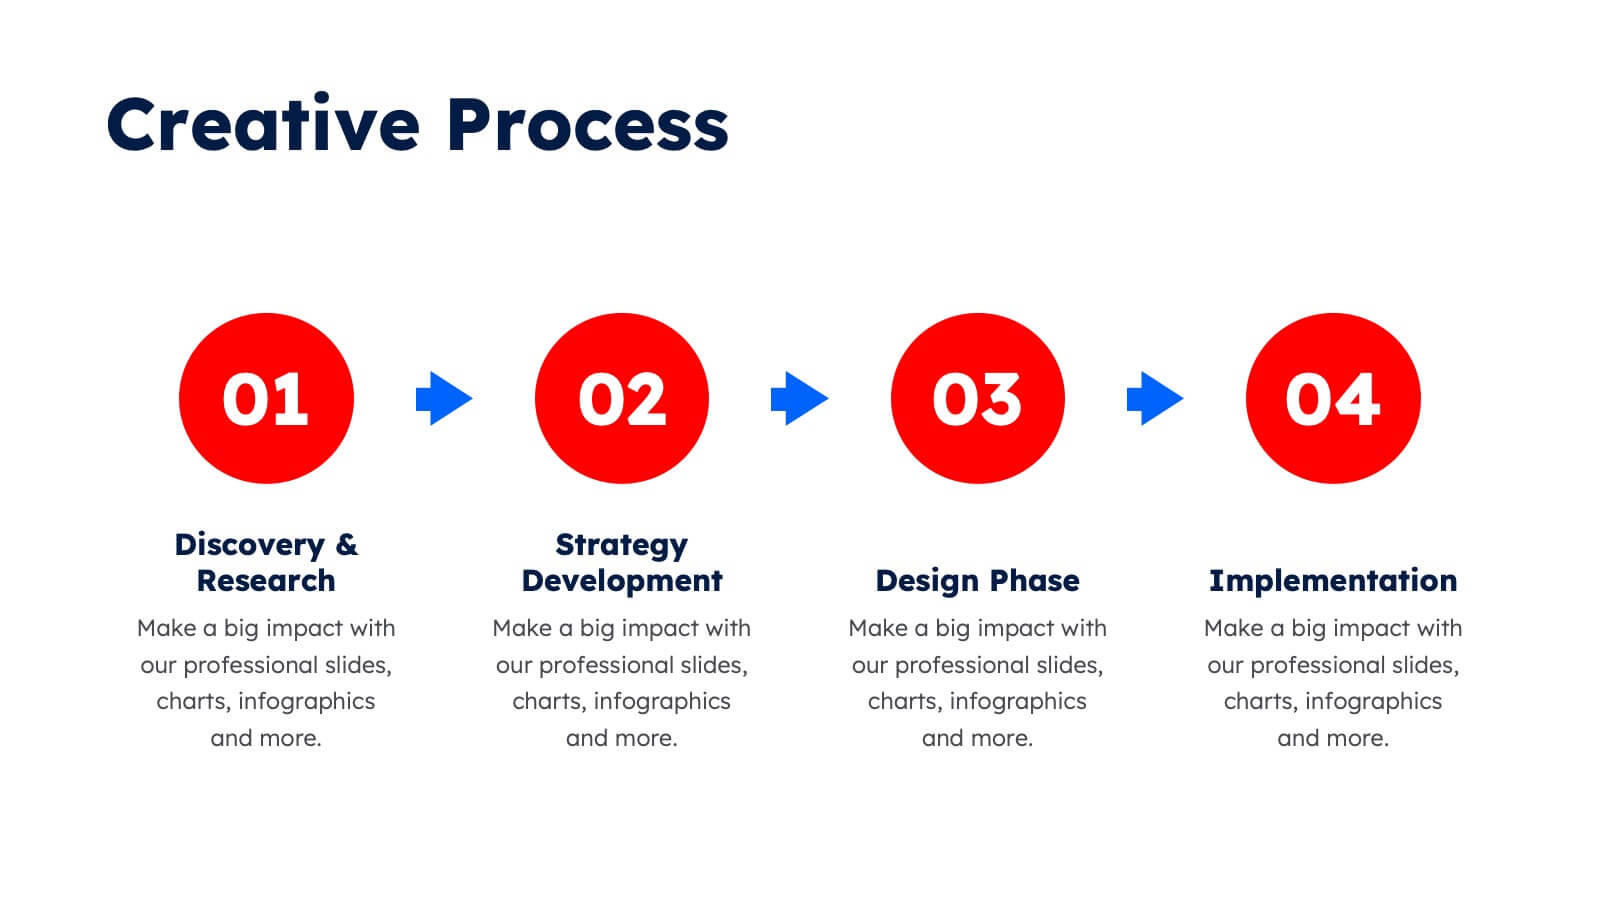
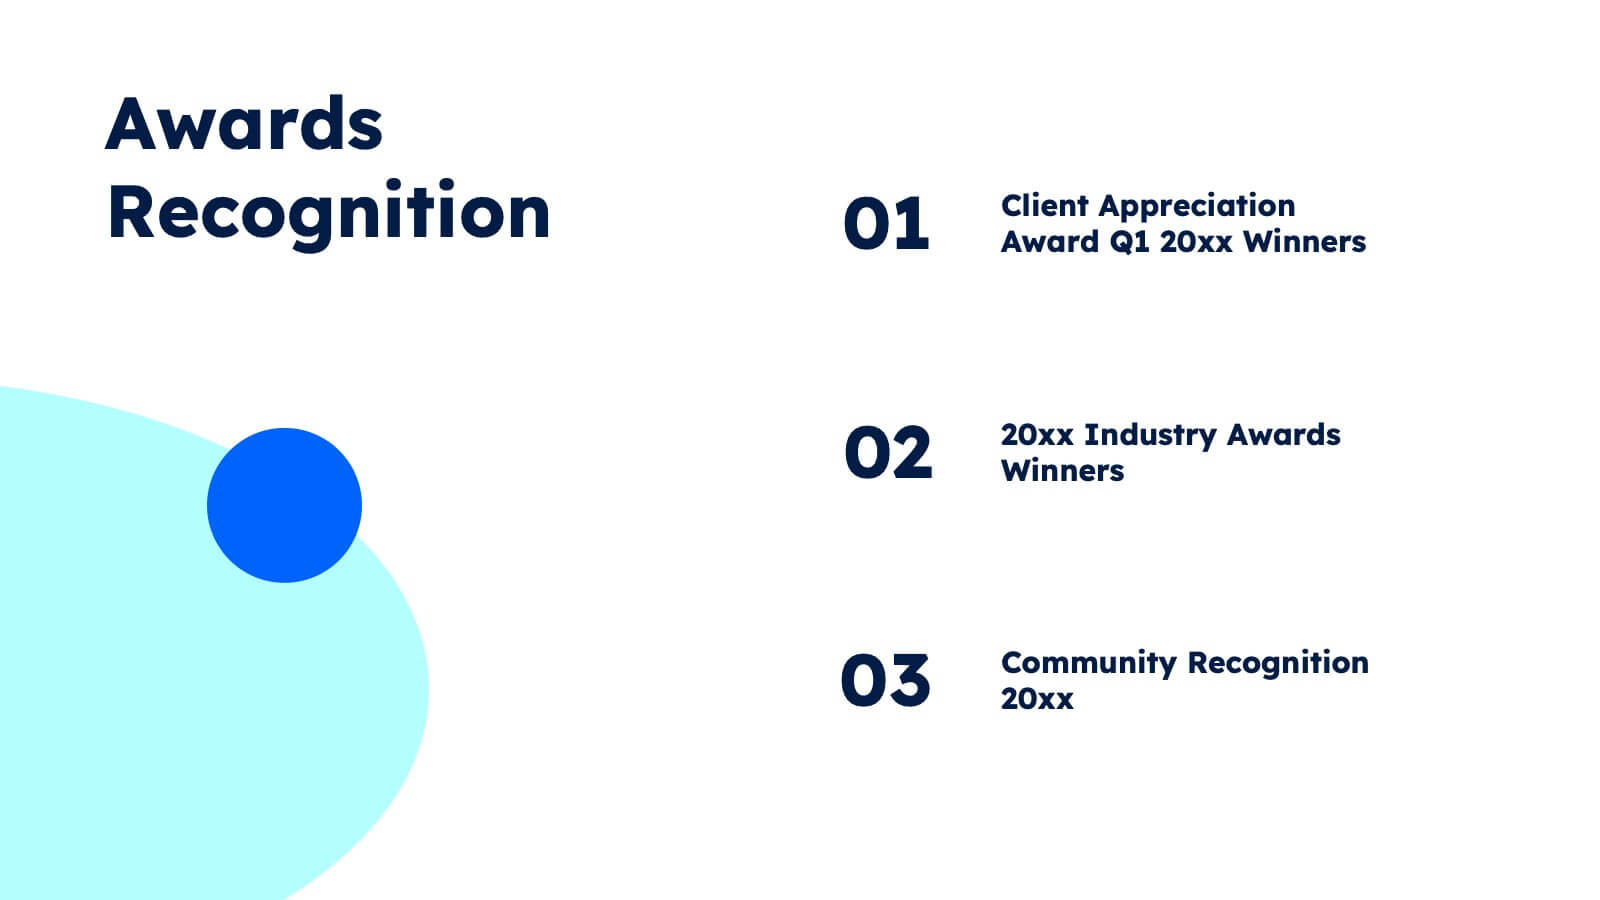
Aura Agency Portfolio Presentation
Showcase your agency's brilliance with this vibrant portfolio presentation template! Ideal for highlighting your mission, vision, case studies, and market analysis, it brings your achievements to life with colorful, engaging slides. Impress clients and partners with a well-structured, visually appealing narrative. Compatible with PowerPoint, Keynote, and Google Slides for easy use on any platform.


5 diapositivas
Step-by-Step Strategy Guide Presentation
Present your ideas with clarity and impact using this clean, structured layout made for professionals who value organization and design. Perfect for outlining strategies, steps, or lists, it keeps your message focused and engaging. Easily customizable and fully compatible with PowerPoint, Keynote, and Google Slides for polished results.


8 diapositivas
Workforce Skills Gap Analysis Presentation
Identify and Bridge Workforce Skill Gaps! This Workforce Skills Gap Analysis template provides a structured approach to assess, compare, and close competency gaps within an organization. Designed with interactive bar chart visuals, it enables HR professionals, managers, and training specialists to track employee skill levels, identify gaps, and align workforce development strategies. Fully customizable in PowerPoint, Keynote, and Google Slides, this template ensures a clear and data-driven approach to workforce planning and professional growth.


2 diapositivas
Business Self-Introduction Presentation
Introduce yourself with confidence using this Business Self-Introduction Slide. Perfect for networking, team meetings, and professional presentations, this template features a modern layout with a dynamic photo cutout, engaging visuals, and structured text areas. Fully customizable for PowerPoint, Keynote, and Google Slides, you can adjust colors, fonts, and content to reflect your personal or business identity.


26 diapositivas
Adlyn Presentation Template
Making low-calorie foods a part of your daily diet protect against the risk of heart disease, diabetes, and cancer. They make you feel full while reducing the daily calorie intake, which can help with weight loss. The Adlyn template is a concise, easy-to-use template that’s designed to help you inform your audience on the importance of low-calorie foods. This template is perfect for site builders, food bloggers, and writers looking to create informative content on food facts and healthy living. Using Adlyn you can add daily tips about nutrition and exercise along with a list of healthy foods.


8 diapositivas
Economic Improvement in South America Map Presentation
Highlight regional performance with this South America economic growth map. Featuring 3D bar charts and country-specific markers, it’s ideal for visualizing financial progress, investments, or development trends. Fully editable in PowerPoint, Google Slides, and Keynote, this layout is perfect for reports, forecasts, and business reviews with a geographic focus.


5 diapositivas
Cyber Security Management Infographics
Cyber Security Management is important because it helps to protect organizations from cyber threats and attacks. These Infographics are visual representations of information related to the management of cyber security. This template can be used to provide summaries on the various aspects of cyber security management such as risk assessment, security policies, threat detection and response, and data protection. These infographics are designed to help individuals and organizations understand the importance of cyber security management and the steps that need to be taken to ensure the security of their systems and data.


6 diapositivas
Corporate Responsibility Sustainability Plan Presentation
Present your sustainability vision with the Corporate Responsibility Sustainability Plan Presentation. Designed around a tree-themed layout, this infographic highlights six key initiatives—perfect for showcasing environmental, social, and governance (ESG) efforts. Ideal for CSR reports, strategy decks, or stakeholder presentations. Fully editable in Canva, PowerPoint, Keynote, and Google Slides.


7 diapositivas
Business Funnel Infographic Presentation
A Funnel Infographic is used to help communicate the stages of a sales funnel in a transparent and visually appealing way. This is a marketing model that is used to track the journey from project to profit. This template includes a series of funnel-shaped graphics that represent the different stages of the sales funnel. You can customize this template with your own content, colors, and fonts to suit your specific needs. Add your own text to each stage of the funnel, and use the additional icons to represent each stage in more detail. Convey your marketing message with this Infographic!


3 diapositivas
Cost-Benefit Analysis and Strategic Outcomes Presentation
Present trade-offs with clarity using the Cost-Benefit Analysis and Strategic Outcomes Presentation. Designed with visual balance scales and segmented callouts, this layout helps you compare investments versus returns, making complex decisions easier to explain. Ideal for proposals, audits, or business strategy reviews. Fully editable in PowerPoint, Keynote, and Google Slides.


9 diapositivas
Business Dashboard Infographics
A business dashboard, often referred to as a business intelligence dashboard, is a visual representation of an organization's key performance indicators and critical business metrics. Empower your business analysis and strategy with our Infographic. This dynamic template enables you to present key business metrics, performance indicators, and trends in a clear and impactful manner. Compatible with Powerpoint, Keynote, and Google Slides. This template is a powerful tool to visualize your business progress, identify opportunities, and communicate your success story to viewers, clients, or team members.


10 diapositivas
Project Budget Breakdown Presentation
The "Project Budget Breakdown Presentation" template offers a clear and efficient way to visualize budget allocations within a project. It uses a visually appealing color scheme that highlights four different budget segments, each represented by a different color to ensure quick readability and easy understanding. The template allows you to illustrate percentages and corresponding financial values, making it straightforward for stakeholders to grasp budget allocations at a glance. This template is highly beneficial for project managers, financial analysts, and business executives who need to present and discuss budgetary details clearly and concisely in project meetings or budget reviews. It is adaptable for use in various industries, including construction, IT, marketing, and research development, supporting effective budget management and transparency.


5 diapositivas
Leadership and Team Dynamics Strategy Presentation
Highlight team hierarchy and leadership flow with the Leadership and Team Dynamics Strategy Presentation. This visual layout is ideal for mapping roles, responsibilities, or reporting lines. Use it to clarify leadership structures or showcase team development plans. Fully customizable in PowerPoint, Keynote, and Google Slides for seamless strategic communication.


3 diapositivas
Key Stats and Market Figures Slide Presentation
Communicate comparisons clearly with the Key Stats and Market Figures Slide presentation. This template uses a balanced scale graphic to visually contrast two data sets—ideal for weighing pros and cons, competitor benchmarks, or before-and-after scenarios. Fully customizable in PowerPoint, Keynote, and Google Slides.