


Características


¿Tienes alguna pregunta?
Recomendar


6 diapositivas
PESTEL Management Infographic
PESTEL analysis is a framework used to assess and analyze the external macro-environmental factors that can impact an organization, industry, or market. This infographic template provides an overview of the PESTEL analysis framework and its application in strategic management. This template provides a clear and concise explanation of the PESTEL analysis framework, detailing each component of the acronym for you to use. It highlights the significance of considering these external factors when formulating business strategies and making informed decisions. Compatible with Powerpoint, Keynote, and Google Slides.


4 diapositivas
Corporate Networking Flow Presentation
Simplify complex communication systems with this dynamic and easy-to-follow presentation design. Perfect for visualizing workflow connections, team collaboration, or IT infrastructure, it brings clarity to multi-level processes with a clean and structured layout. Fully editable and compatible with PowerPoint, Keynote, and Google Slides for professional results.


20 diapositivas
Trend Report Presentation
Navigate the latest market developments with this Trend Report presentation template. Perfect for displaying current marketing trends, consumer behavior, and future predictions, this vibrant template includes slides for social media strategies, influencer marketing, and more. Fully compatible with PowerPoint, Keynote, and Google Slides, it’s ideal for professionals looking to stay ahead in dynamic industries.


10 diapositivas
Marketing Wheels Strategy Presentation
Turn your marketing process into a powerful visual story with this dynamic circular design. Each stage connects seamlessly to highlight planning, execution, and performance insights. Perfect for illustrating campaigns, workflows, or business strategies. Fully customizable and compatible with PowerPoint, Keynote, and Google Slides for effortless editing and presentation.


26 diapositivas
Creative Cryptocurrency Investment Presentation
The growth of Cryptocurrency has been significant over the past few years. It is very important to do your own research, understand the risks involved, and only invest what you can afford to lose. This template is designed with a focus on cryptocurrencies and includes customizable photo layouts, charts, a gold coin pattern and unique cryptocurrency-themed icons and illustrations. You can use this template for any topic related to Cryptocurrency or Blockchain. Create your own presentation within minutes using Powerpoint, Keynote, or Google slides, it is fully editable to suit your needs.


5 diapositivas
Collaboration Tools for Team Efficiency Presentation
Visualize teamwork like never before with the Collaboration Tools for Team Efficiency Presentation. Featuring a puzzle-style layout, this slide highlights four interconnected ideas or steps—perfect for team workflows, project milestones, or tool comparisons. Easy to customize in Canva, PowerPoint, or Google Slides.


7 diapositivas
Objective Statement Infographic
An objective is a specific and measurable goal or target that an individual, team, or organization aims to achieve within a defined period. This infographic template serves as a roadmap, guiding actions and decisions toward a desired outcome. Our objective statement infographic isn't just a canvas; it's a launchpad for your goals and aspirations. Fully customizable and compatible with Powerpoint, Keynote, and Google Slides. This infographic is bold, vibrant, and strategically designed, this will propel your objectives into the spotlight, ensuring clarity and resonance for your audience.


6 diapositivas
Workflow and Operations Flow Presentation
Optimize your operations with the Workflow and Operations Flow presentation. This structured and visually appealing template helps you map out workflows, streamline processes, and enhance team coordination. Perfect for project managers, business analysts, and operational leaders, these fully editable slides allow you to visualize key steps and dependencies with ease. Compatible with PowerPoint, Keynote, and Google Slides.


5 diapositivas
Real Estate Investing Infographics
Real estate investing refers to the purchase, ownership, management, rental, or sale of real estate properties with the objective of generating income and/or capital appreciation. These infographic templates can be used to provide key information and insights about real estate investing. These are designed to educate individuals about the basics of real estate investing, its benefits, and important considerations to help them make informed investment decisions. These infographics are great for anyone seeking to understand the basics of real estate. Compatible with Powerpoint, Keynote, and Google Slides.


7 diapositivas
Consecutive Numbers Infographic
Dive into the world of mathematics with our Consecutive Numbers Infographic! Employing an array of serene blues and greens, this visually appealing tool breaks down the concept of consecutive numbers in a fun and comprehensible manner. It's an educator's dream, designed to captivate and engage, making the topic accessible for students of various age groups. Beyond the classroom, it's a handy reference for professionals and enthusiasts alike. With compatibility spanning PowerPoint, Keynote, and Google Slides, this infographic is poised to elevate any presentation, workshop, or lecture it graces.


21 diapositivas
Utopia Marketing Proposal Template Presentation
Unleash your marketing potential with this vibrant, modern presentation template. Perfect for presenting marketing proposals, industry overviews, and consumer behavior analysis, it features a colorful design that captures attention. Highlight key strategies like social media, influencer marketing, and SEO trends to engage your audience. Compatible with PowerPoint, Keynote, and Google Slides, it ensures seamless presentations on any platform.


6 diapositivas
Agriculture Jobs Infographic
Agriculture jobs encompass a wide range of career opportunities that involve the cultivation, production, processing, and distribution of crops, livestock, and other agricultural products. This infographic template showcases the diversity of jobs within the agriculture industry, highlighting the roles, required skills, and potential career growth. This infographic can be organized into different categories of agriculture jobs, such as Farming and Crop Production, Livestock Management, Agricultural Engineering, and Agricultural Research. This template is compatible with Powerpoint, Keynote, and Google Slides.


23 diapositivas
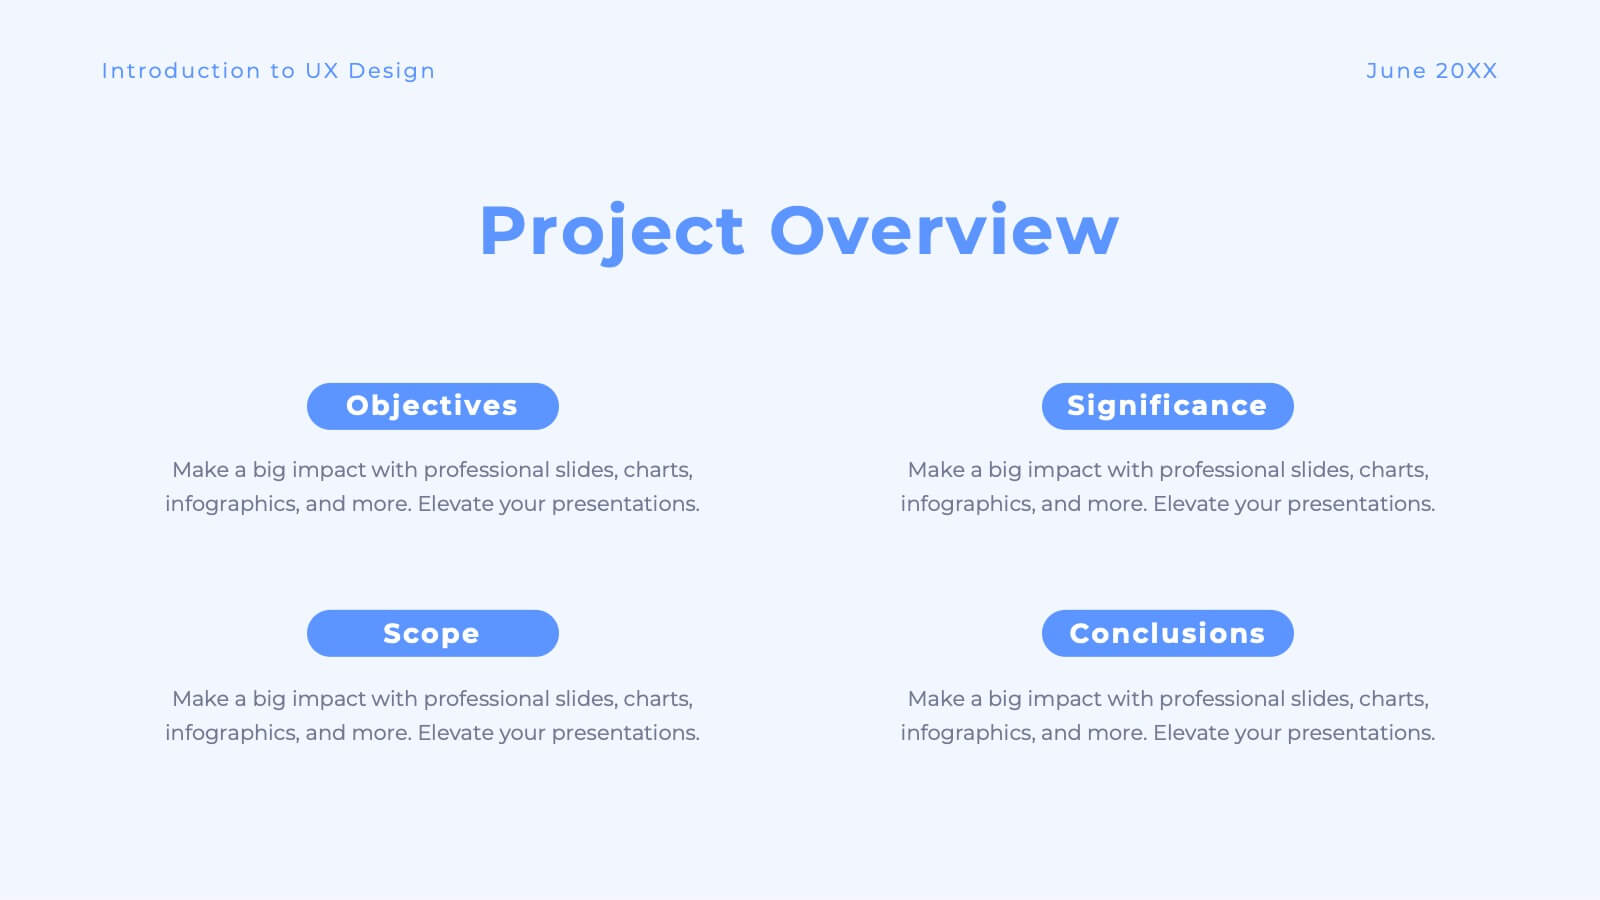
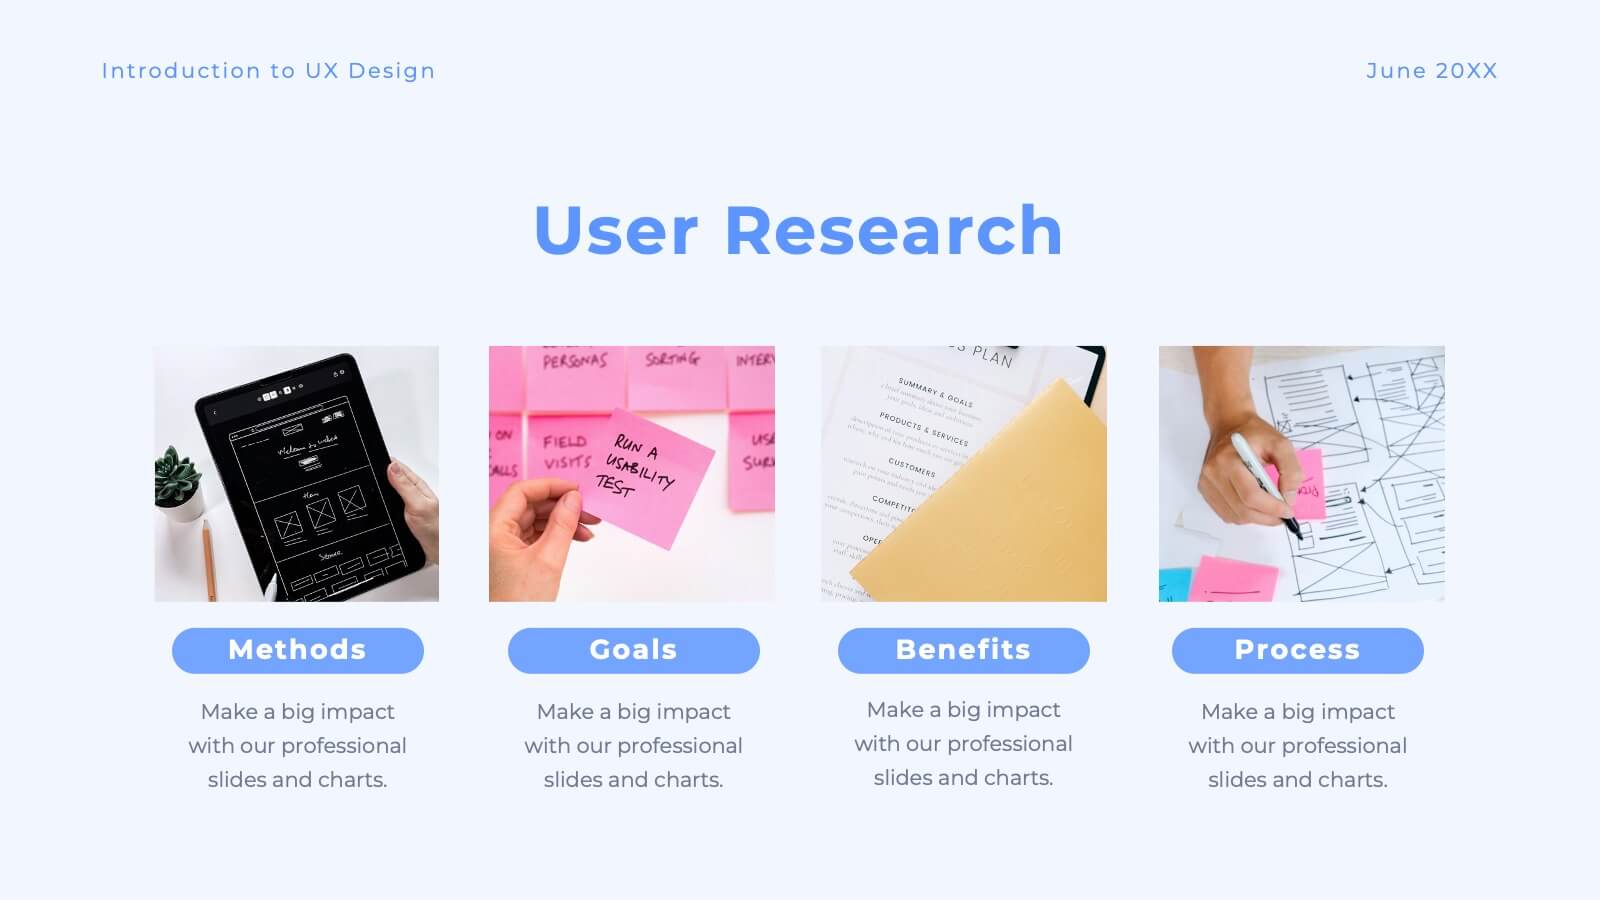
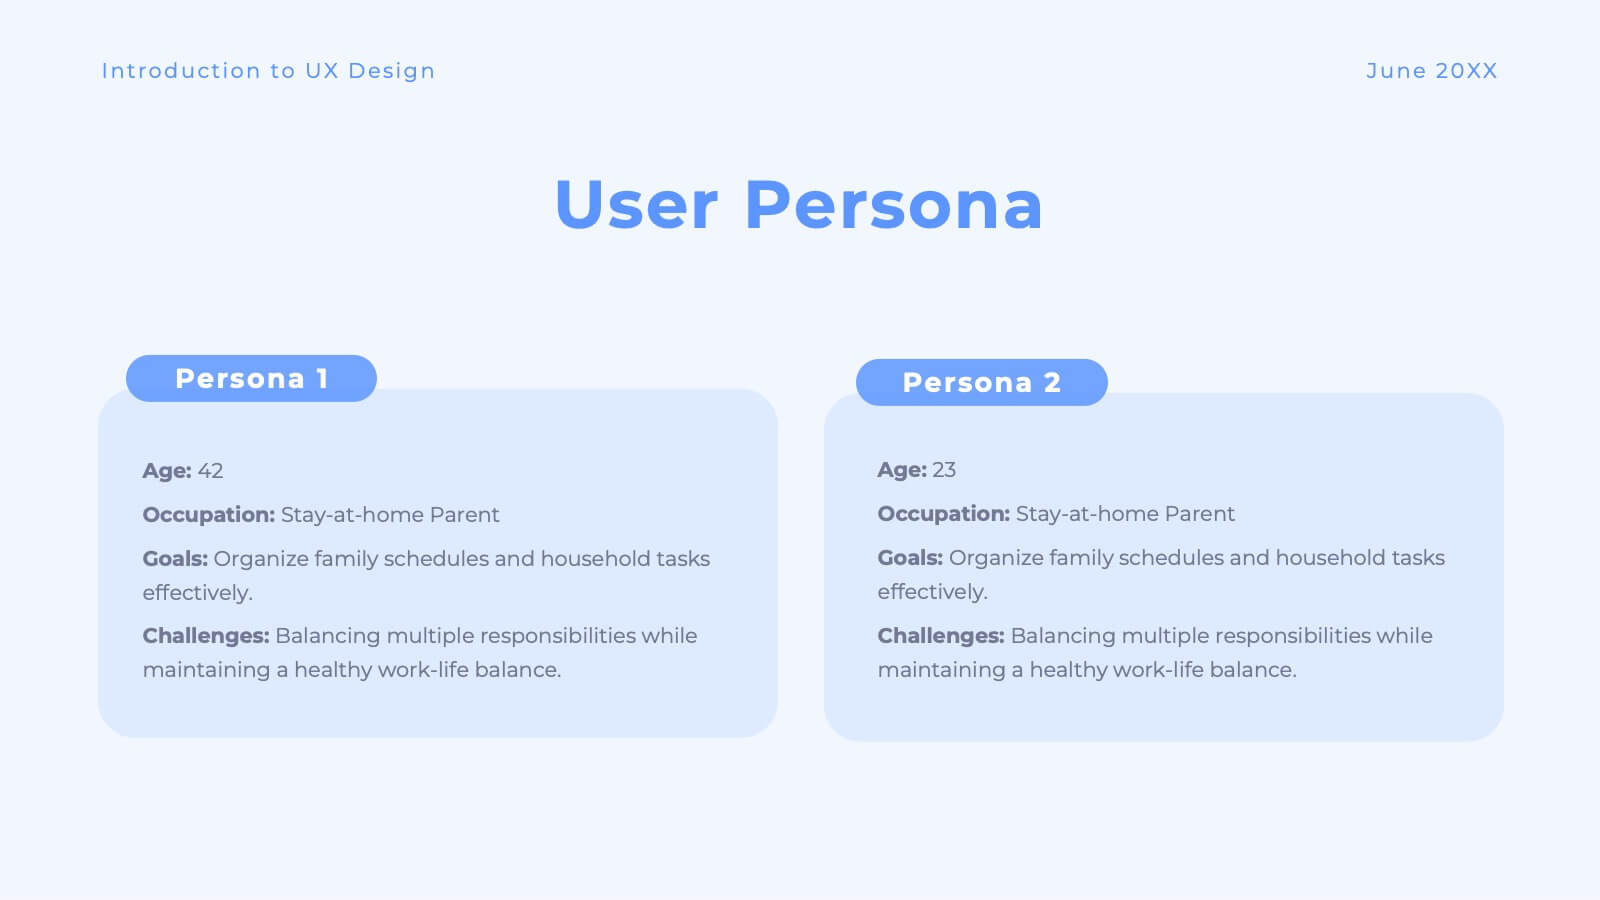
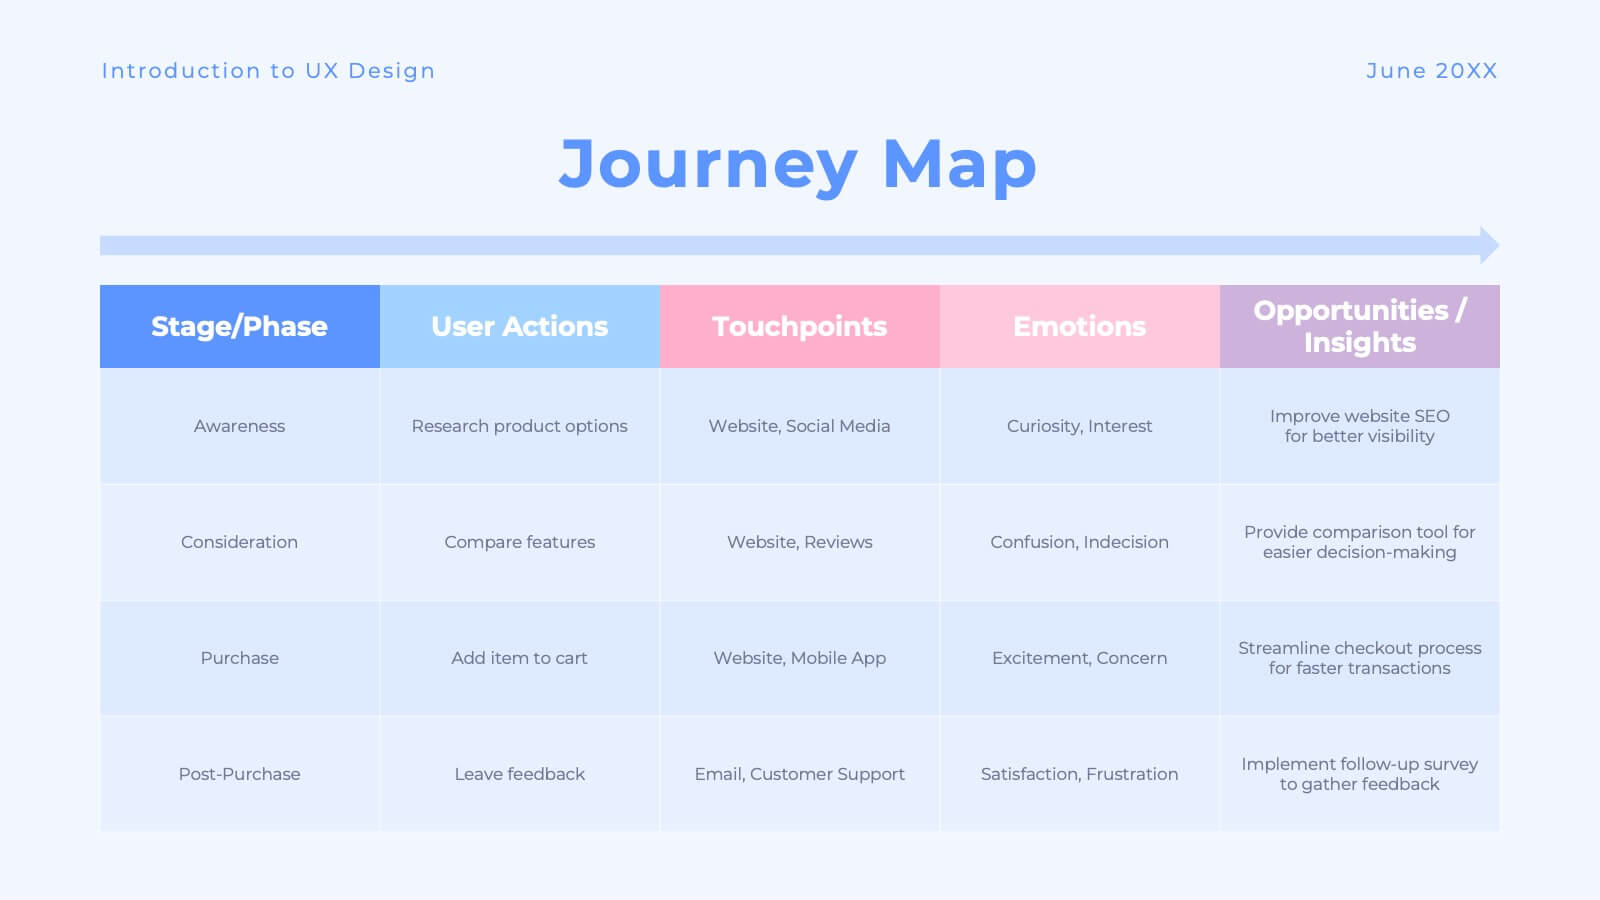
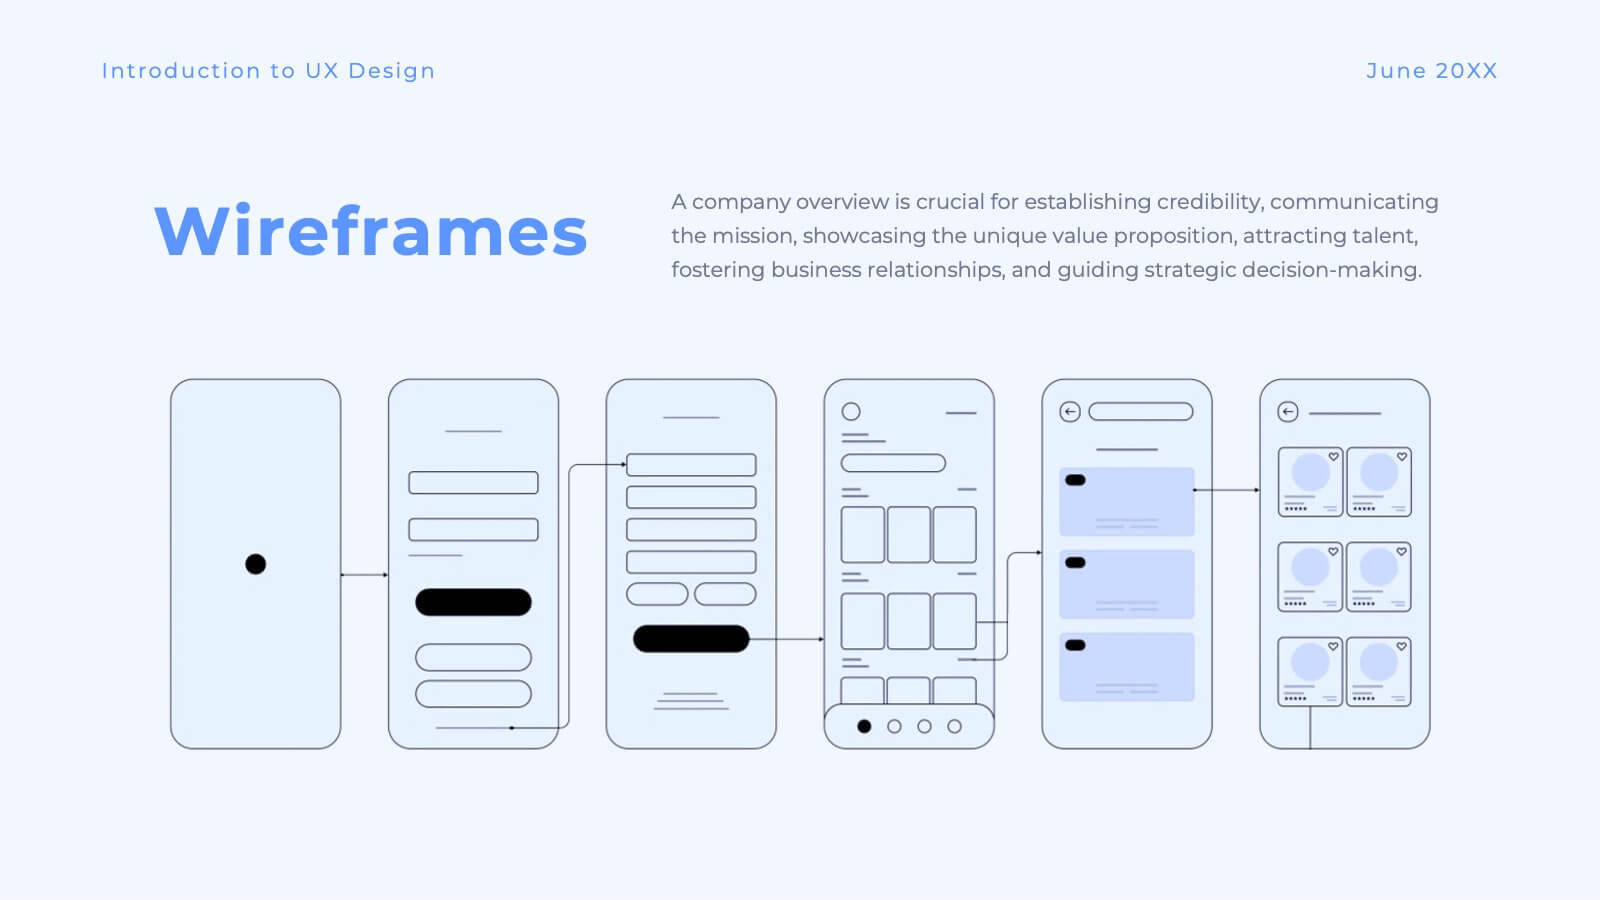
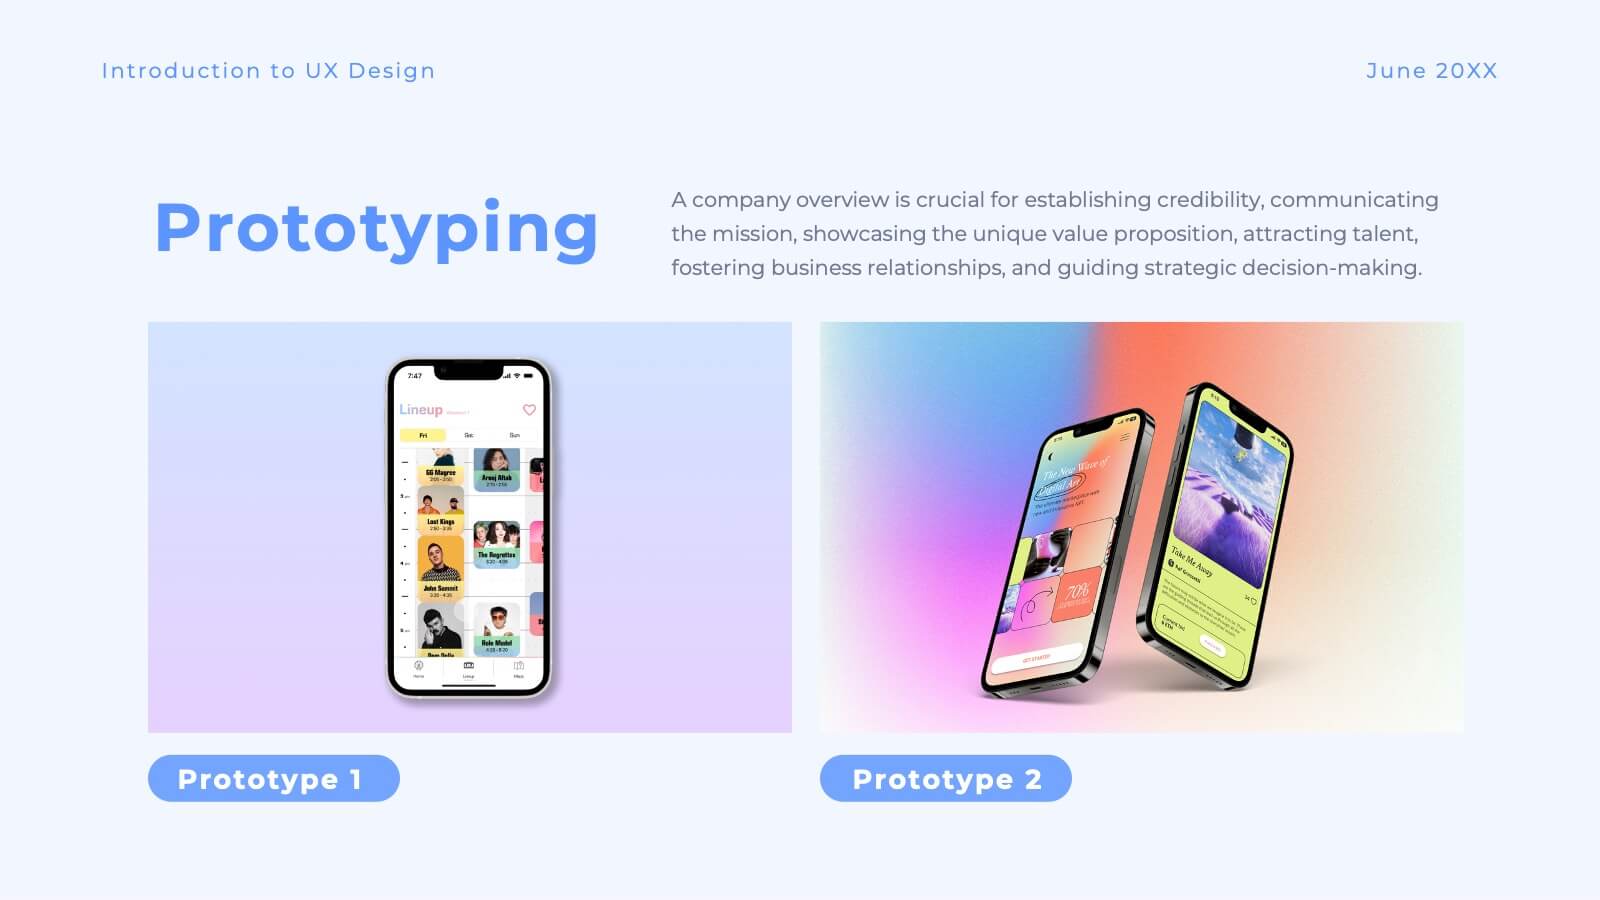
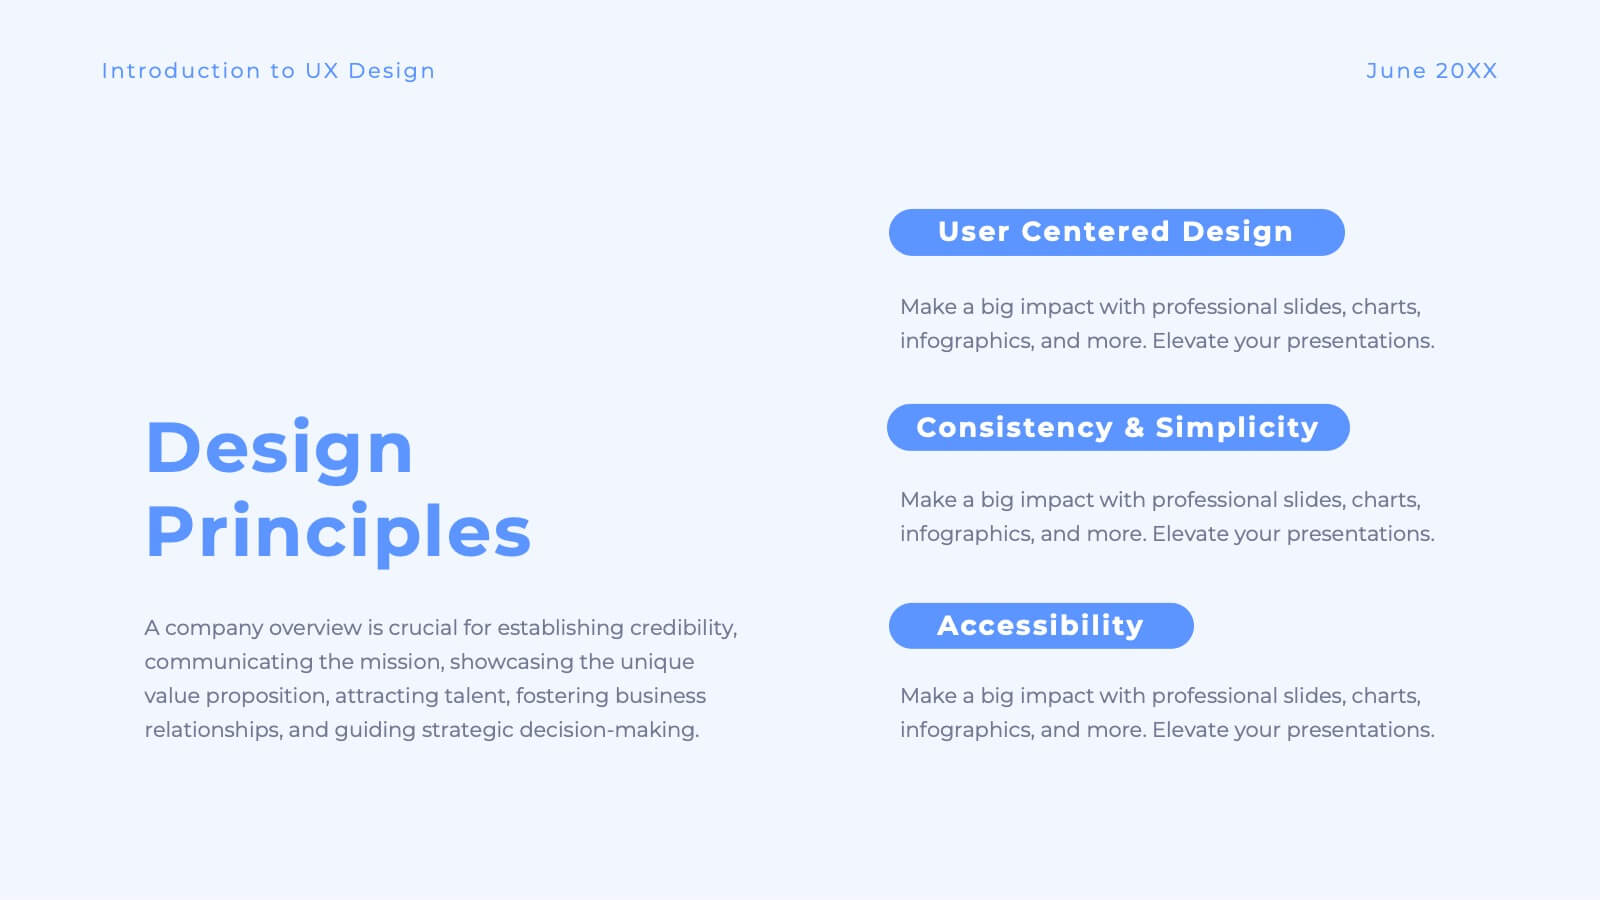
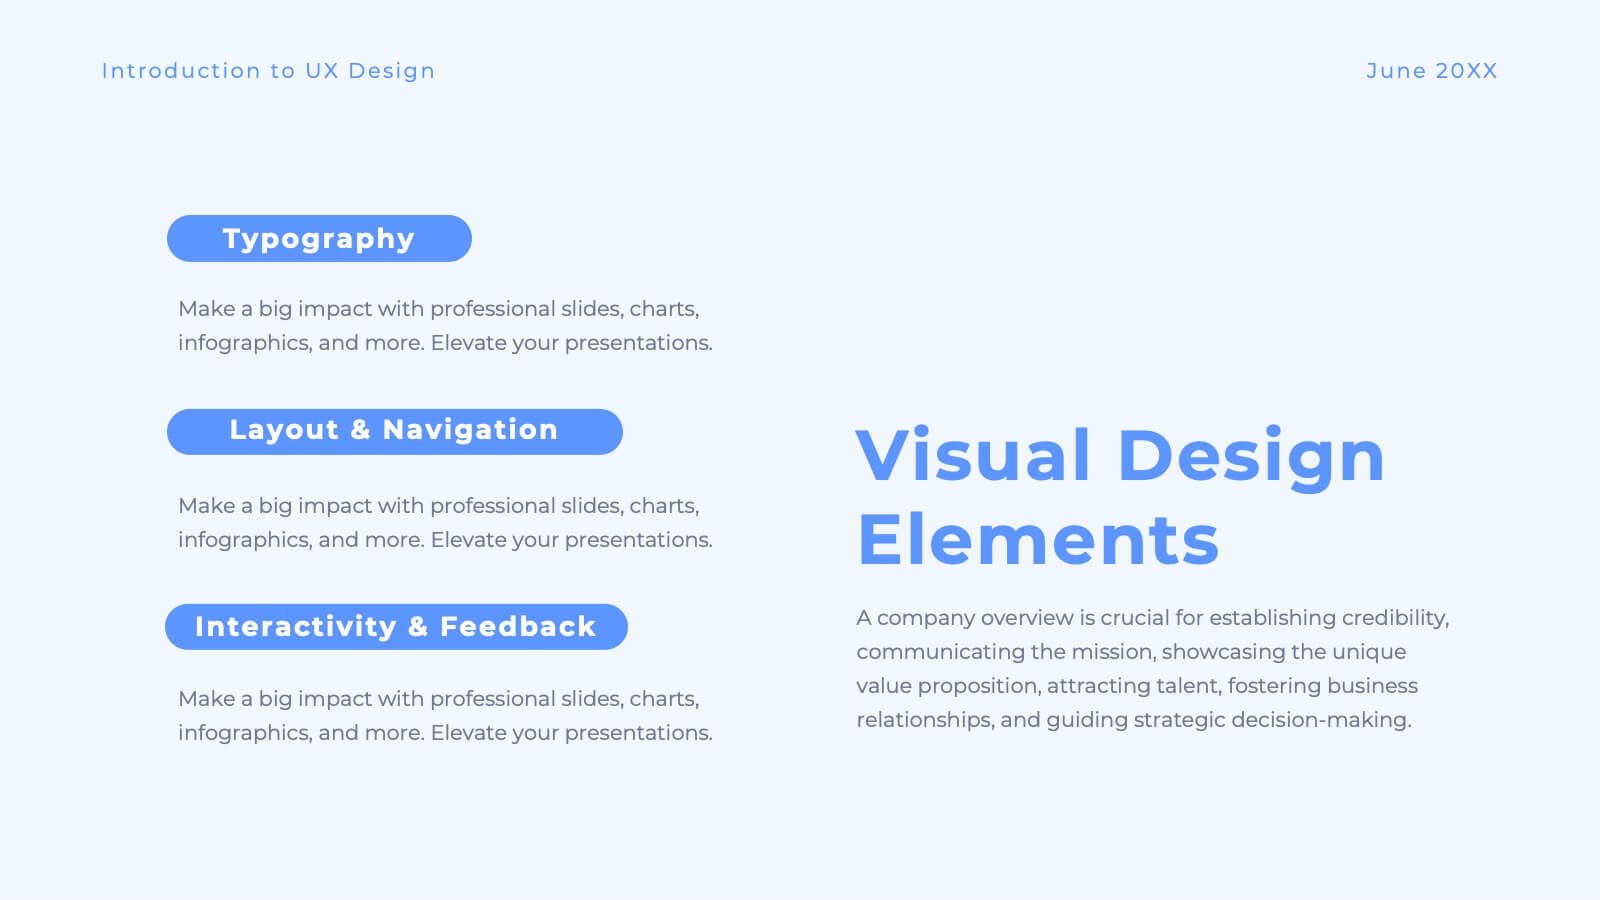
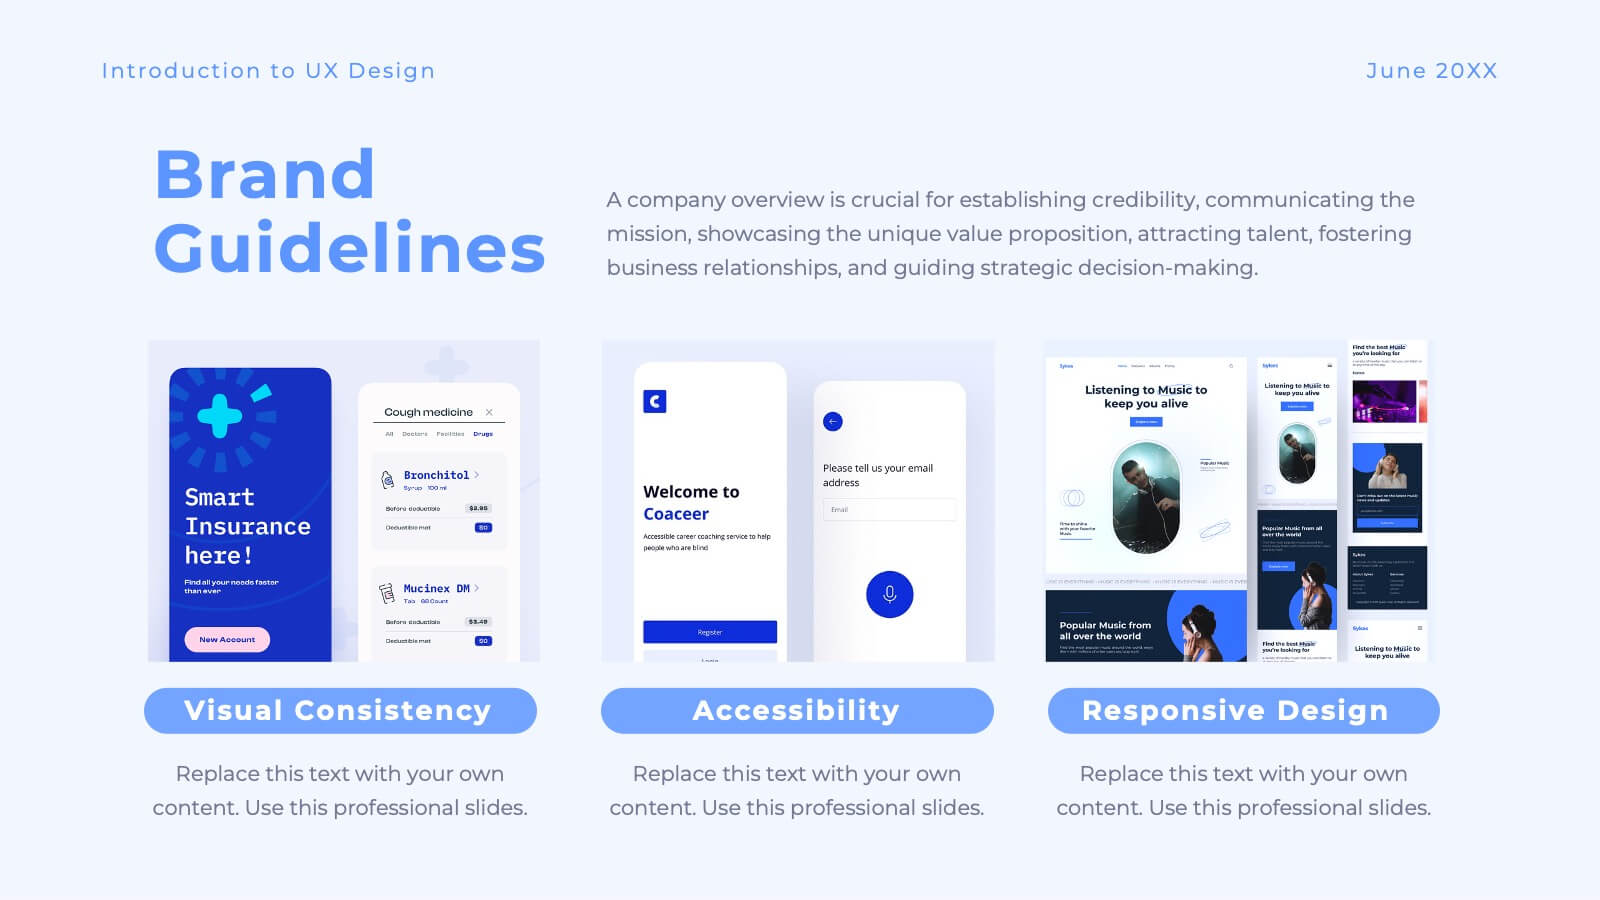
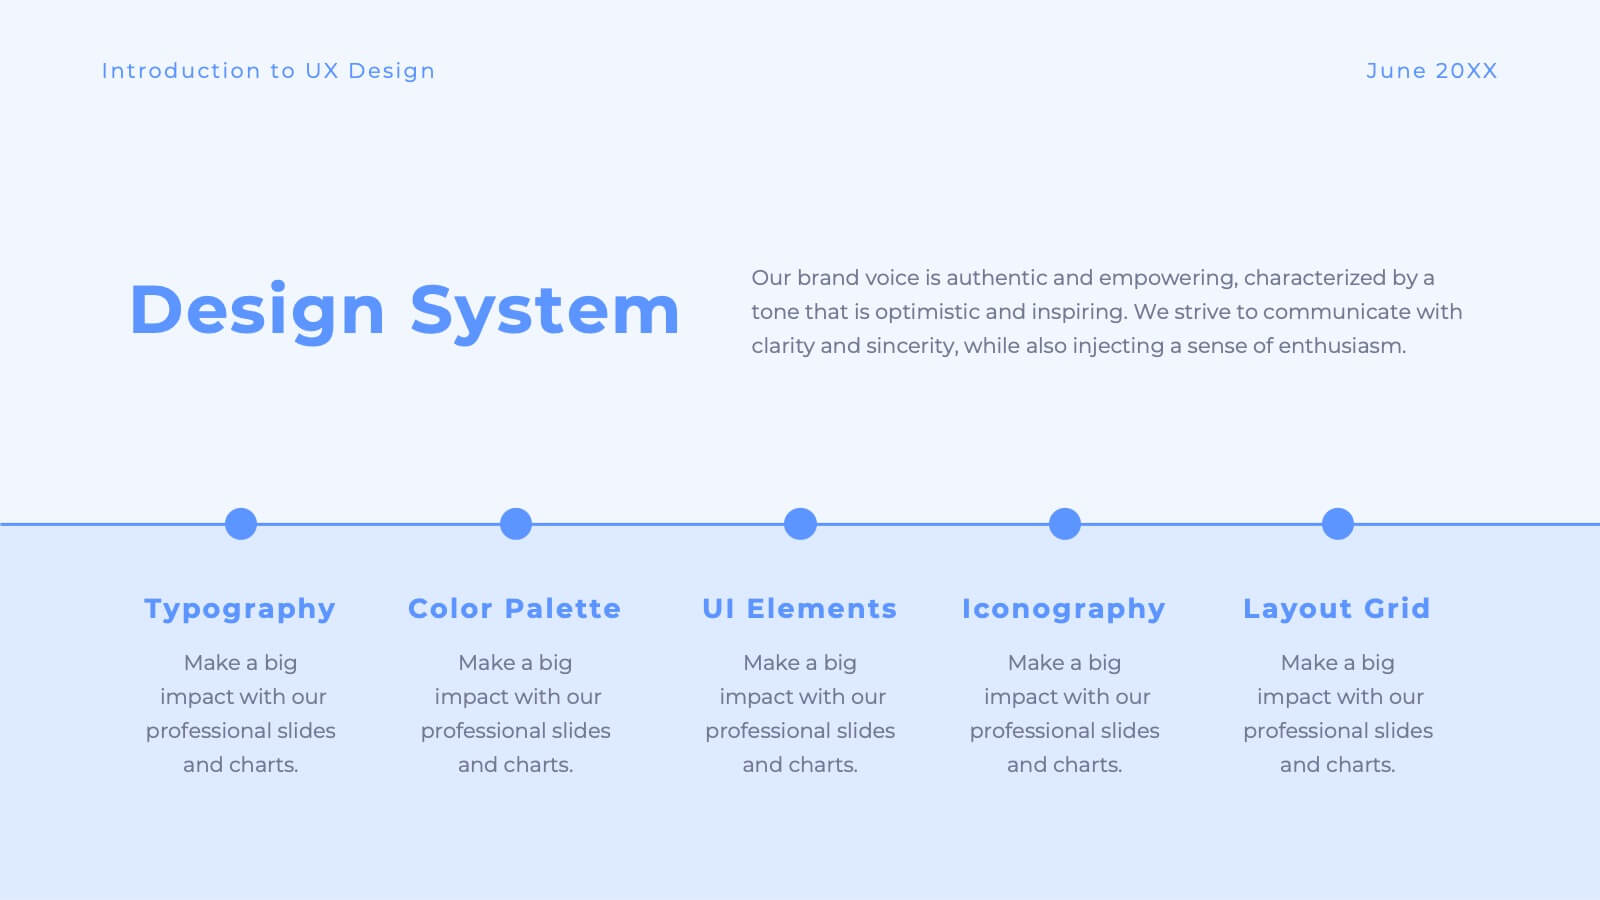
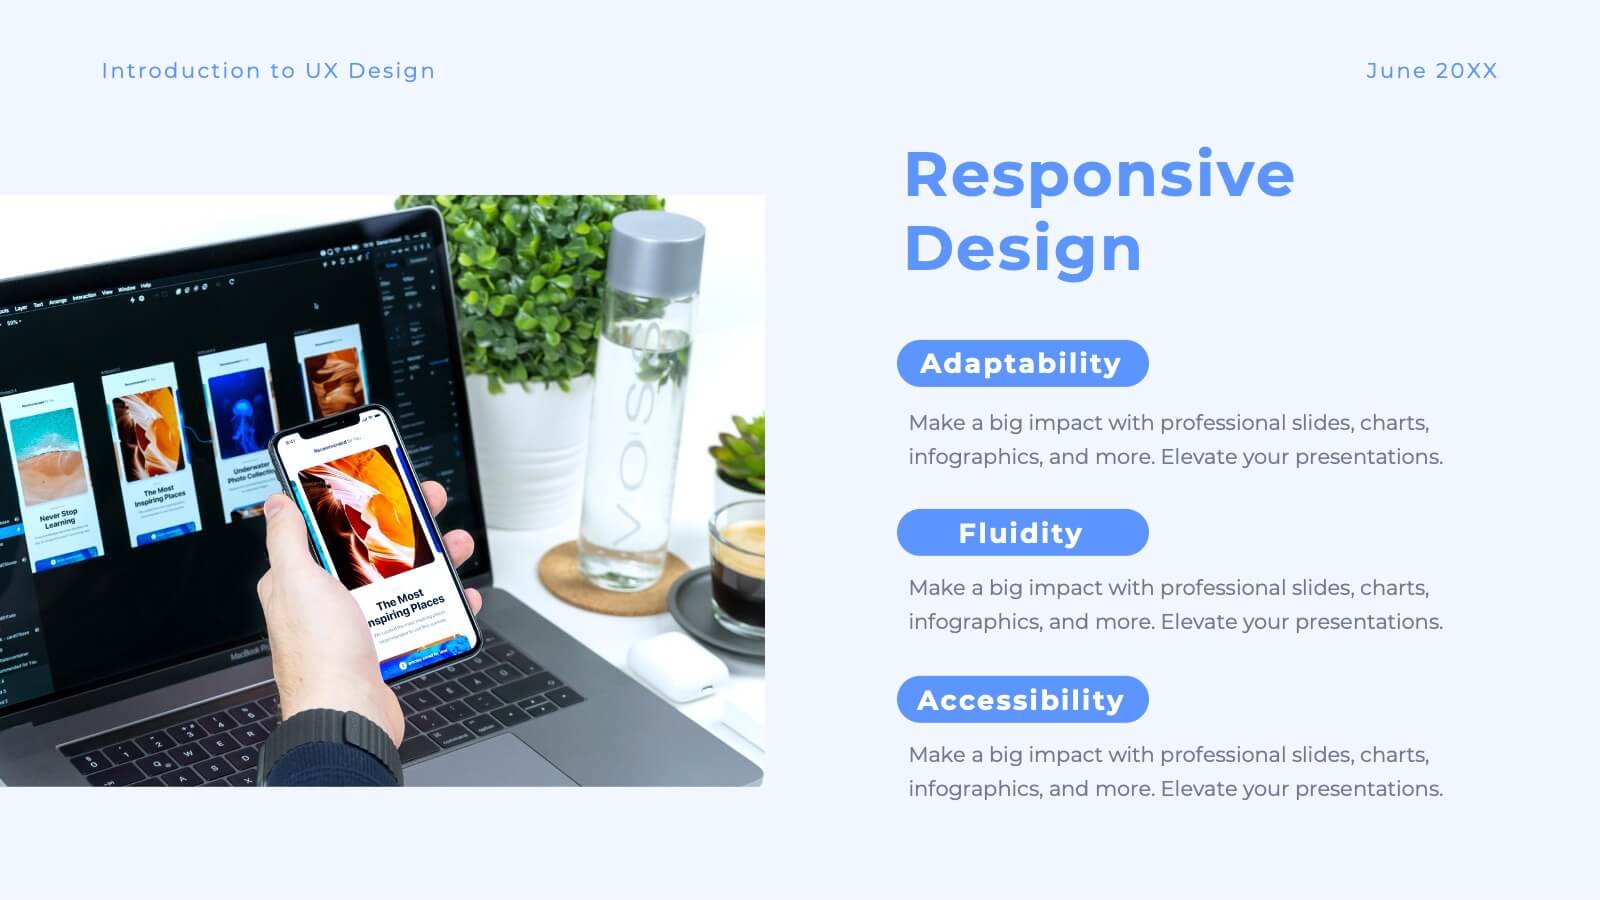
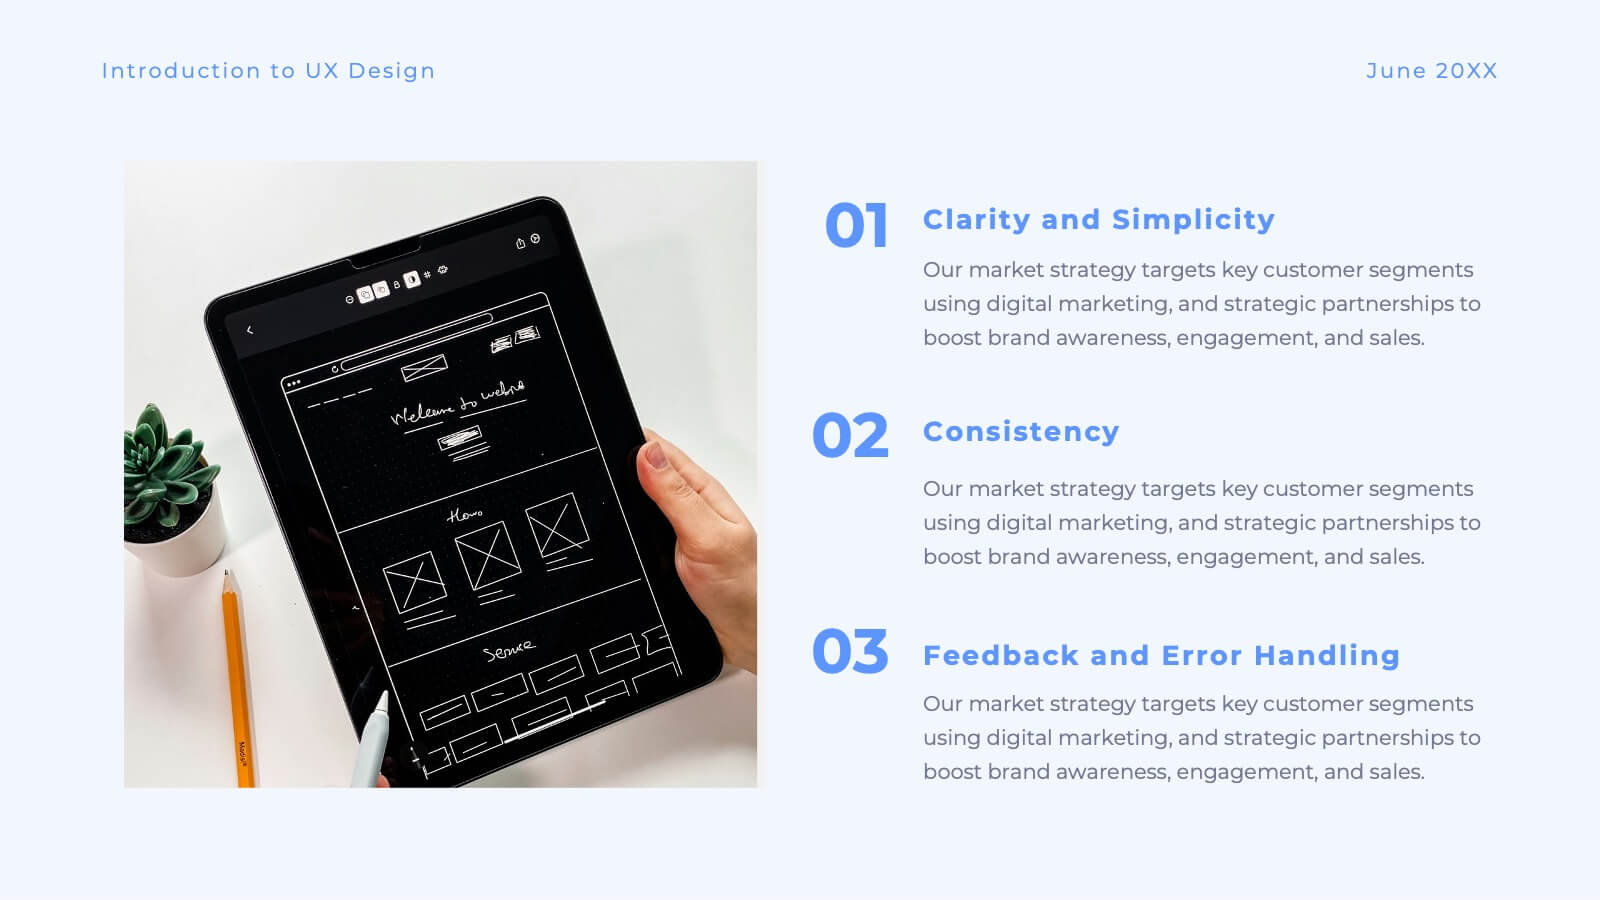
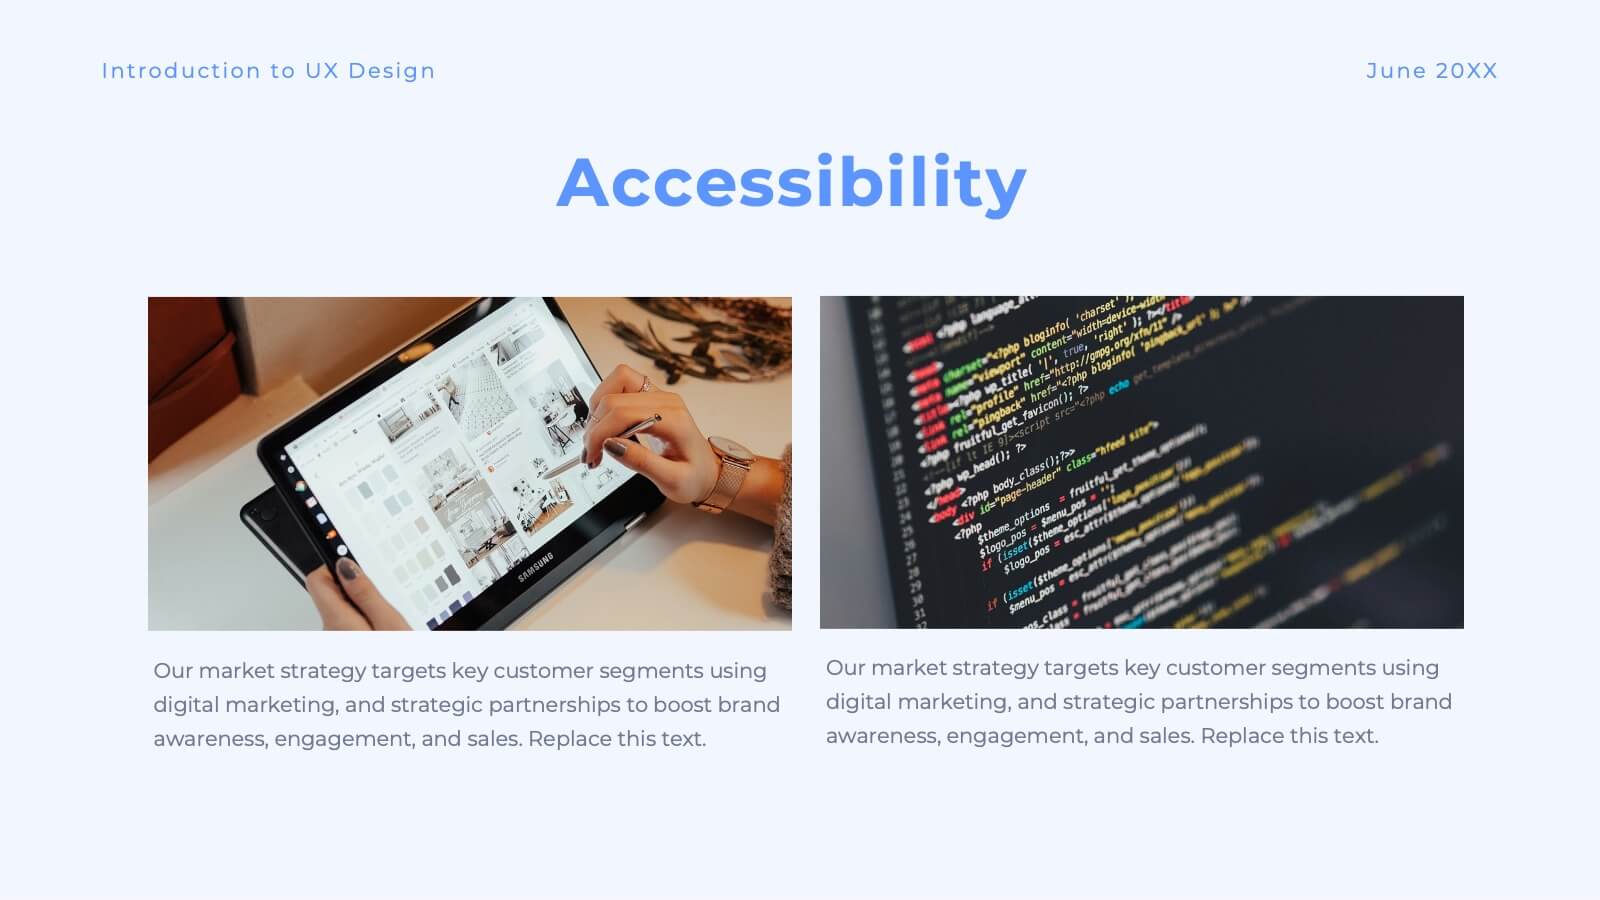
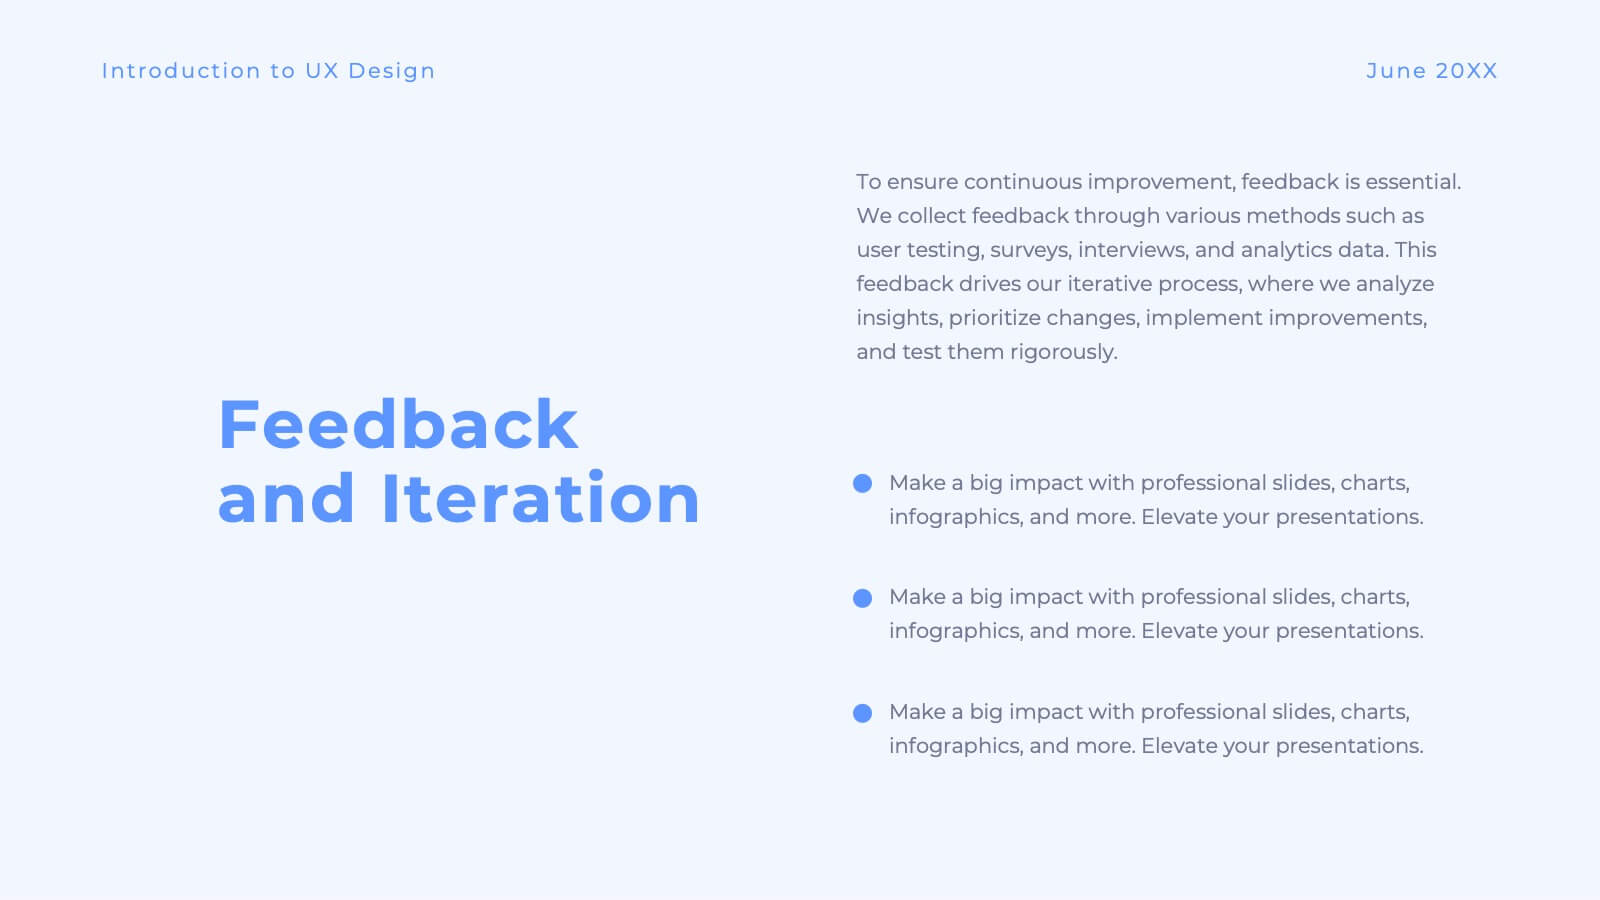
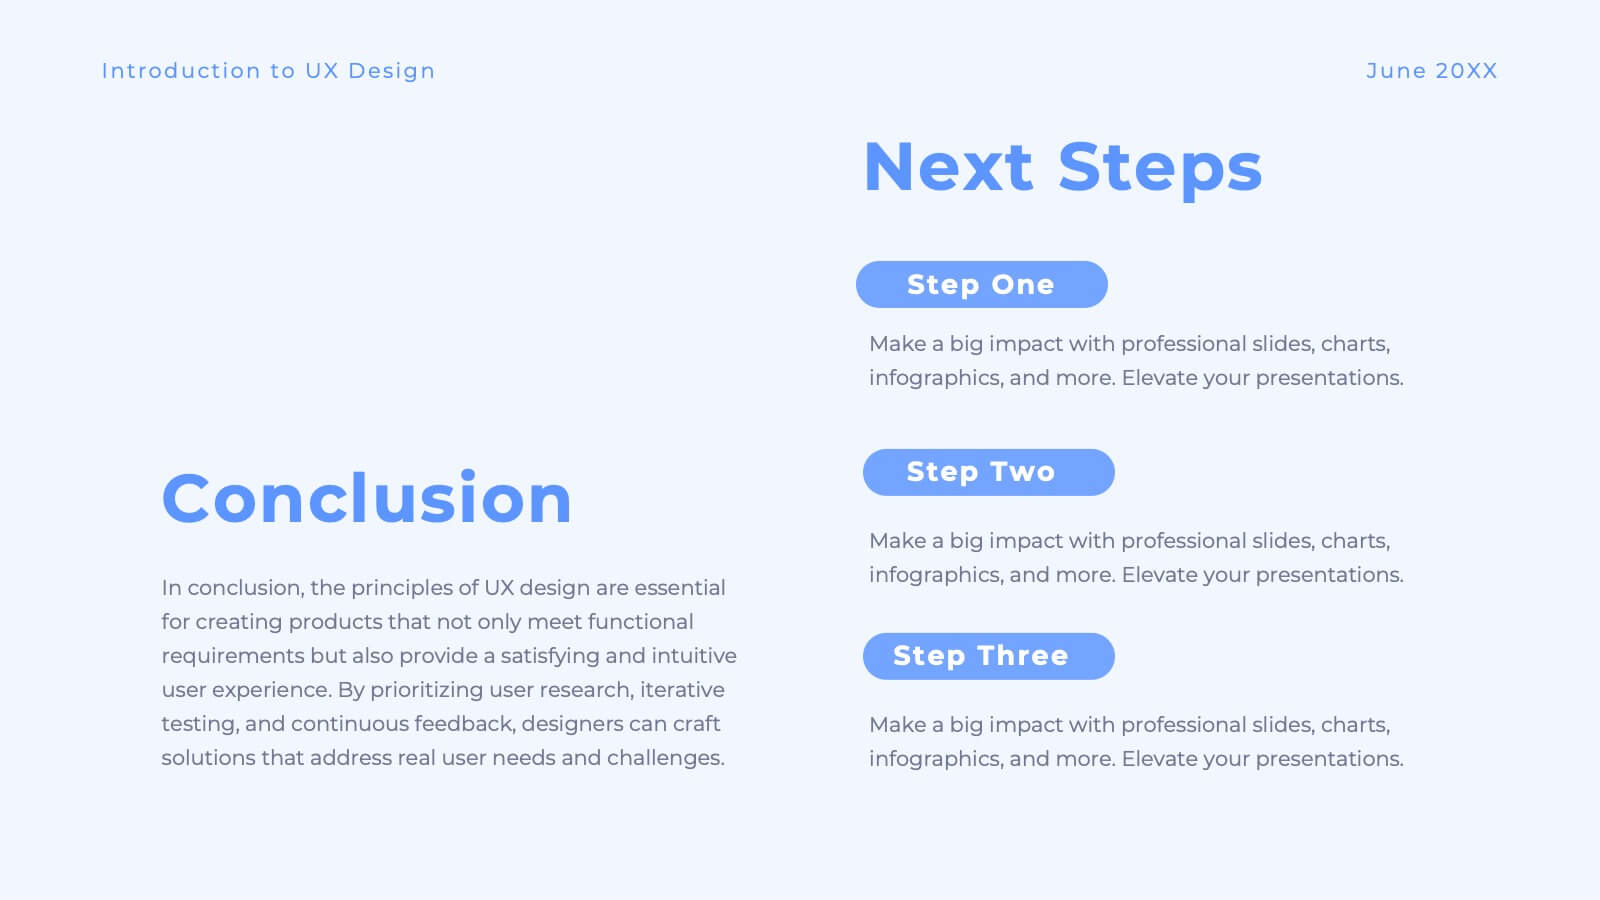
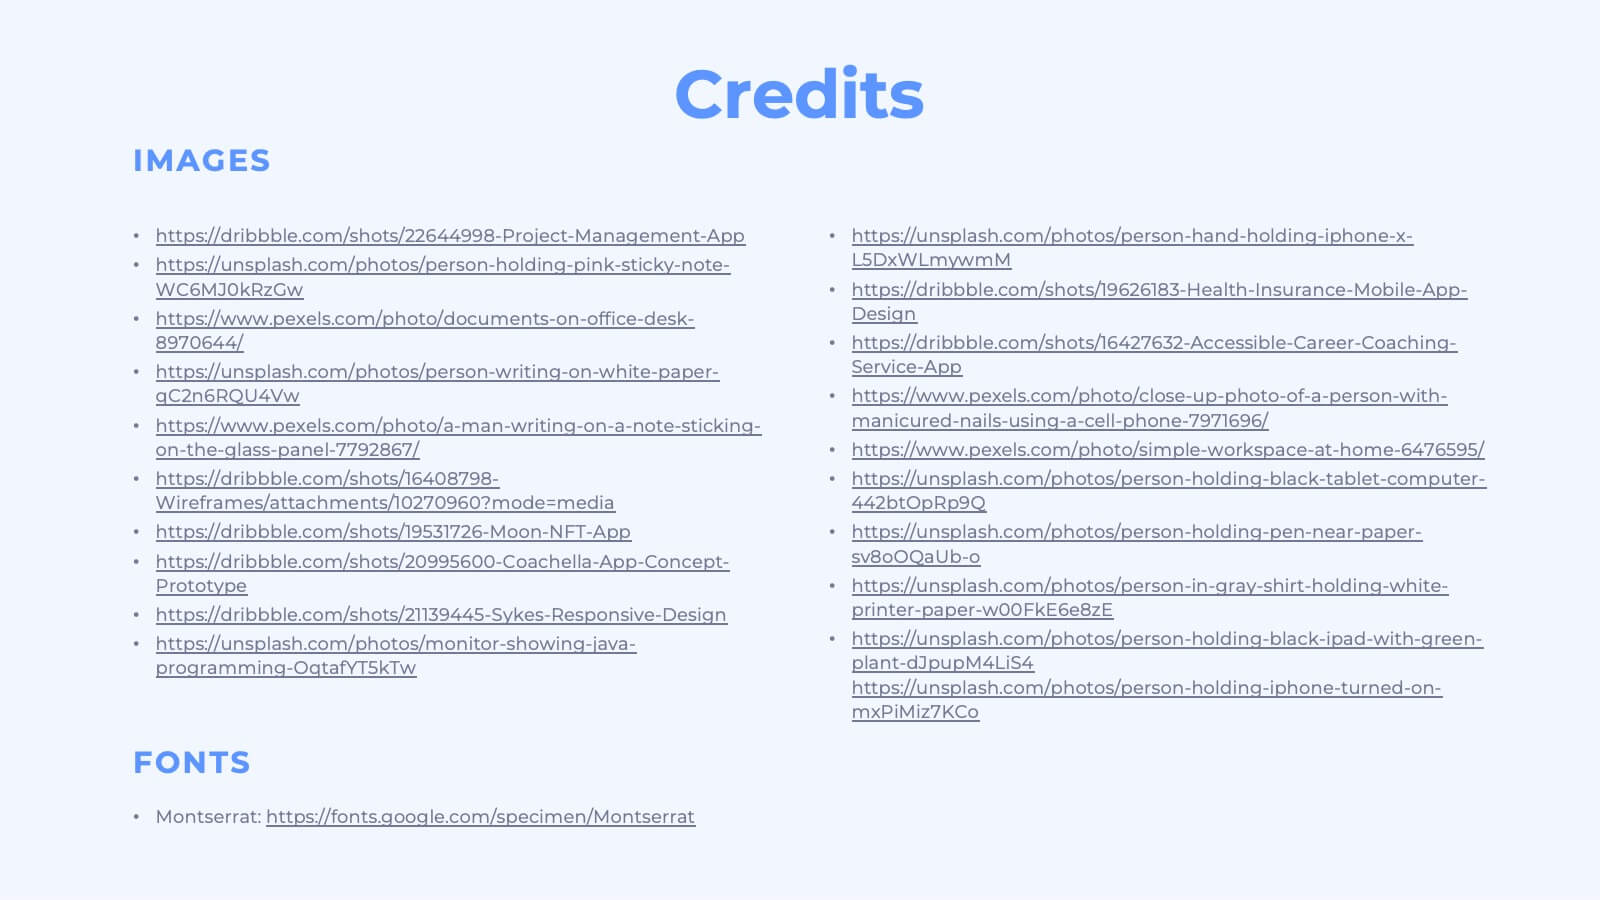
Luster UX Strategy Plan Presentation
Enhance user experience with this comprehensive UX strategy template! Perfect for outlining user research, personas, and design principles. Ideal for UX/UI designers aiming to present their strategies effectively. Compatible with PowerPoint, Keynote, and Google Slides, this template ensures your UX presentations are clear, professional, and impactful. Create exceptional user experiences today!


4 diapositivas
US Map with Data Points Presentation
Bring your data to life with a dynamic nationwide view that makes trends instantly clear. This presentation helps you showcase key metrics, highlight regional insights, and compare results across states using clean, modern data markers. It’s perfect for reports, strategy updates, and analytics. Fully compatible with PowerPoint, Keynote, and Google Slides.


7 diapositivas
McKinsey Business Infographic
The McKinsey 7S Model is a management model developed by consulting company McKinsey & Company. This infographic template offers a framework to analyze and align various internal aspects of an organization to ensure its success and effectiveness. Compatible with Powerpoint, Keynote, and Google Slides. Customize the content, design, and visuals to craft an engaging and informative infographic that showcases McKinsey & Company's global impact and expertise in transforming businesses. This business infographic should serve as a snapshot of McKinsey's core strengths and values.


6 diapositivas
30 60 90 Manager Infographic
A 30-60-90 day plan outlines an individual's goals and tasks for the first three months of a new job, project, or role. This infographic template outlines the goals and tasks a manager plans to achieve during the first 30, 60, and 90 days of their role. This is a helpful tool to communicate objectives and strategy to your team. Design the infographic so that it's easy to share. The 30-60-90 Manager Infographic serves as a roadmap for the manager's initial months and provides transparency to their team about their goals and priorities. Use a consistent color scheme that aligns with your company's branding.


6 diapositivas
Ecommerce KPI Dashboards Infographic
Elevate your eCommerce reporting with our comprehensive KPI Dashboard Infographics. Tailored for seamless integration with PowerPoint, Google Slides, and Keynote, this template offers a clear and colorful representation of key performance indicators critical to online business success. From tracking sales growth to monitoring customer engagement metrics, our infographics provide an intuitive layout to display data-driven insights that drive decision-making. This template transforms complex data sets into straightforward visuals, making it easier to communicate progress with your team. Use this template to keep a pulse on your eCommerce performance and narrate the story behind the numbers.