


Características


¿Tienes alguna pregunta?
Recomendar


7 diapositivas
Lifecycle Stages in Customer Experience Presentation
Showcase the full customer journey with this Lifecycle Stages in Customer Experience presentation. Featuring a sleek infinity loop layout, this slide is ideal for visualizing cyclical engagement stages—like acquisition, onboarding, retention, and advocacy. Clean design and labeled touchpoints help convey insights clearly. Fully compatible with PowerPoint, Canva, and Google Slides.


6 diapositivas
Target Market Breakdown Presentation
Turn audience data into a visual story with a clean, layered design that highlights market potential and audience segmentation. Perfect for startups and marketing teams, this layout simplifies complex data for impactful communication. Fully compatible with PowerPoint, Keynote, and Google Slides for seamless editing and professional presentation results.


21 diapositivas
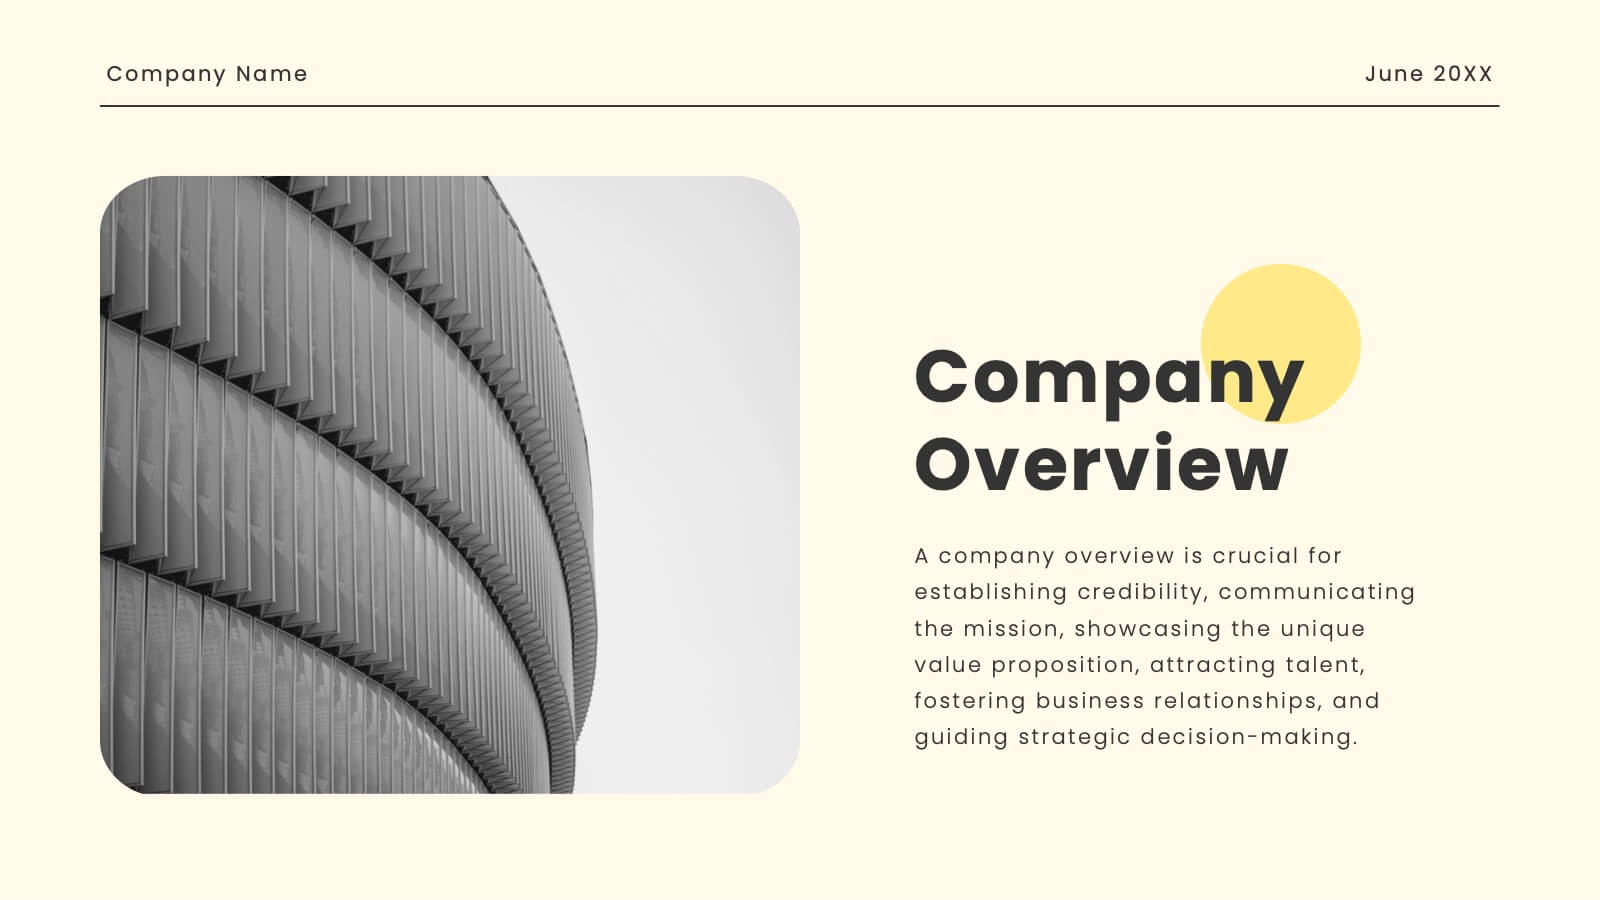
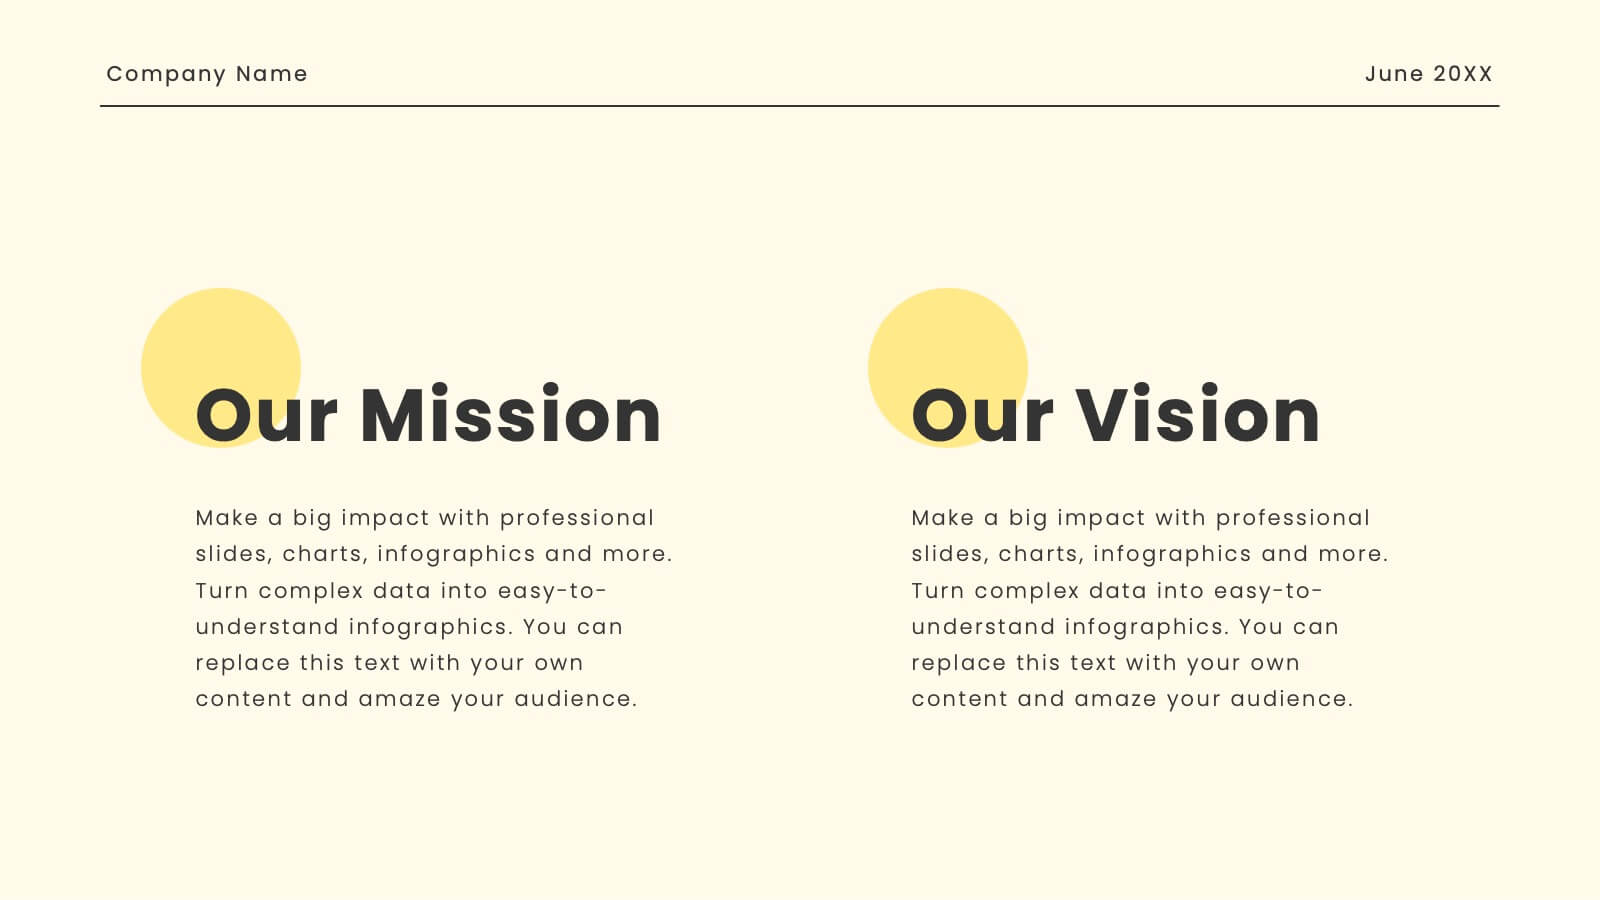
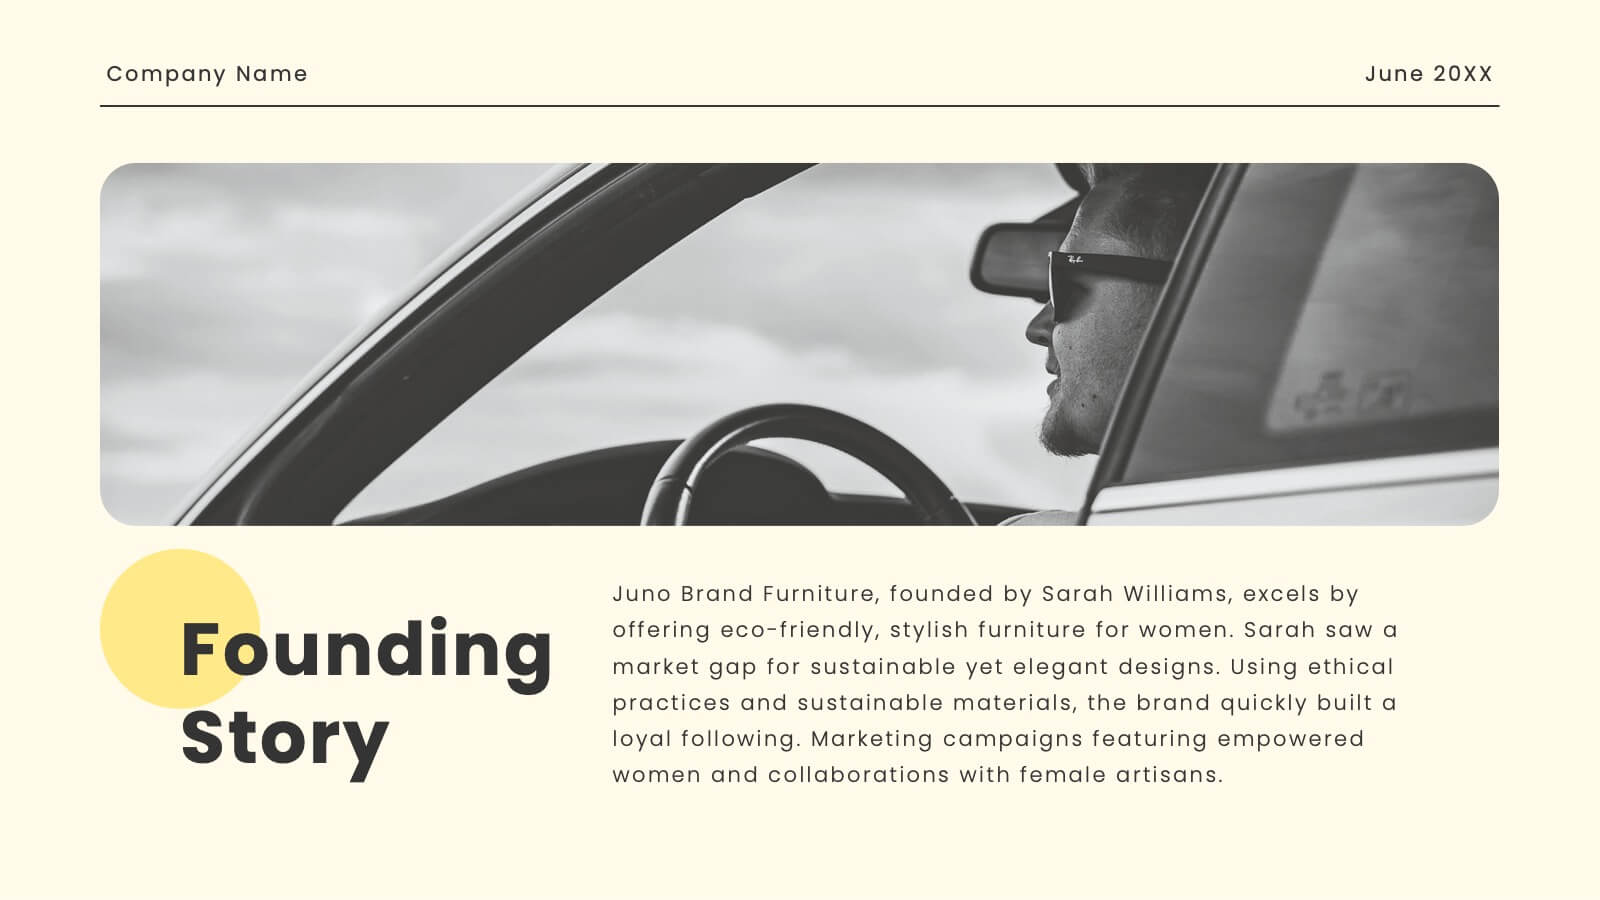
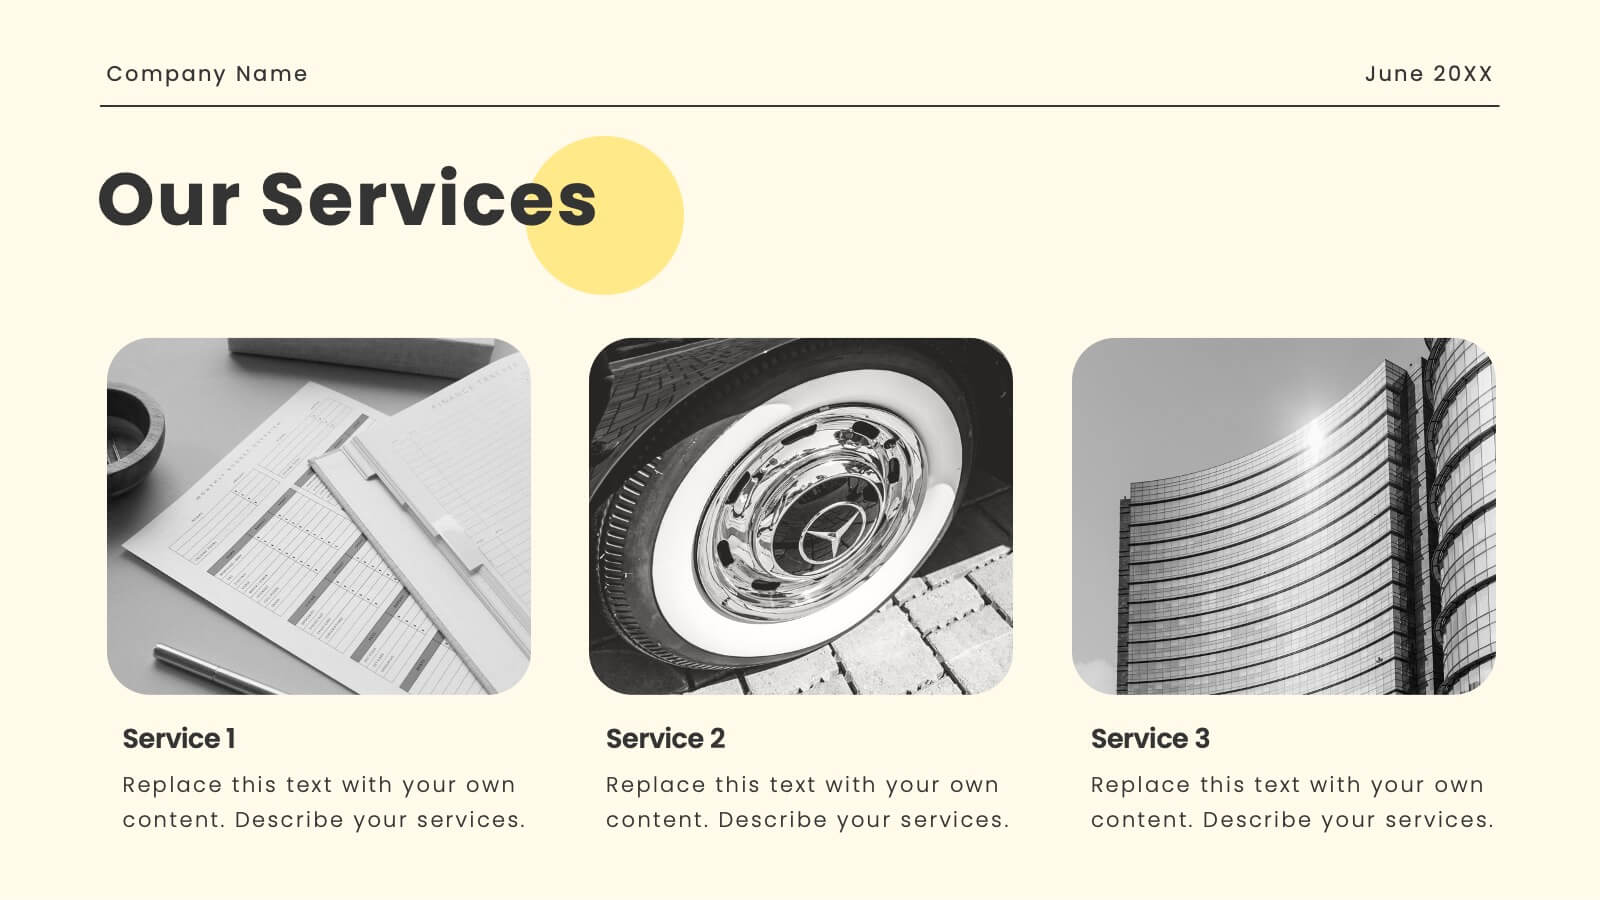
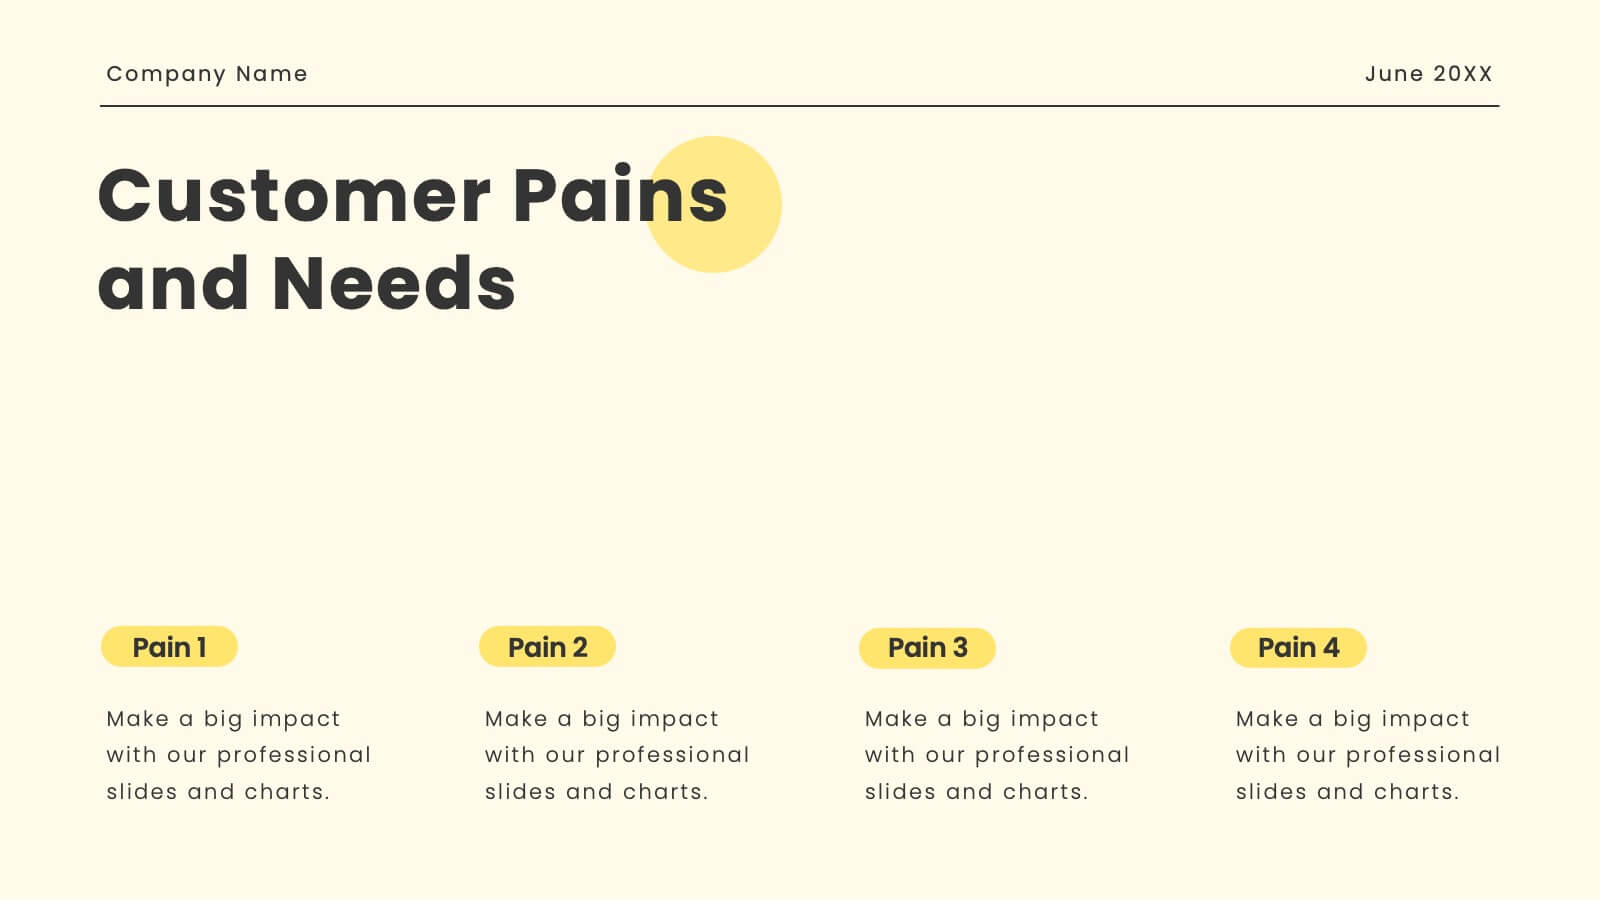
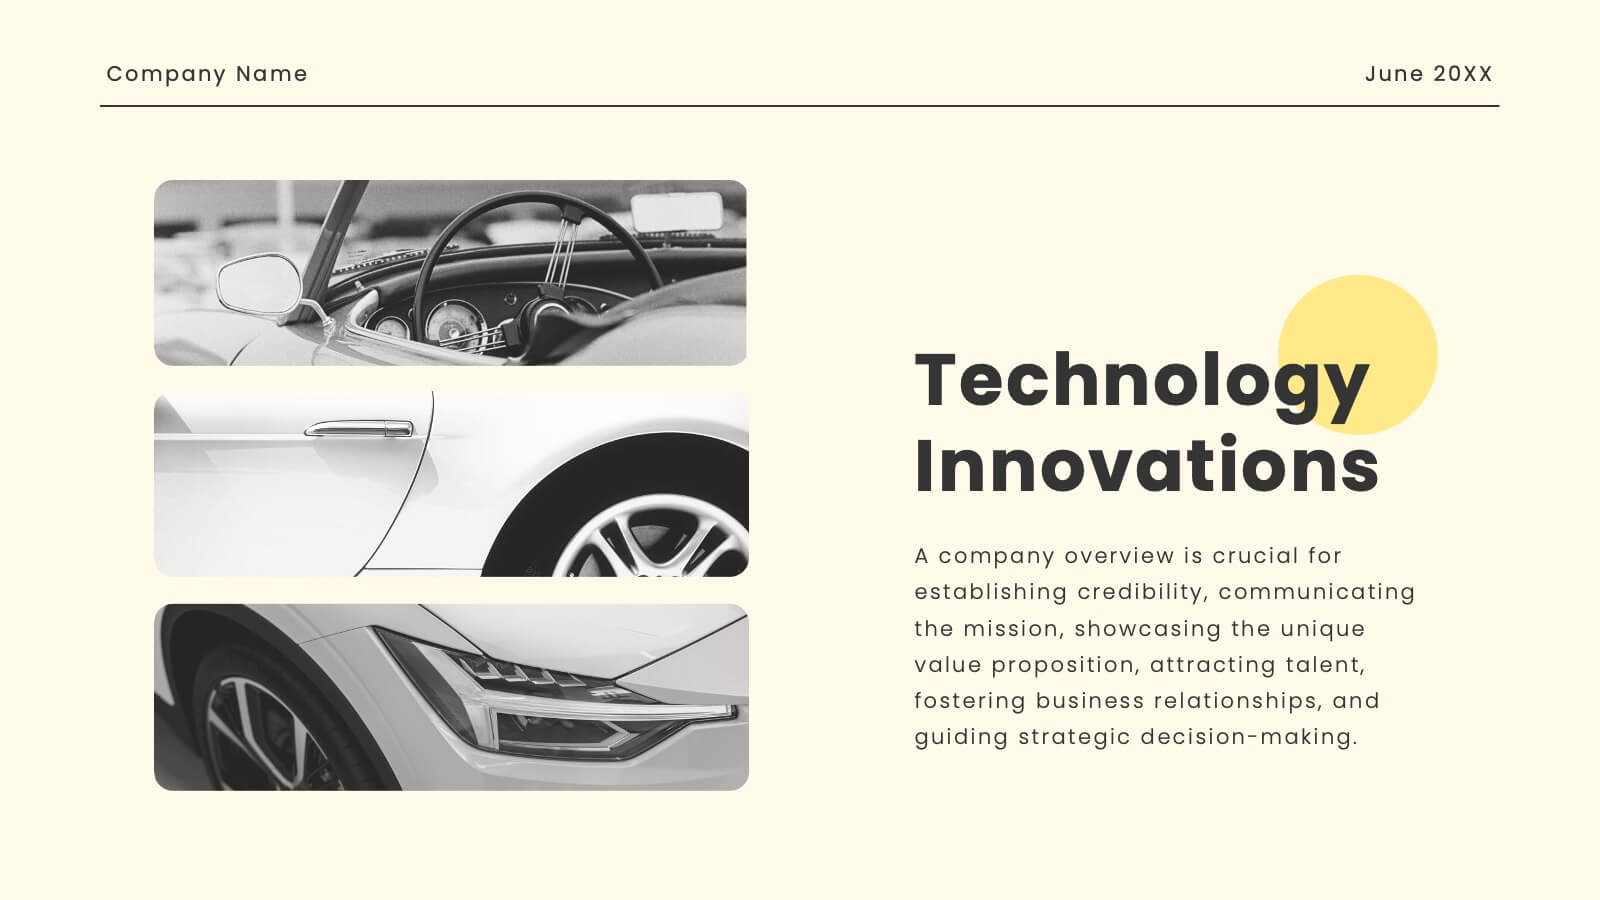
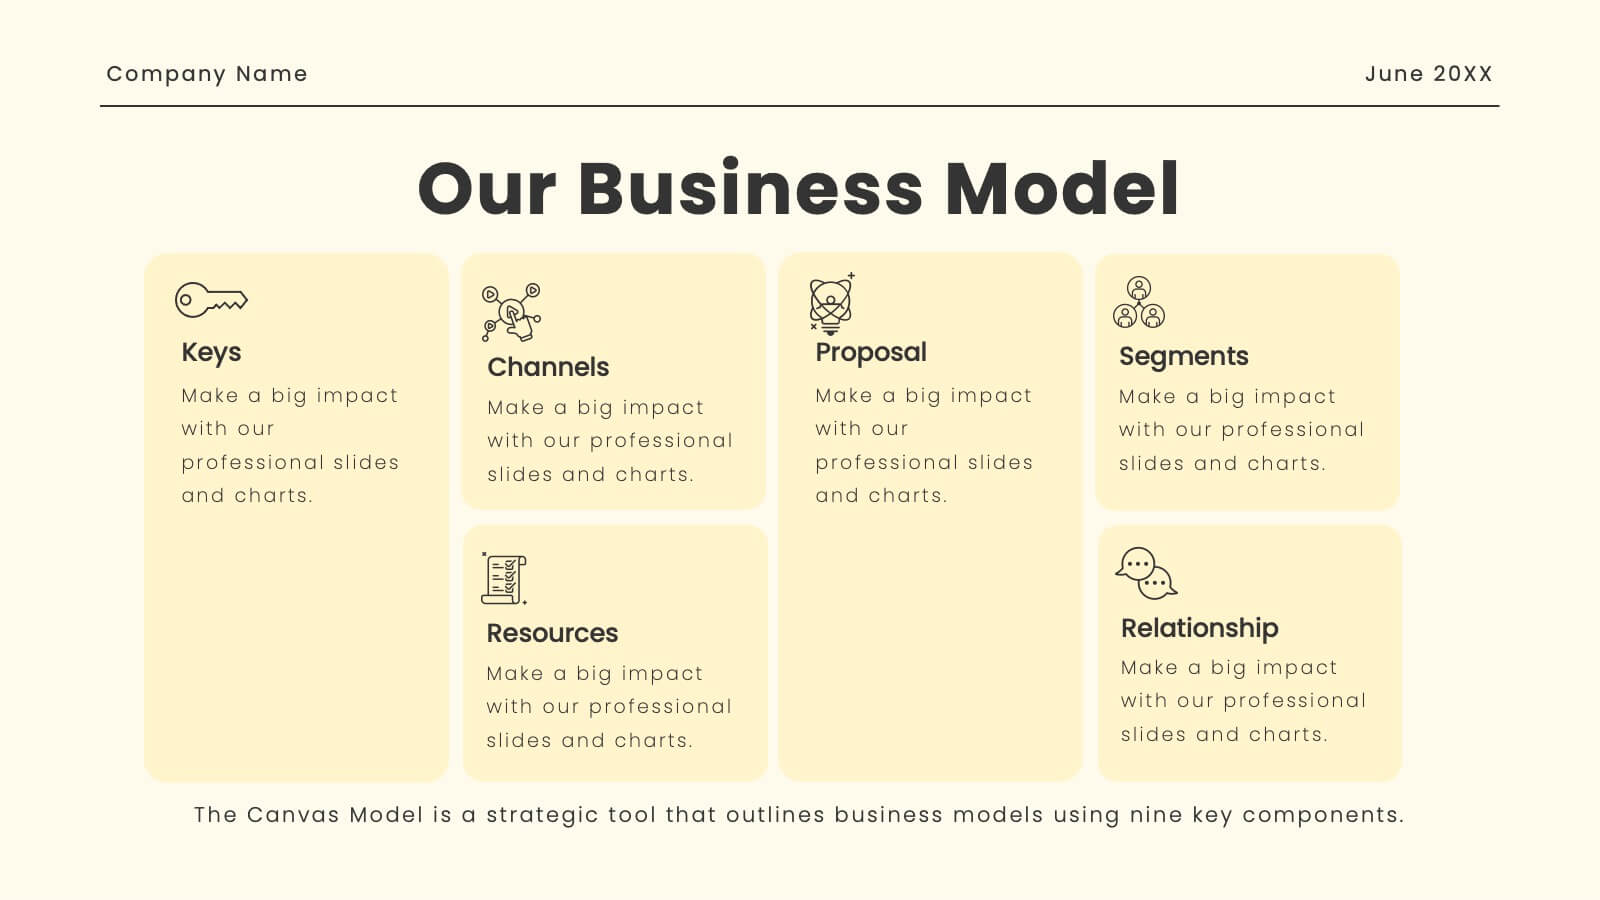
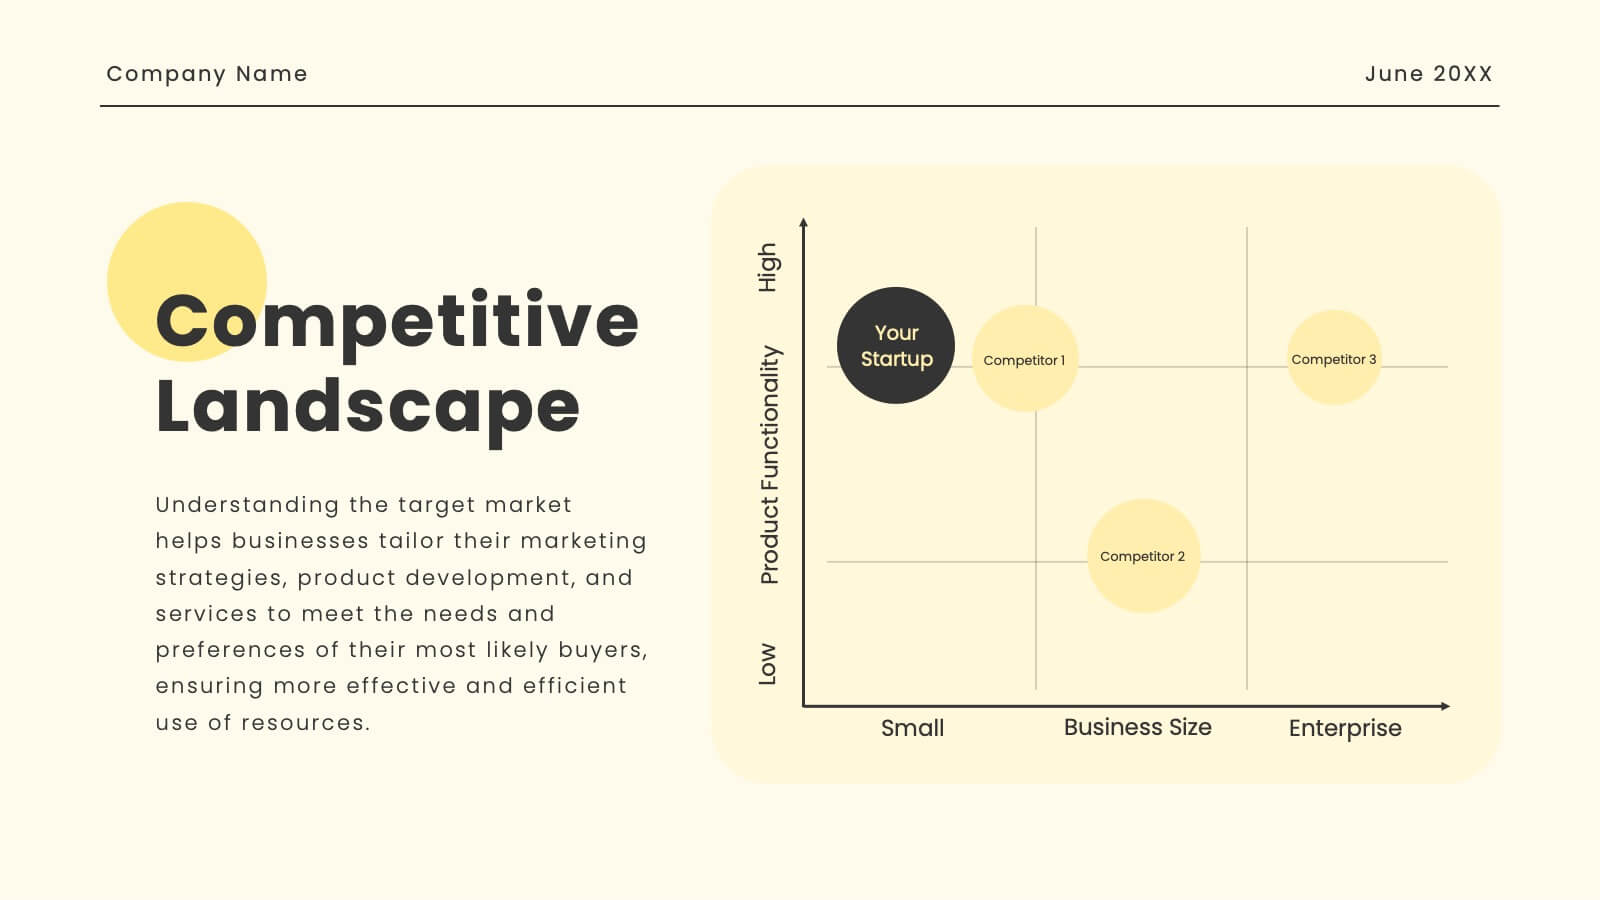
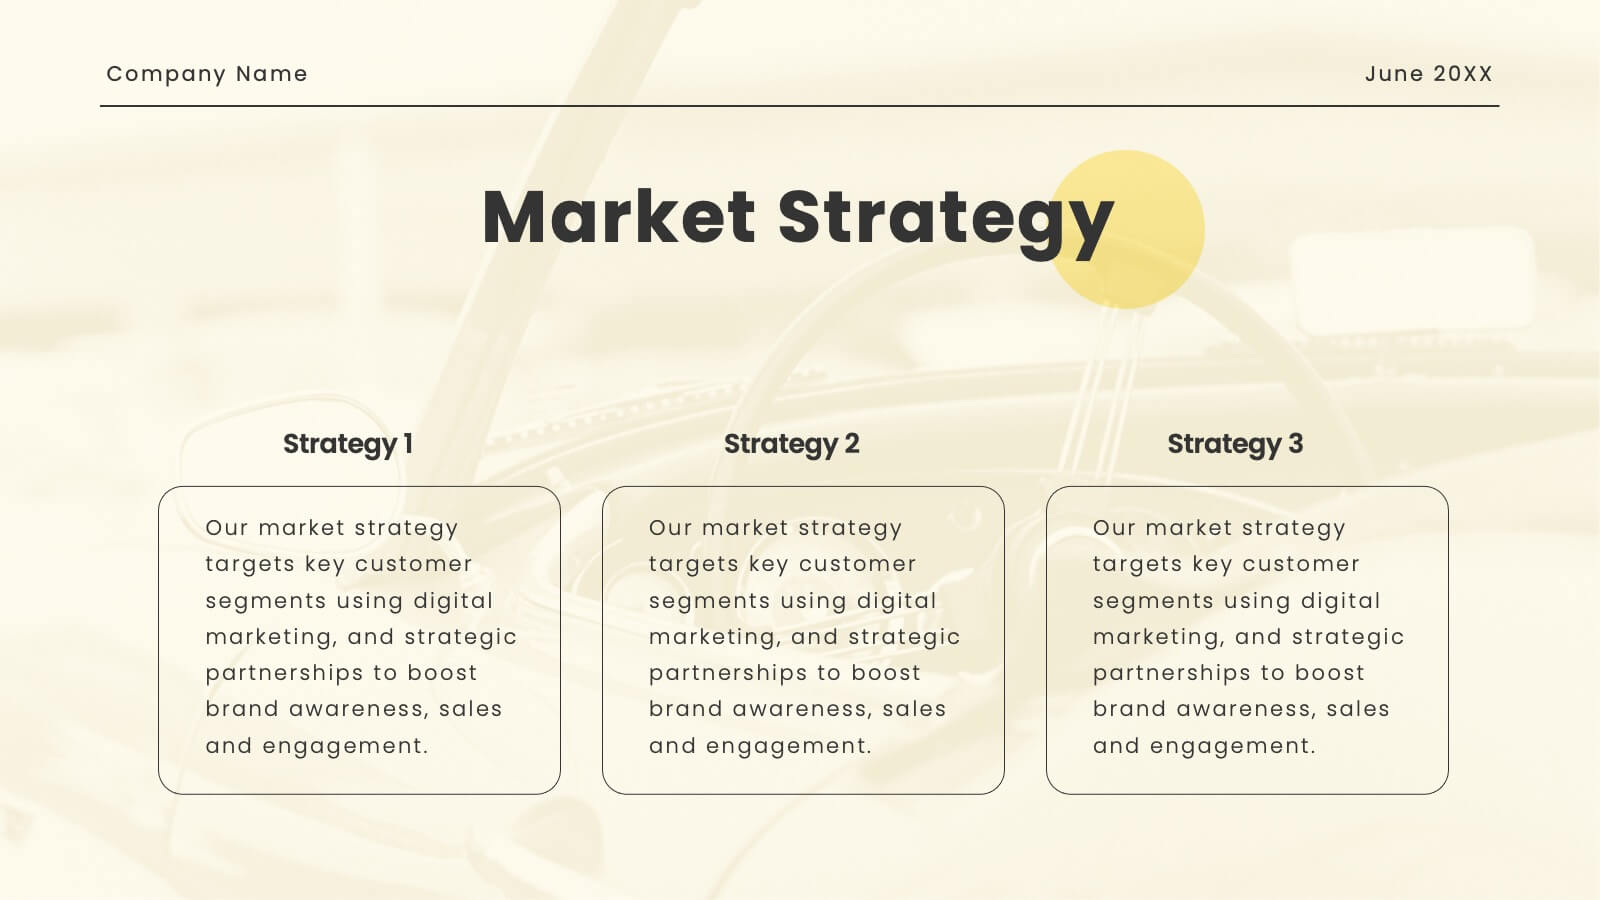
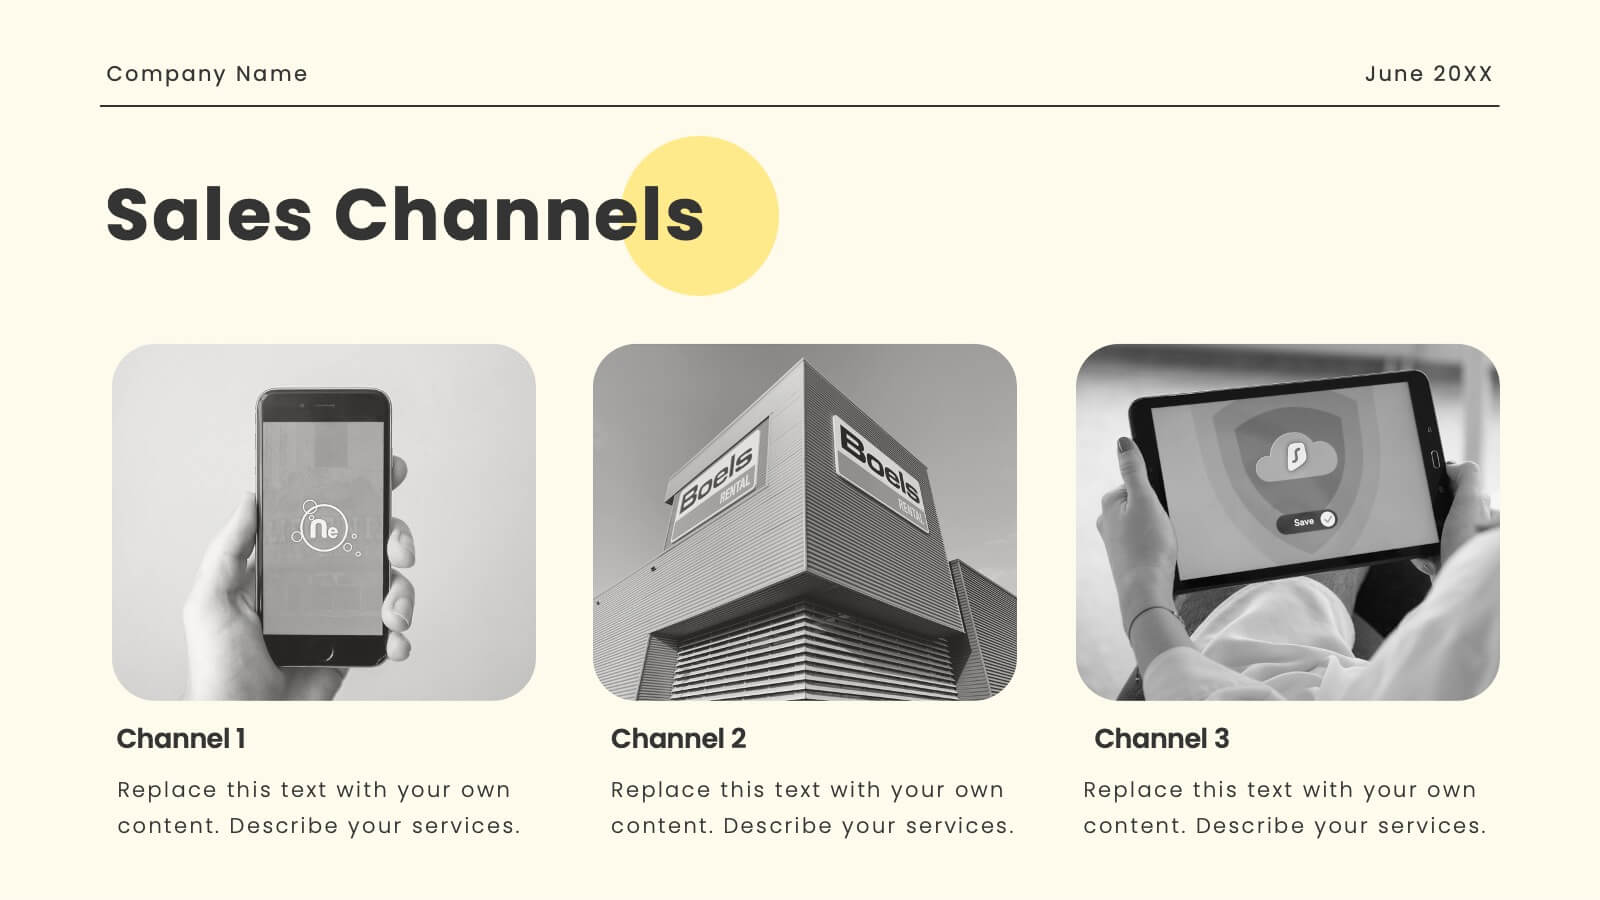
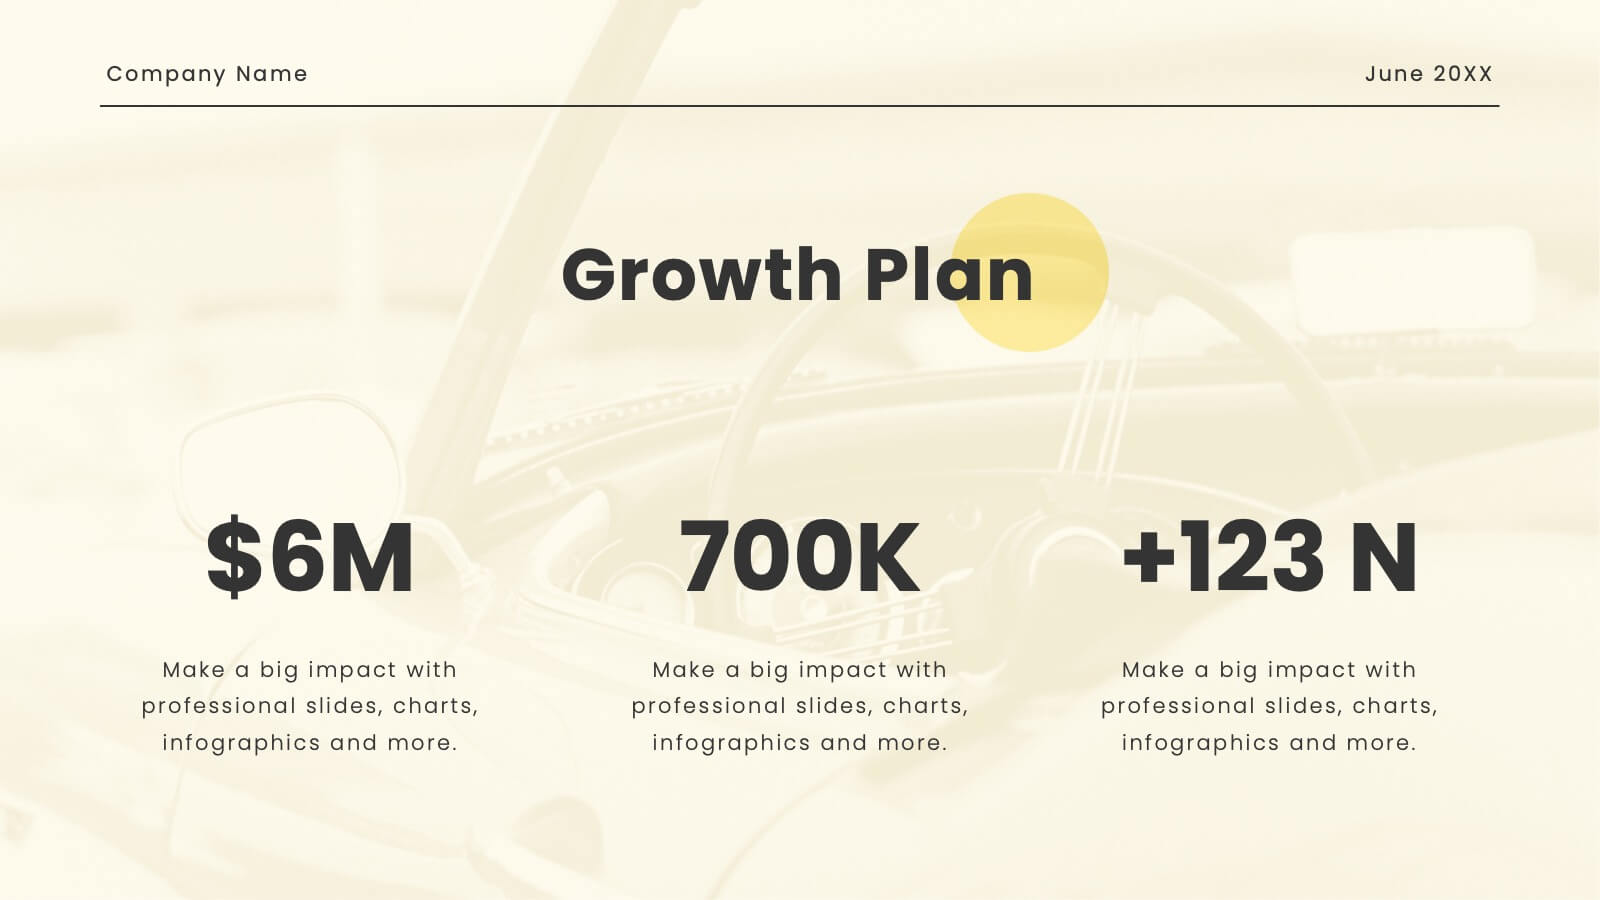
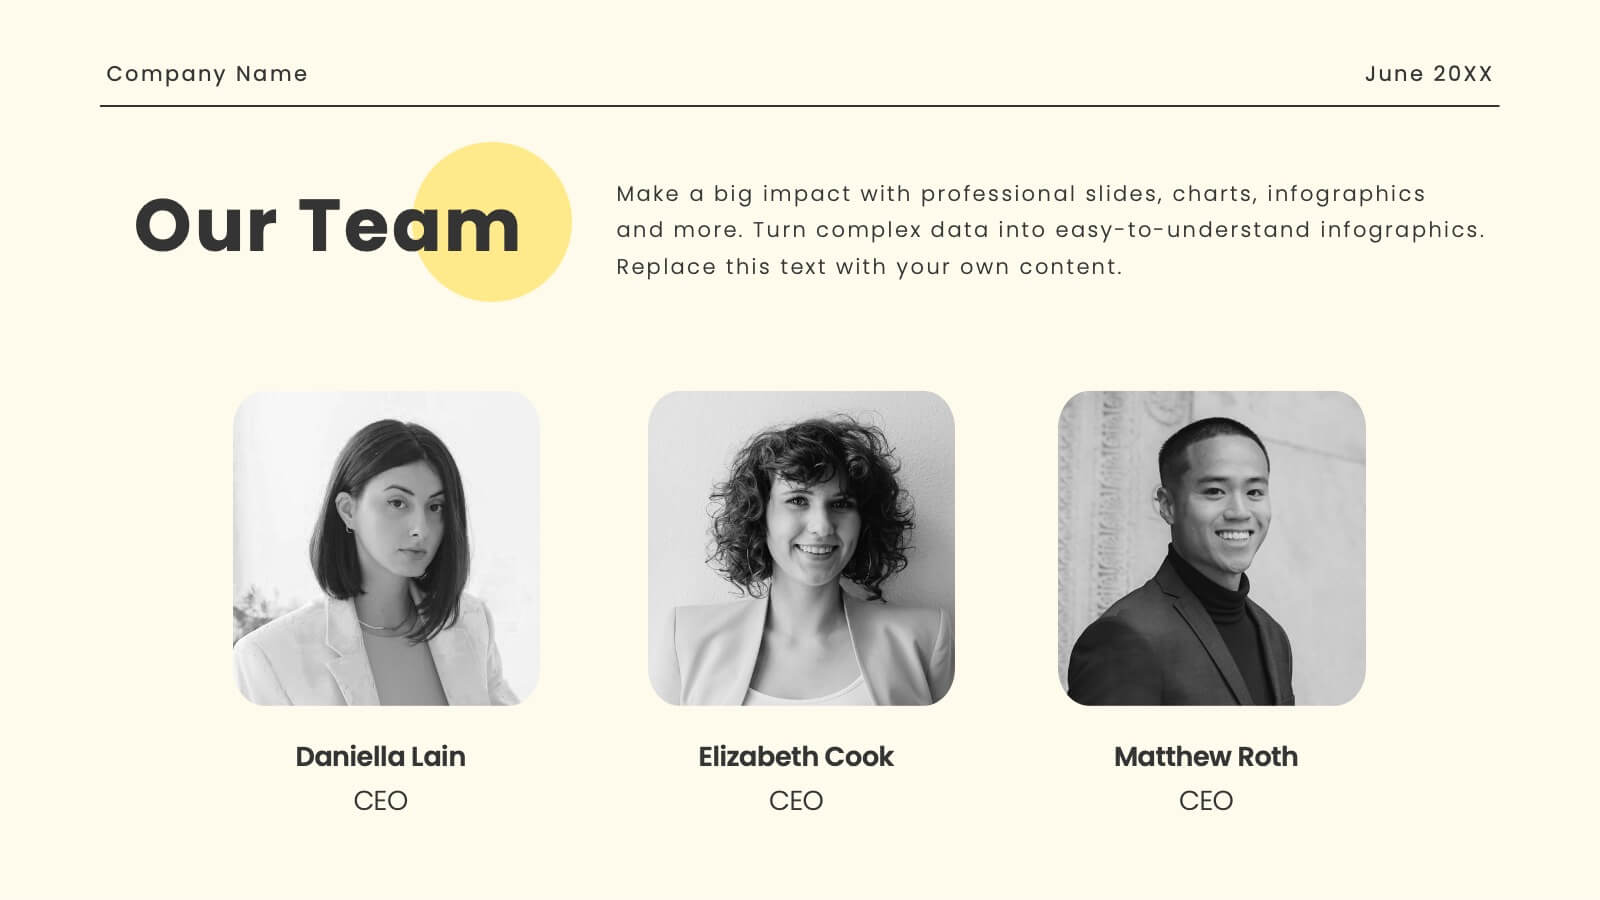
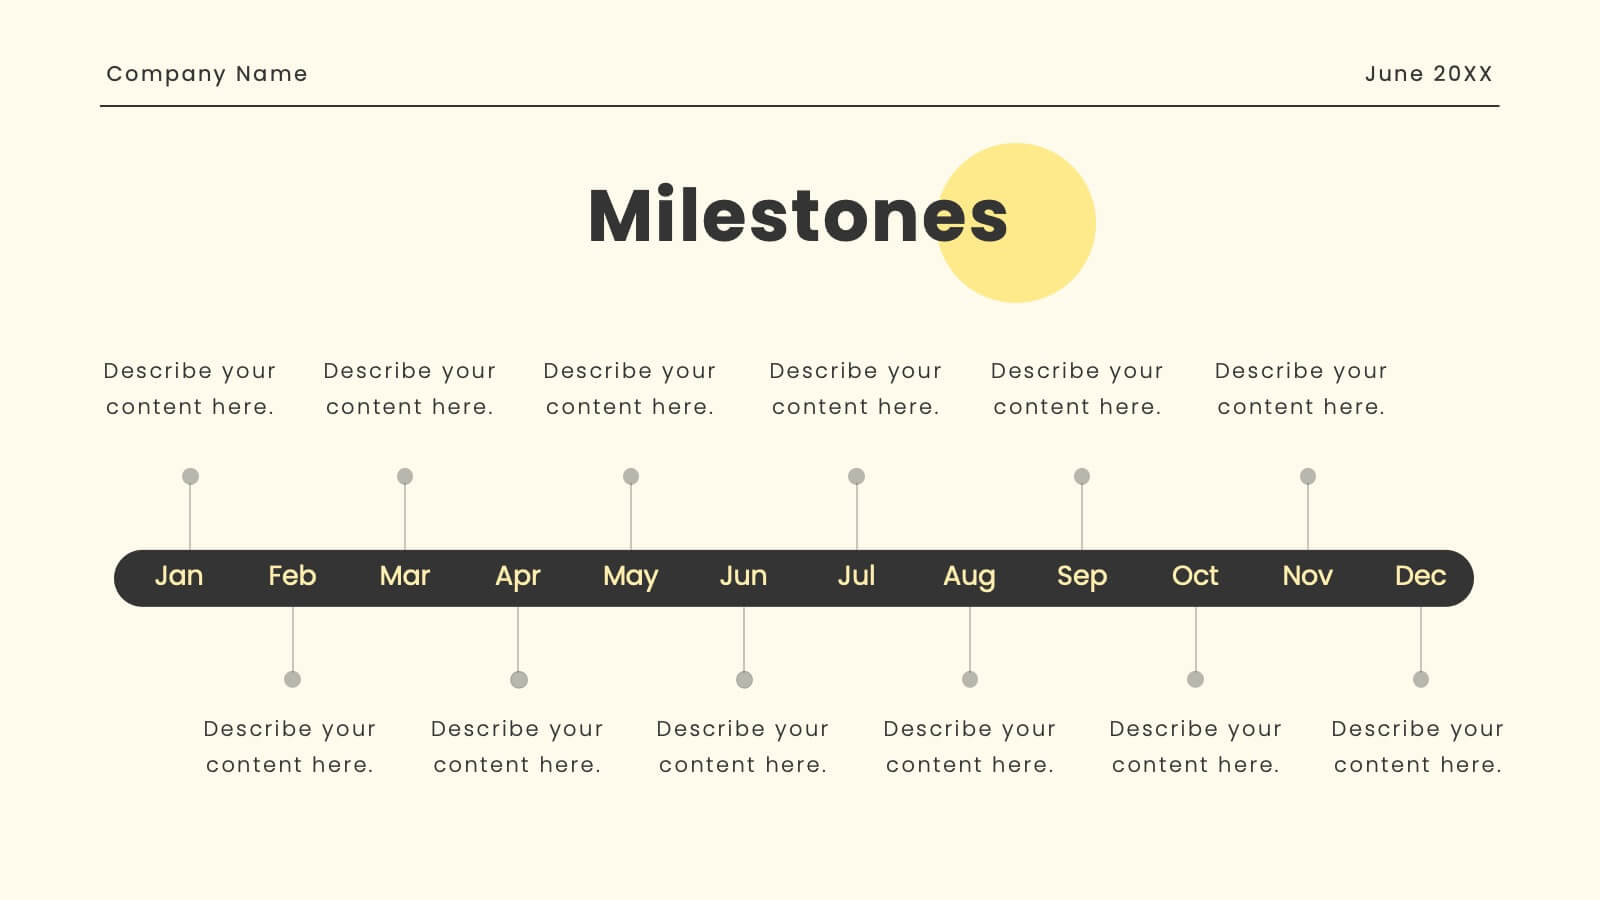
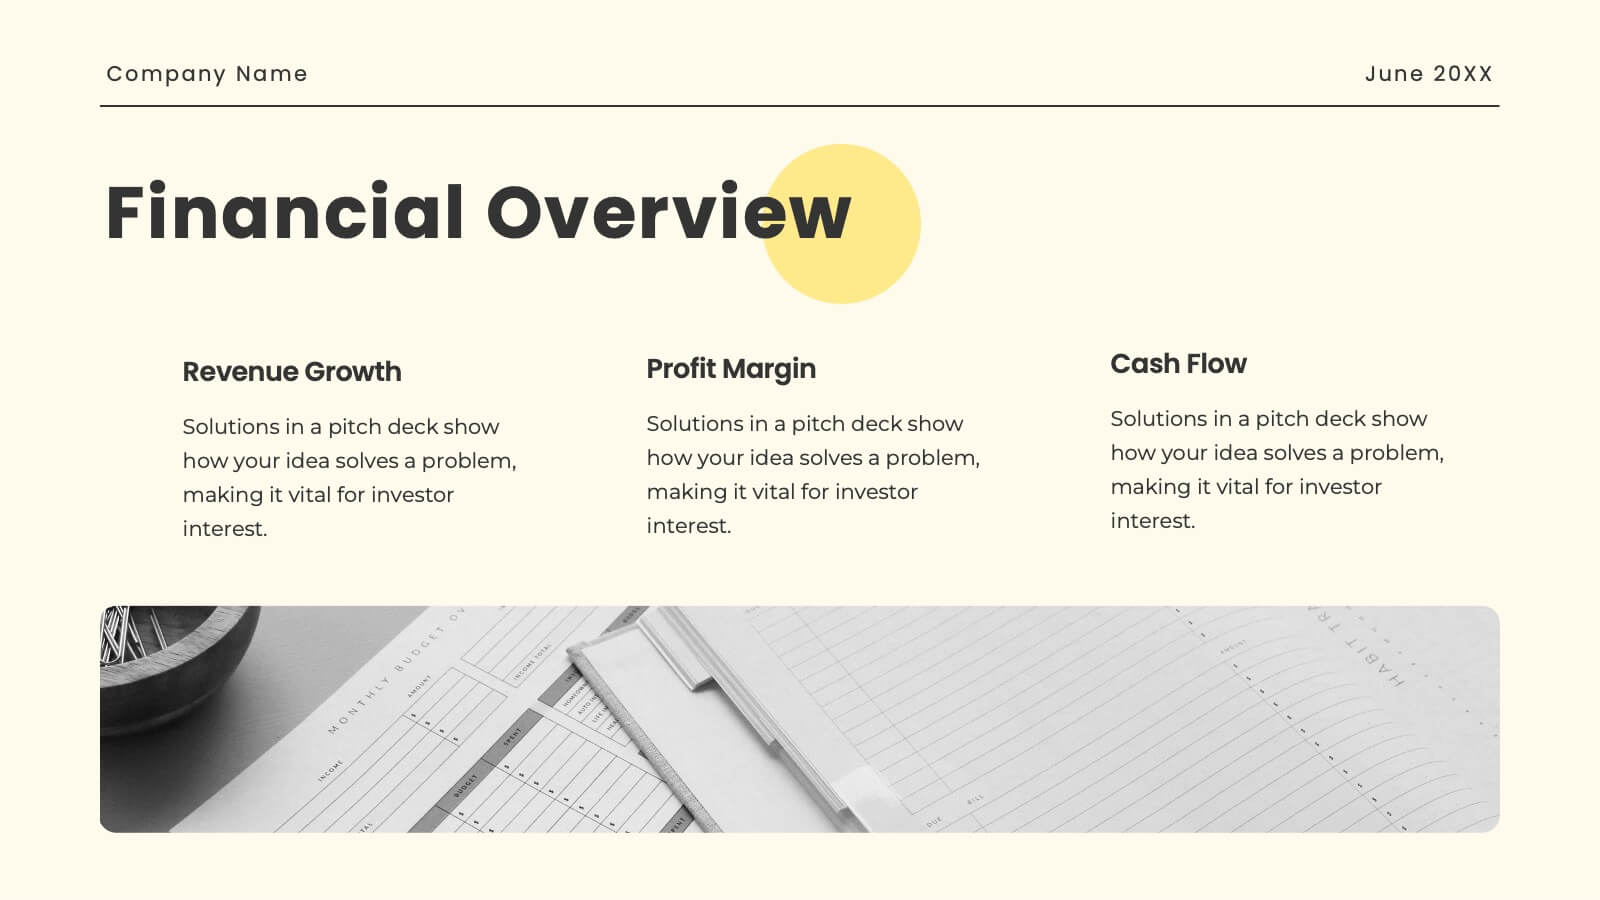
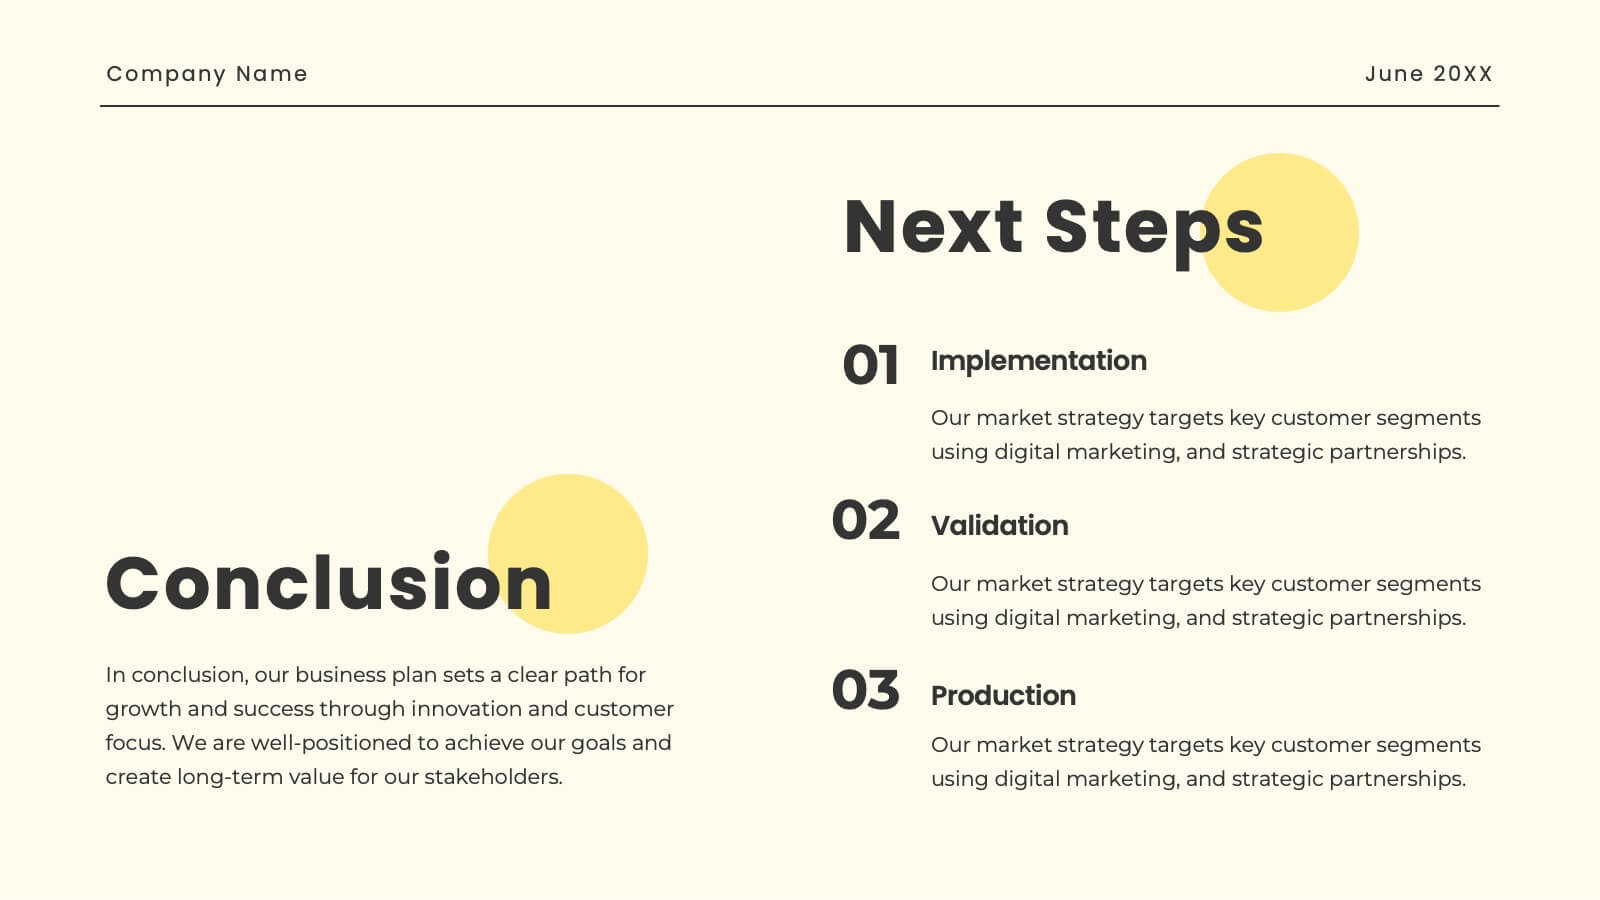
Oasis Startup Business Plan Presentation
Present your corporate business plan with confidence! This template includes sections for company overview, mission, vision, services, target market, and more. Showcase your market strategy, sales channels, growth plan, and financial overview. Perfect for conveying a professional and comprehensive business plan. Compatible with PowerPoint, Keynote, and Google Slides. Impress your audience today!


4 diapositivas
Business Report Conclusion Slide Presentation
Summarize findings with impact using the Business Report Conclusion Slide Presentation. This template provides a structured, four-step layout that helps you clearly present key takeaways, data highlights, or action points. Clean design with icon integration makes it easy to follow. Fully editable and compatible with PowerPoint, Keynote, and Google Slides.


26 diapositivas
Flowers Bold Company Profile Presentation
Step into the enchanting garden of happy flowers, where petals dance and colors sing. Our template, awash in sunlit shades of pink, yellow, orange, and blue, encapsulates the very essence of floral joy. Bursting with vibrant graphics, whimsical icons, and cheerful image placeholders, it's a bouquet of design brilliance. Crafted to perfection for Powerpoint, Keynote, or Google Slides. A delightful pick for florists, garden enthusiasts, event planners, or anyone looking to infuse their presentation with a touch of nature's merriment. Blossom your ideas; let your presentations bloom with happiness.


21 diapositivas
Stellara Content Marketing Pitch Deck Presentation
This Marketing Pitch Deck Presentation is designed to showcase your business strategies with clarity and style. Featuring slides for company history, market presence, financial highlights, and growth plans, it's perfect for startups and agencies. Fully editable and compatible with PowerPoint, Keynote, and Google Slides.


22 diapositivas
Transmuton Creative Agency Pitch Deck Presentation
Showcase your agency’s creativity and expertise with this bold and modern pitch deck presentation. Covering key areas like campaign execution, strategy development, client success stories, and market analysis, this template helps you present a compelling vision. Fully customizable and compatible with PowerPoint, Keynote, and Google Slides for a seamless presentation experience.


26 diapositivas
Briarfall Rebranding Project Plan Presentation
This Brand Presentation Template offers a modern and structured approach to showcasing your brand identity, values, and strategic direction. Covering essential elements like audience personas, brand positioning, touchpoints, and performance metrics, it's fully customizable and perfect for businesses looking to strengthen their brand presence. Compatible with PowerPoint, Keynote, and Google Slides.


7 diapositivas
Data Analysis Research Infographic
A Data Analysis Research infographic is a visual representation of the key findings of a research study that used data analysis techniques. The purpose of this template is to provide a clear summary of the research study's most important results, making it easier for your viewers to understand and interpret the findings. This infographic include visualizations such as charts, graphs, icons, and tables that present key data points in a visually compelling way. This template is designed to highlight differences between groups or subgroups, or show how various factors are related to one another.


5 diapositivas
Business Strategy Decision Tree Presentation
Streamline your strategic decisions with this Business Strategy Decision Tree template. Designed to visually map out options, outcomes, and key choices, this slide is perfect for business analysts, consultants, and executives. Featuring hierarchical branching with clear icons and customizable sections, it helps illustrate strategic planning, problem-solving, and risk assessment. Fully compatible with PowerPoint, Keynote, and Google Slides for seamless presentation integration.


24 diapositivas
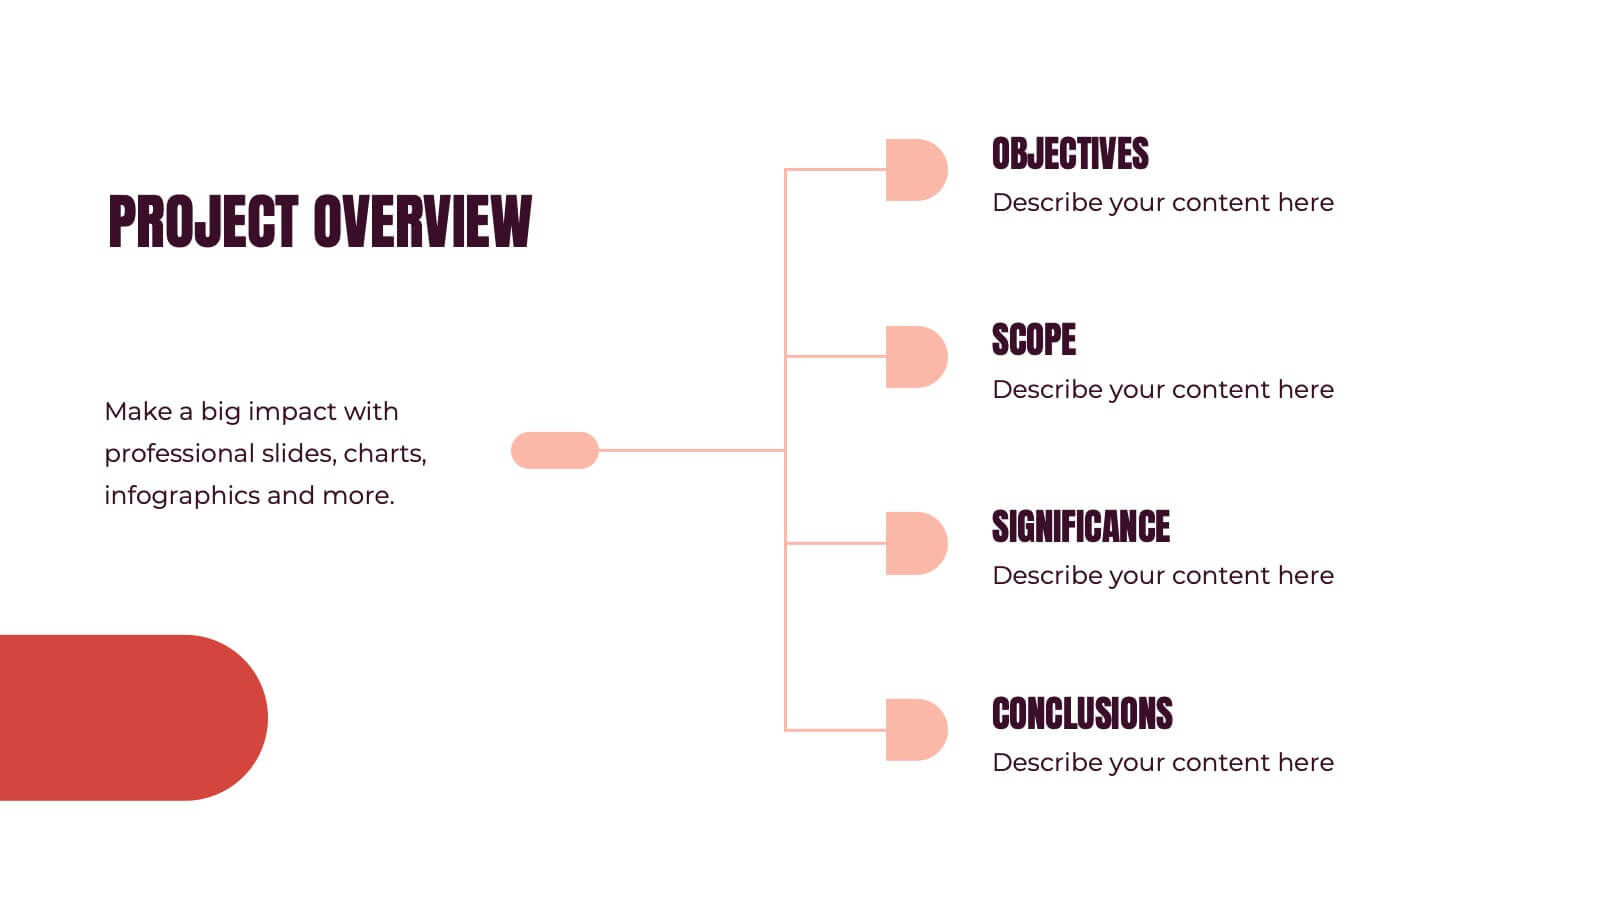
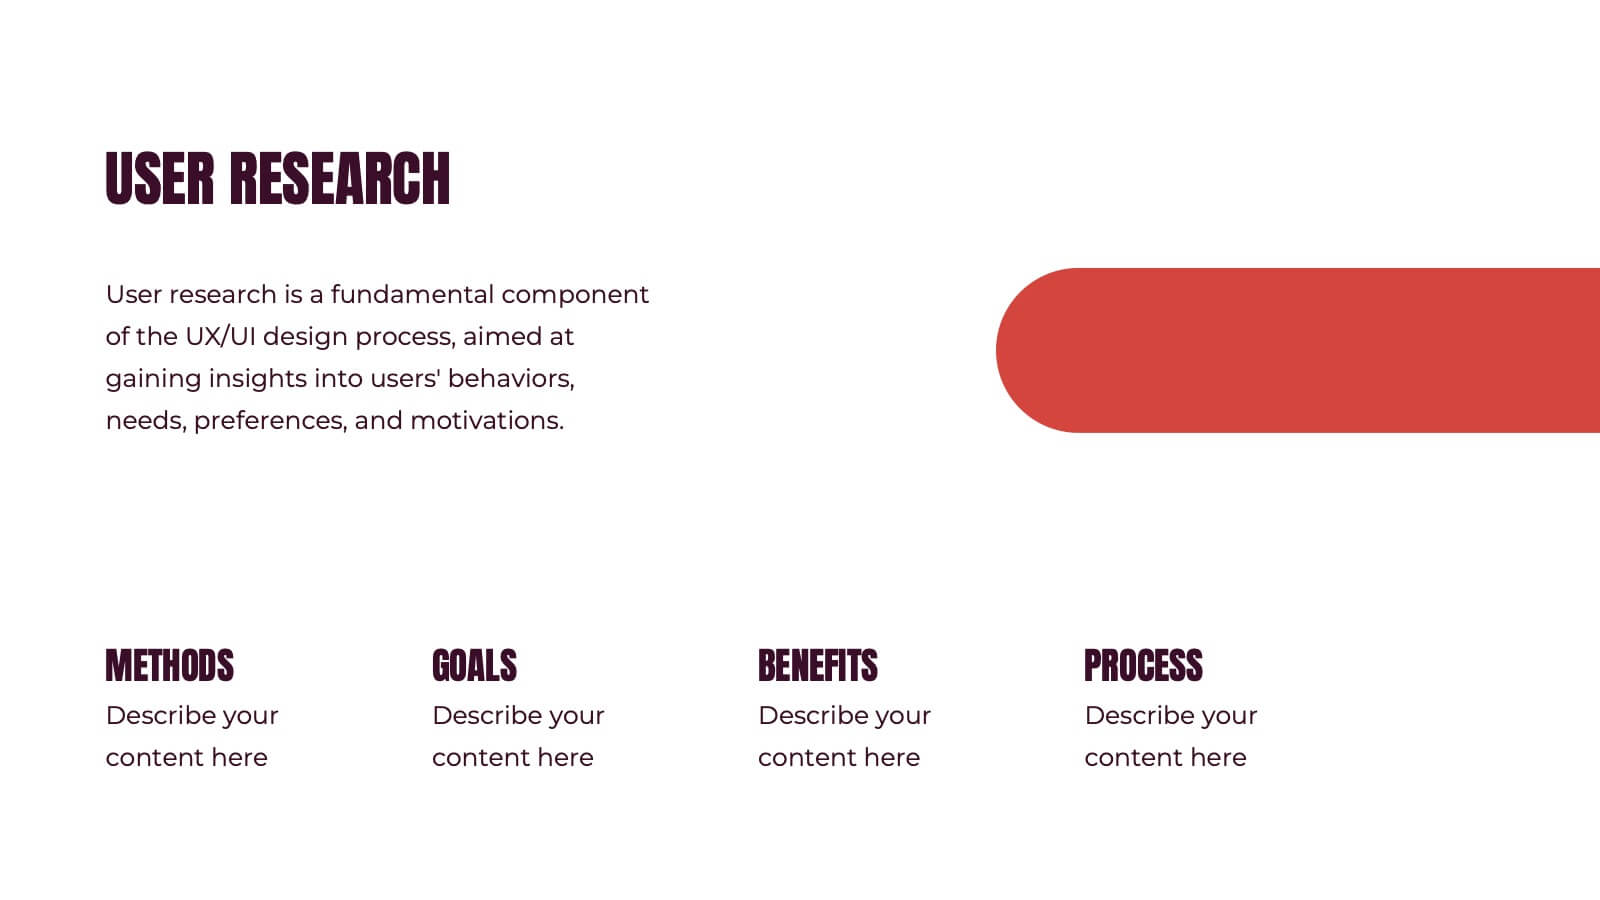
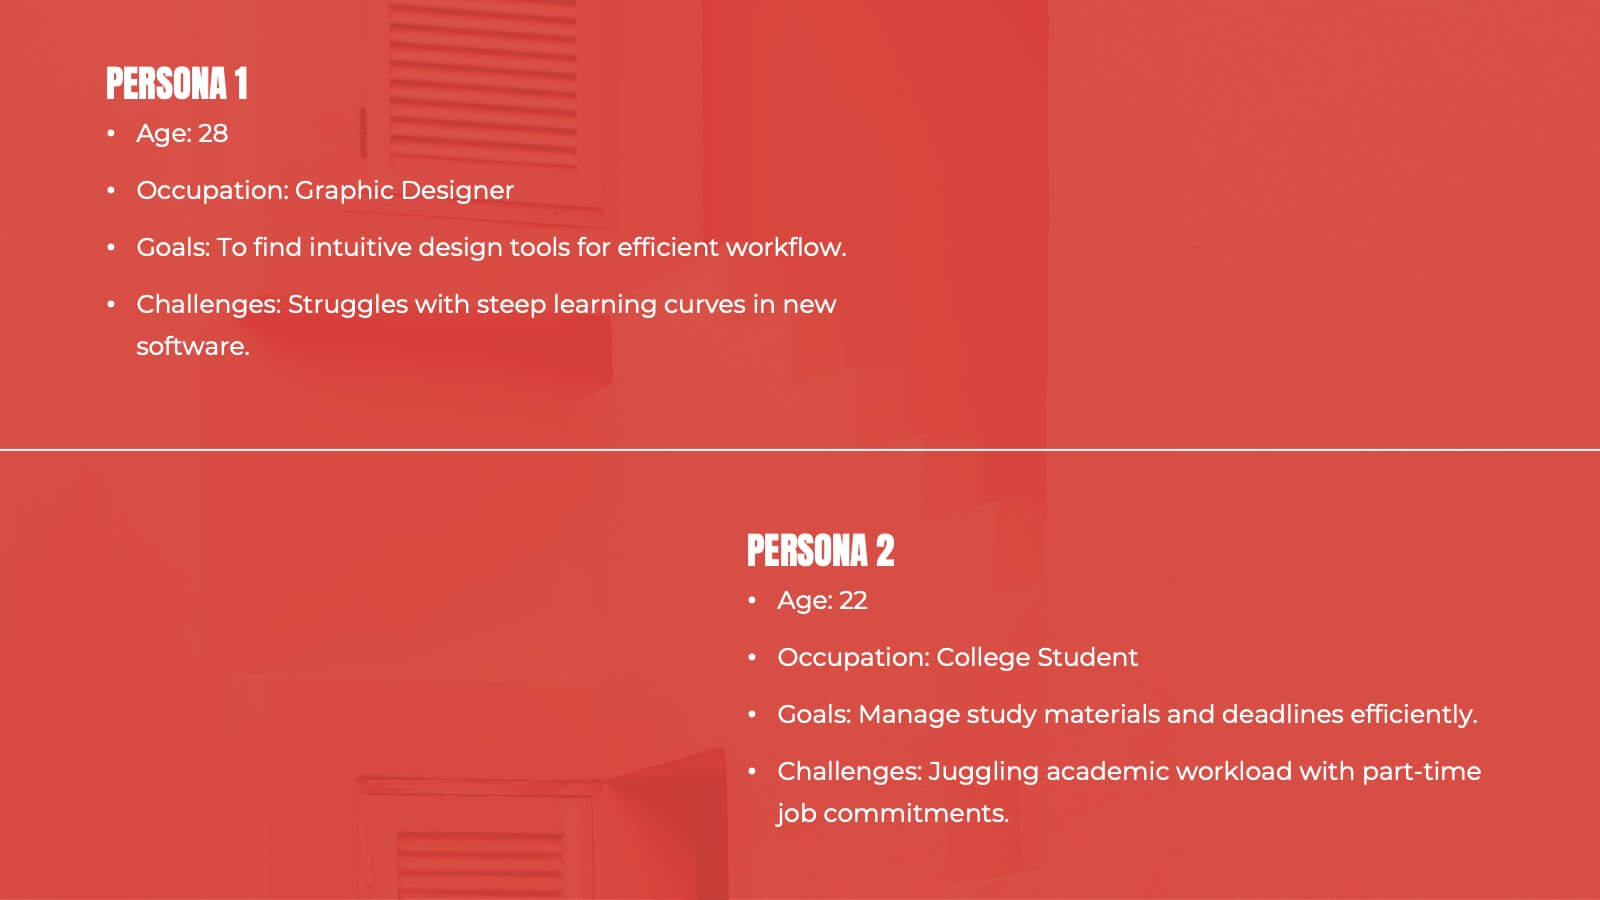
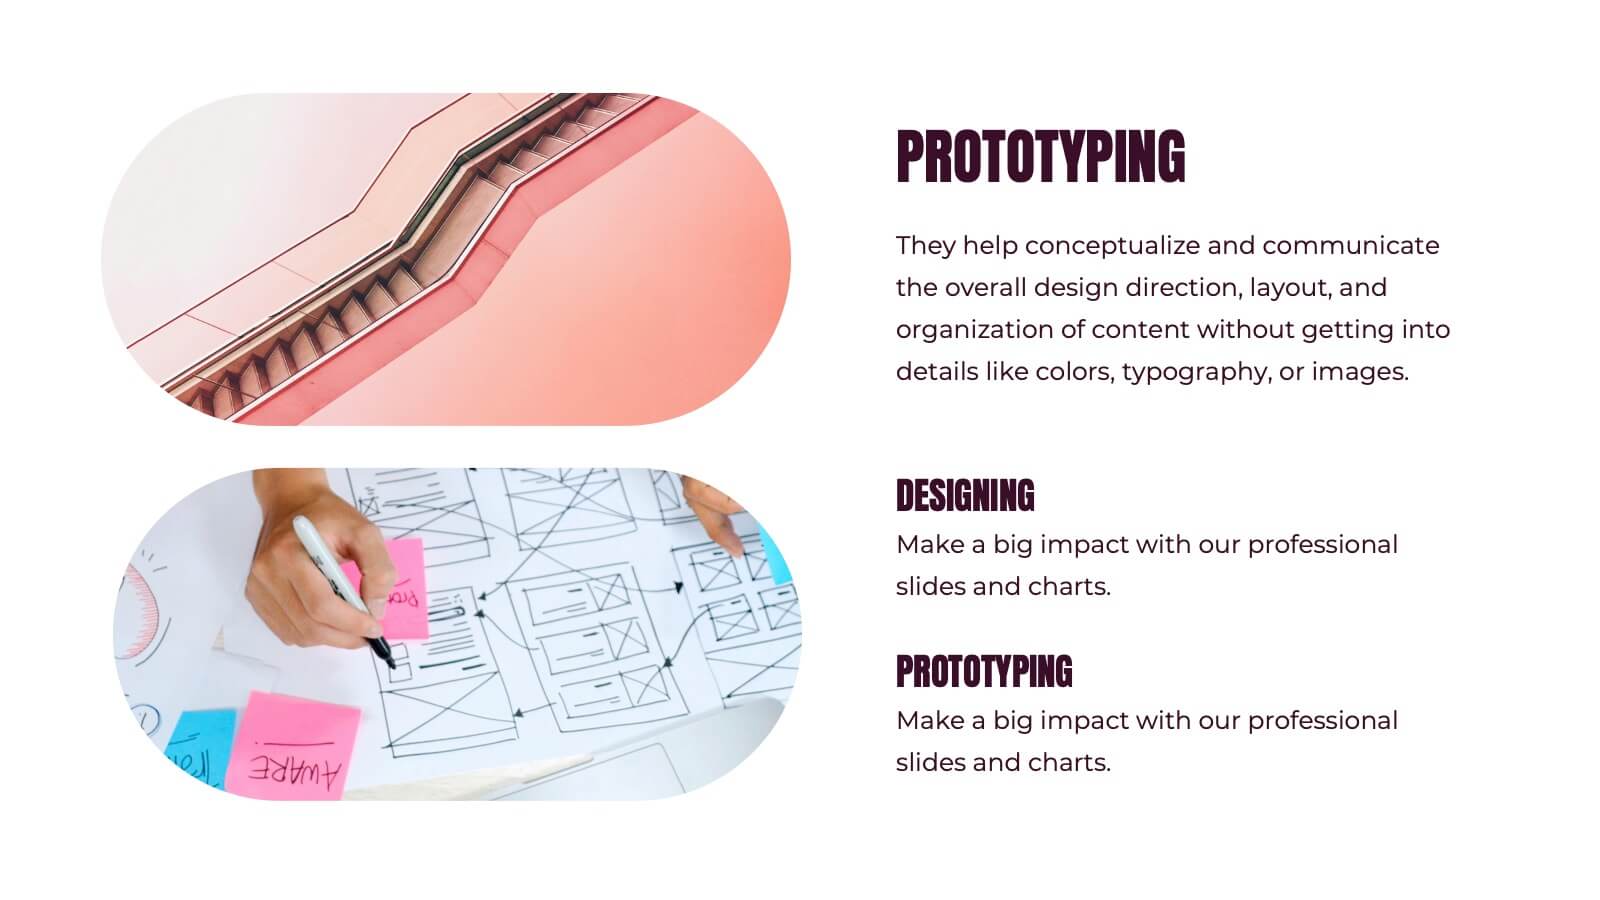
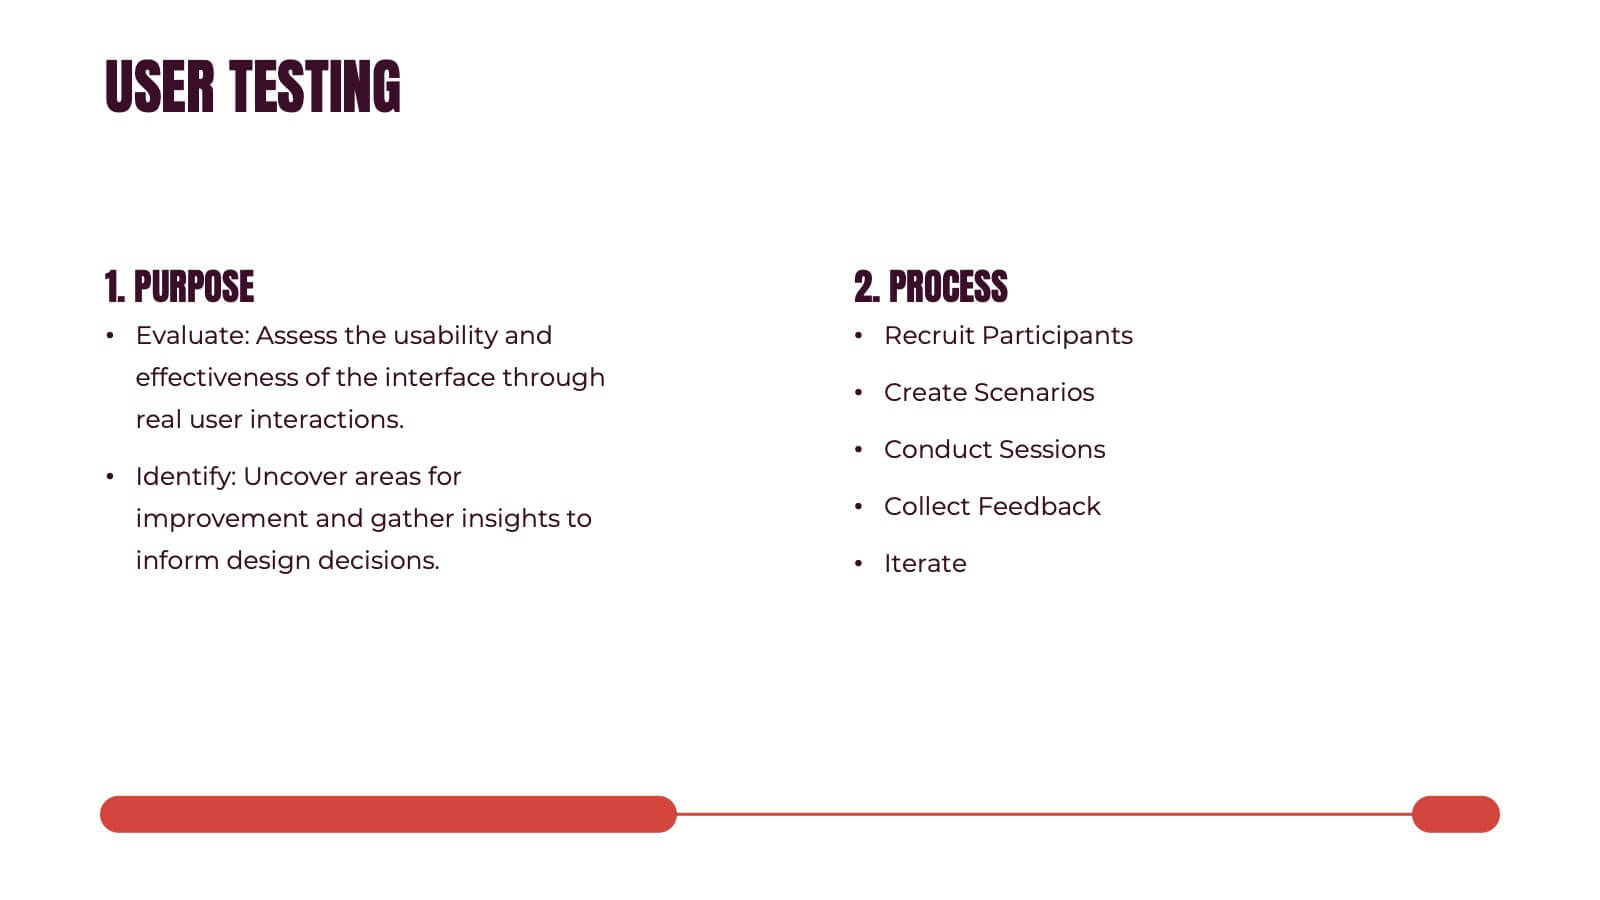
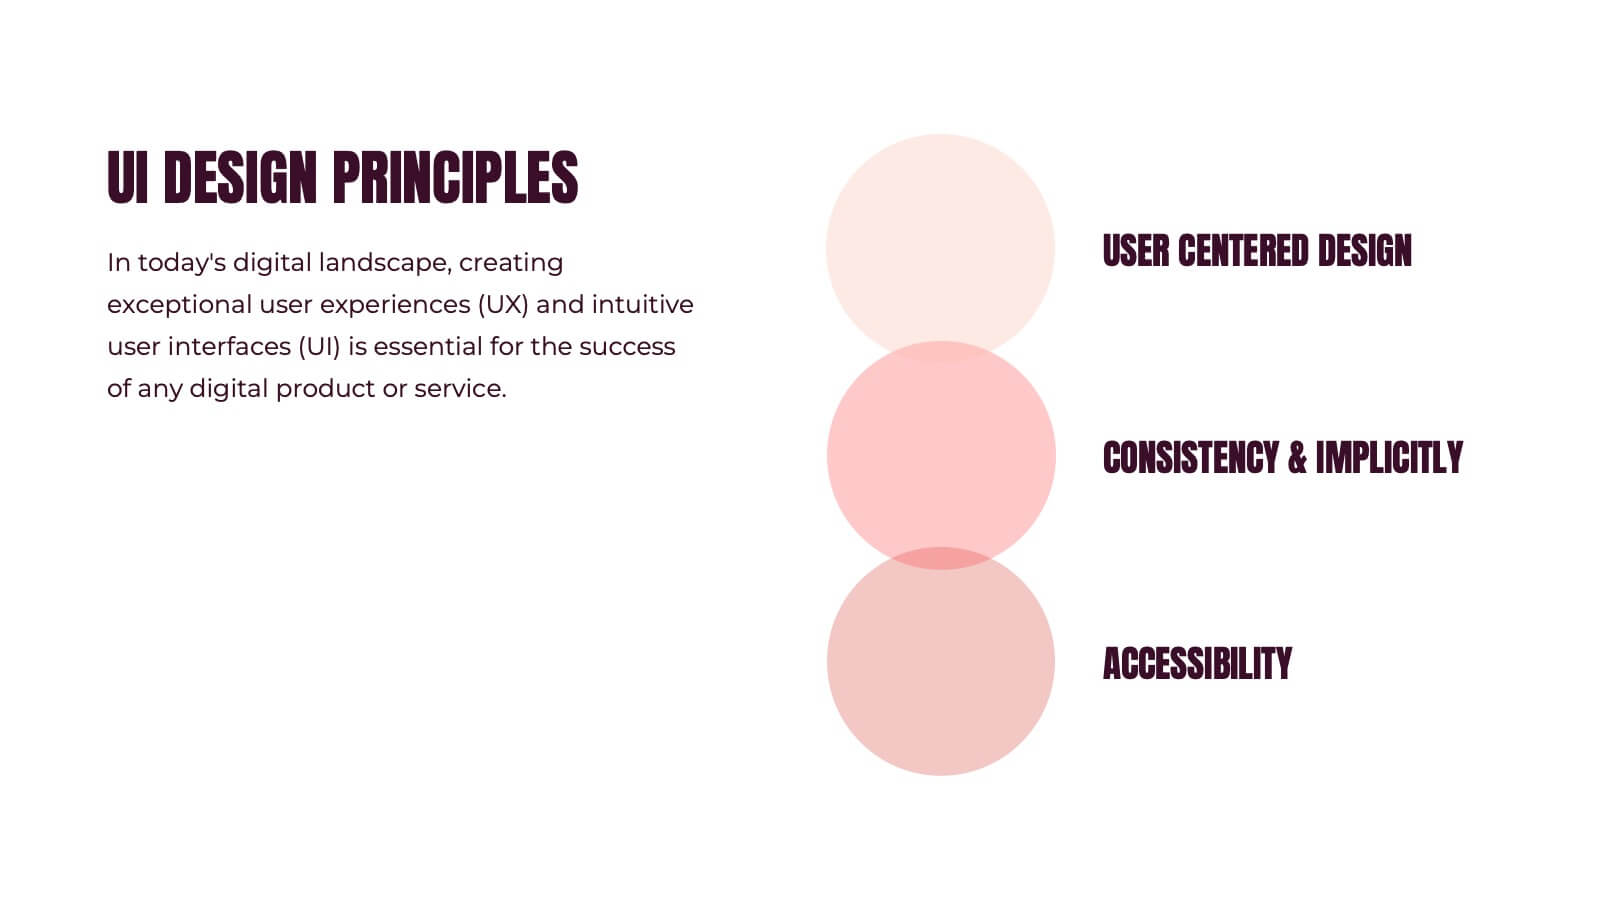
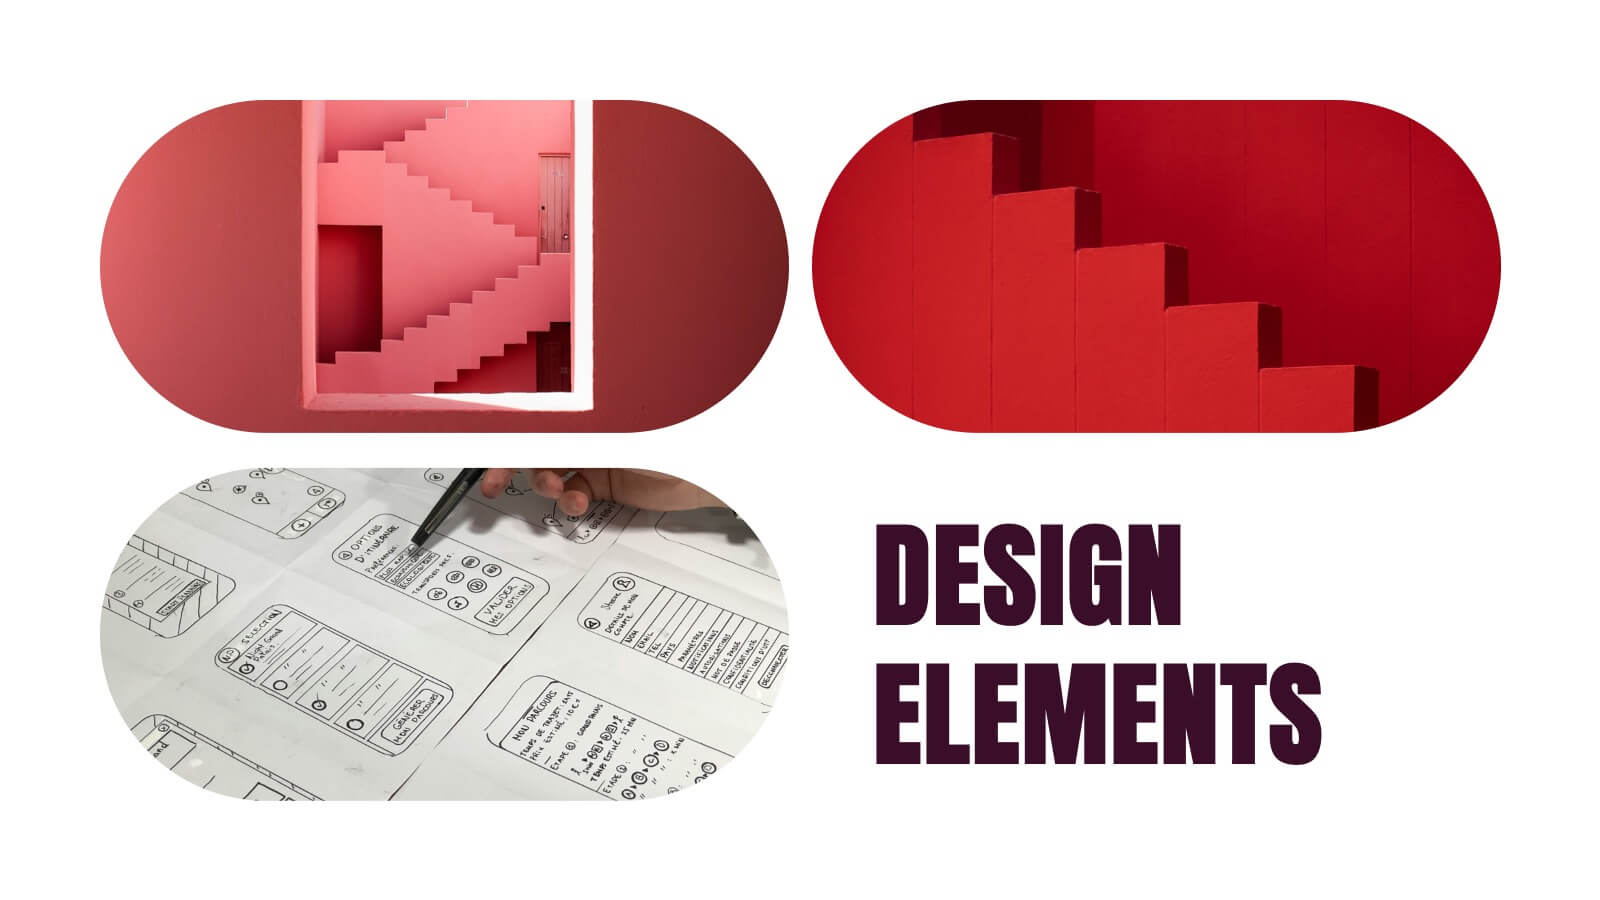
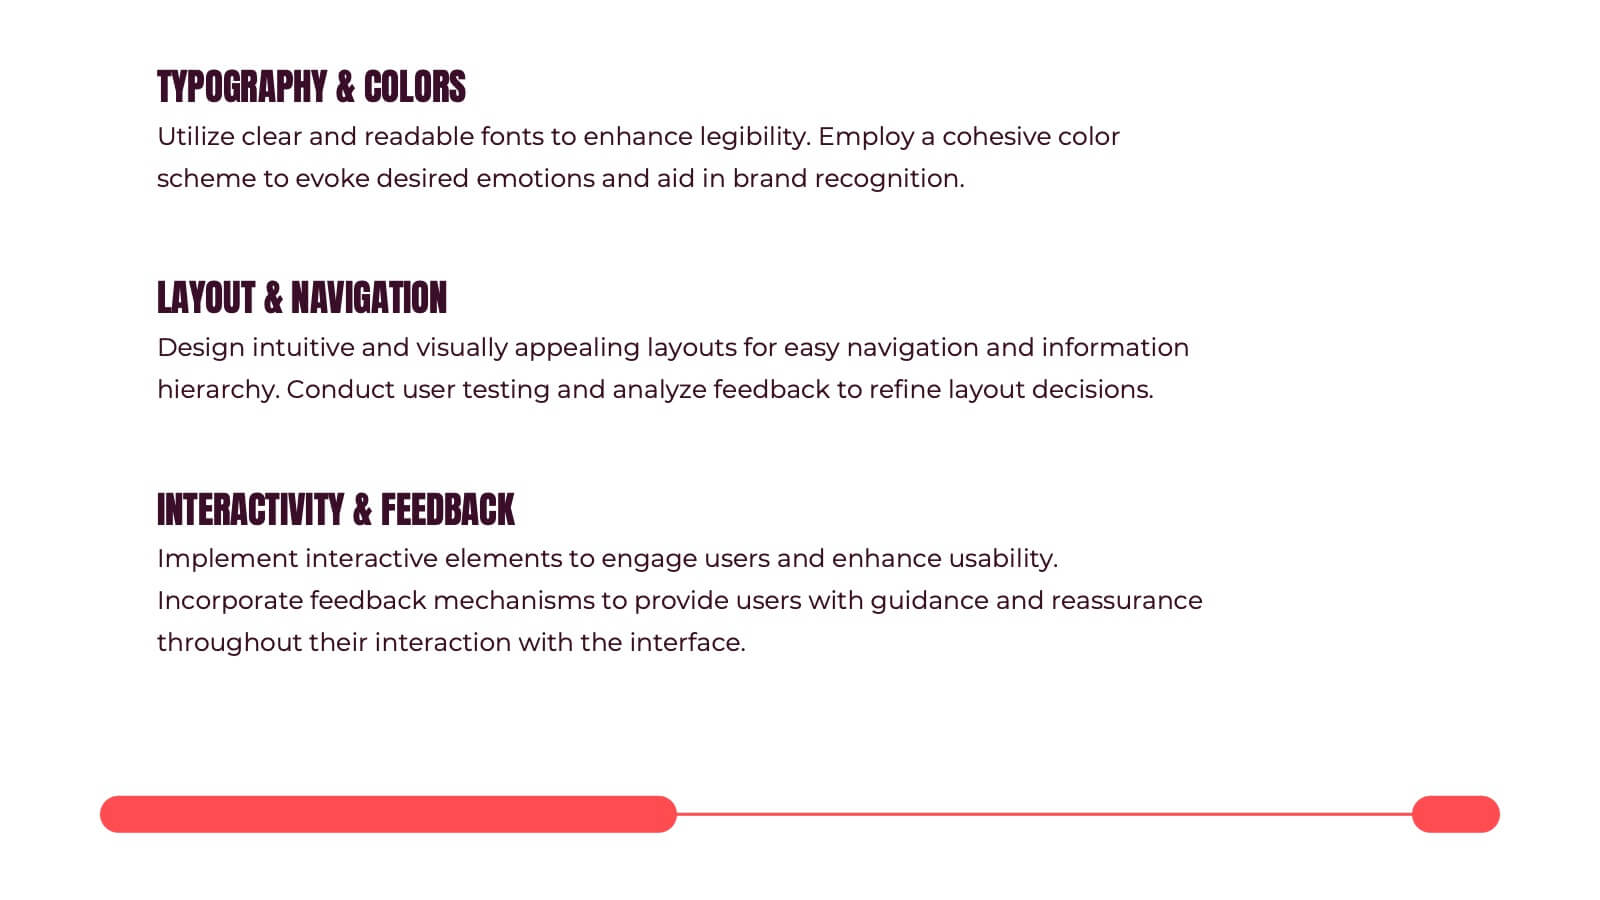
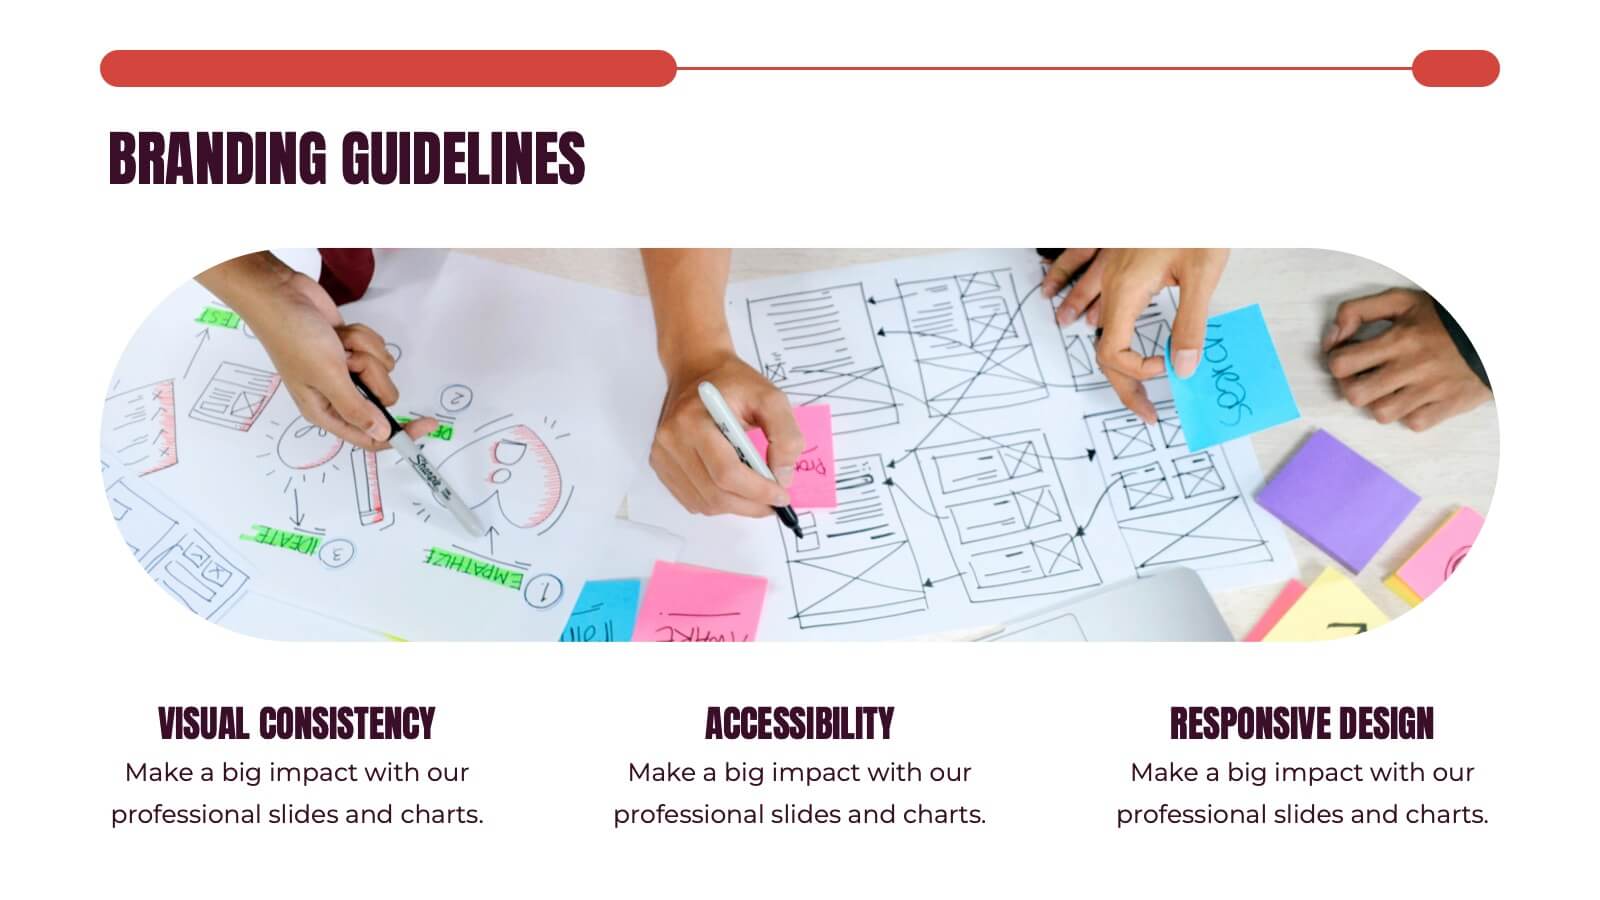
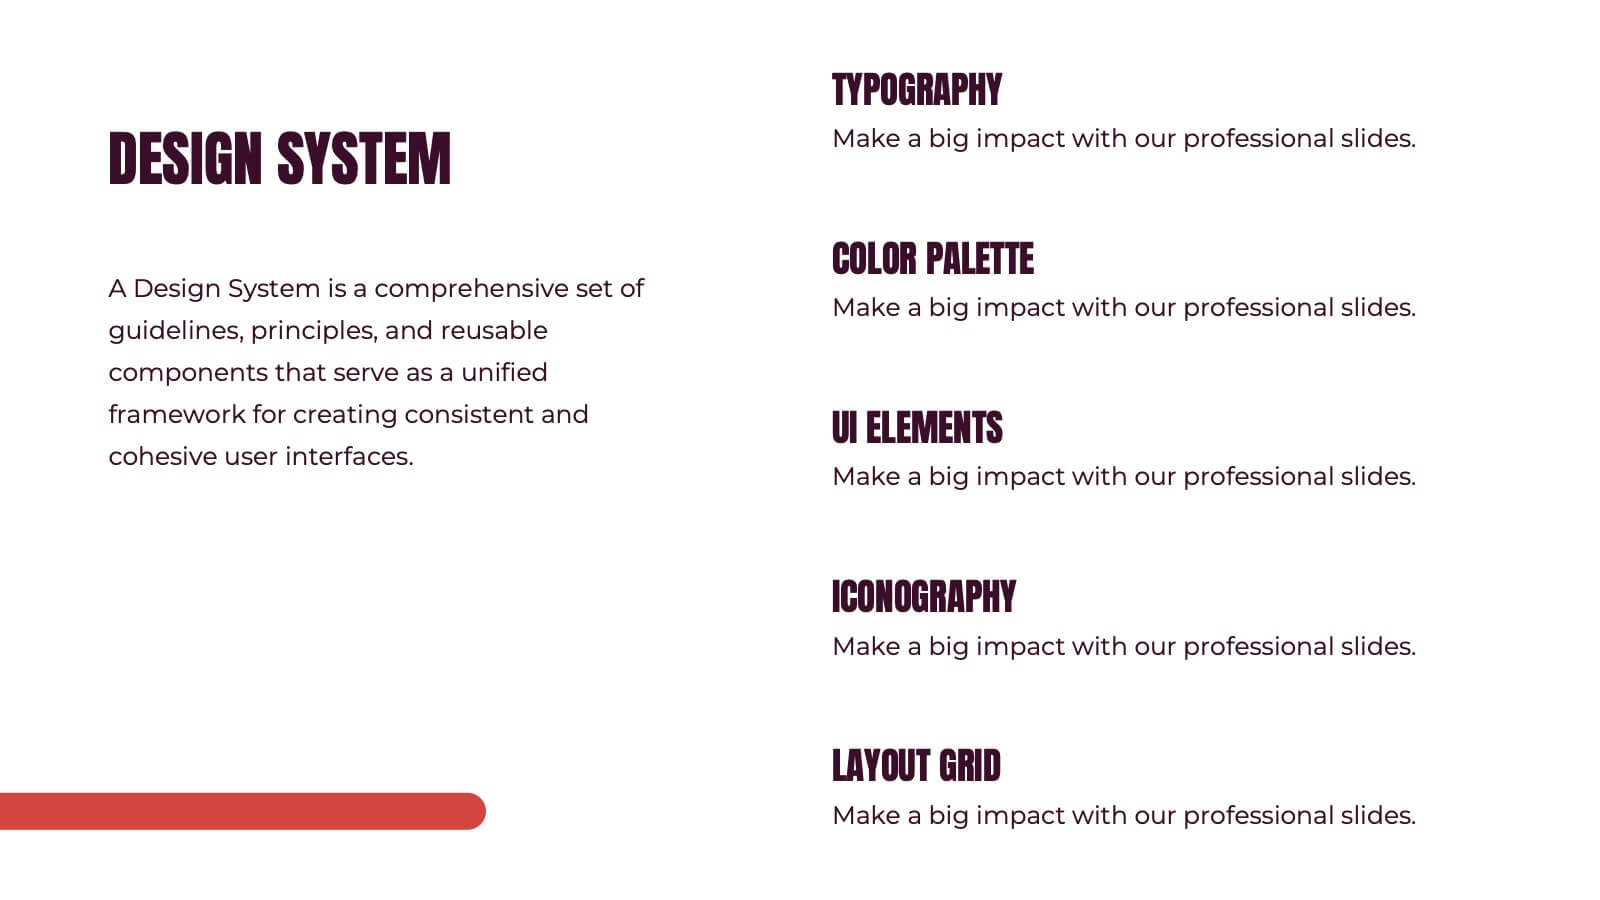
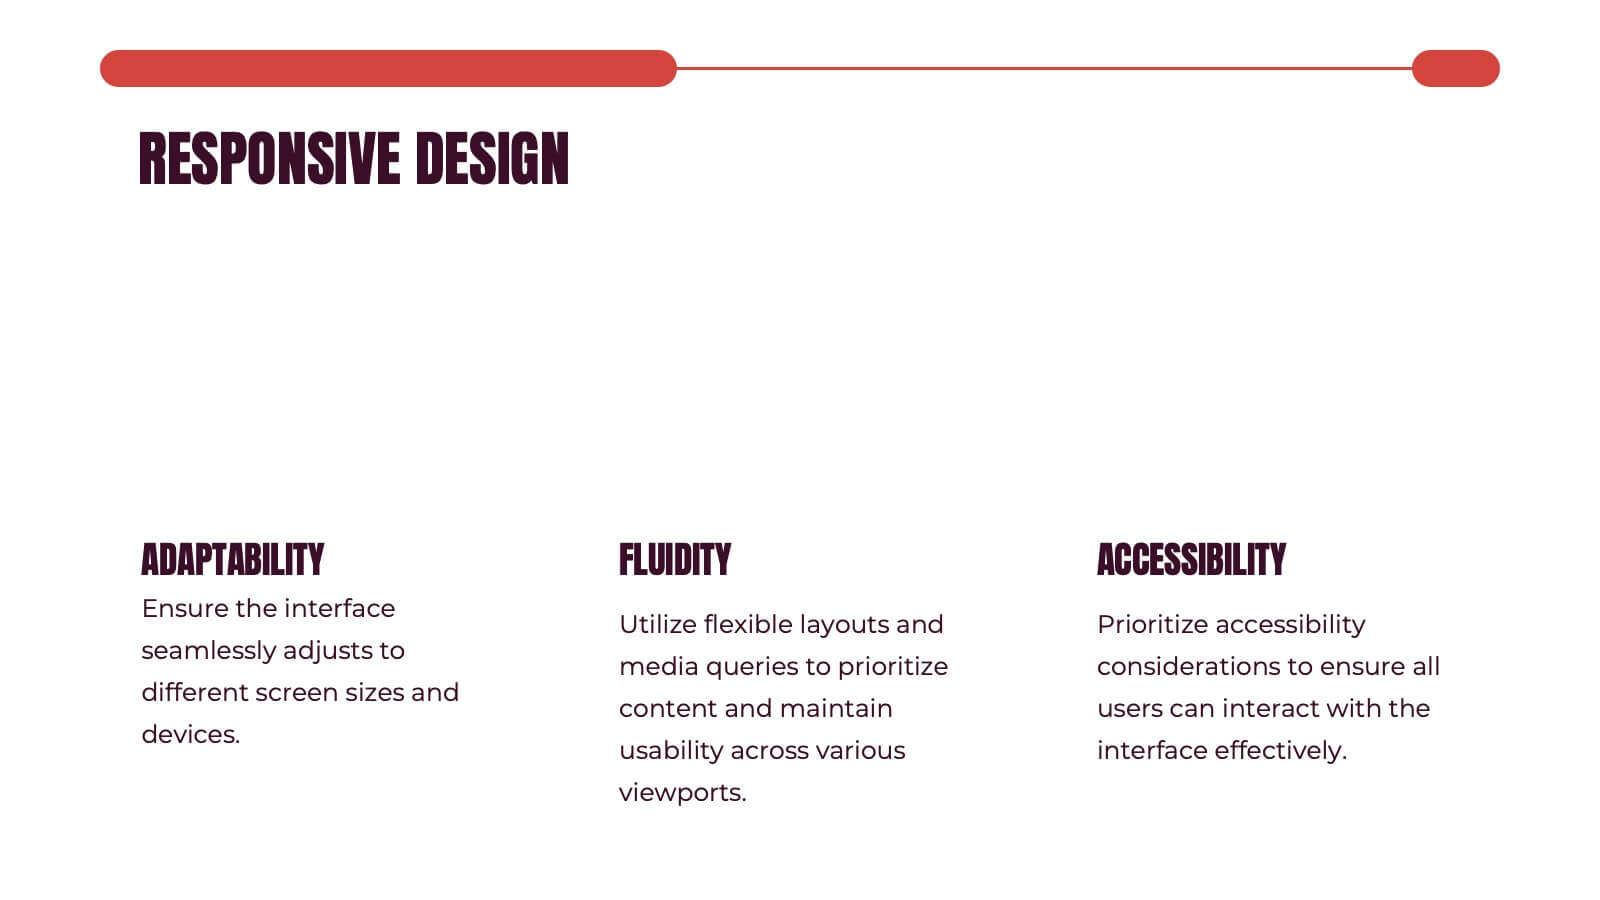
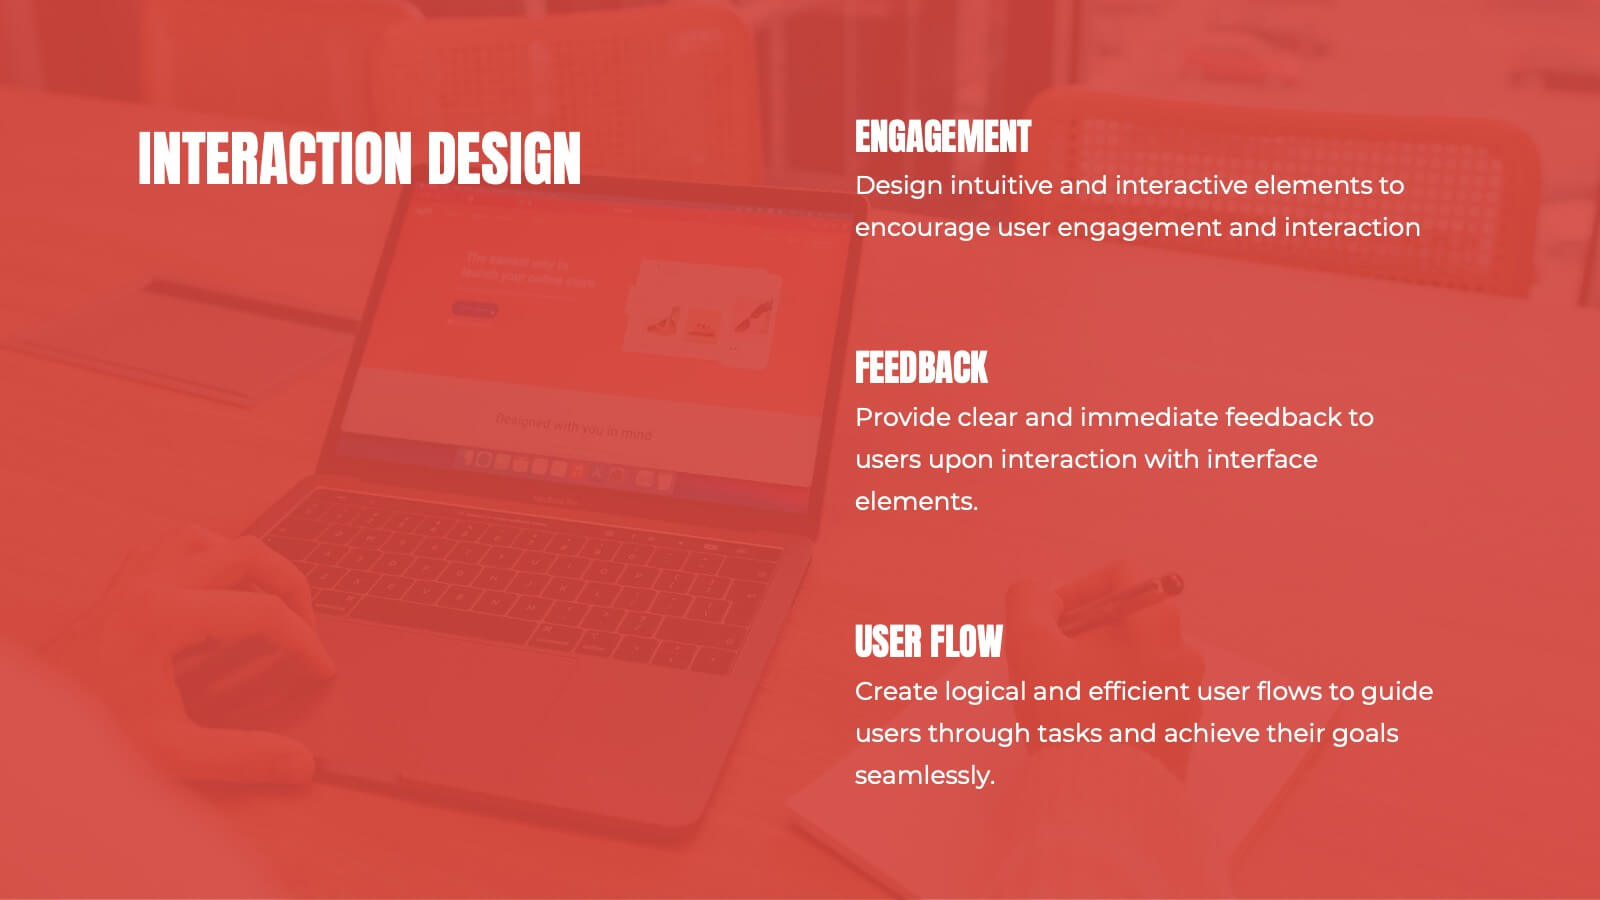
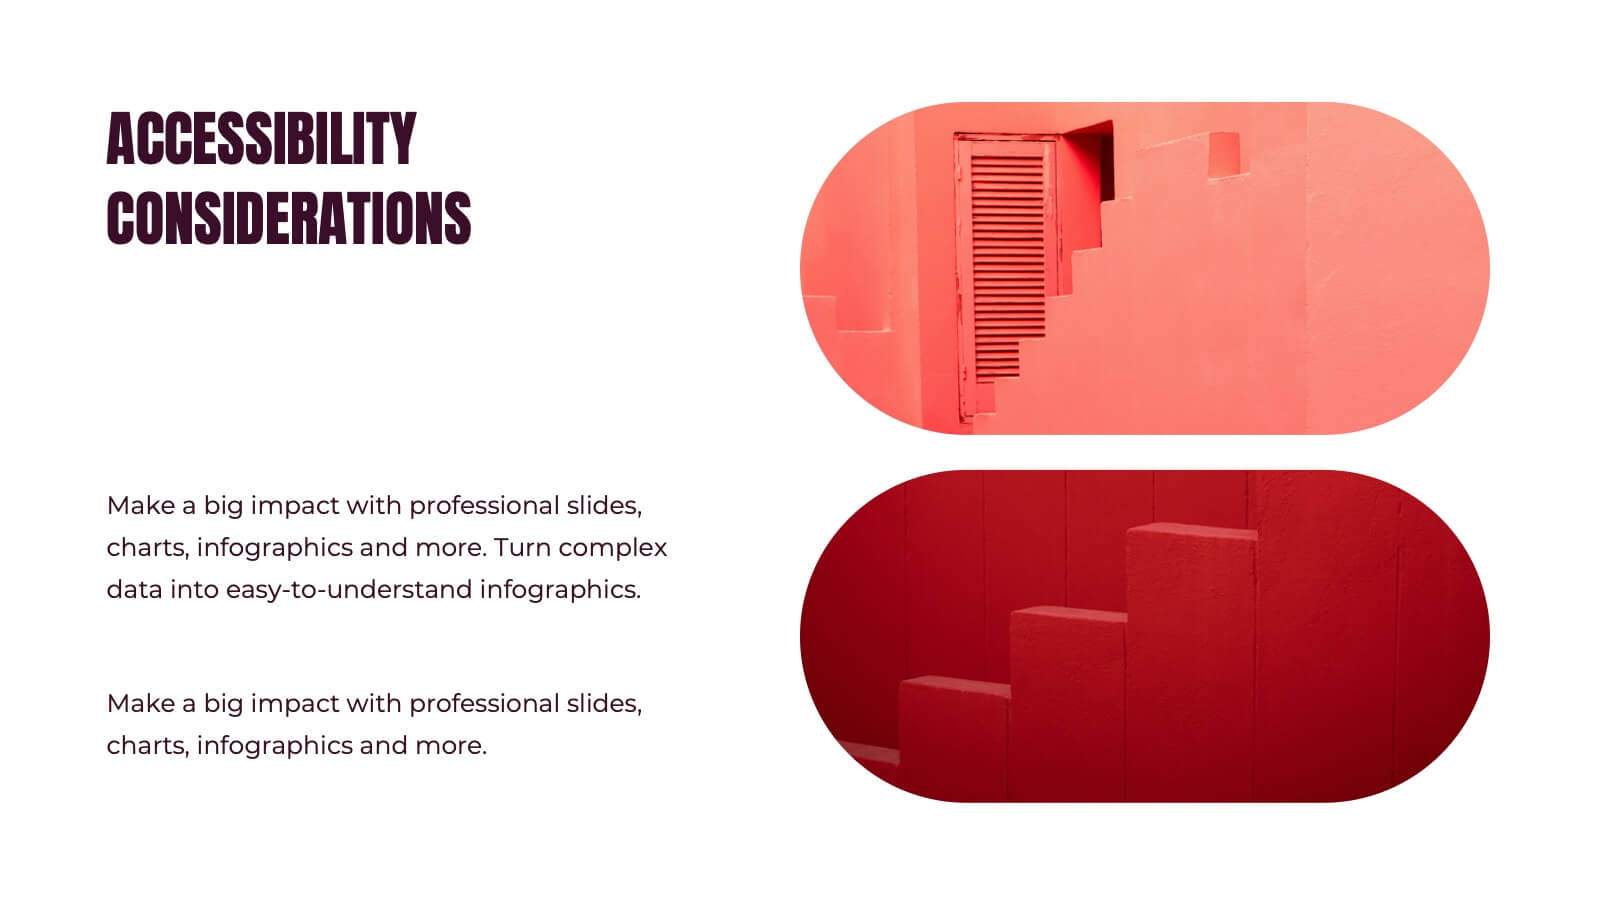
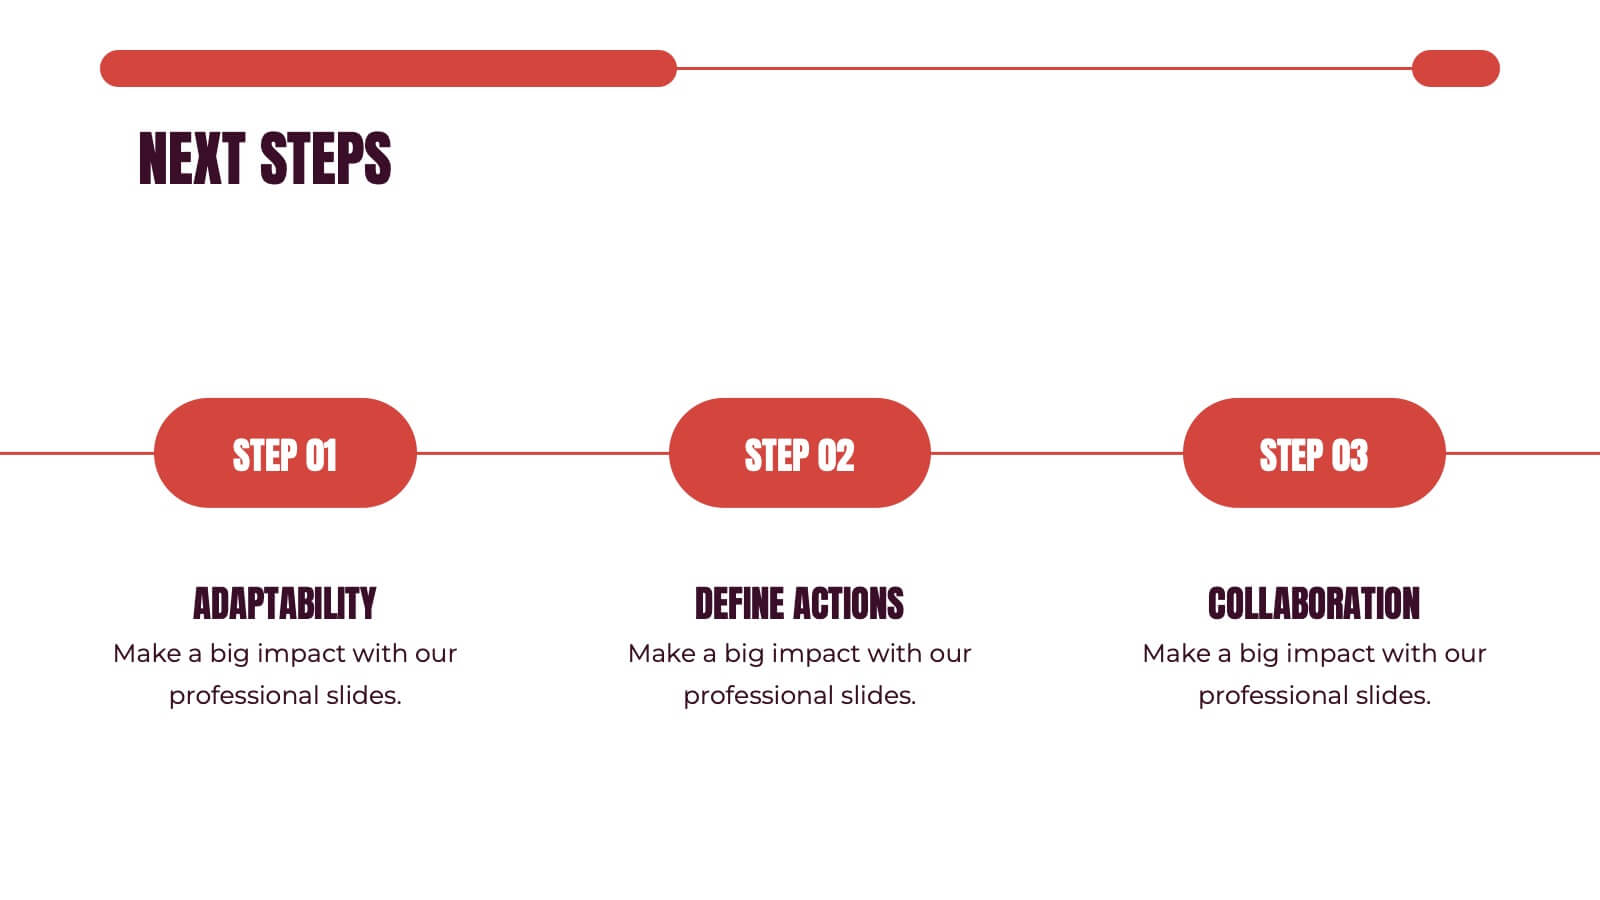
Kismet UX Design Presentation
Dive into the world of design with this stunning presentation template! Perfect for explaining user experience concepts, this template covers everything from wireframes to prototyping. It's designed to captivate your audience with visually engaging slides and clear, concise information. Compatible with PowerPoint, Keynote, and Google Slides for effortless use across platforms.


5 diapositivas
Team Role Distribution Matrix Presentation
Clarify responsibilities and improve collaboration with the Team Role Distribution Matrix Presentation. This RACI-style slide helps visualize team accountability across multiple tasks, making it ideal for project management, cross-functional teams, or workflow planning. Each layout option includes clearly labeled roles and color-coded responsibilities: Responsible, Accountable, Consulted, and Informed. Fully editable in Canva, PowerPoint, Keynote, and Google Slides.


6 diapositivas
Europe Education Map Infographics
Explore our versatile Europe Education Map infographic template, a valuable resource for visualizing the educational landscape across the continent of Europe. This template is fully compatible with popular presentation software such as PowerPoint, Keynote, and Google Slides, allowing you to effortlessly customize it to meet your specific needs. The Europe Education Map infographic template provides a solid foundation for illustrating data related to educational institutions, literacy rates, and academic trends throughout Europe. Whether you're an educator, researcher, or interested in European education, this template offers a user-friendly platform to create informative presentations and educational materials. Impress your audience with this SEO-optimized Europe Education Map infographic template, designed for clarity and ease of use. Customize it to showcase educational opportunities, achievements, and regional insights, making it a valuable asset for your projects and presentations. Begin crafting your personalized infographic today!


5 diapositivas
Employee Training Roadmap Presentation
Take your team on a visual journey that maps out success, one milestone at a time. This roadmap presentation is perfect for outlining employee training stages in a clear, engaging way. Each point leads naturally to the next. Fully editable and compatible with PowerPoint, Keynote, and Google Slides for seamless use.


5 diapositivas
3D Element Infographics for Impact Presentation
Add a bold visual twist to your data with the 3D Element Infographics for Impact Presentation. Featuring eye-catching 3D dice-style cubes, this template is perfect for showcasing four key concepts, comparisons, or stages. Ideal for business strategies, risk breakdowns, or decision-making visuals. Fully editable and compatible with PowerPoint, Keynote, and Google Slides.


12 diapositivas
Attention Interest Desire Actions Presentation
Spark curiosity from the very first slide with a bold, layered visual that turns complex ideas into a clear, memorable journey. This presentation walks viewers through each stage of your message, helping you build momentum and guide decisions with ease. Fully editable and compatible with PowerPoint, Keynote, and Google Slides.


20 diapositivas
Falcon Digital Marketing Strategy Plan Presentation
Develop a winning marketing strategy with this dynamic template. Dive into current trends, consumer behavior, and innovative techniques. Perfect for social media, influencer marketing, and data-driven campaigns. Fully compatible with PowerPoint, Keynote, and Google Slides.