


Características


¿Tienes alguna pregunta?
Recomendar


5 diapositivas
Digital Marketing Plan Presentation
Build momentum for your online strategy with a clean, structured layout that turns complex ideas into clear, stackable steps. This presentation helps outline goals, channels, and campaign actions in a visual flow that’s easy to follow and adapt. Fully customizable for PowerPoint, Keynote, and Google Slides.


26 diapositivas
Quantum Computing Presentation
Step into the future of technology with this fascinating presentation on quantum computing. Covering key concepts like quantum bits, superposition, entanglement, and real-world applications, this template helps simplify complex ideas for any audience. Fully customizable and compatible with PowerPoint, Keynote, and Google Slides for a seamless and insightful presentation experience.


21 diapositivas
Spectrum Project Timeline Presentation
Plan and execute your projects with precision using this detailed project plan template! Perfect for outlining objectives, timelines, and resource allocation. Ideal for project managers and teams aiming to ensure successful project delivery. Compatible with PowerPoint, Keynote, and Google Slides, this template keeps your project organized, clear, and on track. Ensure project success!


4 diapositivas
Artificial Intelligence Strategy Map Presentation
Step into the future with a clean, modern layout that makes complex technology easy to grasp and exciting to explore. This presentation helps you break down emerging innovations, real-world applications, and industry opportunities using clear visuals and structured sections. Fully customizable and compatible with PowerPoint, Keynote, and Google Slides.


6 diapositivas
Child Development Psychology Presentation
Bright colors and geometric birds bring this slide to life, making complex concepts easy to follow. This presentation template simplifies the key stages of emotional and psychological growth in children, helping you explain theories and behaviors clearly. Compatible with PowerPoint, Keynote, and Google Slides for seamless use across platforms.


5 diapositivas
Best Travel Planning Template
Bring wanderlust to life with a slide that turns trip planning into a clear, engaging journey. This presentation breaks down key travel steps—documents, packing, routes, and timing—using simple visuals that keep details organized and easy to follow. Fully customizable and compatible with PowerPoint, Keynote, and Google Slides.


4 diapositivas
Product Life Cycle Stages Explained Presentation
Turn complex business growth phases into a clear visual journey with this clean, modern layout. Ideal for explaining product development, marketing strategies, or performance tracking, it helps you communicate each stage with precision and style. Fully editable and compatible with PowerPoint, Keynote, and Google Slides for seamless customization.


4 diapositivas
Interactive Data Dashboard Display Presentation
Present data with clarity using this Interactive Data Dashboard Display presentation. Designed to showcase multiple metrics at once, it includes pie charts, donut charts, bubble graphs, and bar comparisons. Ideal for business reports, marketing insights, or performance reviews. Fully editable in Canva, PowerPoint, and Google Slides for flexible customization.


6 diapositivas
Process Cycle Wheel Slide Presentation
Give your workflow a visual rhythm with this clean, circular layout designed to highlight every stage of a process with clarity and style. Perfect for showcasing cycles, systems, or strategies, it keeps your message organized and engaging. Fully editable and compatible with PowerPoint, Keynote, and Google Slides.


7 diapositivas
Competitive Analysis Using Strategy Wheel
Highlight your competitive edge with this dynamic strategy wheel diagram. Designed to visually compare up to six business components, this slide is ideal for showcasing strengths, weaknesses, or market positioning. Perfect for strategic planning sessions, it’s fully editable in PowerPoint, Keynote, and Google Slides.


7 diapositivas
Strategic Business Execution Playbook Presentation
Streamline your execution roadmap with this Strategic Business Execution Playbook. Featuring a sleek, step-by-step layout, it’s ideal for showcasing business stages, workflows, or strategic planning phases. Easy to customize in PowerPoint, Keynote, and Google Slides, this template helps teams visualize priorities and align goals with precision and clarity.


20 diapositivas
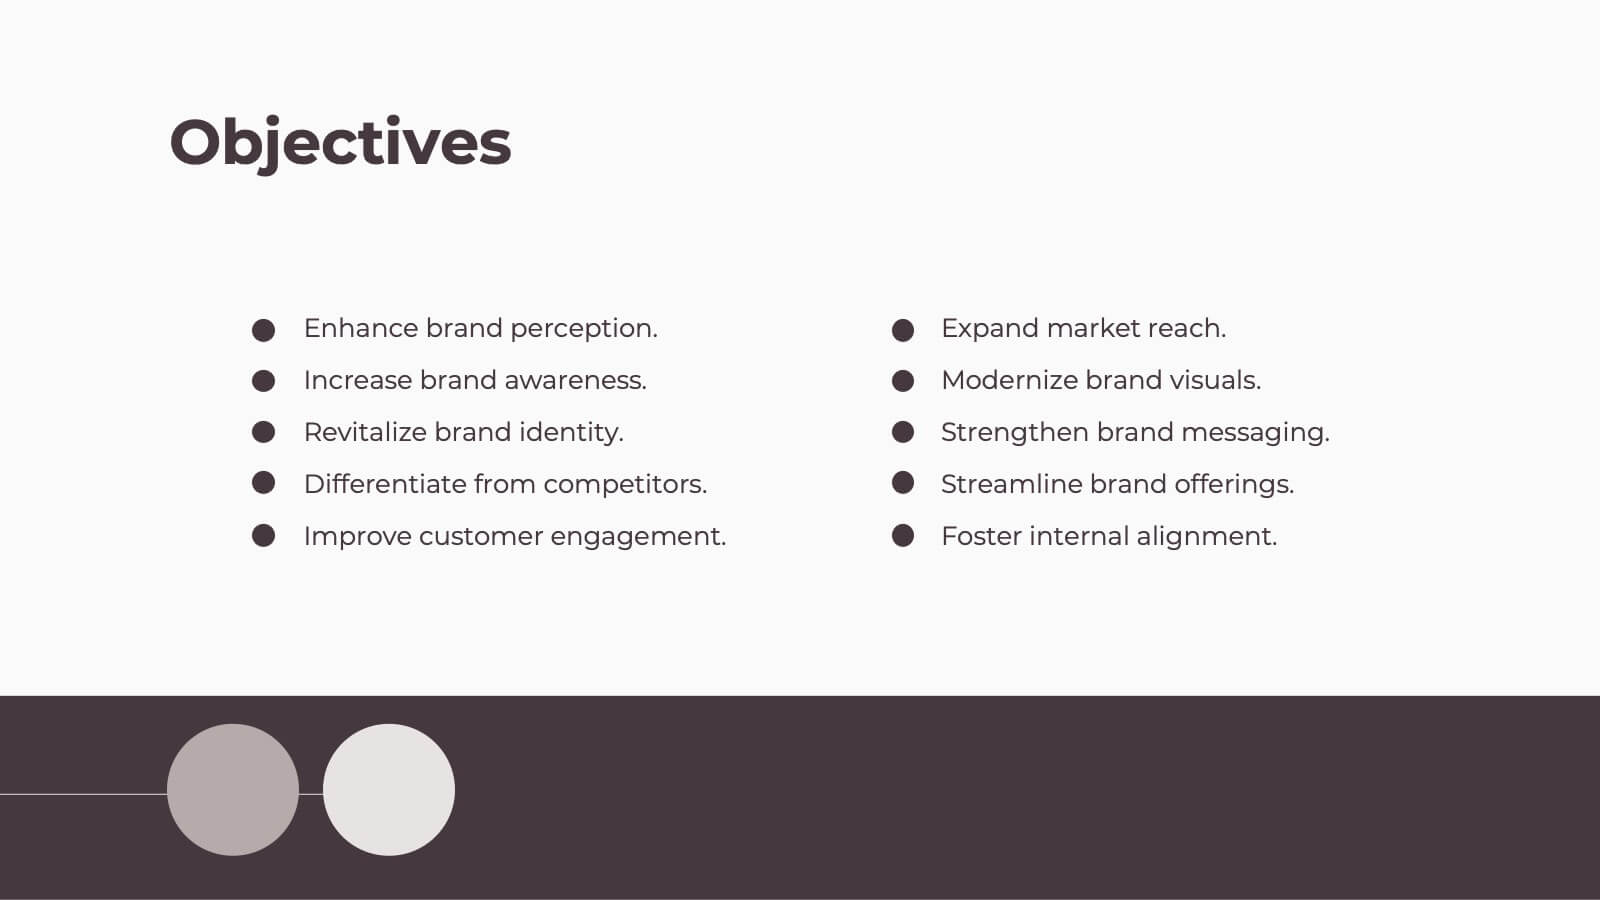
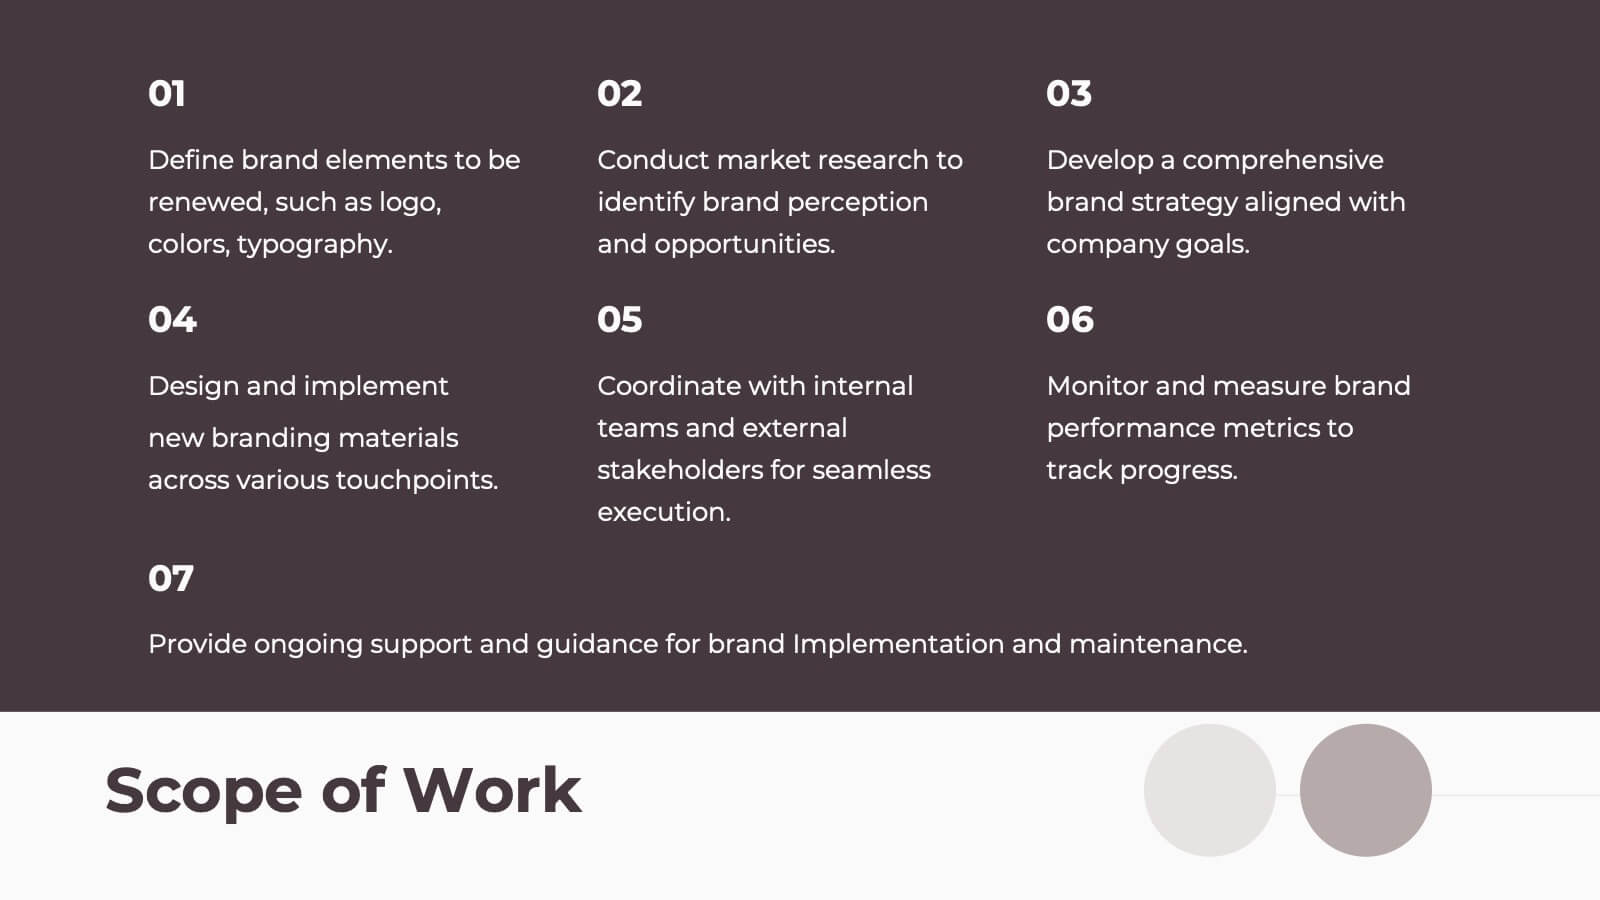
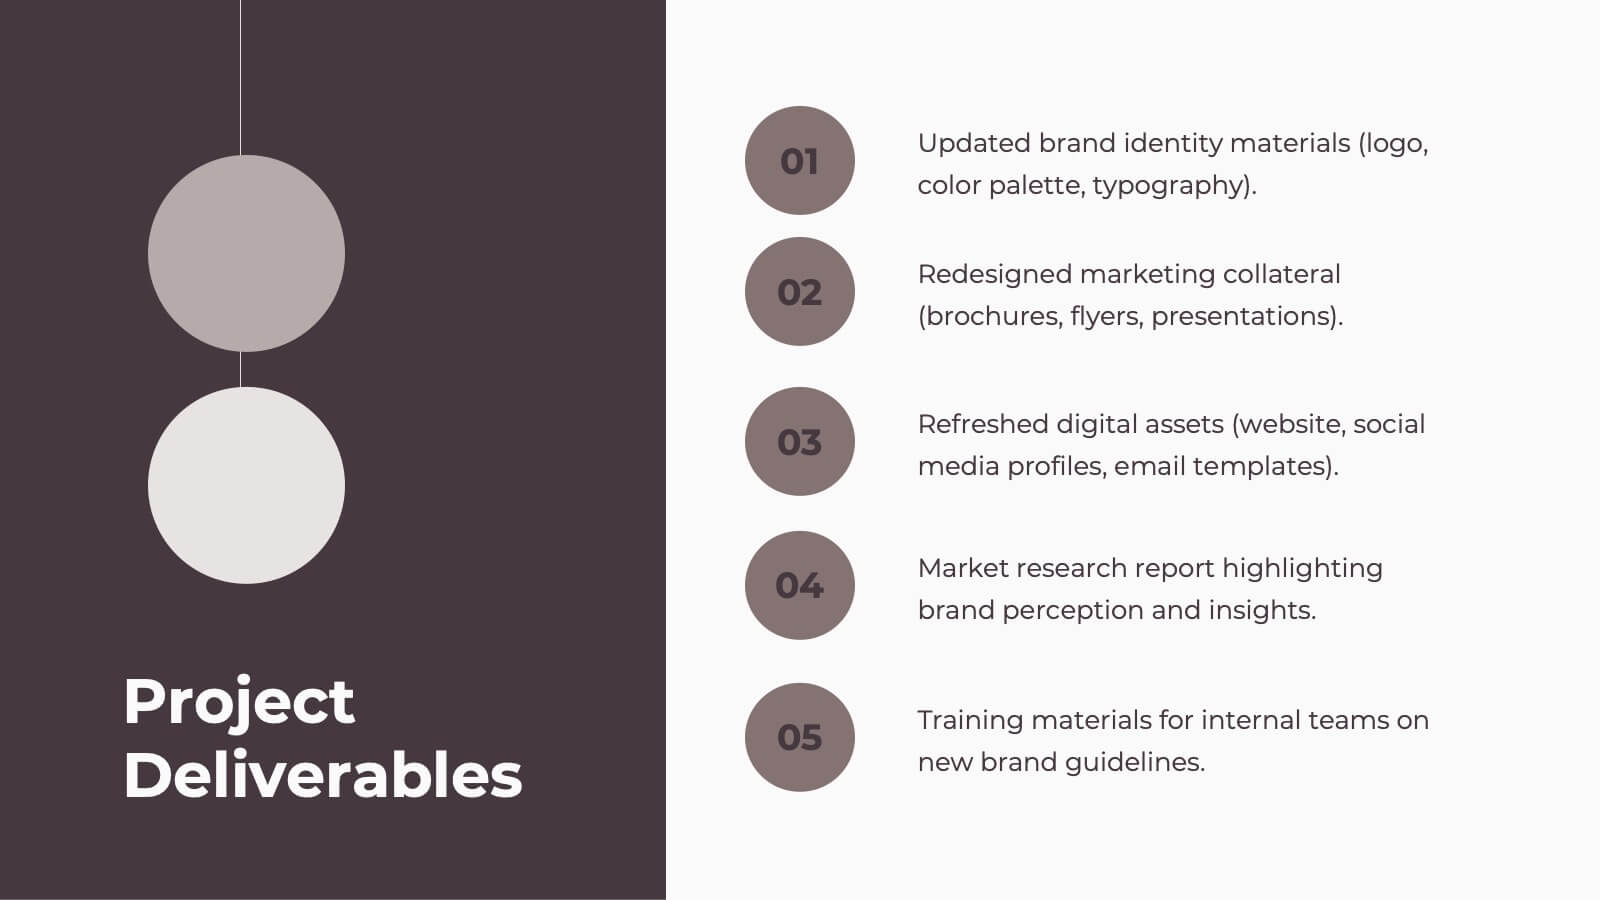
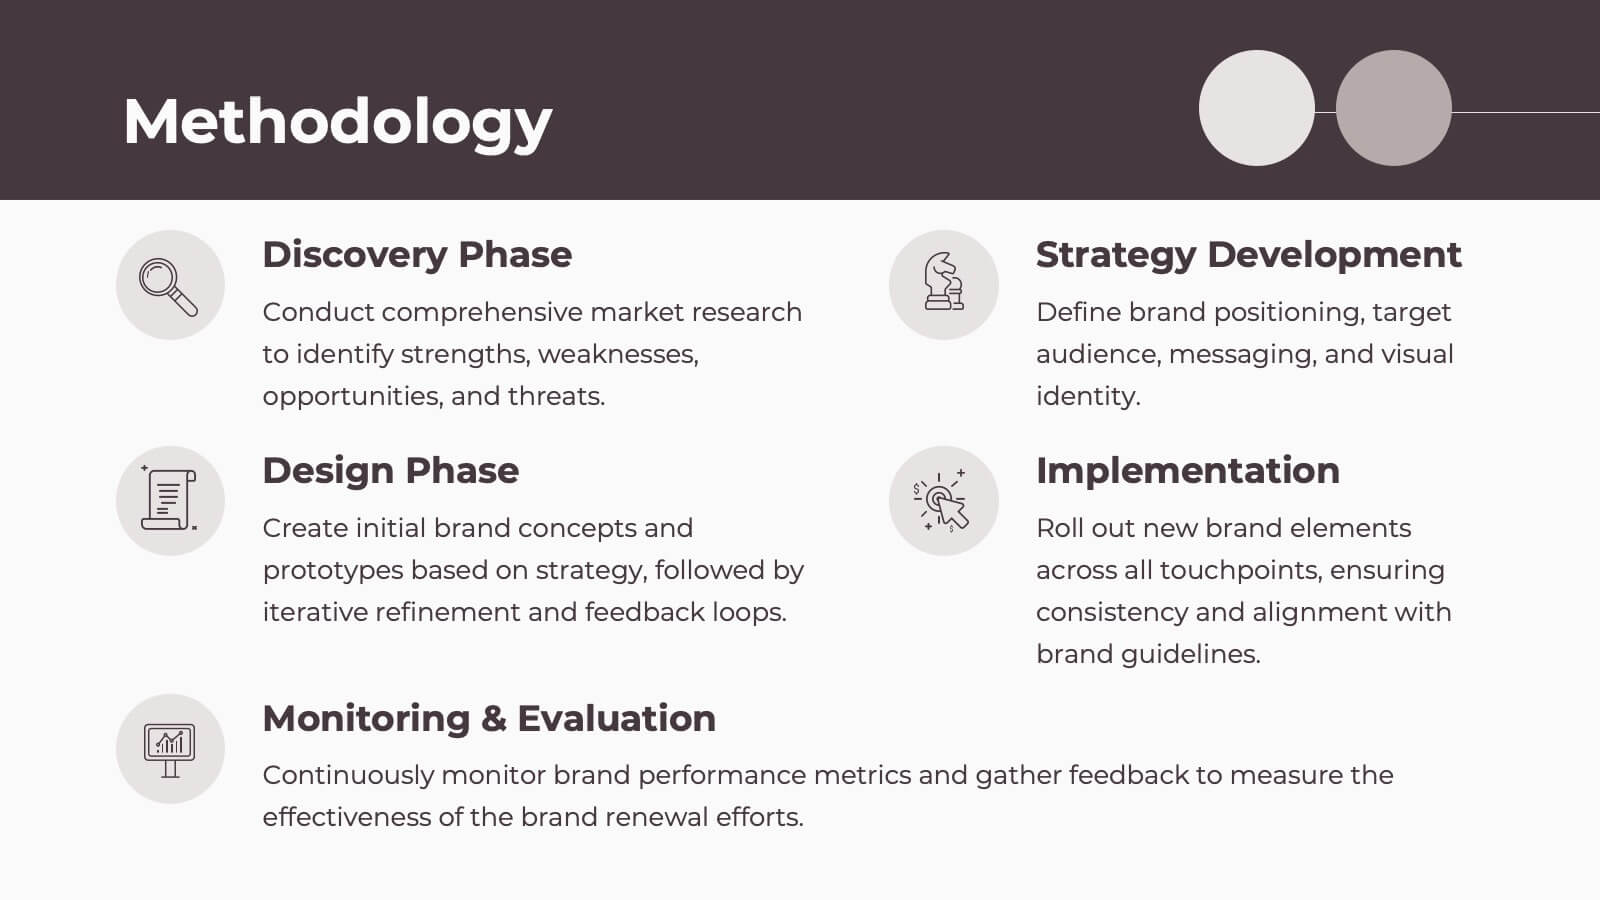
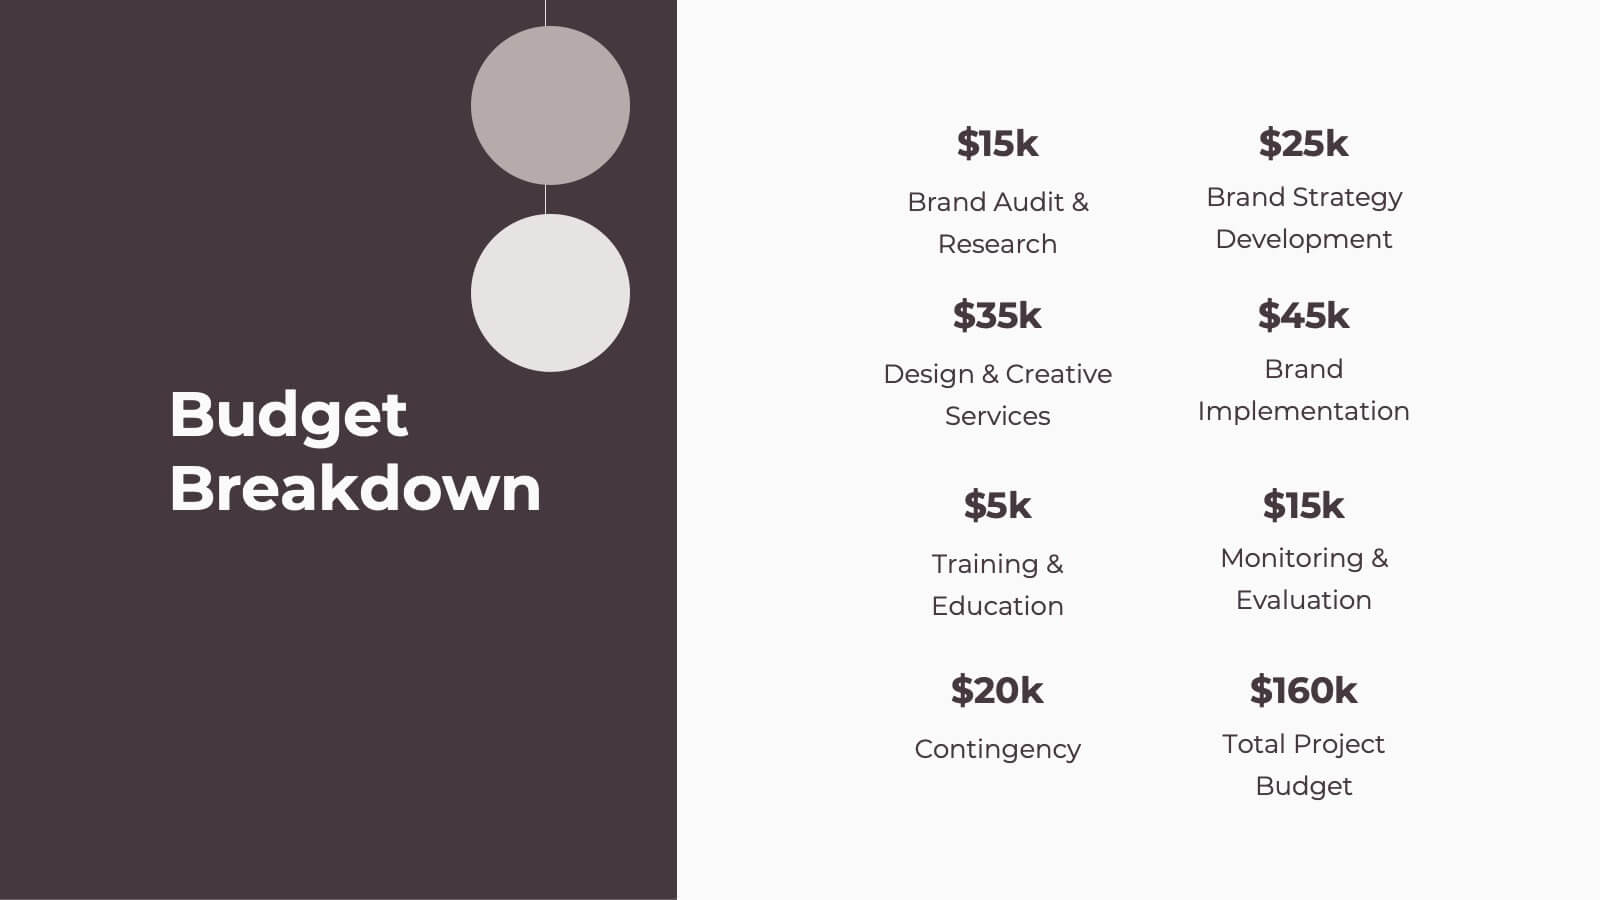
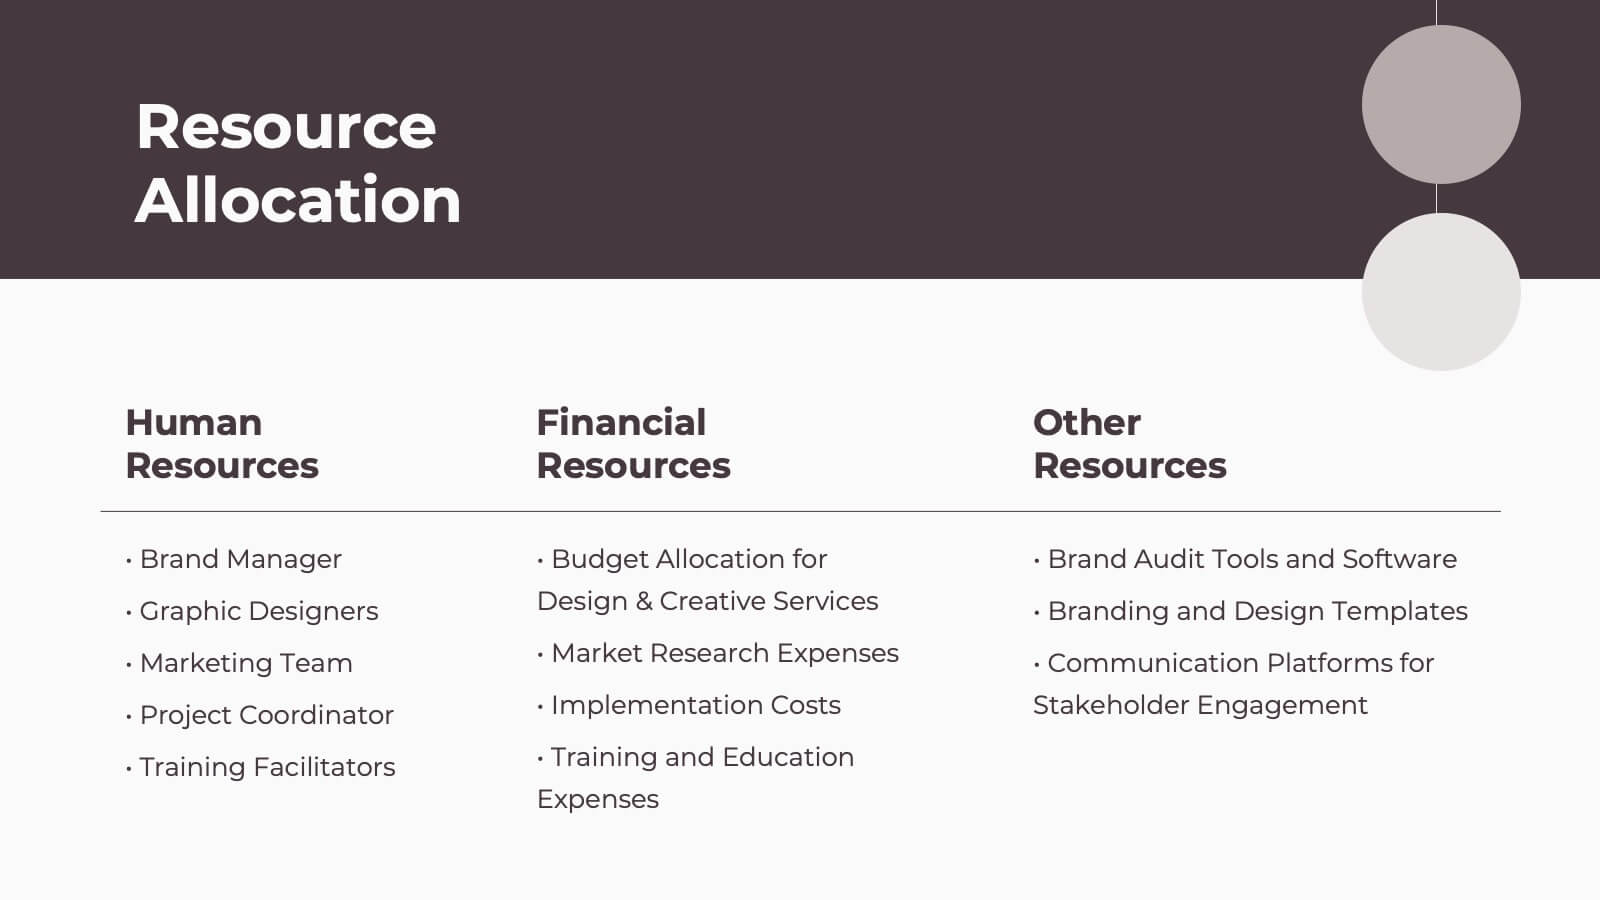
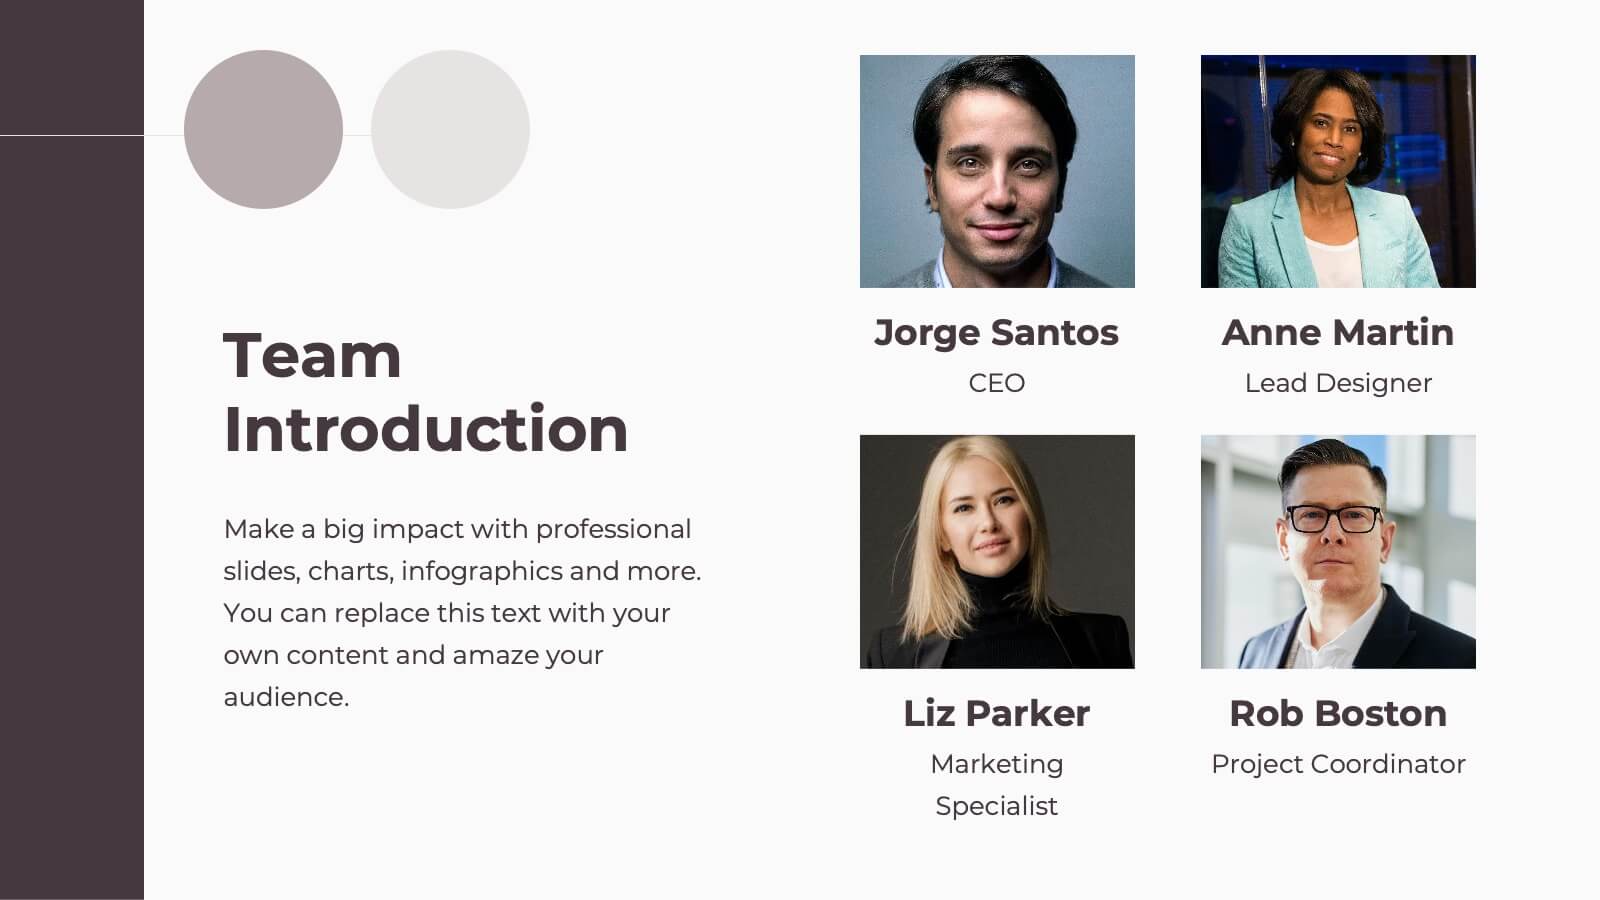
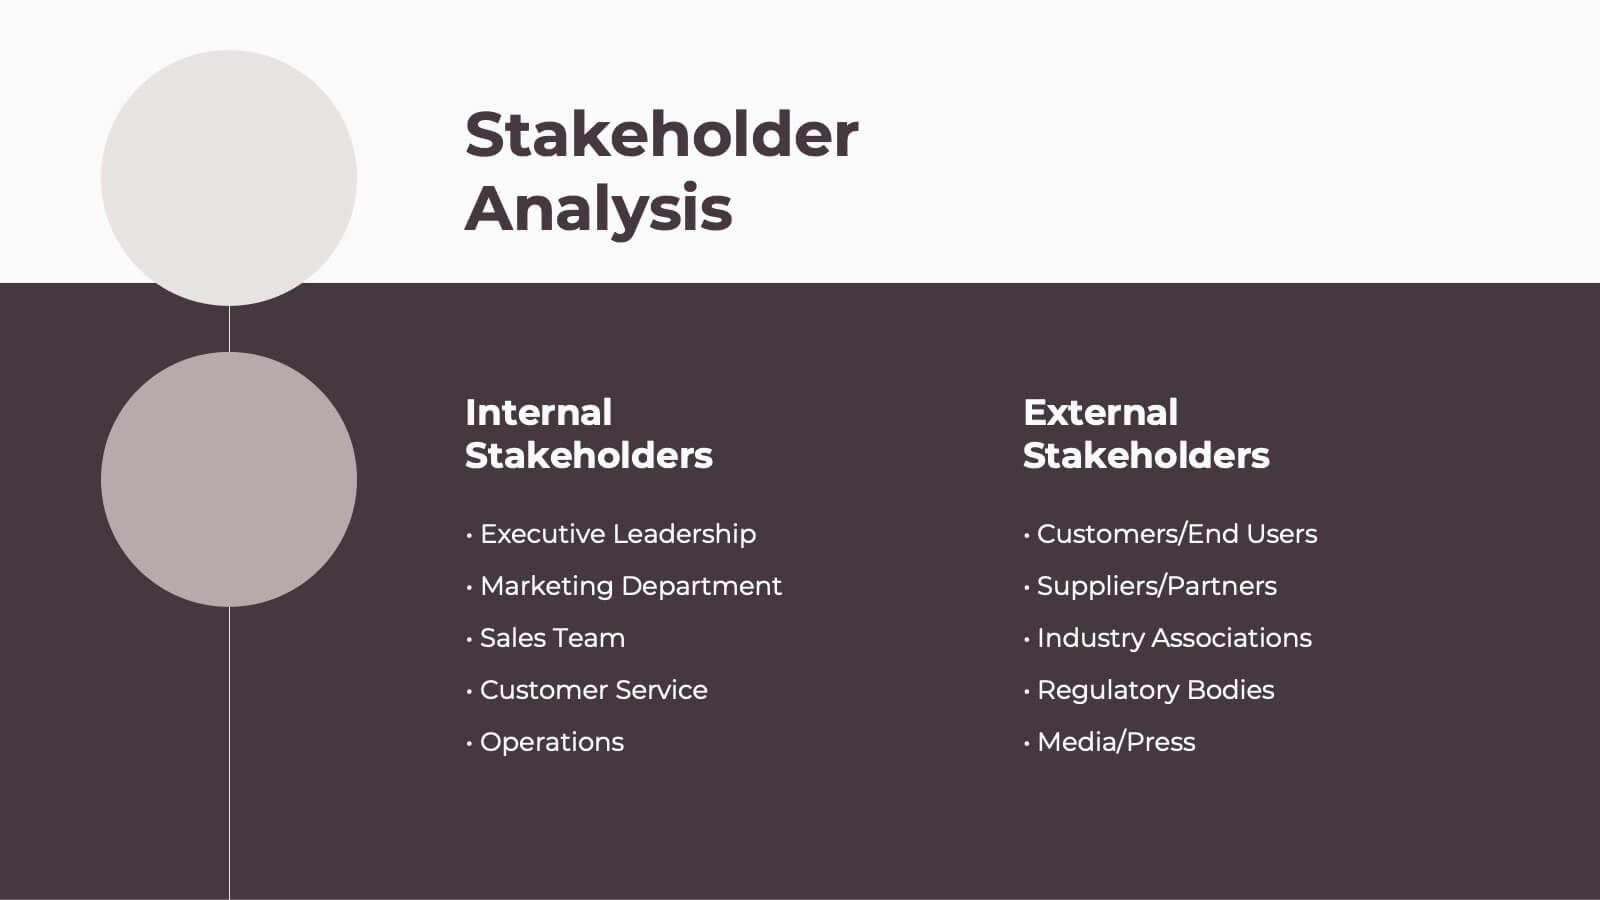
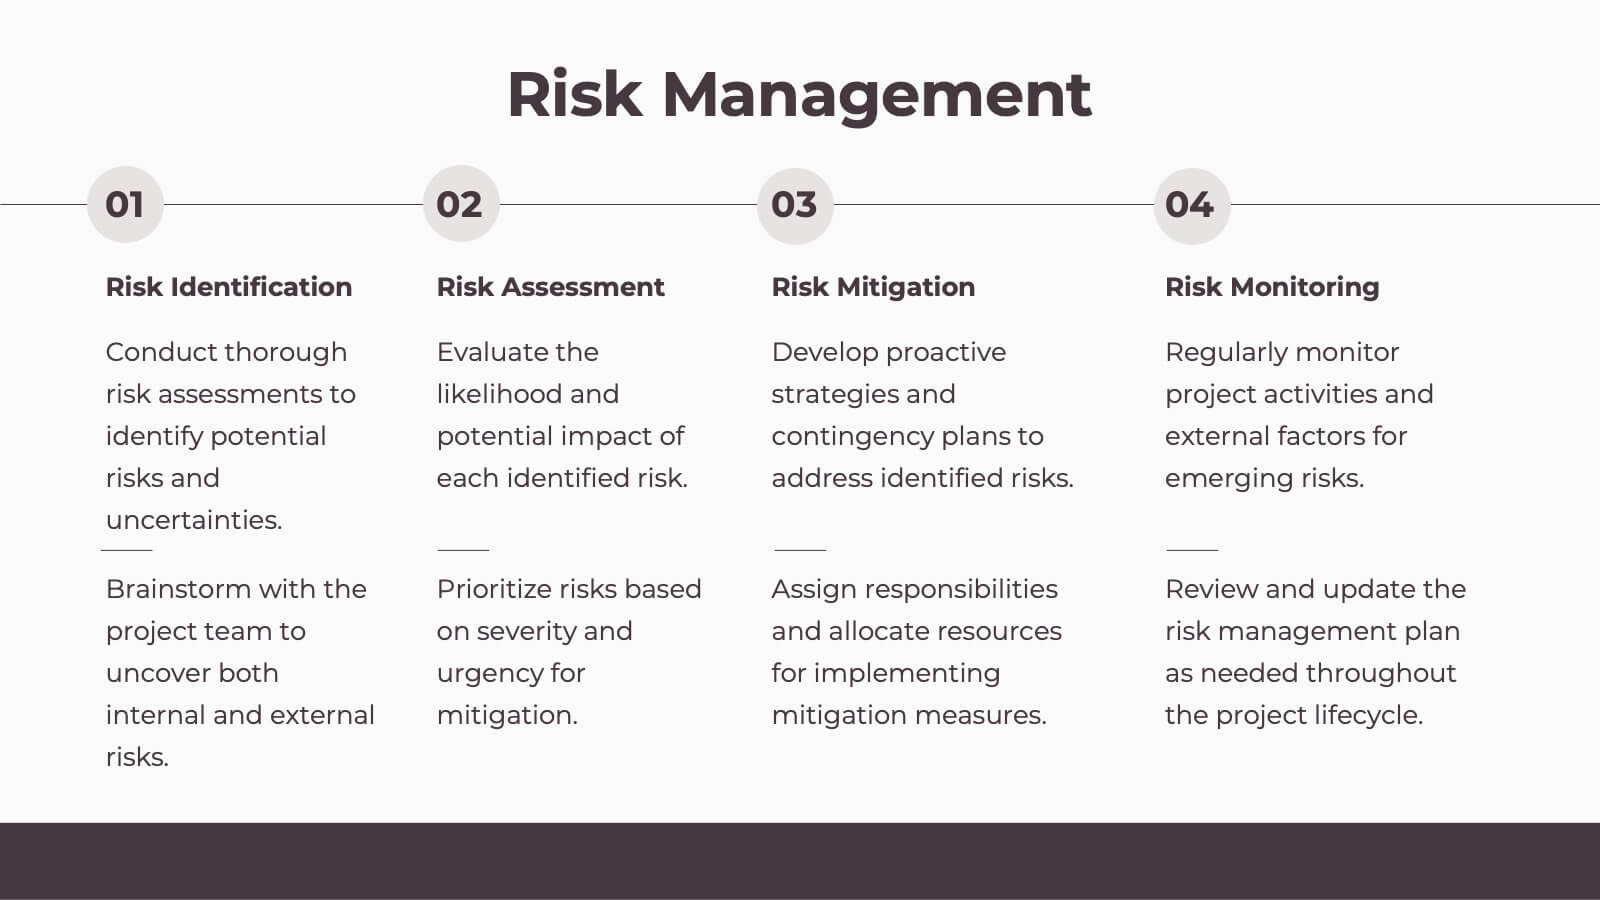
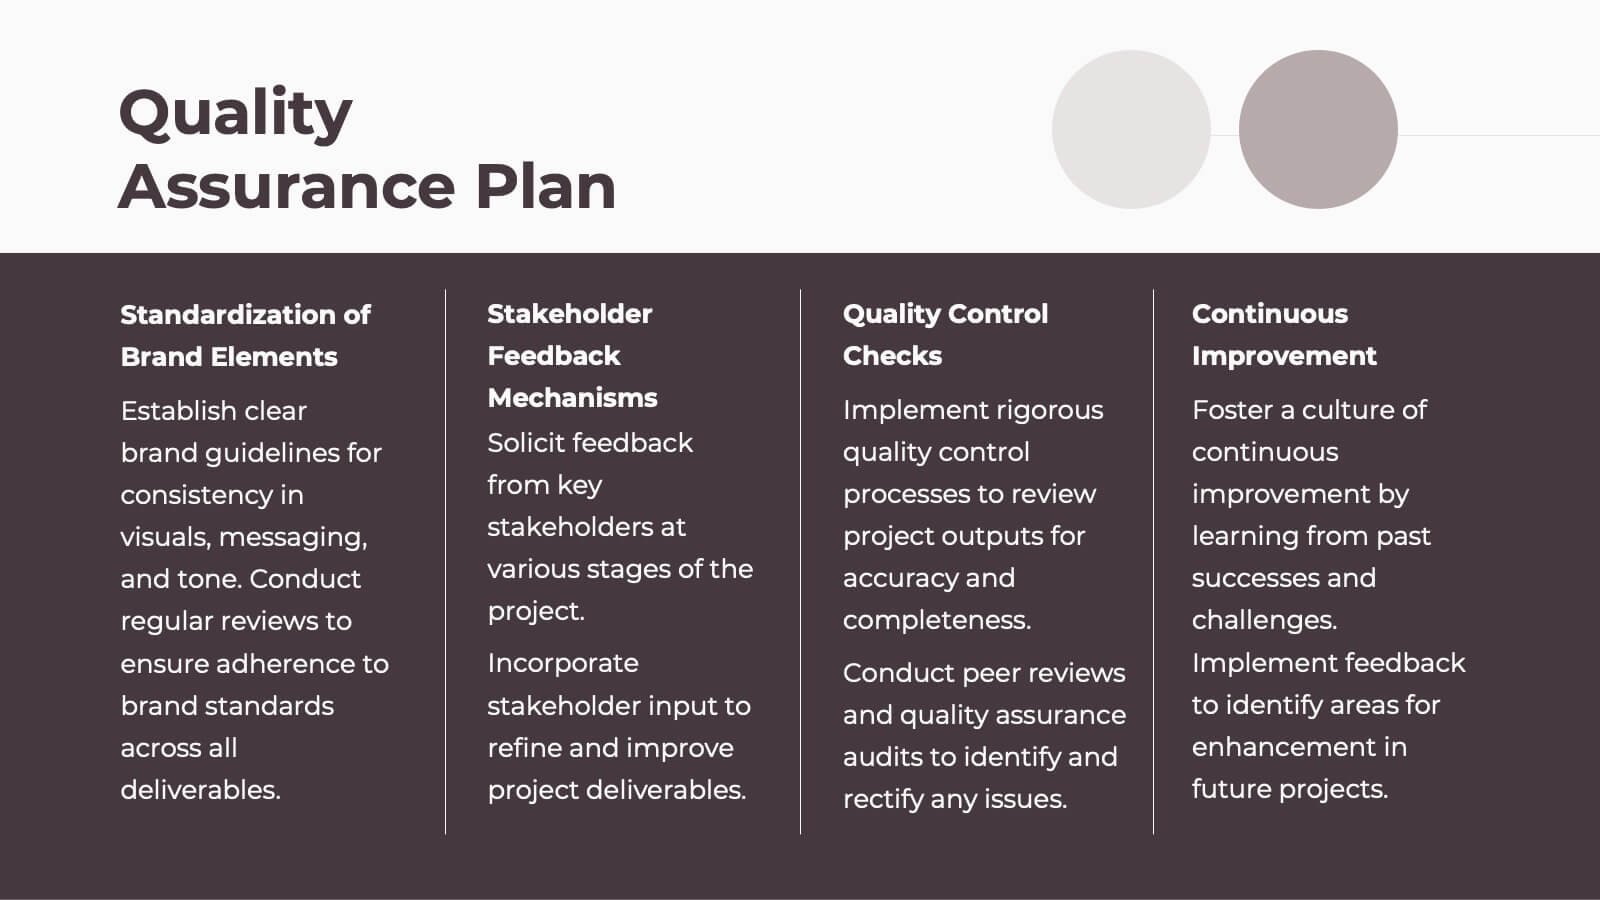
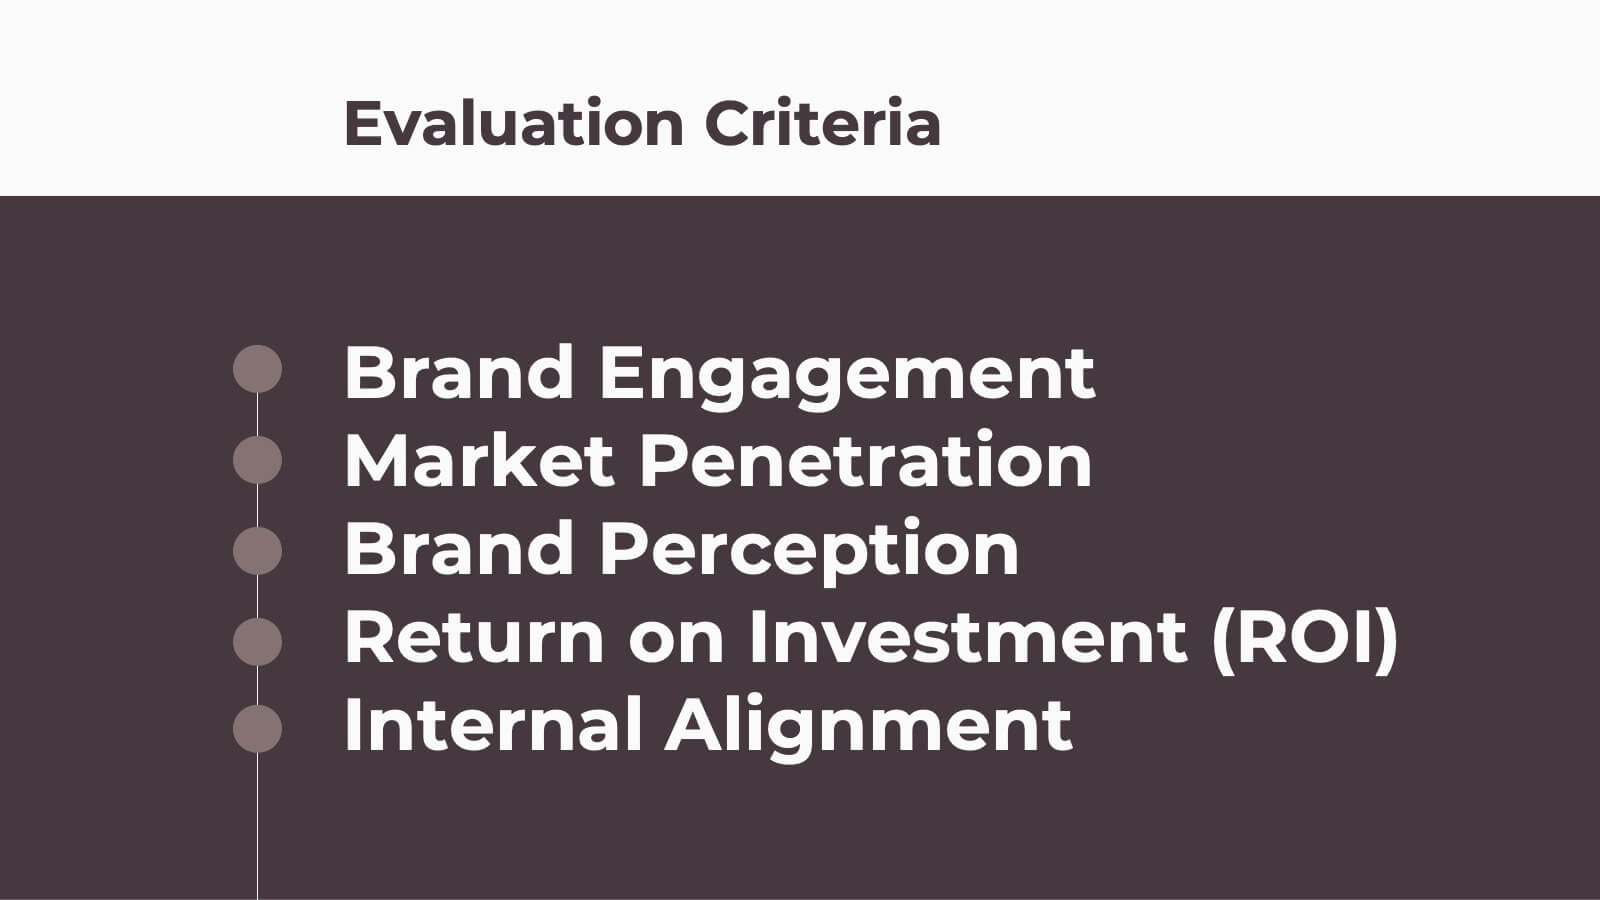
Stratoshade Project Proposal Presentation
Present a comprehensive project proposal with this template, featuring sections for introduction, objectives, methodology, deliverables, budget breakdown, and client testimonials. Clearly outline goals, timeline, pricing, and risk mitigation strategies. Perfect for PowerPoint, Keynote, and Google Slides, ensuring a polished and professional presentation for project pitches.


4 diapositivas
AI Trends and Use Cases Presentation
Step into the future with a clean, modern layout that makes complex technology easy to grasp and exciting to explore. This presentation helps you break down emerging innovations, real-world applications, and industry opportunities using clear visuals and structured sections. Fully customizable and compatible with PowerPoint, Keynote, and Google Slides.


34 diapositivas
MVP Startup
An MVP Startup is a type of business that focuses on developing and launching a minimal version of their product or service with the basic features required to test its viability in the market and gather feedback. This template is designed with a bold and dynamic red color palette, perfect for start-ups that want to convey a sense of passion, innovation, and urgency. It features a range of customizable slides that are specifically tailored for start-up presentations to showcase your MVP concept, market validation, and growth strategy. Compatible with Powerpoint, Keynote, and Google slides, all 34 slides are fully editable.


5 diapositivas
Company Success Story Timeline Presentation
Highlight your journey with the Company Success Story Timeline Presentation. This modern, mountain-style layout helps you break down your company’s key milestones, phases, or achievements step by step. With five customizable stages and icons, it’s ideal for visual storytelling, growth metrics, or project retrospectives. Fully editable in Canva, PowerPoint, Keynote, and Google Slides.


20 diapositivas
Oceandra Sales Proposal Presentation
Present your sales strategy with precision and professionalism using this versatile proposal template. Designed to clearly communicate your problem statement, proposed solutions, and goals, it’s perfect for impressing potential clients and stakeholders. Walk your audience through the project scope, methodology, and deliverables with clean, visually appealing layouts. With sections for pricing structures, team expertise, and risk mitigation strategies, this template ensures your proposal is comprehensive and persuasive. The next steps and action plan slide helps solidify your commitment to achieving results. Fully compatible with PowerPoint, Google Slides, and Keynote, it’s customizable to meet any business or industry requirements. Ideal for turning prospects into partnerships!


8 diapositivas
Inbound and Outbound Value Chain Strategy Presentation
Streamline your supply chain insights with the Inbound and Outbound Value Chain Strategy Presentation. This structured layout highlights the key components of internal and external logistics—from sourcing and procurement to product delivery. Use this template to showcase strategic operations, process optimization, and value-adding activities. Fully editable in PowerPoint, Keynote, Canva, and Google Slides.