


Características


¿Tienes alguna pregunta?
Recomendar


5 diapositivas
Mind and Brain Creativity Concept Diagram Presentation
Ignite fresh thinking with the Mind and Brain Creativity Concept Diagram Presentation—a smart and visually engaging template that maps out five core concepts around a central brain icon. Each idea is linked with intuitive visuals and labeled A through E, ideal for creative strategy, innovation pitches, or mental model breakdowns. Fully customizable in PowerPoint, Keynote, and Google Slides.


5 diapositivas
Responsibility Assignment Using RACI Model Presentation
Visualize role clarity with the Responsibility Assignment Using RACI Model Presentation. This template helps define team responsibilities across four key roles—Responsible, Accountable, Consulted, and Informed—in a simple and clean radial layout. Ideal for aligning teams, assigning tasks, and preventing confusion. Fully customizable in PowerPoint, Canva, and Google Slides.


26 diapositivas
Rob Presentation Template
The Rob template is a presentation with an elegant and clean look. This template uses mostly a white and black color scheme, with the background image being a marble design to give a more sophisticated look. The presentation uses a lot of images to communicate. This template has slides dedicated to displaying photograph this is a great presentation to use if you have photos that you want to make a statement. It offers a bold design that is visually pleasing to the audience and encourages them to pay close attention. The template includes all the components needed for a successful presentation.


6 diapositivas
Project Rollout Milestone Timeline Presentation
Visually map out your project phases with the Project Rollout Milestone Timeline Presentation. Featuring a modern cylinder path layout, this slide is perfect for showcasing five key milestones in sequential or strategic order. Ideal for project managers and teams, and fully editable in Canva, PowerPoint, Keynote, and Google Slides.


20 diapositivas
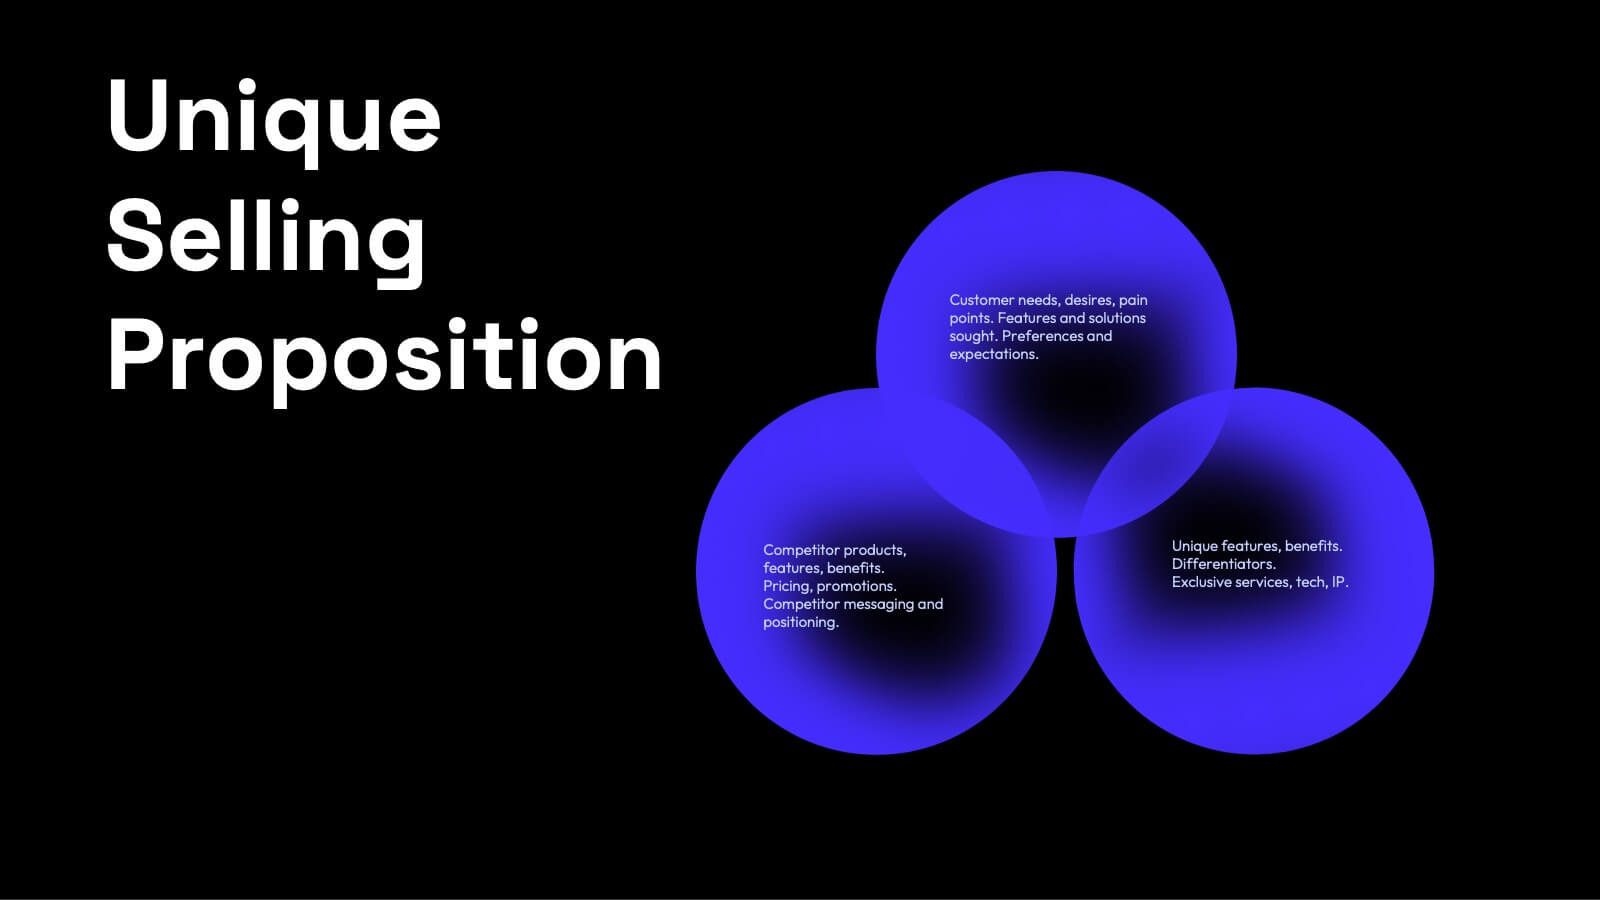
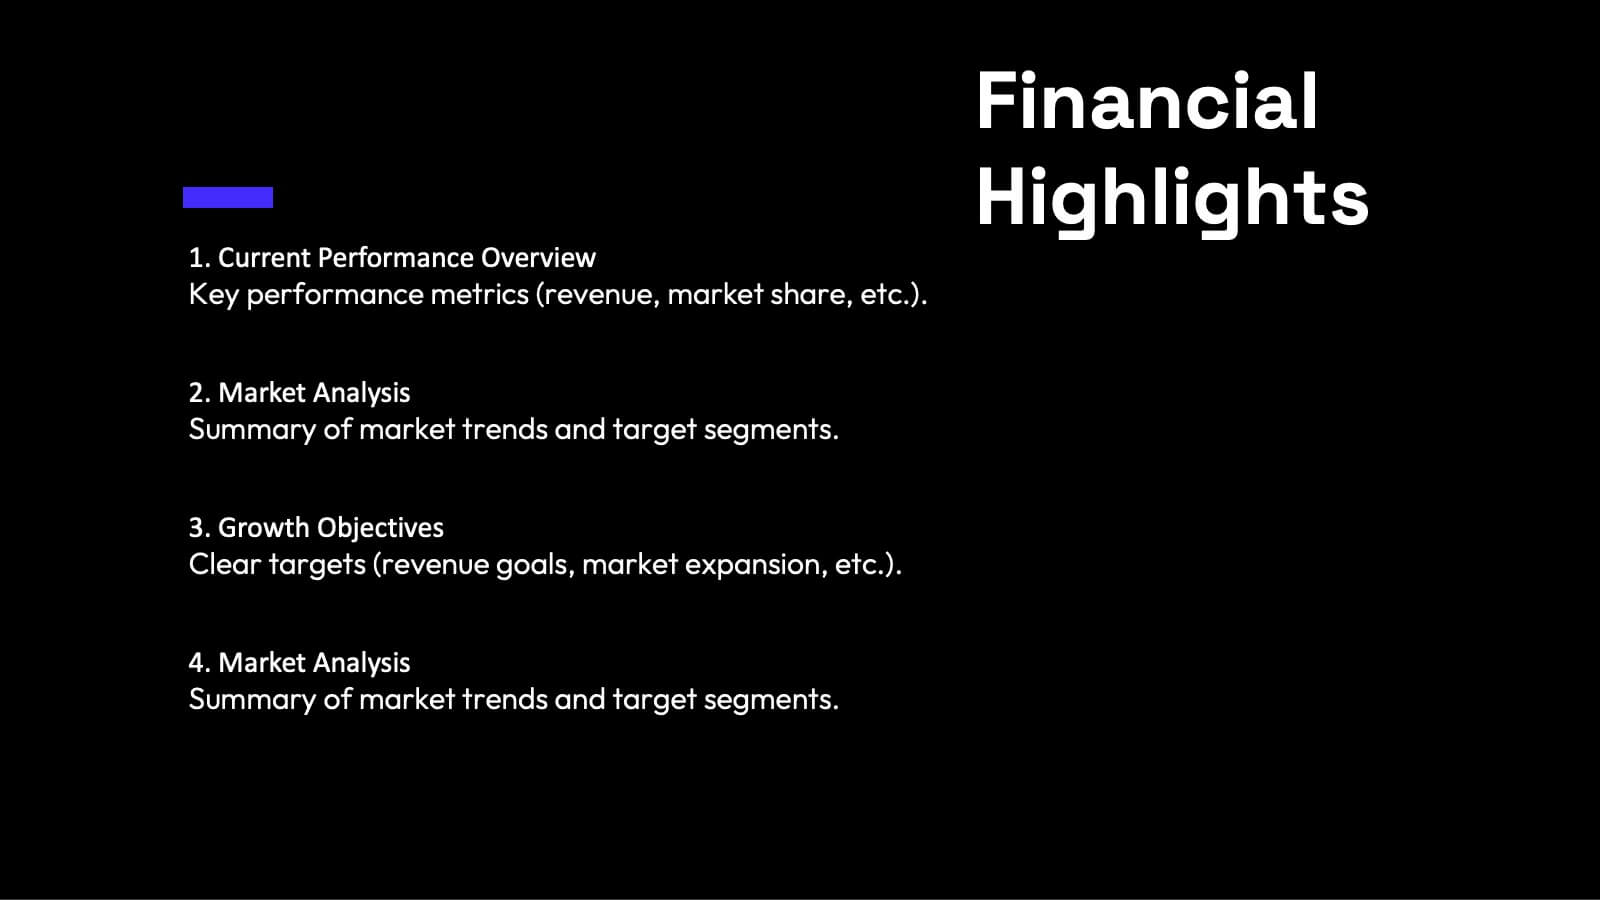
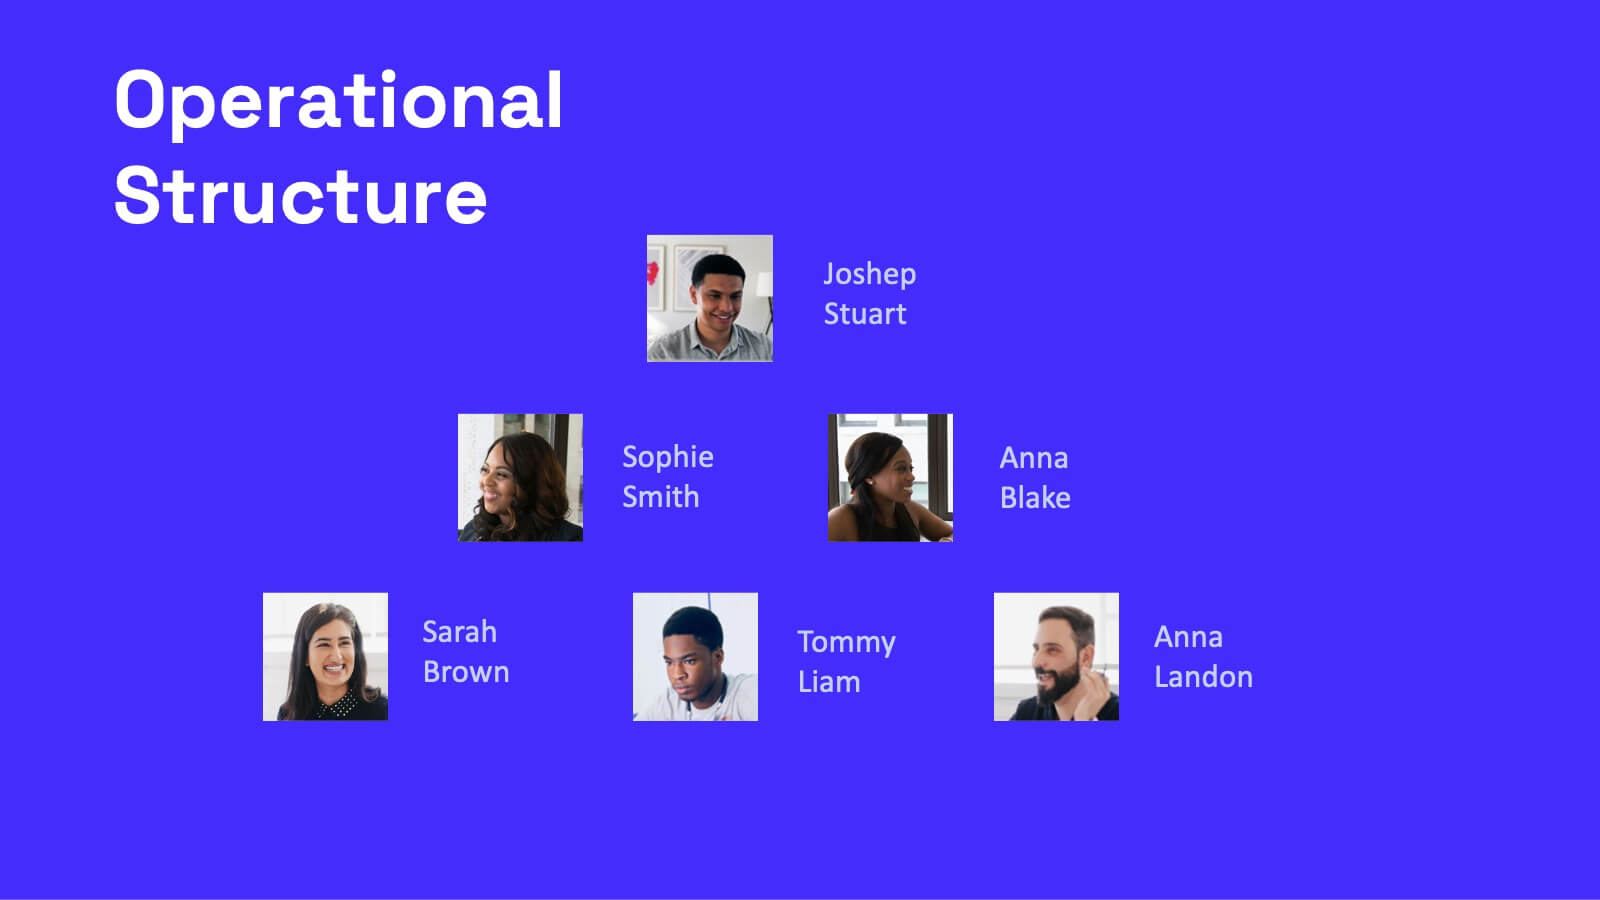
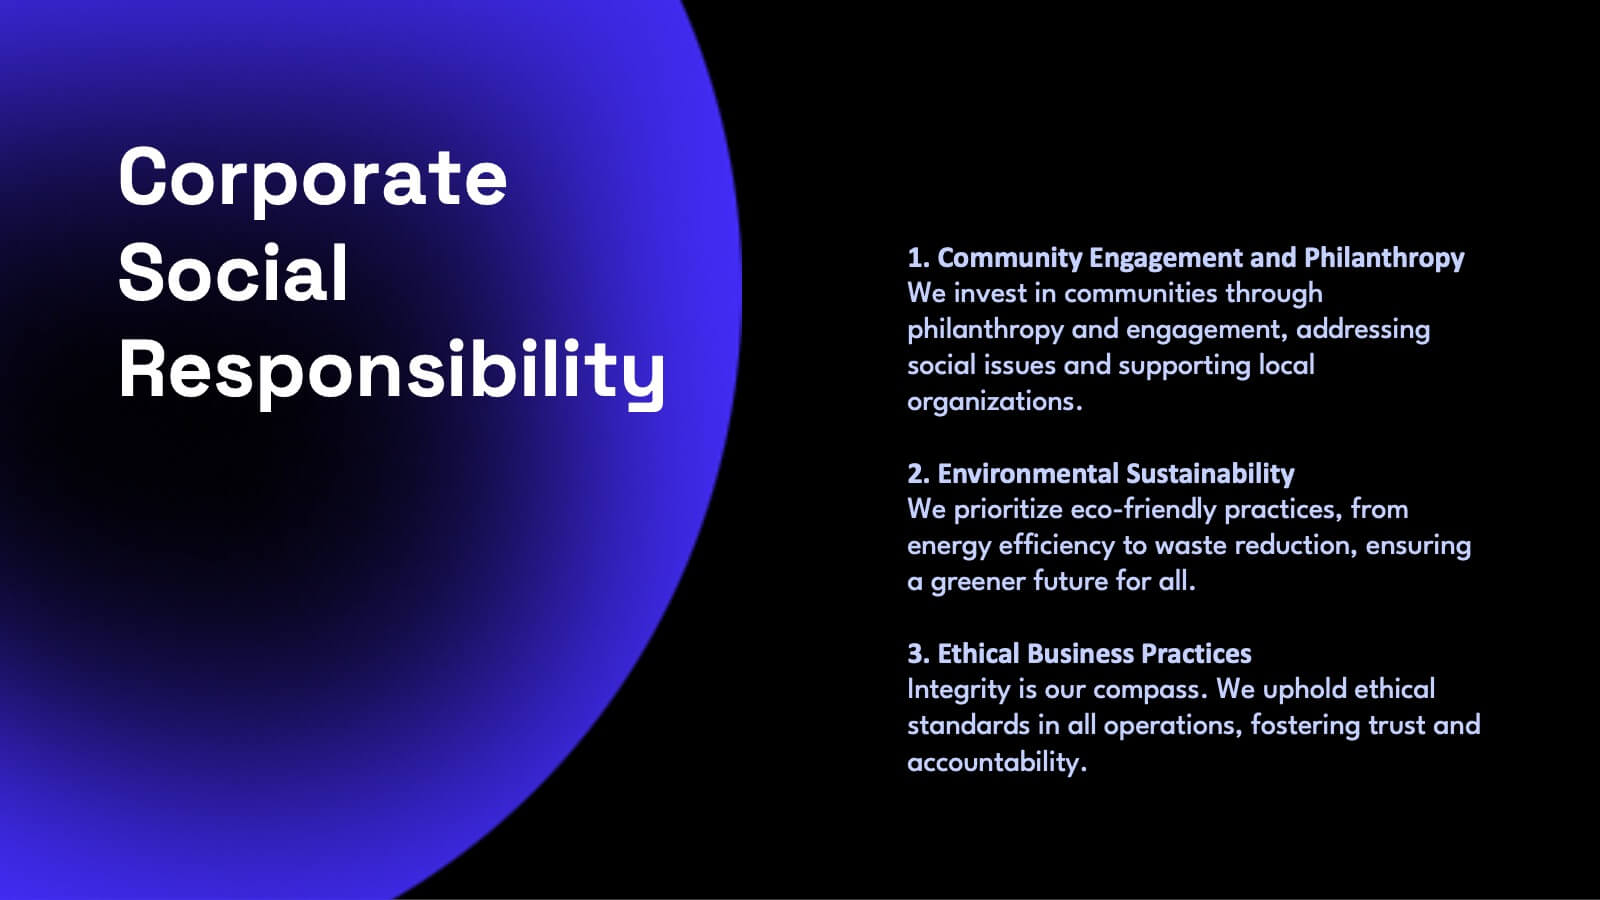
Apex Content Marketing Pitch Deck Presentation
Ignite your marketing strategy with this captivating pitch deck! Perfect for showcasing content marketing plans, it features slides on company history, target audience, and unique selling propositions. Make a lasting impression with sleek, modern designs and compelling content. Compatible with PowerPoint, Keynote, and Google Slides for a smooth presentation experience on any platform.


5 diapositivas
Marketing Strategy Wheel Diagram Presentation
Visualize your marketing framework in a clear and engaging way with this Marketing Strategy Wheel Diagram. Designed to highlight key components like audience targeting, communication channels, and campaign goals, this circular format brings strategy to life. Fully customizable and compatible with PowerPoint, Keynote, and Google Slides. Ideal for marketers, agencies, and branding professionals.


6 diapositivas
Personal Productivity Time Management Techniques Presentation
Streamline your workflow with the Personal Productivity Time Management Techniques presentation slide. Featuring a step-by-step staircase layout, this template visually maps out five core techniques or habits leading to improved efficiency and goal achievement. Each step includes an icon and placeholder text for easy customization. Ideal for productivity coaches, corporate trainers, or time management workshops. Fully editable in PowerPoint, Keynote, and Google Slides.


7 diapositivas
Europe Market Map Infographic
Journey through the intricate tapestry of the European market with our exquisitely crafted map infographic. Set against the refreshing backdrop of white, complemented by the depth of green and blue, our template encapsulates the multifaceted nature of Europe's vibrant market landscape. Augmented with precise infographics, symbolic icons, and country-specific image placeholders, it serves as an insightful guide to Europe's economic terrains. Flawlessly configured for Powerpoint, Keynote, or Google Slides. A priceless asset for business strategists, marketers, or any organization tapping into the European market. Navigate with insight; let every slide be a doorway to European market opportunities.


10 diapositivas
Digital Transformation Strategy Presentation
The "Digital Transformation Strategy Presentation" template is designed to clearly showcase the stages of digital transformation initiatives. It features a visually appealing layout with concentric circles or varying targets that focus on key elements of transformation strategy. This format is ideal for emphasizing the progression from planning to execution and monitoring of digital strategies. Each section is distinctly colored and provides a space for succinctly labeled titles and detailed descriptions, making it perfect for presenting strategic initiatives, technology implementation, or progress metrics in corporate settings. The template ensures that complex strategies are communicated in an understandable and visually engaging manner.


5 diapositivas
Analytical Chimestry Infographics
Analytical Chimestry Infographics is a bold, colorful, and modern presentation


4 diapositivas
Goal Breakdown and Success Metrics Presentation
Visualize achievement metrics with the Goal Breakdown and Success Metrics Presentation. This dynamic template features global maps, KPIs, and segment analysis to track progress and highlight results. Ideal for executives, project leads, or analysts. Fully customizable in PowerPoint, Keynote, and Google Slides for polished and insightful business presentations.


7 diapositivas
Milestones Credit Card Infographic Presentation
A Milestones Infographic is a visual representation of significant events, accomplishments, or achievements in a project, business, or individual's life. This template include timelines, graphs, diagrams, and other visual elements to help convey important information. You can use this infographic to cover many different topics, including project management, business growth, personal achievements, or company history. This template is useful for businesses or individuals who want to showcase their accomplishments, highlight important dates or events, or just share progress updates.


10 diapositivas
Cryptocurrency Market Trends
Highlight key movements in the crypto space with this 5-step 3D bar chart layout. Ideal for financial analysts, fintech startups, and blockchain professionals. Fully editable in PowerPoint, Keynote, or Google Slides—customize colors, text, and data to reflect your insights with precision.


7 diapositivas
Top Question for Beginners Infographic
Captivate your audience and enhance interaction with our collection of slide templates, perfect for engaging beginners and prompting them to ask top questions. These templates feature inviting designs and dynamic layouts, making them ideal for educational sessions, workshops, or any presentation aimed at beginners. Each template employs bright colors and creative graphics to draw attention and stimulate curiosity. The designs are crafted to not only pose questions but also to invite thoughtful responses and active participation. Whether you are hosting a seminar, leading a training session, or facilitating a learning module, these slides provide a friendly and approachable way to encourage questions and discussions. Customize these templates to suit your specific session, adapting the text, colors, and images to fit the theme and audience. They are a fantastic tool for educators and trainers looking to create a more engaging and interactive learning environment.


5 diapositivas
E-Learning and Digital Education Trends Presentation
Stay ahead in the digital learning space with the E-Learning and Digital Education Trends Presentation template. Designed for educators, trainers, and e-learning professionals, this modern and insightful layout highlights key trends, innovative tools, and strategies in online education. With fully customizable elements, you can tailor the slides to your audience’s needs. Compatible with PowerPoint, Keynote, and Google Slides for a seamless presentation experience.


5 diapositivas
Empathy to Ideation Process Framework Presentation
Visualize the journey from understanding user needs to generating innovative ideas with the Empathy to Ideation Process Framework Presentation. This slide features a side-profile silhouette and five clear, horizontal stages, each representing a key step in design thinking. Ideal for innovation workshops, UX strategy sessions, or educational use. Fully editable in Canva, PowerPoint, Google Slides, and Keynote.


21 diapositivas
Kyanite Small Business Pitch Deck Presentation
Make your business pitch stand out with this vibrant and engaging presentation! Featuring sections like project overviews, team updates, performance metrics, and collaboration opportunities, it helps convey your ideas with clarity and impact. Whether for internal reviews or investor pitches, this template works seamlessly with PowerPoint, Keynote, and Google Slides.