


Características


¿Tienes alguna pregunta?
Recomendar


5 diapositivas
North American Business Overview and Map Presentation
Showcase regional performance data across North America with this clean, data-driven map slide. Highlight four key statistics using pinpoint markers and modern percentage indicators. Ideal for market overview, financial reporting, or strategic insights. Fully customizable and compatible with PowerPoint, Keynote, and Google Slides for seamless business presentations.


10 diapositivas
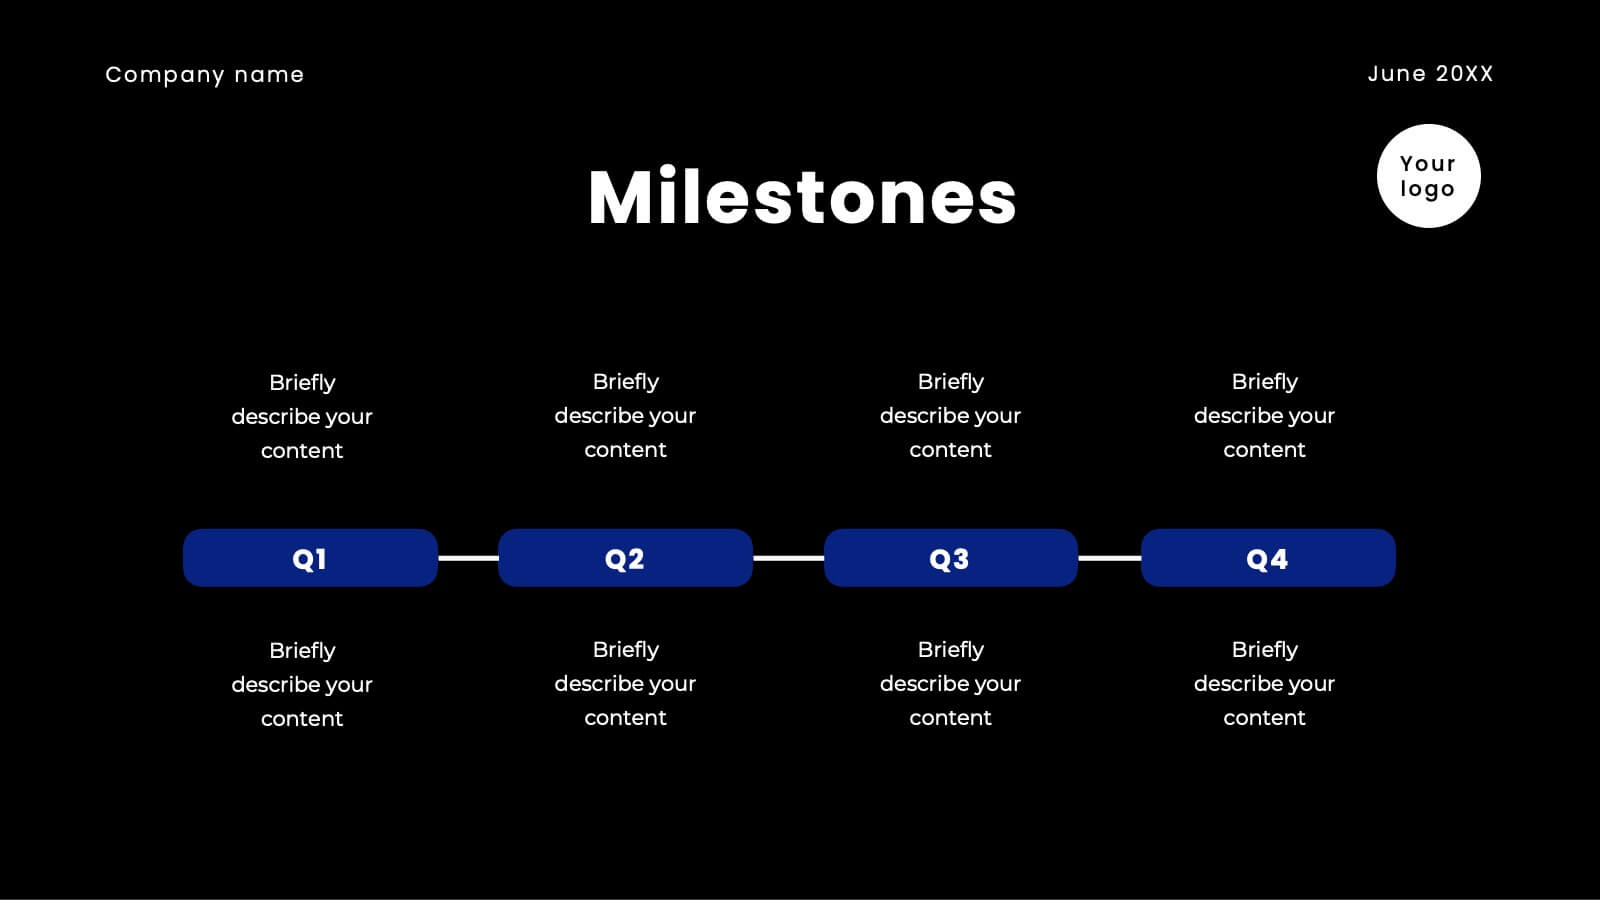
Remote Work Best Practices Presentation
Streamline your team's productivity with this Remote Work Best Practices presentation. Ideal for hybrid or fully remote businesses, this layout features five key steps illustrated in a connected visual path, helping communicate structure and flow. With a clean, modern design and editable sections, it's perfect for onboarding, policy training, or workflow optimization. Compatible with PowerPoint, Keynote, and Google Slides for easy customization.


5 diapositivas
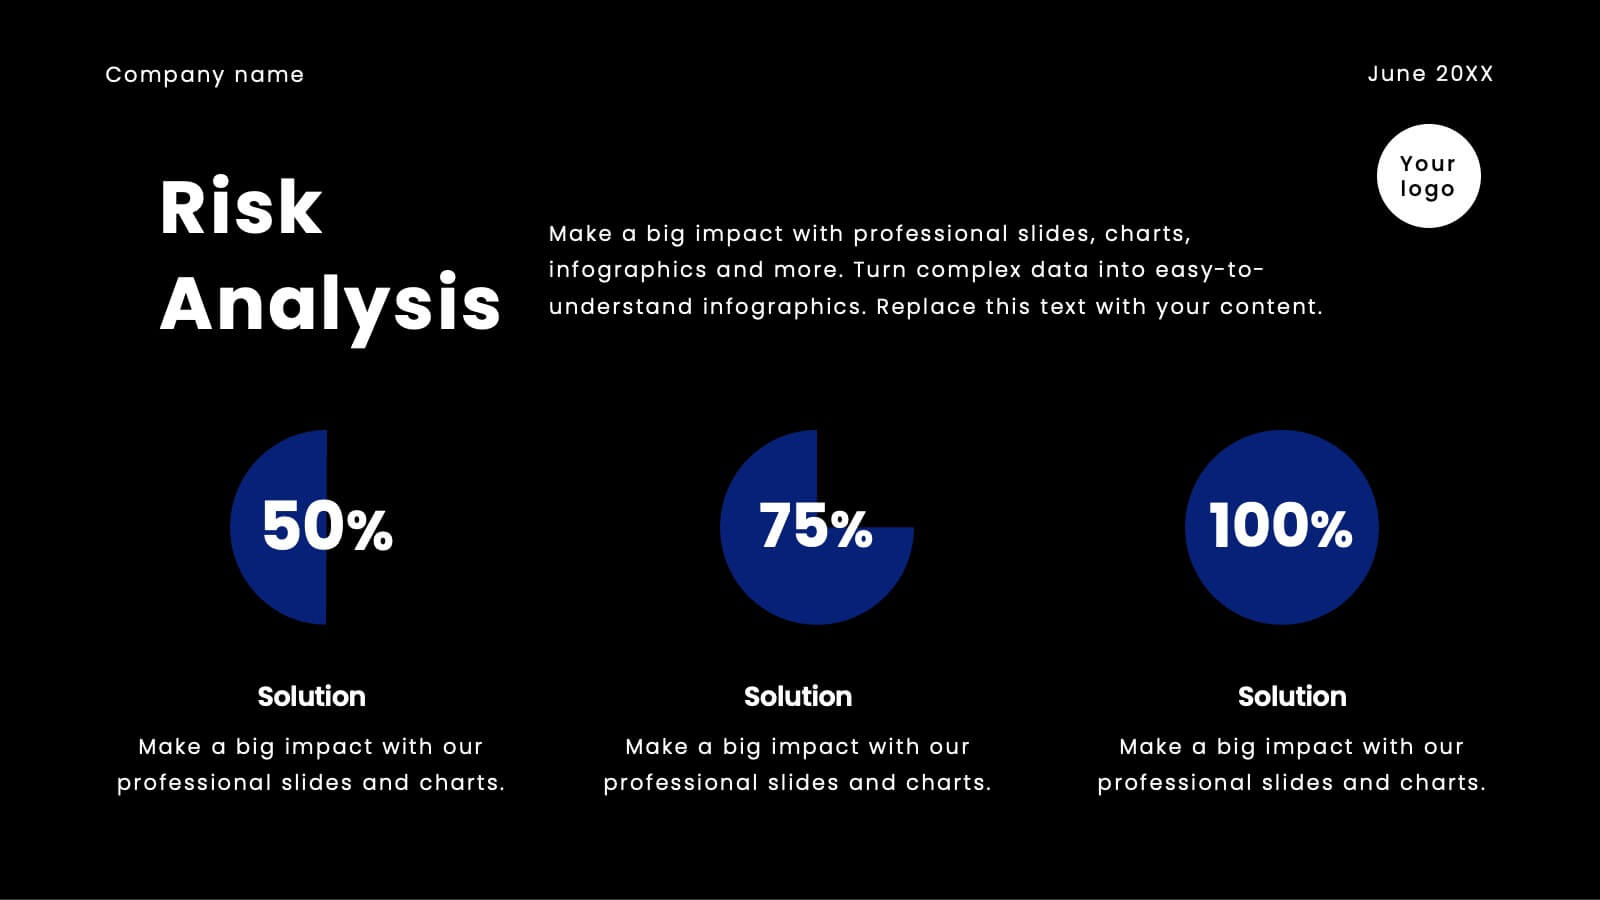
Comparative Assessment Using Harvey Ball Chart
Showcase multiple data points with clarity using this Comparative Assessment Using Harvey Ball Chart presentation template. Designed for visualizing progress, performance, or preference across 5 categories, each slide features Harvey Balls with percentage indicators, icons, and explanatory text sections. Ideal for business reviews, audits, or strategy discussions, this template helps communicate variances in an intuitive, side-by-side format. Fully editable in PowerPoint, Google Slides, and Keynote.

22 diapositivas
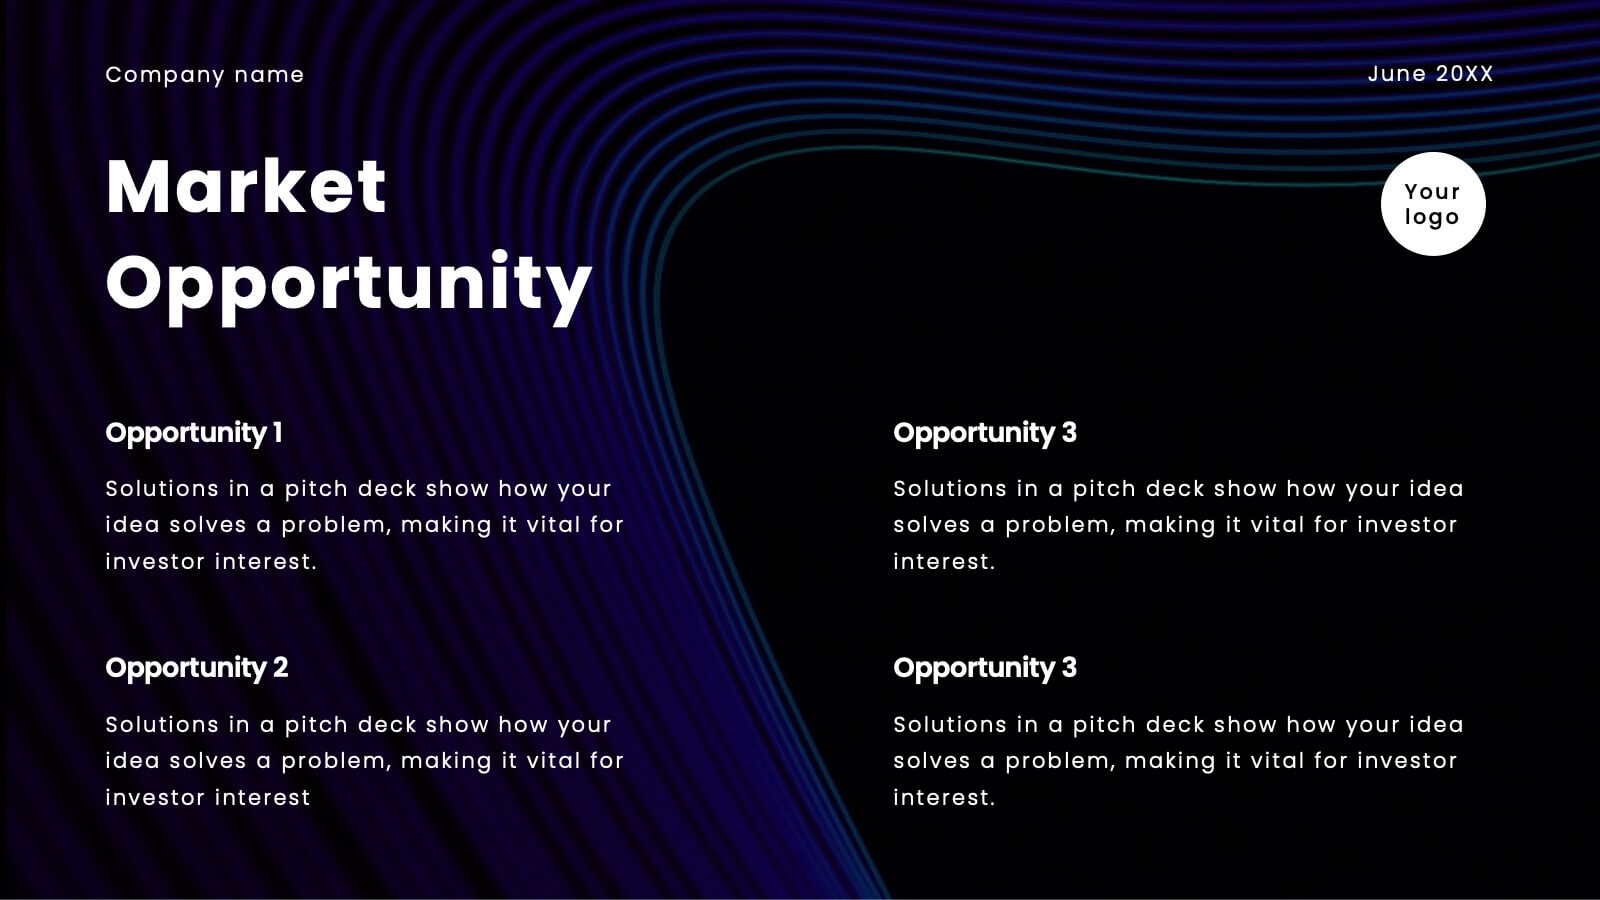
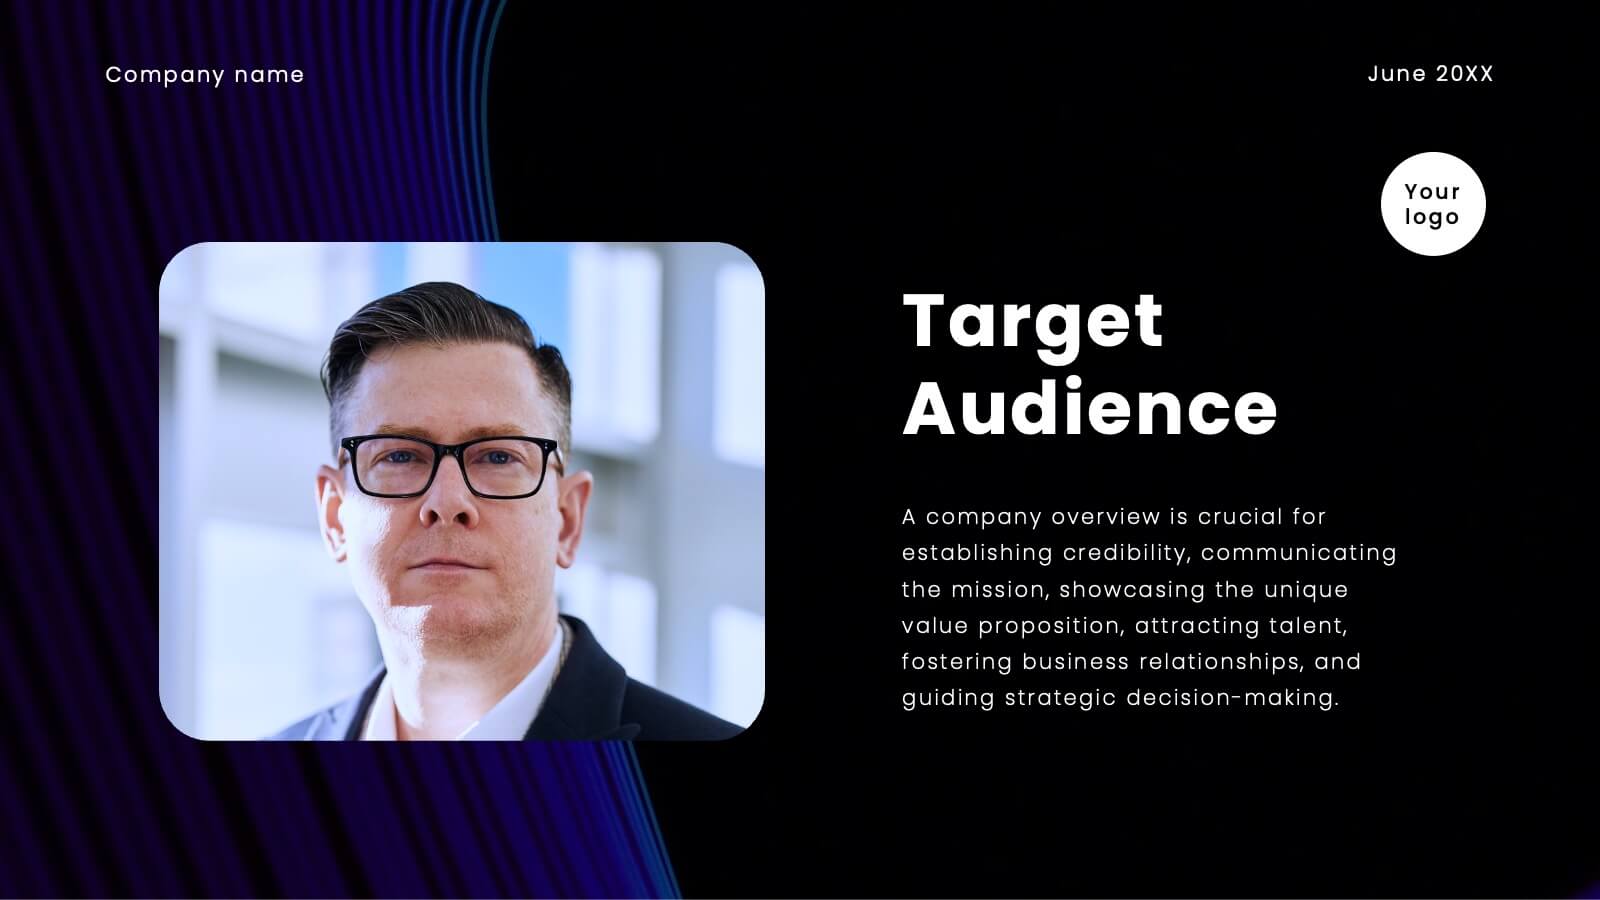
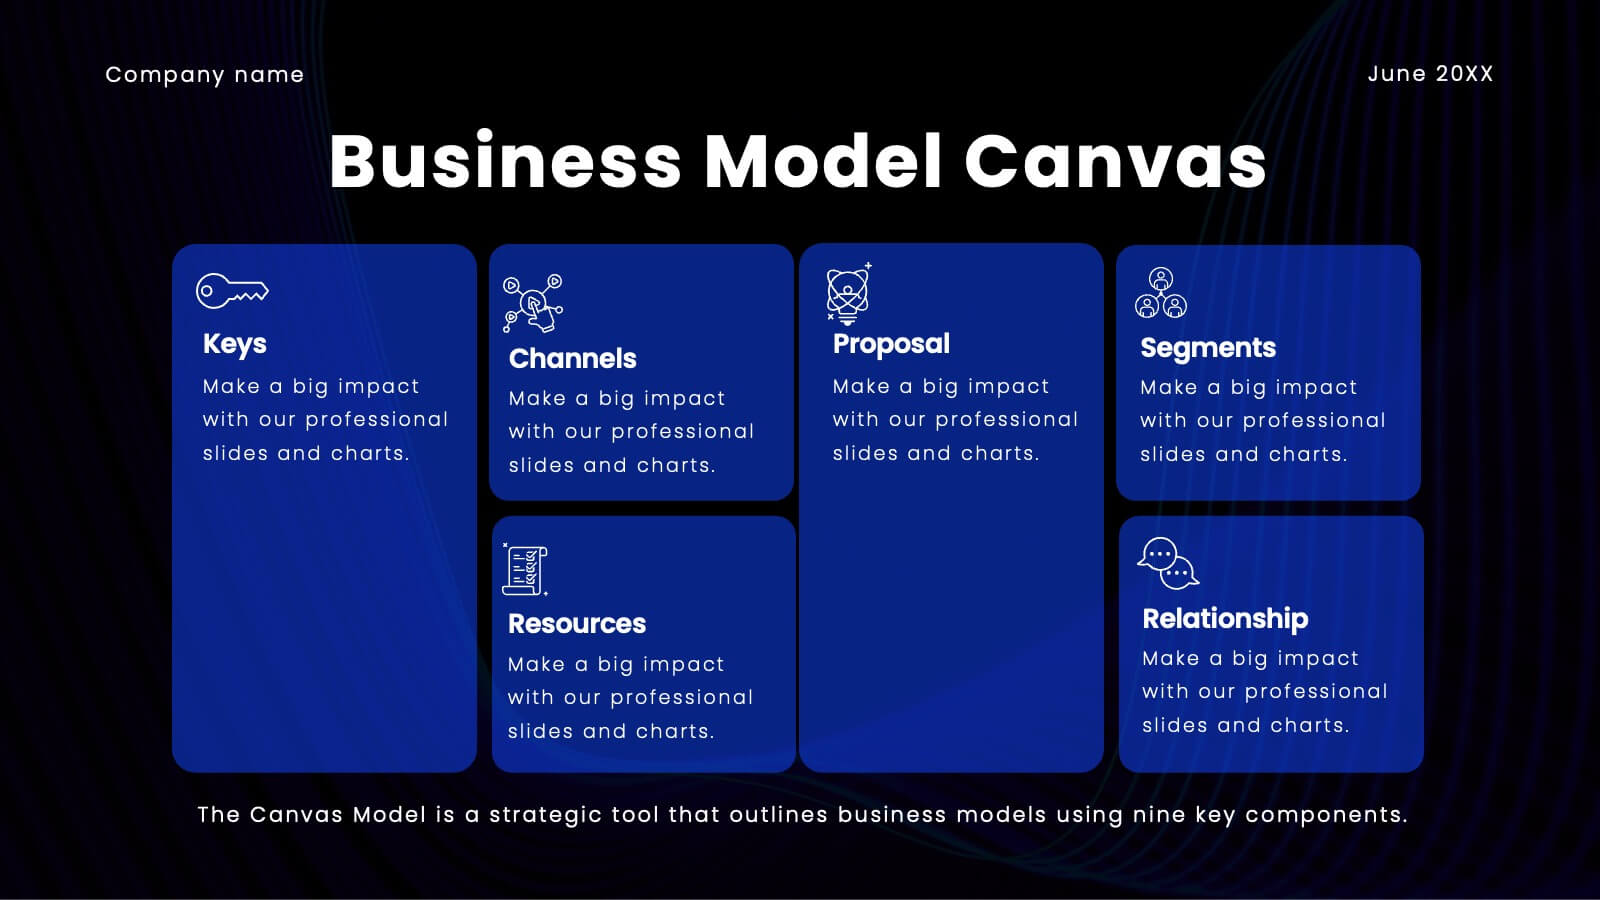
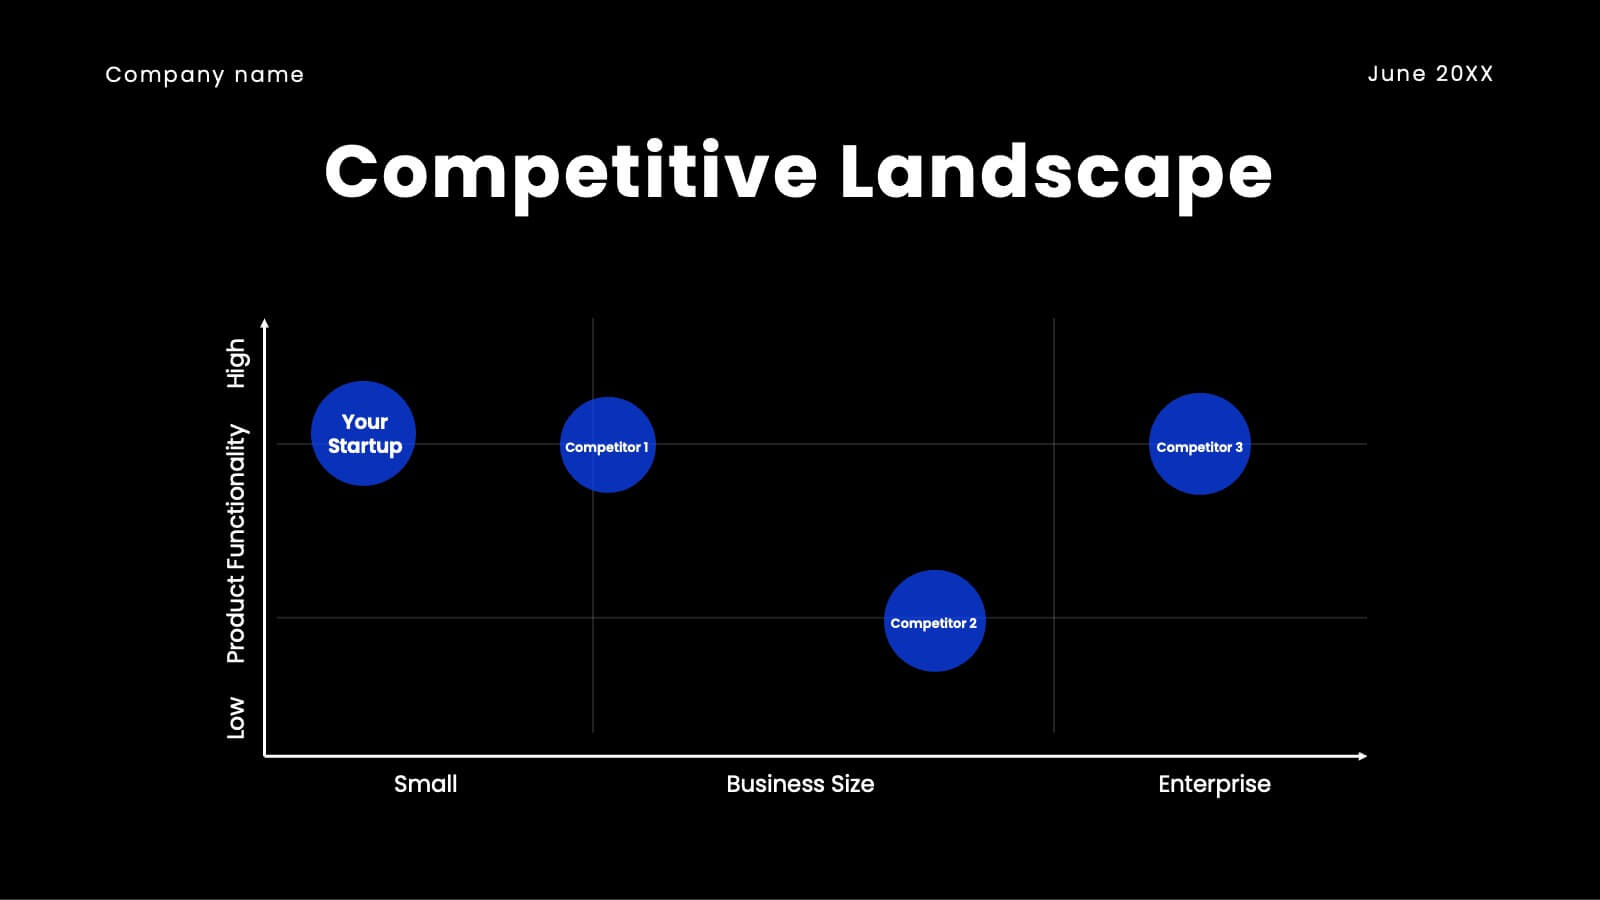
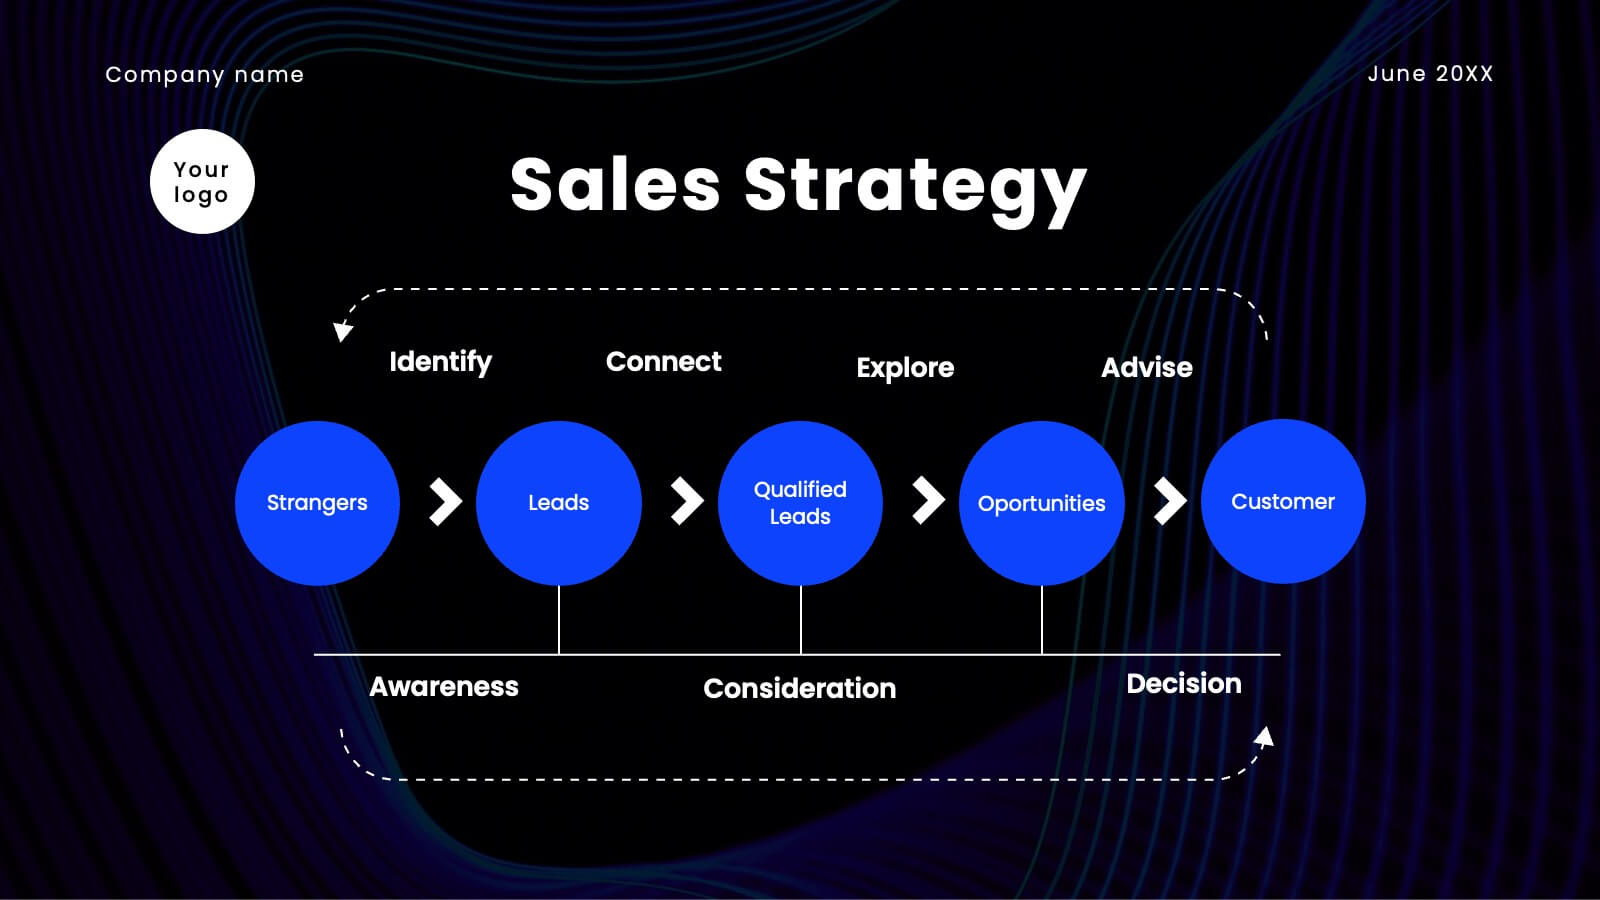
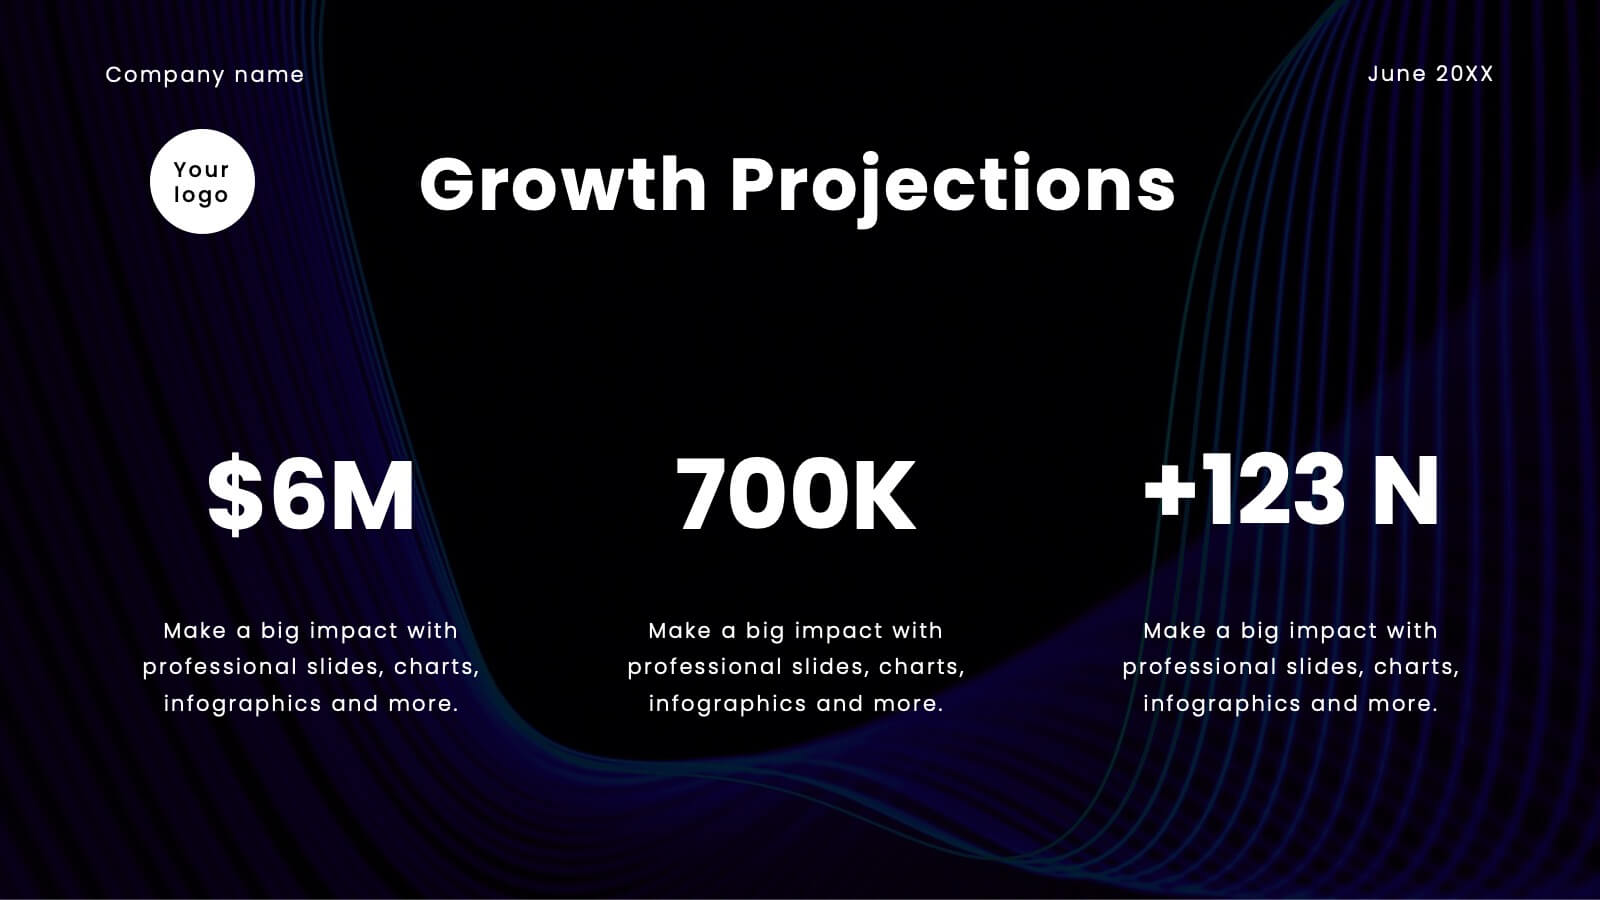
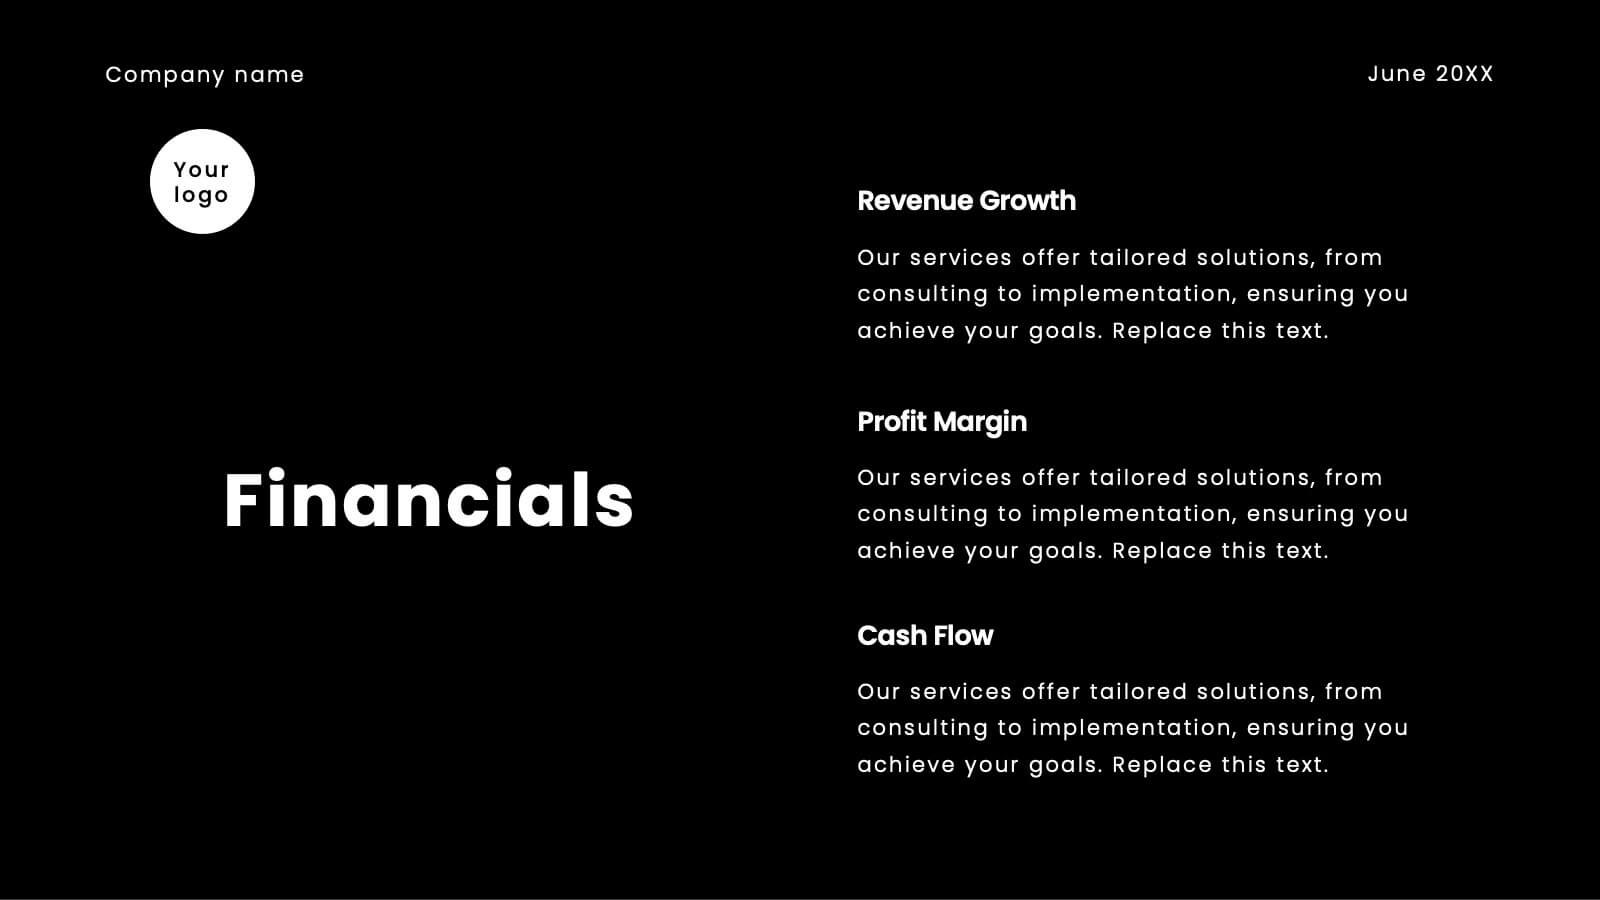
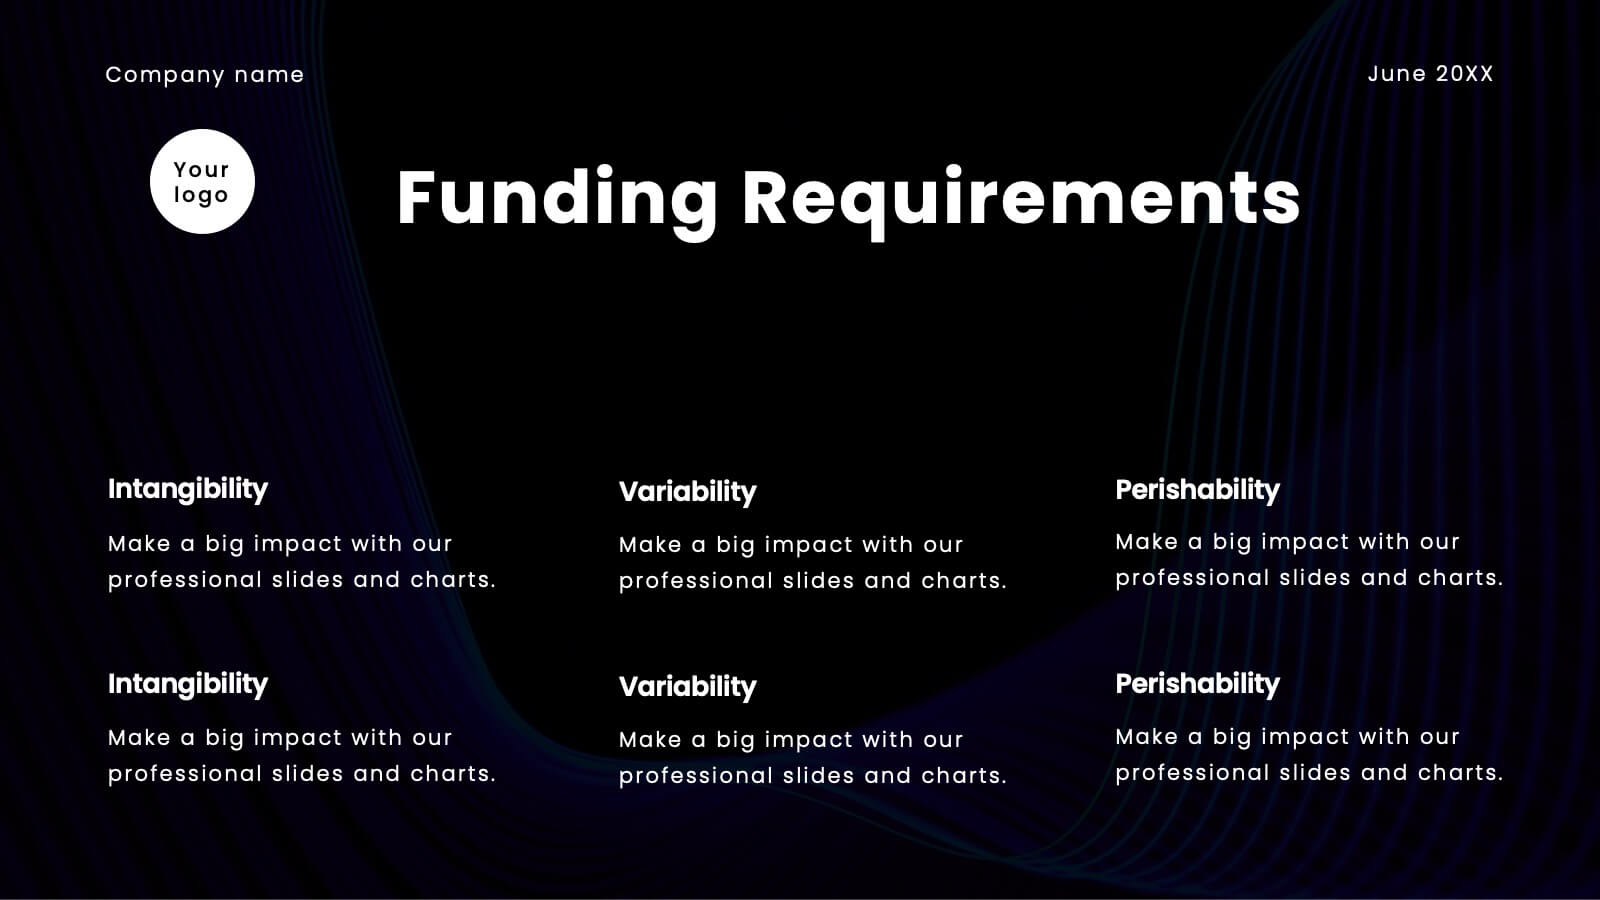
Jolt Business Idea Pitch Deck Presentation
Prepare to electrify your audience with a pitch deck that’s nothing short of spectacular! This high-impact template is designed to captivate, engage, and persuade your stakeholders with every slide. It’s more than just a presentation; it’s your gateway to showcasing your company’s unique value proposition, innovative solutions, and future growth potential in a way that’s visually stunning and incredibly compelling. From the moment you unveil your company overview to the final slide on financials and funding requirements, this template ensures your pitch is memorable, powerful, and impossible to ignore. The sleek, modern design highlights your strategic vision, competitive advantages, and market opportunities, making a bold statement that you’re ready to lead the future. Compatible with PowerPoint, Keynote, and Google Slides, this pitch deck template is your ultimate tool for turning heads and securing buy-in from investors, partners, and clients alike!


5 diapositivas
Types of Diabetes Infographics
Knowing the types of diabetes is very important for effective treatment, risk assessment, prevention, education, and research. Our Types of Diabetes Infographics provide information about the different types of diabetes. These infographics are designed to present key facts, statistics, and illustrations to help educate and raise awareness about the various forms of diabetes. They include vertical sections on symptoms, risk factors, diagnosis, treatment options, and prevention strategies. This can be a useful resource for individuals seeking to understand diabetes and promote awareness about the different forms of the condition.


7 diapositivas
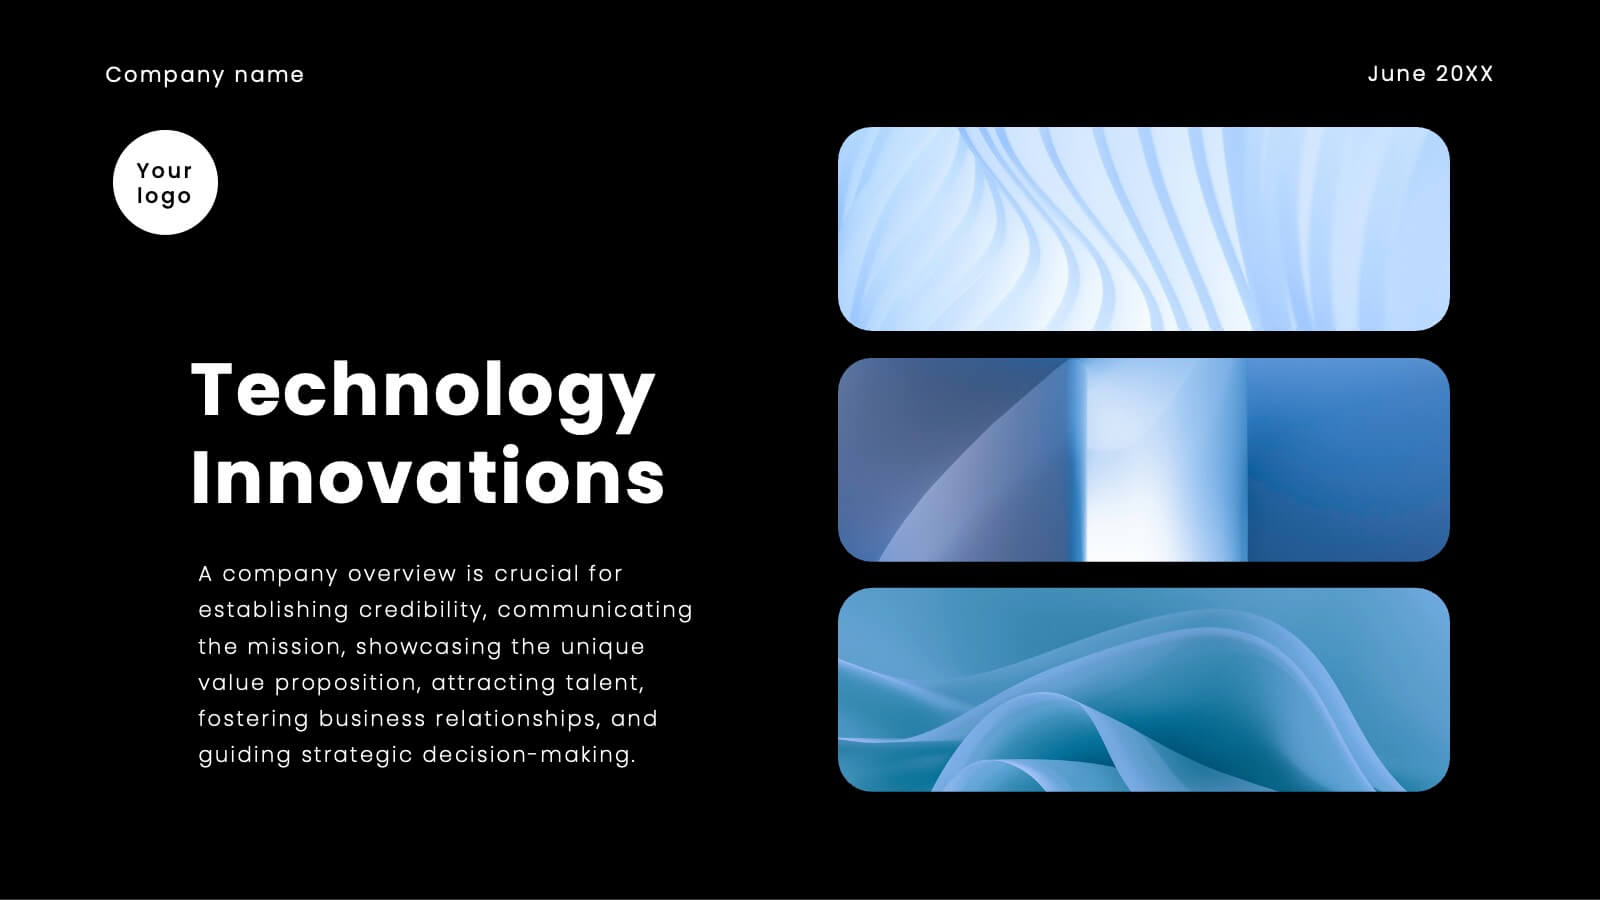
Technology Innovations Infographic
Technology innovations refer to significant and novel advancements, improvements, or creations in processes, products, services, or systems that introduce new features, functionalities, or approaches. Get ready to ignite the tech world with our technology infographic. This infographic will journey your audience into the cutting-edge world of technology. Prepare your viewers for a mind-blowing showcase of innovation and progress. Compatible with Powerpoint, Keynote, and Google Slides. Inspire action and invite readers to step boldly into a new era of technological innovations.


7 diapositivas
Strategic Highlights Executive Summary Presentation
Showcase your business priorities with the Strategic Highlights Executive Summary Presentation. This layout features up to seven colorful, clearly labeled content blocks—perfect for summarizing goals, KPIs, initiatives, or focus areas. Easy to edit in PowerPoint, Keynote, Google Slides, or Canva for quick customization and clean executive reporting.


24 diapositivas
Business Strategy Presentation
Streamline your strategic planning with our Business Strategy presentation template. It covers SWOT analysis, market trends, competitive landscape, and strategic initiatives. Ideal for business planners and strategists, this template is compatible with PowerPoint, Keynote, and Google Slides, ensuring comprehensive support for your strategic presentations.


7 diapositivas
E-Learning Infographic Presentation Template
An E-learning Infographic is an informative design that shows all the different ways that e-learning can be used in your classroom, as well as the benefits associated with each one. This infographic illustrates the popularity of e-learning and gives tips for creating compelling learning materials. This template is equipped with all the resources needed to create your e-learning infographic. It comes fully customizable and ready-to-use. This Infographic template provides a bare-bone structure and design, leaving space for you to add your own content and create the best presentation!


7 diapositivas
Transportation & Logistics Infographic PowerPoint Template and Google Slides Theme
A transportation & logistics infographic is a visual representation of information and data related to the movement of goods and people from one place to another. This template can be used to convey complex information about a variety of topics in the transportation and logistics industry. This template includes many graphics, images, and charts to help illustrate your data, and allows you to Input your shipping routes, delivery times, and flow of goods. This template can be used for various purposes, such as educating the public and promoting efficient transportation and logistics practices.


21 diapositivas
Somnara Full-Service Agency Project Plan Presentation
Present your agency’s expertise with a comprehensive project plan template designed to impress clients and stakeholders. This sleek and professional layout allows you to outline your mission and vision, highlight team strengths, and showcase core services with clarity. Use the client testimonials and case studies sections to establish credibility and trust. Visualize your strategic approach with dedicated slides for market analysis, creative process, and execution strategy. The template also includes detailed sections for partnership opportunities, social responsibility initiatives, and a future outlook, ensuring a holistic view of your agency’s capabilities and forward-thinking approach. Fully editable and compatible with PowerPoint, Google Slides, and Keynote, this template is perfect for full-service agencies seeking to elevate their presentations. Customize each slide to reflect your unique value and deliver impactful, results-oriented proposals.


6 diapositivas
Sustainability Assets Management Infographic
Sustainability management refers to the strategic planning, implementation, and monitoring of practices that promote environmental, social, and economic sustainability within organizations. This infographic template visually presents key elements and strategies for managing sustainability assets within an organization. Visualize the process of identifying sustainability assets within an organization. This template will allow you to explain how each sustainability asset contributes to the organization's overall value proposition. Incorporate icons or graphics that align with the organization's mission and goals.


5 diapositivas
Studio Photography Infographics
Studio Photography is the practice of capturing photographs in a controlled environment, typically a dedicated photography studio. These infographic templates highlight the key aspects of studio photography with examples of fashion photography, photojournalism, and photography terminology. These are designed to assist photographers, photography studios, and enthusiasts in showcasing the essential elements and techniques involved in capturing stunning images in a studio setting. Use these to provides valuable insights and techniques to help your audience create stunning images in a studio environment. Compatible with Powerpoint, Keynote, and Google Slides.


20 diapositivas
Blaze UX UI Design Pitch Deck Presentation
Craft a visually stunning pitch that brings your UX/UI design process to life with this sleek and modern presentation template. From concept development to final prototypes, each slide is designed to showcase research, wireframes, typography, and more with a seamless, professional aesthetic. Fully compatible with PowerPoint, Keynote, and Google Slides.


6 diapositivas
Corporate Training Program Presentation
Build excitement from day one with a sleek and modern visual! This presentation template is ideal for outlining your professional development plans, onboarding paths, or internal training milestones in a structured, step-by-step format. Fully editable and designed to impress, it works seamlessly with PowerPoint, Keynote, and Google Slides.


7 diapositivas
Phonetic Alphabet Infographic Presentation
An Alphabet Infographic is a type of visual representation that uses the letters of the alphabet to convey information or ideas in a creative way. This Alphabet Template is a perfect choice for your pre-school, high school and college to create visually appealing presentations. It helps you take ideas from your head and bring them alive with graphics and photos. This template design gives you an insight into the alphabet and includes the letters, as well as icons, some symbols, and a few numbers. The template also includes slides where you can include your facts, color options and much more.


6 diapositivas
Work From Home Opportunities Infographic
Work-from-home opportunities refer to job positions, projects, or tasks that allow individuals to work remotely from their own homes or any other location outside of a traditional office setting. This infographic template is a visual representation that provides information about different types of remote job opportunities and the benefits of working from home. This template can be divided into sections, to highlight specific categories of remote jobs. The images and icons are included to convey the idea of working from home, such as a home office setup or a person working on a laptop. This is compatible with Powerpoint, Keynote, and Google Slides.