

Características


¿Tienes alguna pregunta?
Recomendar


4 diapositivas
HR Management Strategy Presentation
An engaging, structured design that turns complex planning into a clear, visual story. This presentation guides audiences through essential strategic steps, helping teams understand goals, processes, and people-centered initiatives with ease. Clean icons and modern layouts keep every point focused and professional. Fully compatible with PowerPoint, Keynote, and Google Slides.


5 diapositivas
Business People Collaboration Overview Presentation
Showcase team dynamics with the Business People Collaboration Overview Presentation. This template uses a clean hexagon layout to highlight roles, responsibilities, or partnerships between individuals or departments. Ideal for collaboration strategies, organizational structures, or cross-functional workflows. Fully editable in PowerPoint, Canva, and Google Slides.


4 diapositivas
Cause-Effect Relationships Bowtie Format Presentation
Clearly illustrate the connection between causes and outcomes with the Cause-Effect Relationships Bowtie Format Presentation. Designed to simplify complex business logic, this layout uses a symmetrical bowtie shape to contrast contributing factors with resulting effects. Ideal for strategy, operations, or risk analysis. Fully editable in Canva, PowerPoint, Google Slides, and Keynote.


6 diapositivas
Cash Management Strategy Presentation
Break down your financial priorities with a bold, visual approach. This cash management slide uses a segmented dollar symbol to represent key areas like budgeting, reserves, expenses, and more—making it easy to track strategy points at a glance. Ideal for finance teams, planning sessions, or investor decks. Compatible with PowerPoint, Keynote, and Google Slides.


4 diapositivas
Finance Metrics Dashboard Presentation
Bring your numbers to life with a bold, visual dashboard that makes complex financial data instantly clear. This presentation helps you track revenue, returns, profit, and performance trends using clean charts and modern KPI blocks designed for quick insight. Fully compatible with PowerPoint, Keynote, and Google Slides.


4 diapositivas
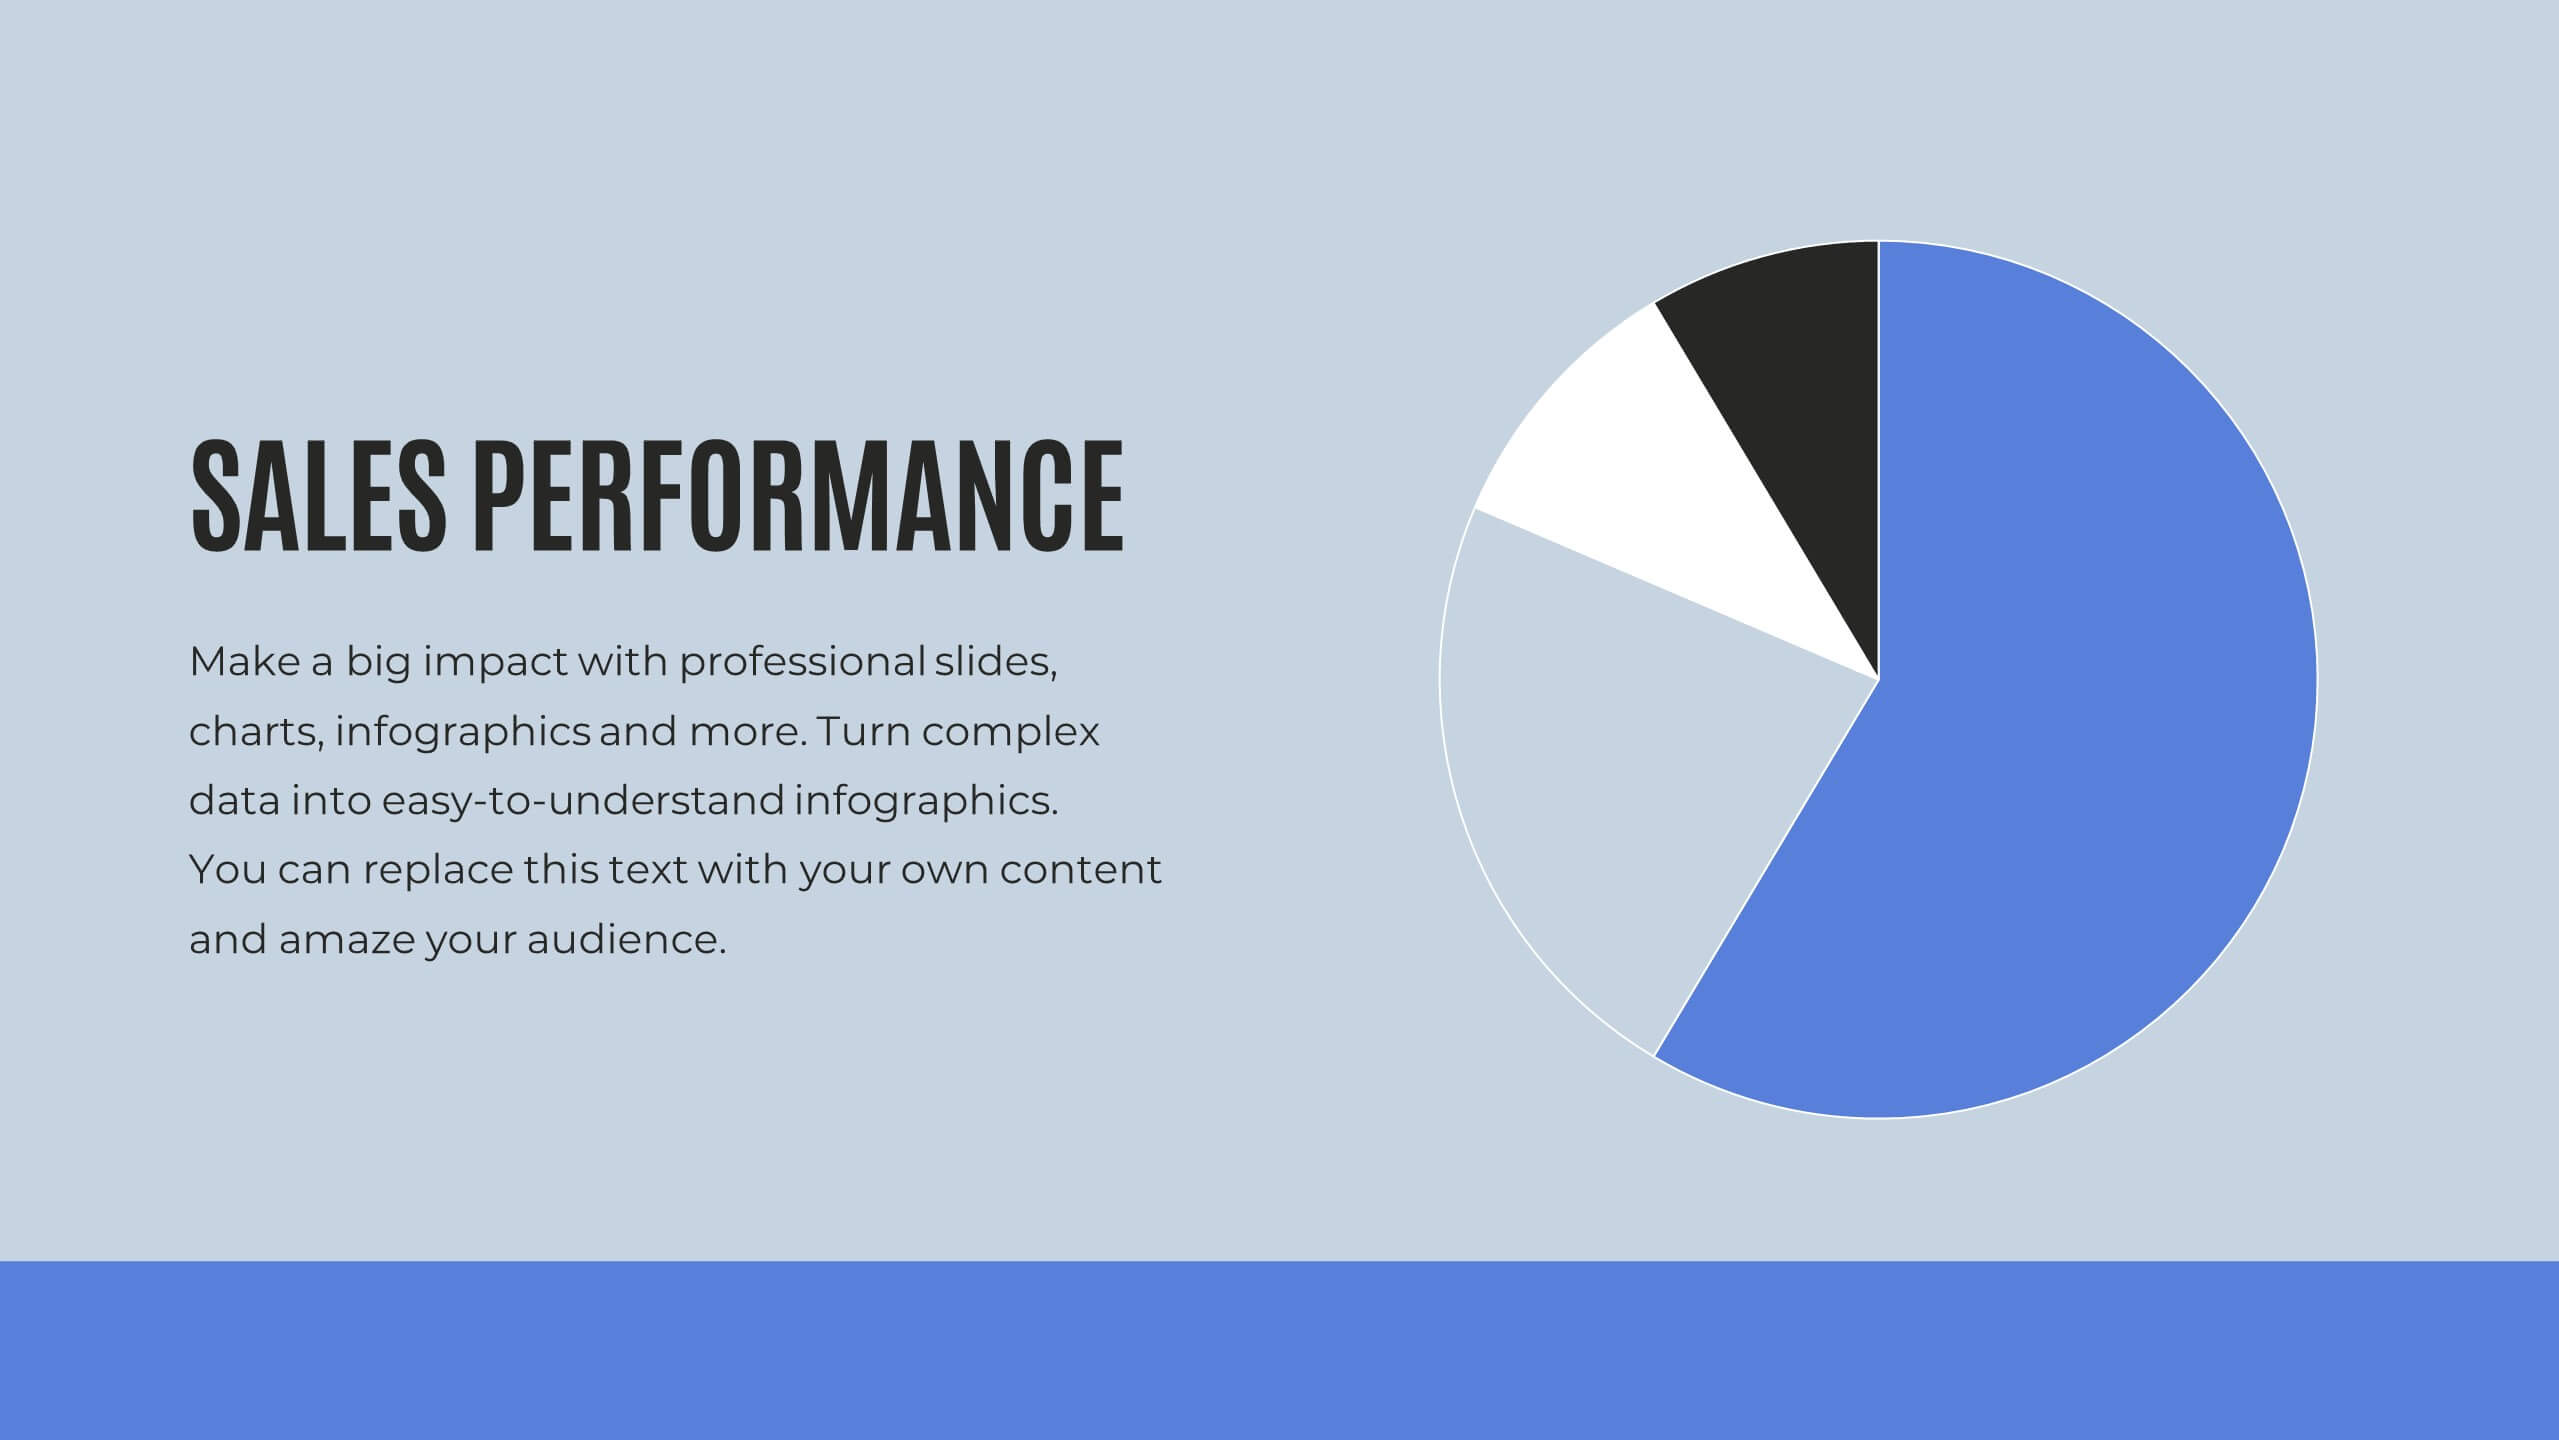
Sales Performance Heat Map Overview Presentation
Get a quick visual pulse on your data with the Sales Performance Heat Map Overview Presentation. Ideal for showing activity levels or trends across time, this slide uses a gradient color scale to help teams identify high and low performance instantly. Fully editable in Canva, PowerPoint, Keynote, and Google Slides—great for sales managers, team leads, and marketing analysts.


26 diapositivas
Ander Presentation Template
We are proud to present Ander a unique, creative and professional template that's perfect for creating inspiring presentations, portfolios and business documents. With this business presentation template, you can easily share your ideas, company identity, and other information more closely with the public in an easy-to-understand way. With light earthy tones, peaceful aesthetic, clean and aesthetically pleasing design you’ll be sure to make your business stand out from the rest of the competition.


6 diapositivas
Project Governance Plan Presentation
Bring clarity and energy to your workflow with this engaging presentation that visually breaks down key steps, responsibilities, and milestones in a structured process. Its clean layout helps audiences quickly understand project priorities and decision paths. Perfect for strategy meetings and stakeholder updates. Fully compatible with PowerPoint, Keynote, and Google Slides.


6 diapositivas
Project Timeline Calendar Presentation
Kick your planning into high gear with a clean, colorful layout that makes tracking progress feel effortless. This presentation helps you map tasks across the week, visualize timelines, and communicate project schedules with absolute clarity. It’s fully editable and works seamlessly in PowerPoint, Keynote, and Google Slides.


31 diapositivas
Astralis Brand Strategy Report Presentation
Present your brand strategy effectively with this well-structured presentation template. This comprehensive design covers all essential aspects, including vision and positioning, identity components, brand guidelines, and touchpoints. It is perfect for showcasing how your brand stands out, communicates, and connects with its audience. Highlight your unique selling points, ensure visual consistency with color palettes, and emphasize your brand's voice through tailored sections. This template is easy to customize and works seamlessly across PowerPoint, Google Slides, and Keynote, ensuring accessibility for all. Empower your brand strategy discussions with a professional and polished design.


26 diapositivas
Leadership and Management Skills Presentation
Elevate your leadership and management training with a presentation template that's as organized and efficient as it is visually appealing. The design is tailored for clarity, with a clean, contemporary layout that speaks to professionals eager to enhance their skills. Each slide is crafted with purpose, using a smart blend of graphics and space to highlight key concepts in leadership and management. This template includes a variety of slides to cover all training aspects: from the core qualities of a leader to the intricacies of team management. Graphs and charts provide a clear representation of management theories, while comparison slides help illustrate different leadership styles. Whether for a corporate training session, a workshop for budding entrepreneurs, or a classroom lecture, this set is ready for use in PowerPoint, Keynote, and Google Slides, making it a valuable tool for any leadership development program.


5 diapositivas
Retention and Loyalty Program Benefits Presentation
Showcase the value of your loyalty strategy with the Retention and Loyalty Program Benefits presentation. This template clearly communicates reward tiers, membership perks, and engagement incentives using a card-based visual structure. Perfect for marketing presentations, customer success teams, and subscription-based business models. Fully customizable in PowerPoint, Keynote, and Google Slides.


4 diapositivas
Company Vision and Long-Term Goals Presentation
Present your company’s future with clarity and impact using this Company Vision and Long-Term Goals slide. Featuring a bar chart-style graphic with ascending growth stages, this template allows you to showcase strategic milestones, business values, or development phases. Each bar is paired with icons and editable text to highlight specific goals, making it ideal for leadership meetings, strategic planning, or investor pitches. Clean, modern, and customizable in PowerPoint, Keynote, and Google Slides.


26 diapositivas
Boost Presentation Template
Our Boost Crossfit Gym Presentation is a great template for getting your target audience motivated. With it, you can create an attractive and informative presentation that contains the most relevant information about your business. This template has an appealing design that will help you convey your message in a professional and interesting way. Our template comes with a ton of customizable sections, which will help you achieve all your presentation goals. You can easily customize this template to match your brand, add some unique header slides and get your own unique style going!


5 diapositivas
Employee Training Roadmap Presentation
Take your team on a visual journey that maps out success, one milestone at a time. This roadmap presentation is perfect for outlining employee training stages in a clear, engaging way. Each point leads naturally to the next. Fully editable and compatible with PowerPoint, Keynote, and Google Slides for seamless use.


6 diapositivas
Porter’s Value Chain Analysis Presentation
Give your strategy story a powerful lift with a clean visual layout that makes every activity in your organization feel connected and purposeful. This presentation explains primary and support processes in a way that helps teams identify strengths, gaps, and opportunities for improvement. Fully compatible with PowerPoint, Keynote, and Google Slides.


6 diapositivas
Best Solution Proposal Presentation
Present your ideas with clarity and confidence using this modern, structured layout that highlights problems, opportunities, and proposed solutions step by step. Ideal for showcasing strategies or business improvements, it keeps information organized and persuasive. Fully compatible with PowerPoint, Keynote, and Google Slides for effortless customization and presentation.