


Características


¿Tienes alguna pregunta?
Recomendar


21 diapositivas
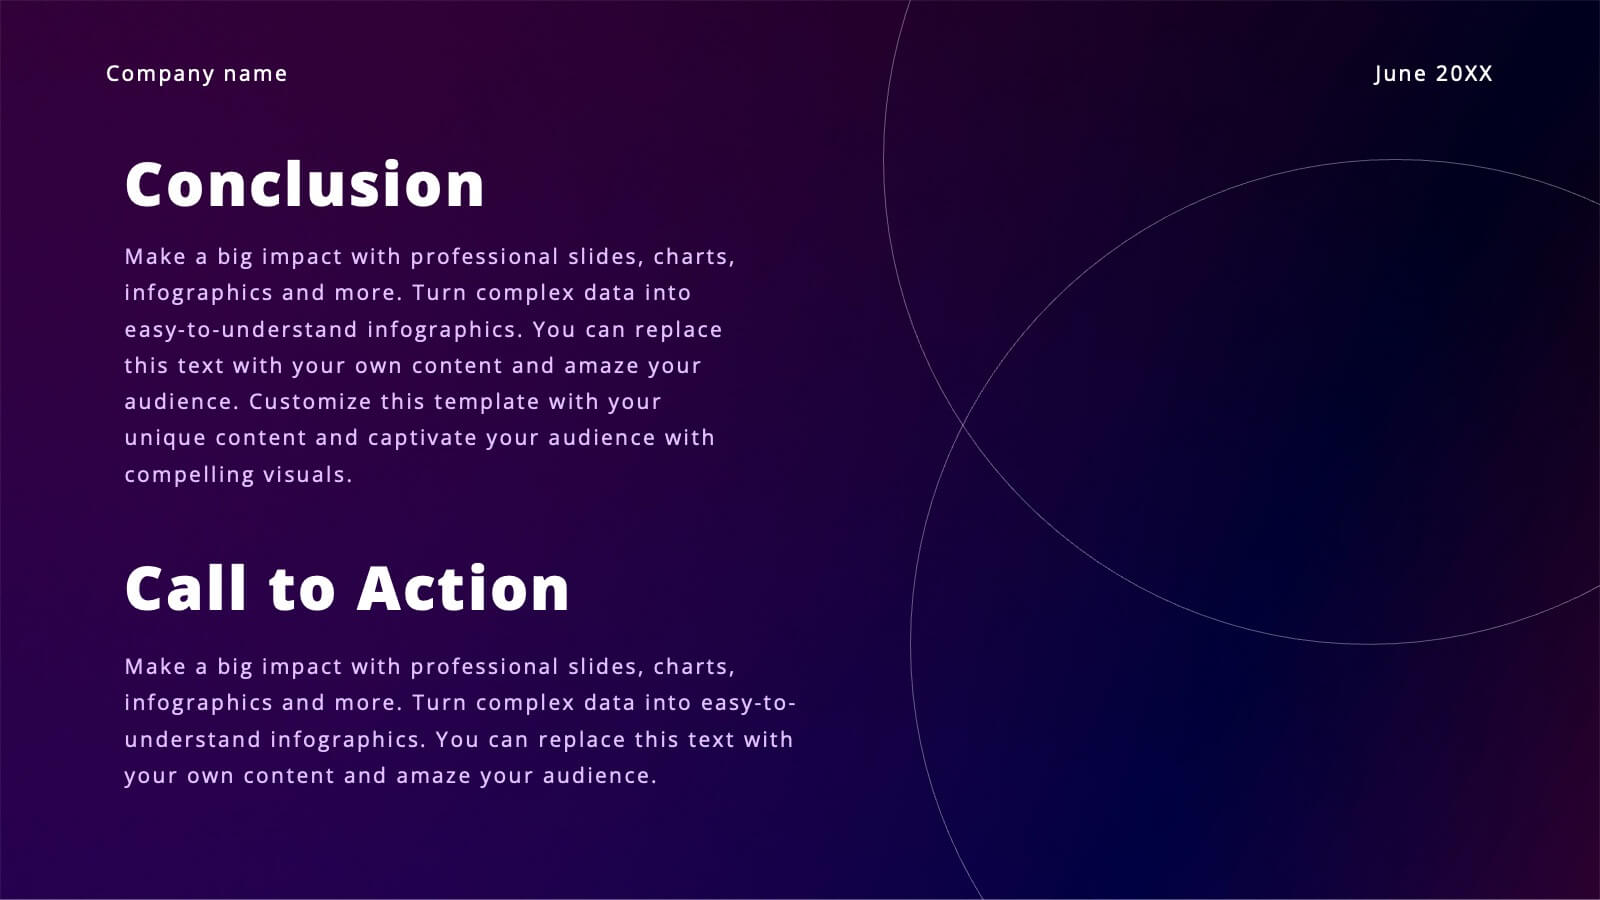
Solara Business Strategy Presentation
Craft a winning plan with this comprehensive business strategy presentation! It covers essential sections like market analysis, SWOT, strategic initiatives, and performance metrics, helping you align goals and opportunities. Perfect for executive meetings or stakeholder reviews, this template ensures seamless collaboration. Fully compatible with PowerPoint, Keynote, and Google Slides.


7 diapositivas
Geometric Infographic Presentation Template
Our Geometric Infographic template will help you quickly create an original, beautiful and professional presentation with charts and diagrams of any kind. The template includes fully editable slides with a number of built-in shapes, as well as transitions. You can use the template for any kind of presentation involving geometrics. It’s ideal for product presentations and market analysis, but you can also use it to showcase your business case. This geometric Infographic template is a great way to present a large amount of information to an audience and features a clean and modern design!


5 diapositivas
Eco-Friendly Practices Implementation Presentation
Brighten your message with a clean, circular design that maps out every green initiative step-by-step. This visual template illustrates key eco-conscious actions, helping you present sustainable practices with ease. Perfect for environmental reports, team strategies, or policy pitches. Fully compatible with PowerPoint, Keynote, and Google Slides for flexible editing.


7 diapositivas
Decision Steps Infographic
Decision-making is a pivotal aspect of any business journey. This decision steps infographic, designed in a harmonious blend of green, white, and blue, effortlessly maps out the complexity of such decisions. It offers a structured, graphical representation of the pathways that lead to informed choices. Executives, project managers, and team leaders will find this tool indispensable when guiding teams and stakeholders through the labyrinth of options. Enhanced to work seamlessly on PowerPoint, Keynote, and Google Slides, this infographic stands as a beacon for those navigating the multifaceted terrains of business decisions.


4 diapositivas
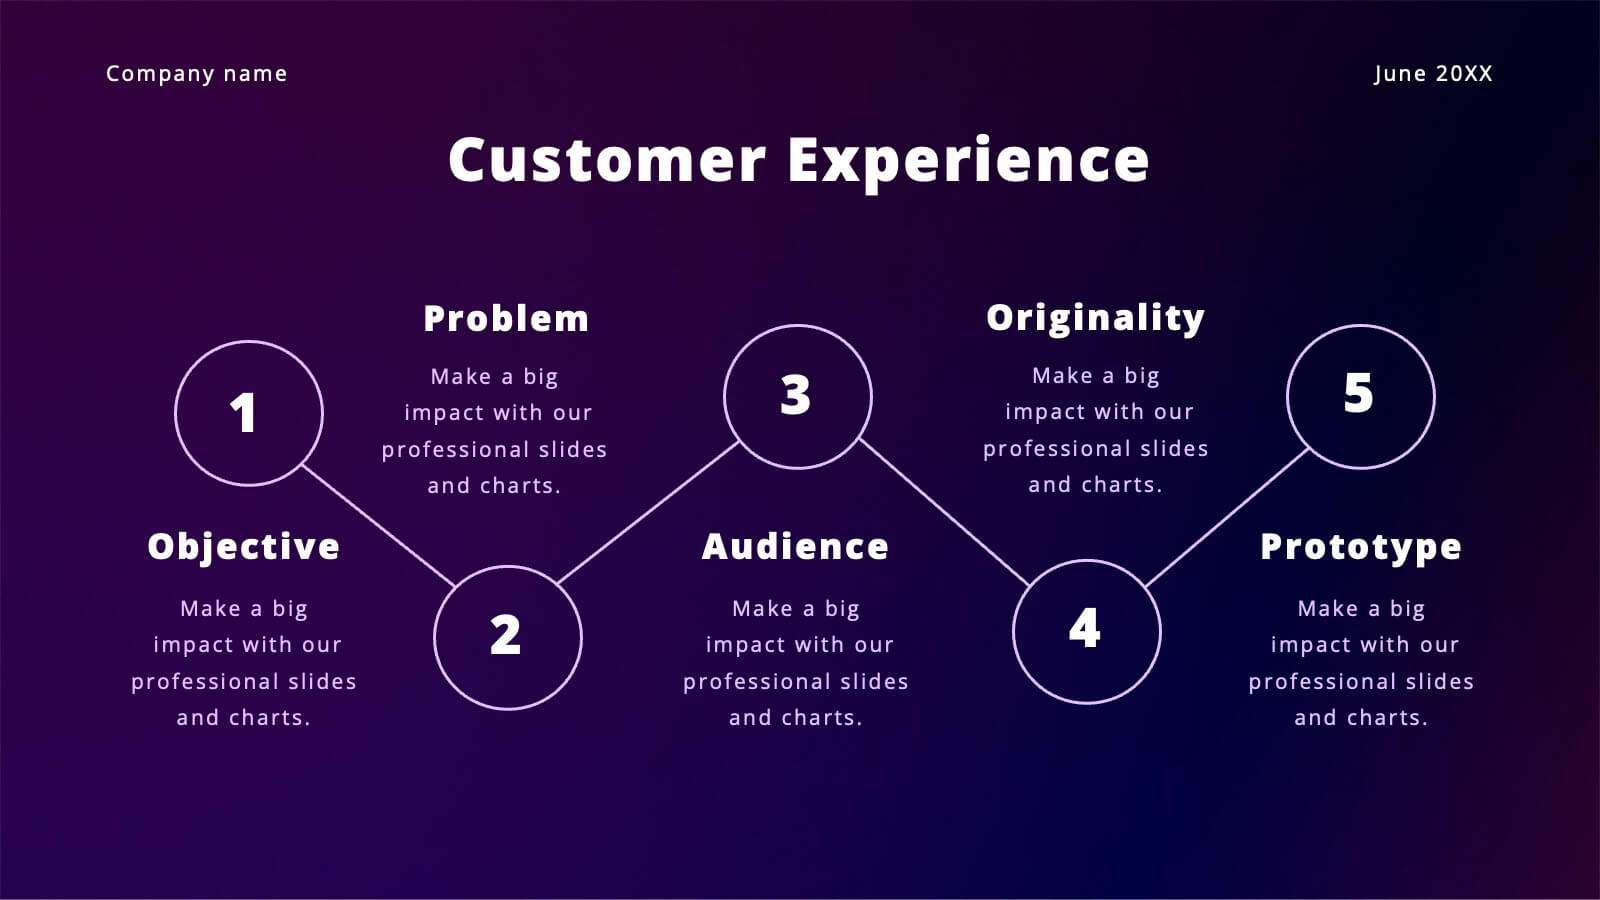
Case Analysis for Executive Decision Making Presentation
Guide stakeholders through data-driven insights with the Case Analysis for Executive Decision Making Presentation. This layout uses a clear upward progression with labeled steps to showcase milestones, challenges, or strategic outcomes—perfect for leadership meetings or high-level reviews. Fully customizable in PowerPoint, Keynote, and Google Slides.


7 diapositivas
Project Schedule Infographics
The Project Schedule Infographic offers a dynamic and clear visual representation of project timelines and tasks. Fully compatible with PowerPoint, Google Slides, and Keynote. It is designed to facilitate project managers, team leads, and members in tracking milestones and deadlines effectively. The infographic breaks down the week into individual days and assigns specific tasks and goals to each, allowing for a comprehensive overview of the project's progression. This schedule template is not only a tool for maintaining organization within a team but also acts as a communication aid to provide updates at a glance.


6 diapositivas
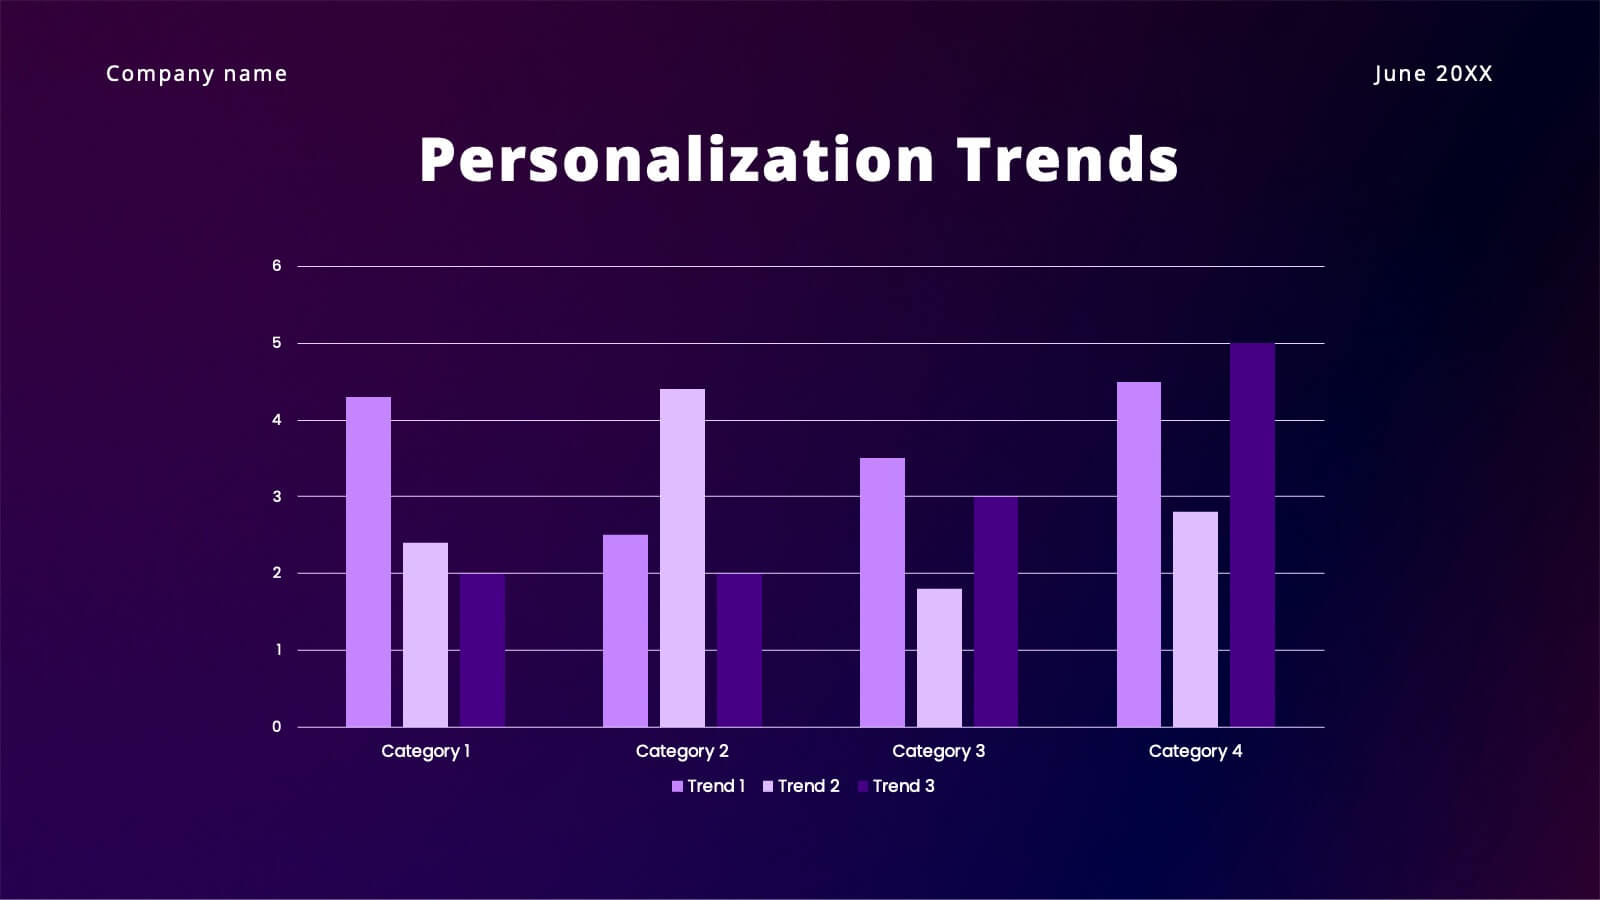
Website Optimization and Traffic Insights Presentation
This infographic set helps break down complex analytics into bite-sized, visually engaging pieces. Use these slides to highlight traffic sources, performance metrics, user journeys, and conversion flows in a circular format that keeps viewers focused. These templates are fully customizable and compatible with PowerPoint, Keynote, and Google Slides.


6 diapositivas
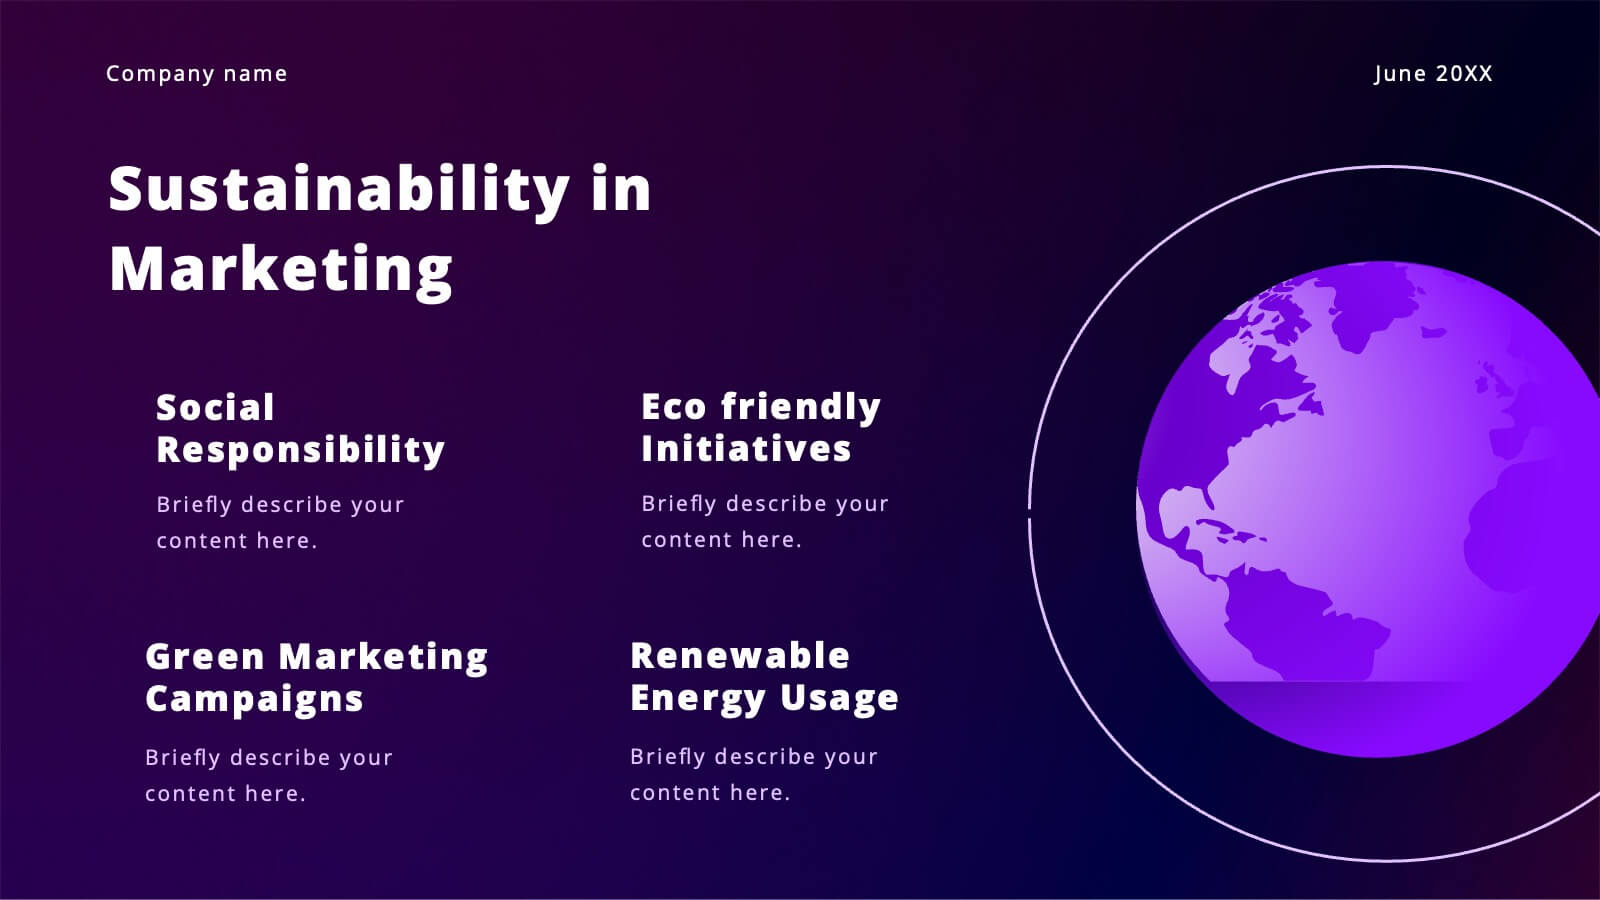
Green Energy and Ecology Presentation
Ignite your audience’s curiosity with a clean, modern layout that brings eco-friendly ideas to life. This presentation helps you explain renewable energy concepts, sustainability benefits, and environmental impact in a clear, structured way that feels fresh and inspiring. Fully compatible with PowerPoint, Keynote, and Google Slides.


6 diapositivas
Business Model Canvas Resources Infographic
Embark on a journey through the essential concept of the Business Model Canvas (BMC)! This infographic serves as your gateway to understanding how this versatile tool can revolutionize your business strategy. From identifying key elements to optimizing your business model, we reveal the secrets that make the BMC an invaluable resource. Discover how the BMC can guide you in crafting a sustainable and adaptable business strategy. Learn to align your resources, activities, and customer focus to achieve competitive advantage. Explore real-world examples of successful businesses that have leveraged the BMC to innovate and grow. With this engaging infographic, compatible with PowerPoint, Keynote, and Google Slides, sharing your understanding of the Business Model Canvas is effortless. Empower yourself with the knowledge to revolutionize your business approach. Dive into the world of the BMC and embark on a journey of strategic exploration and innovation.

20 diapositivas
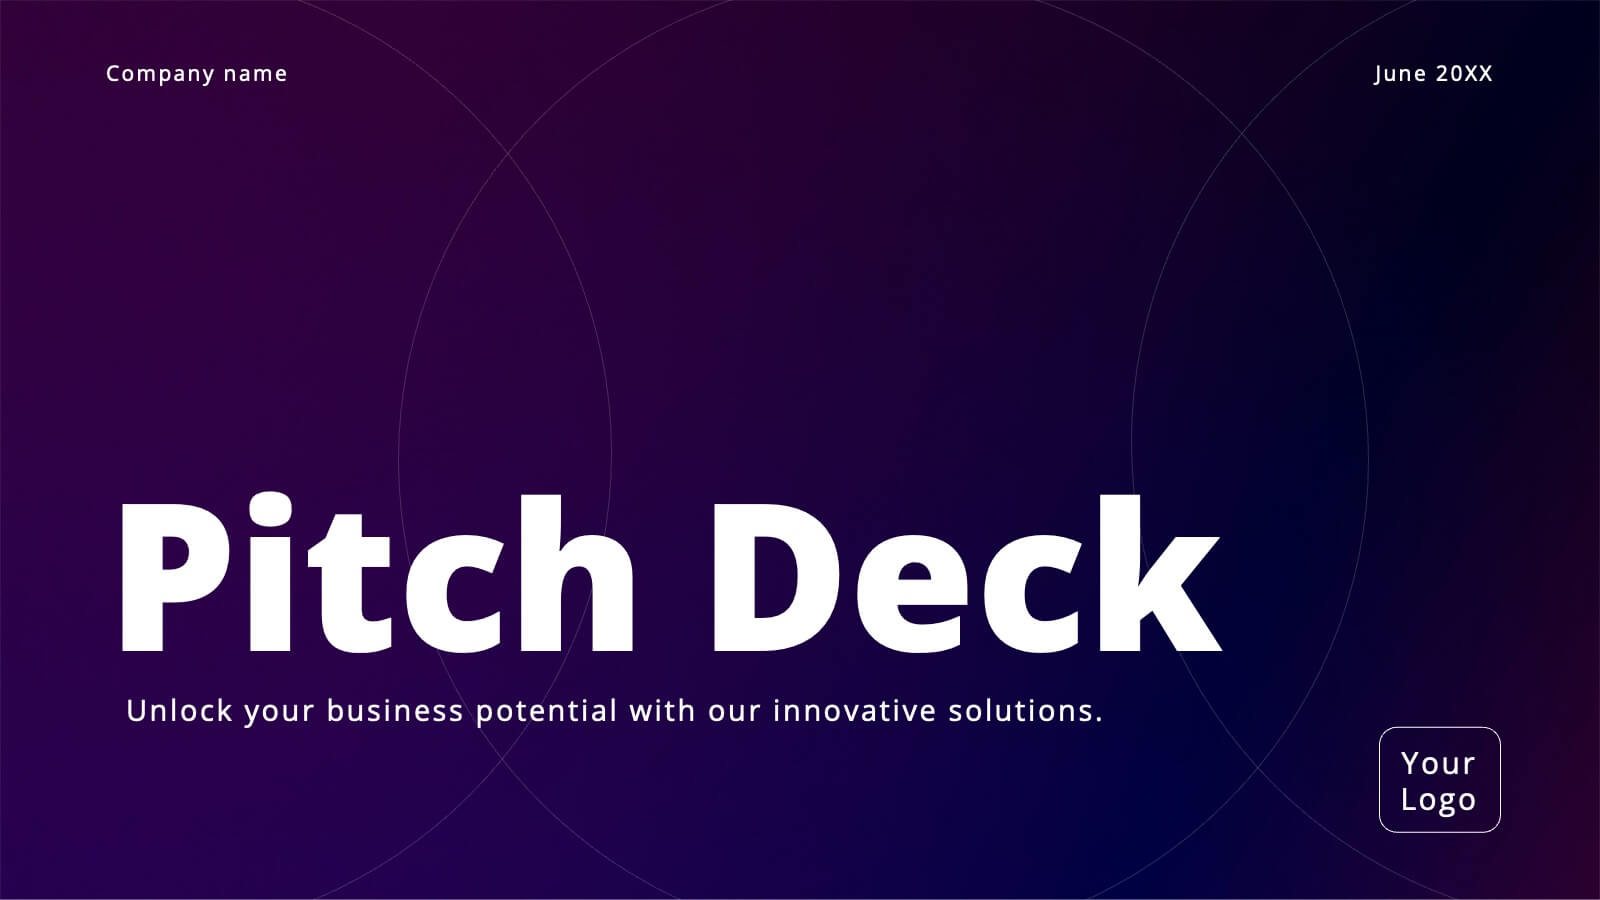
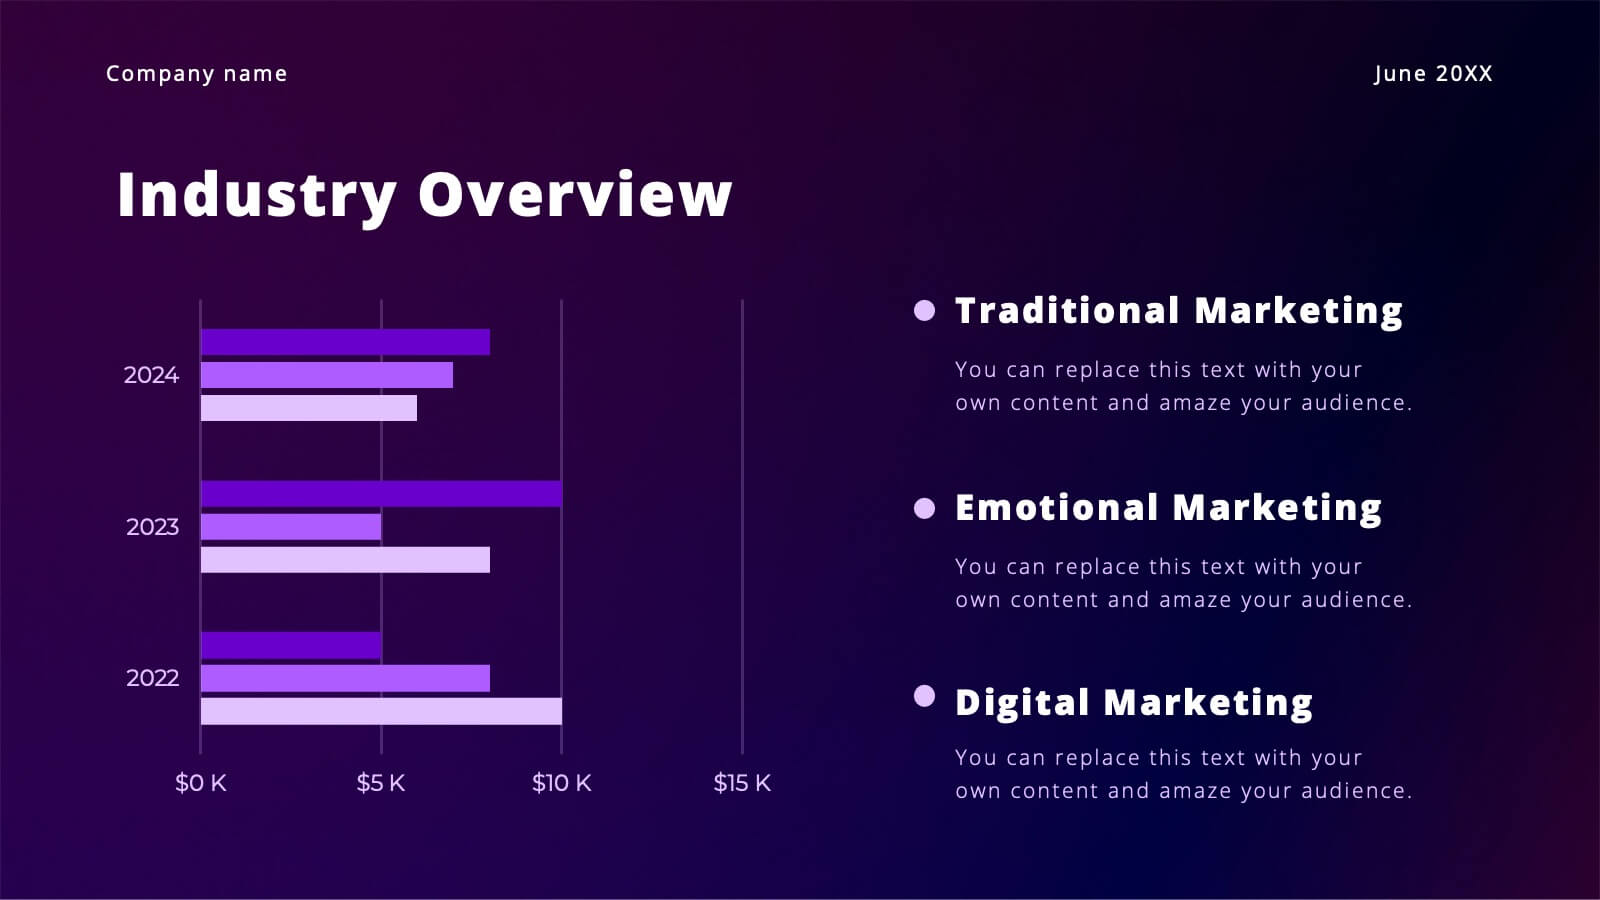
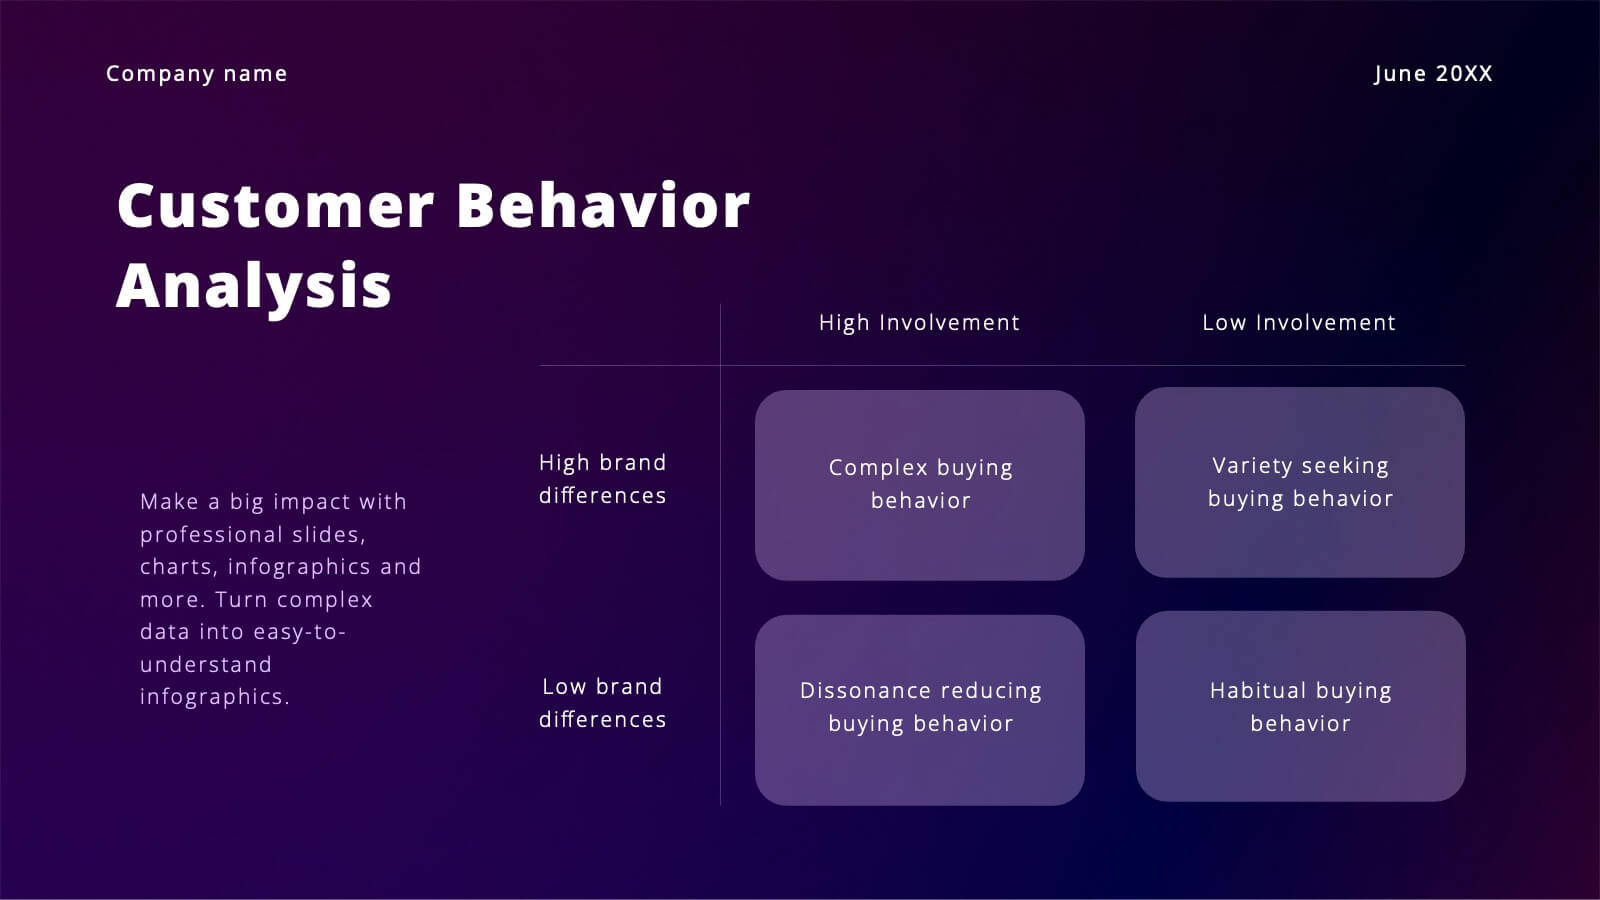
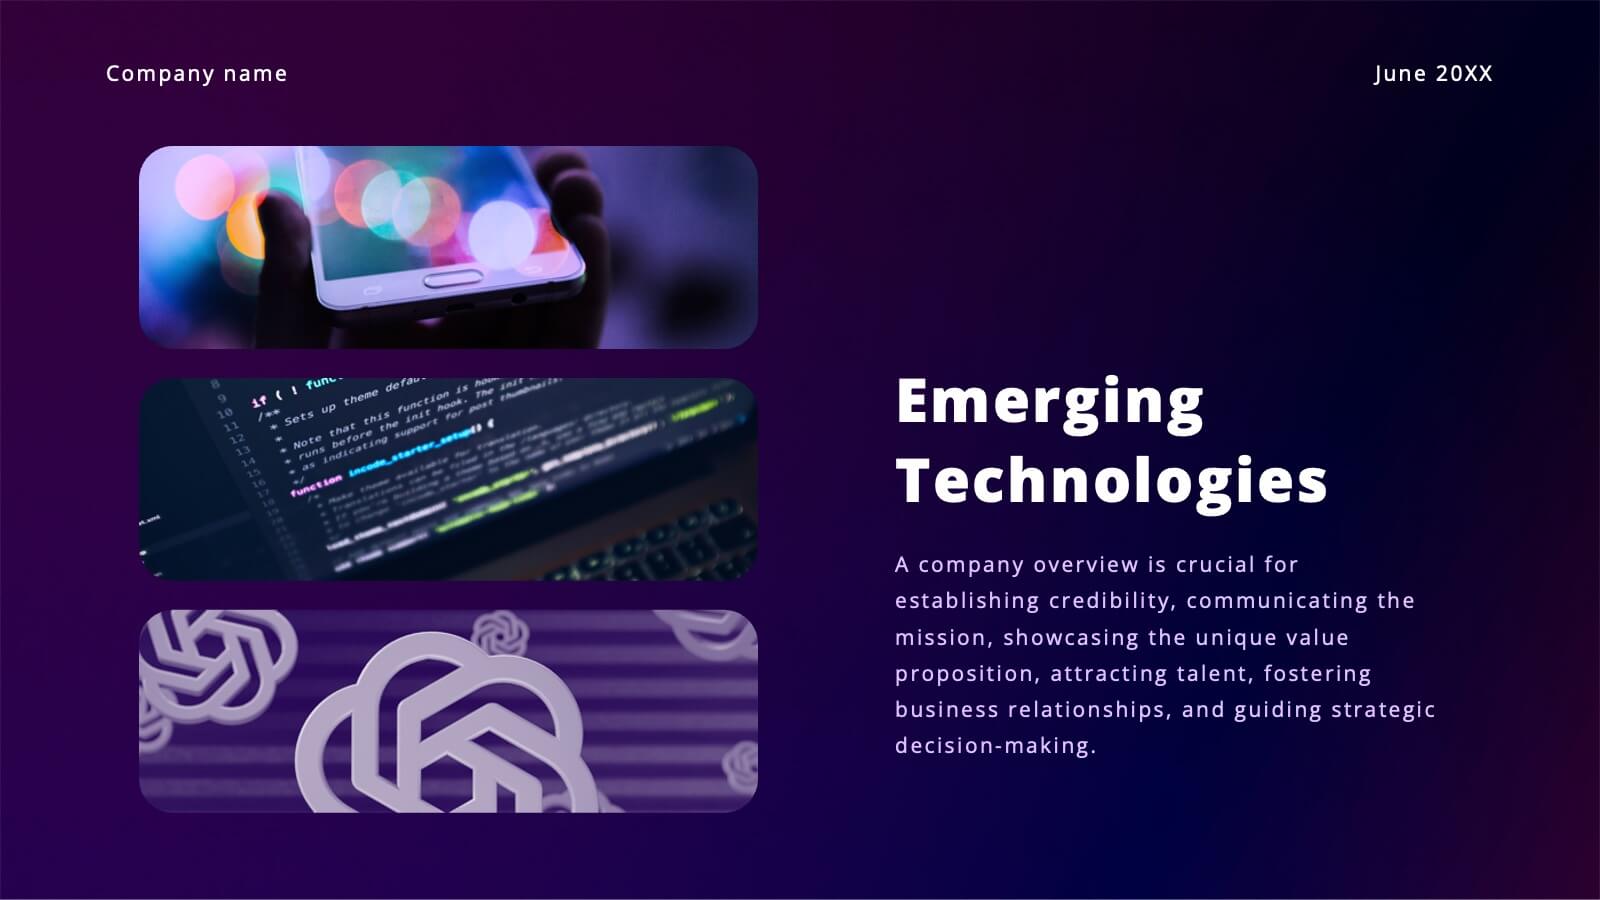
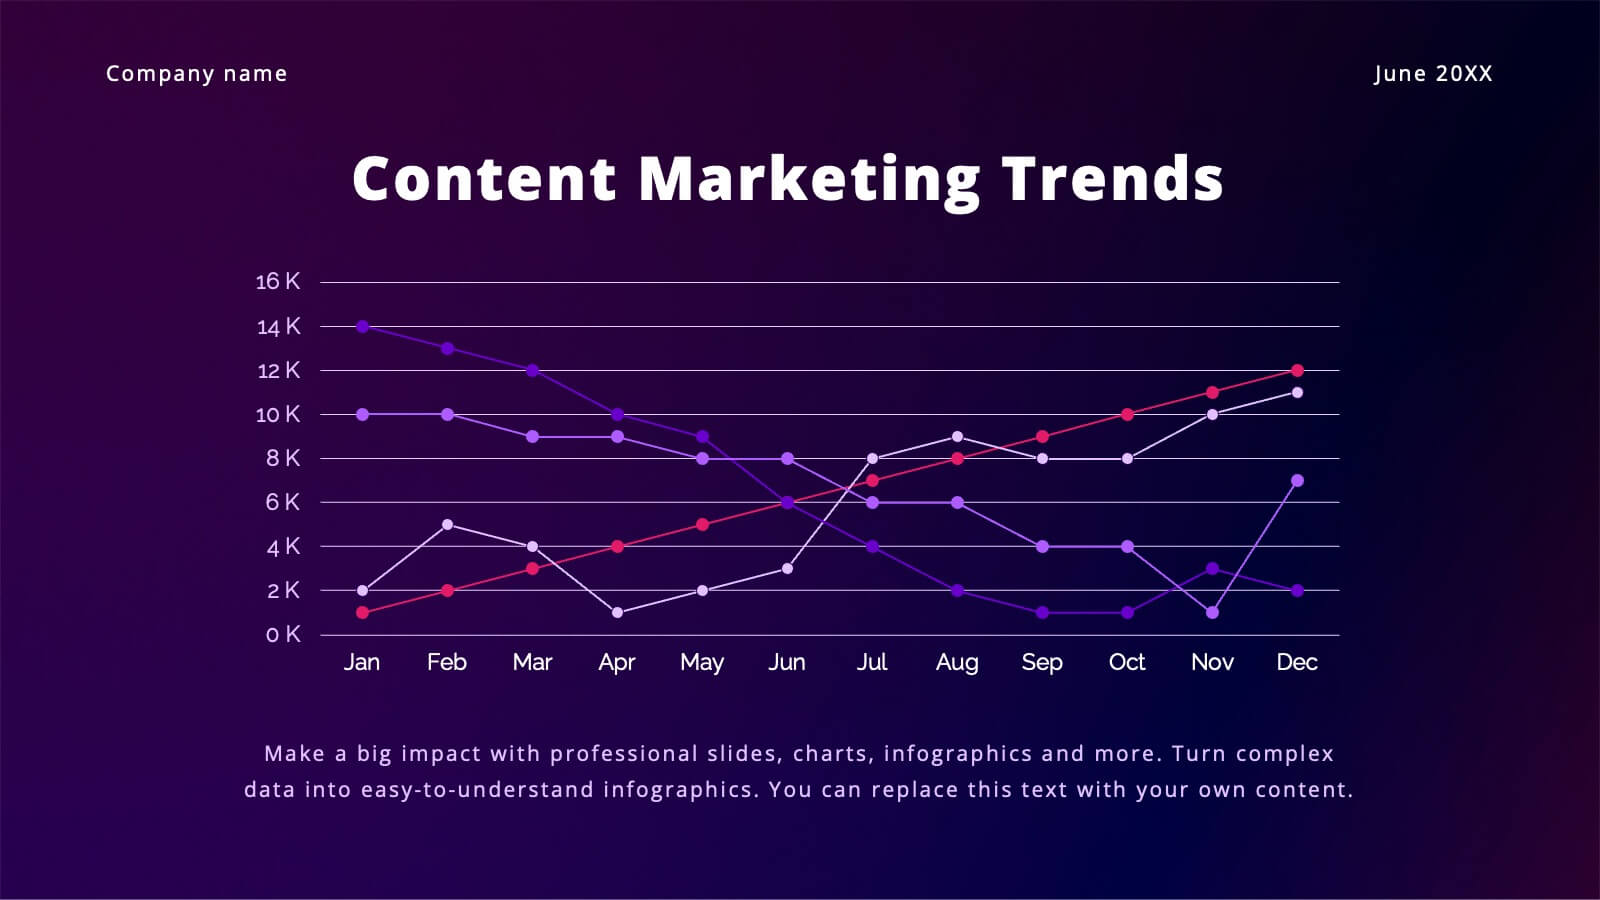
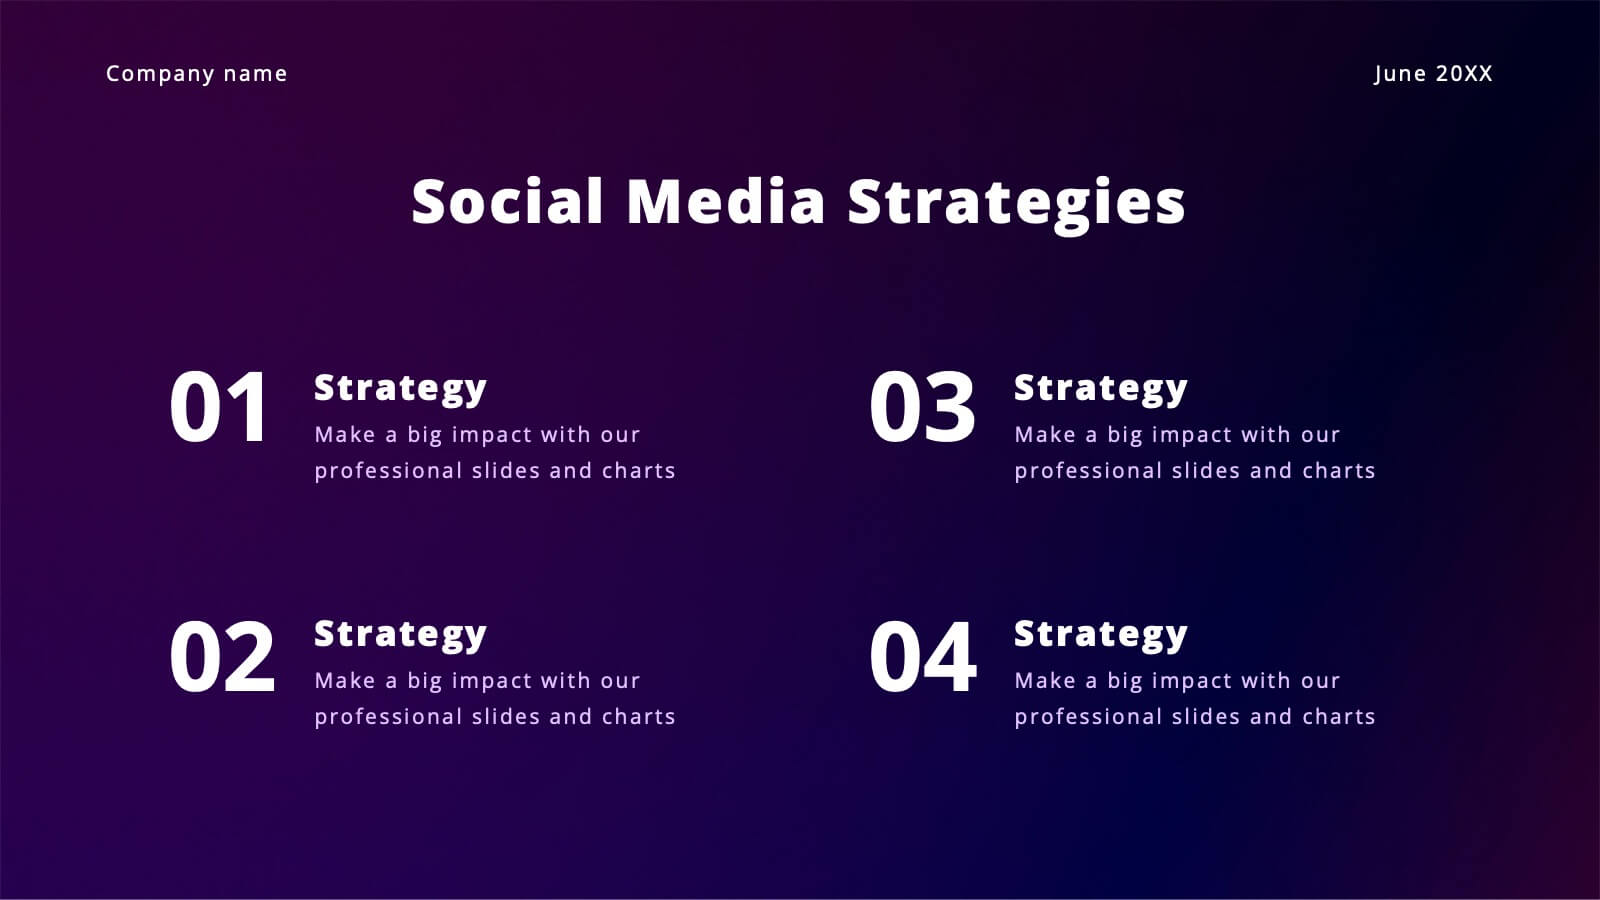
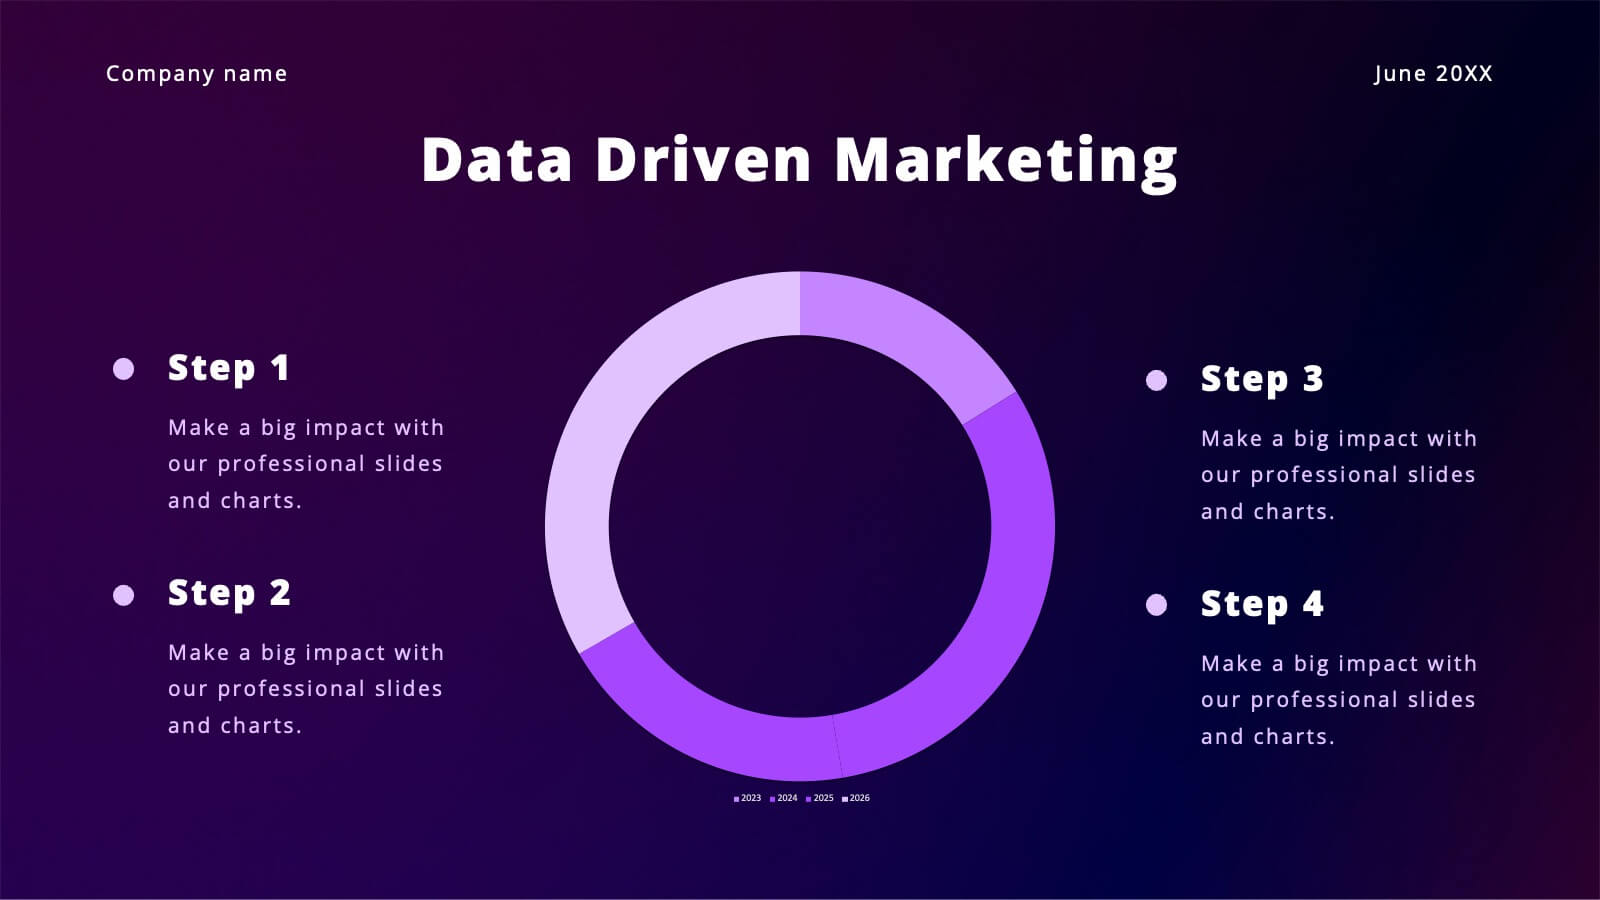
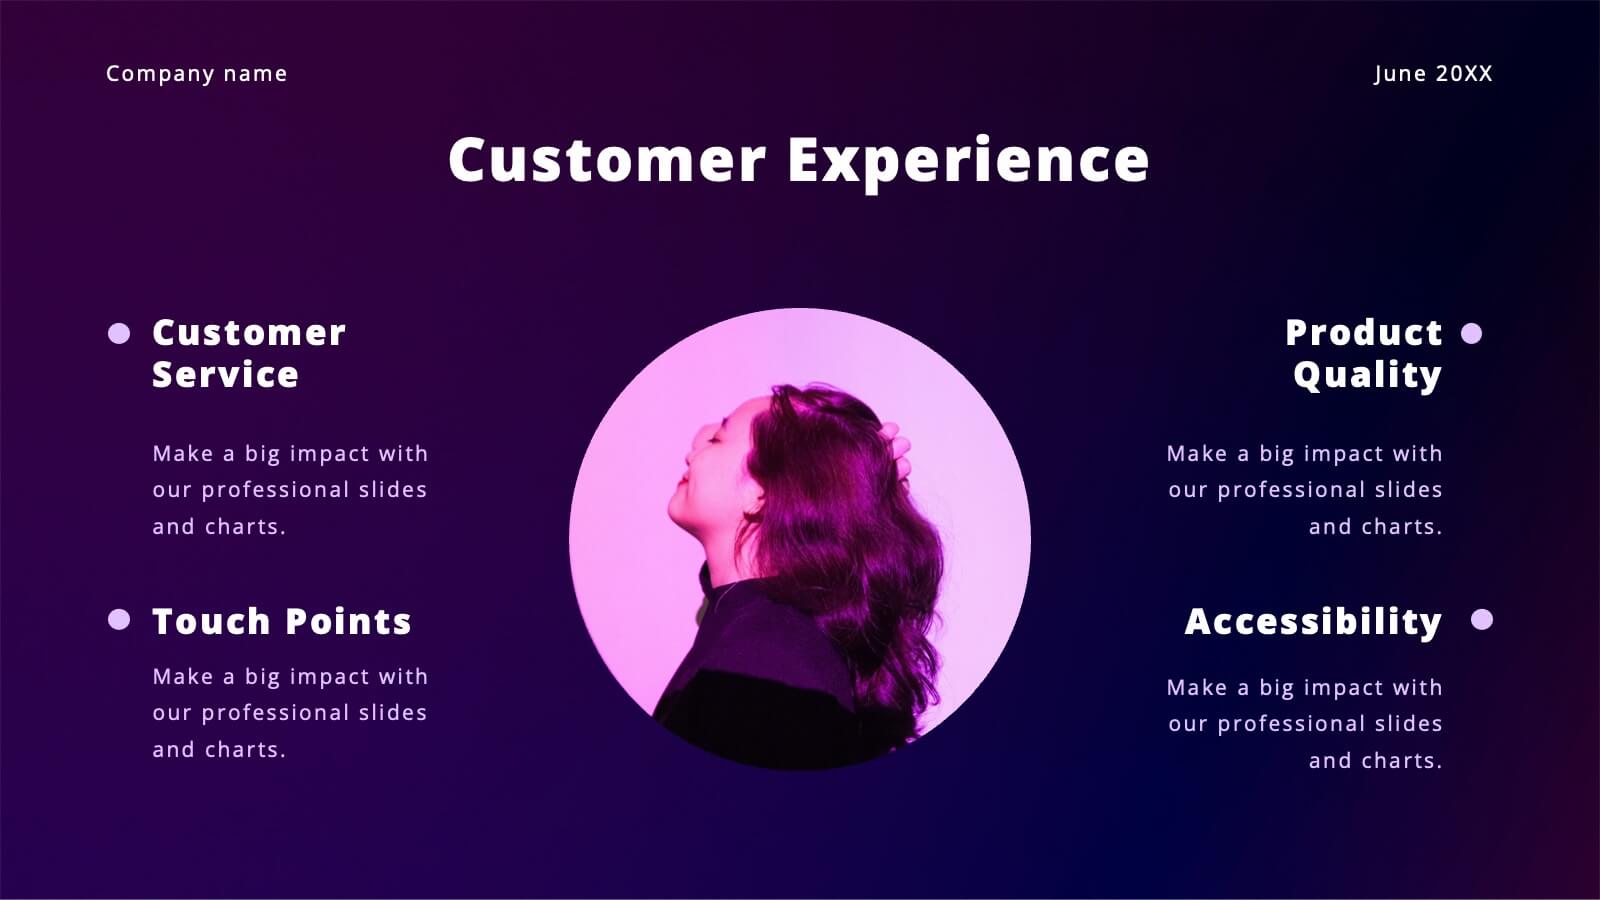
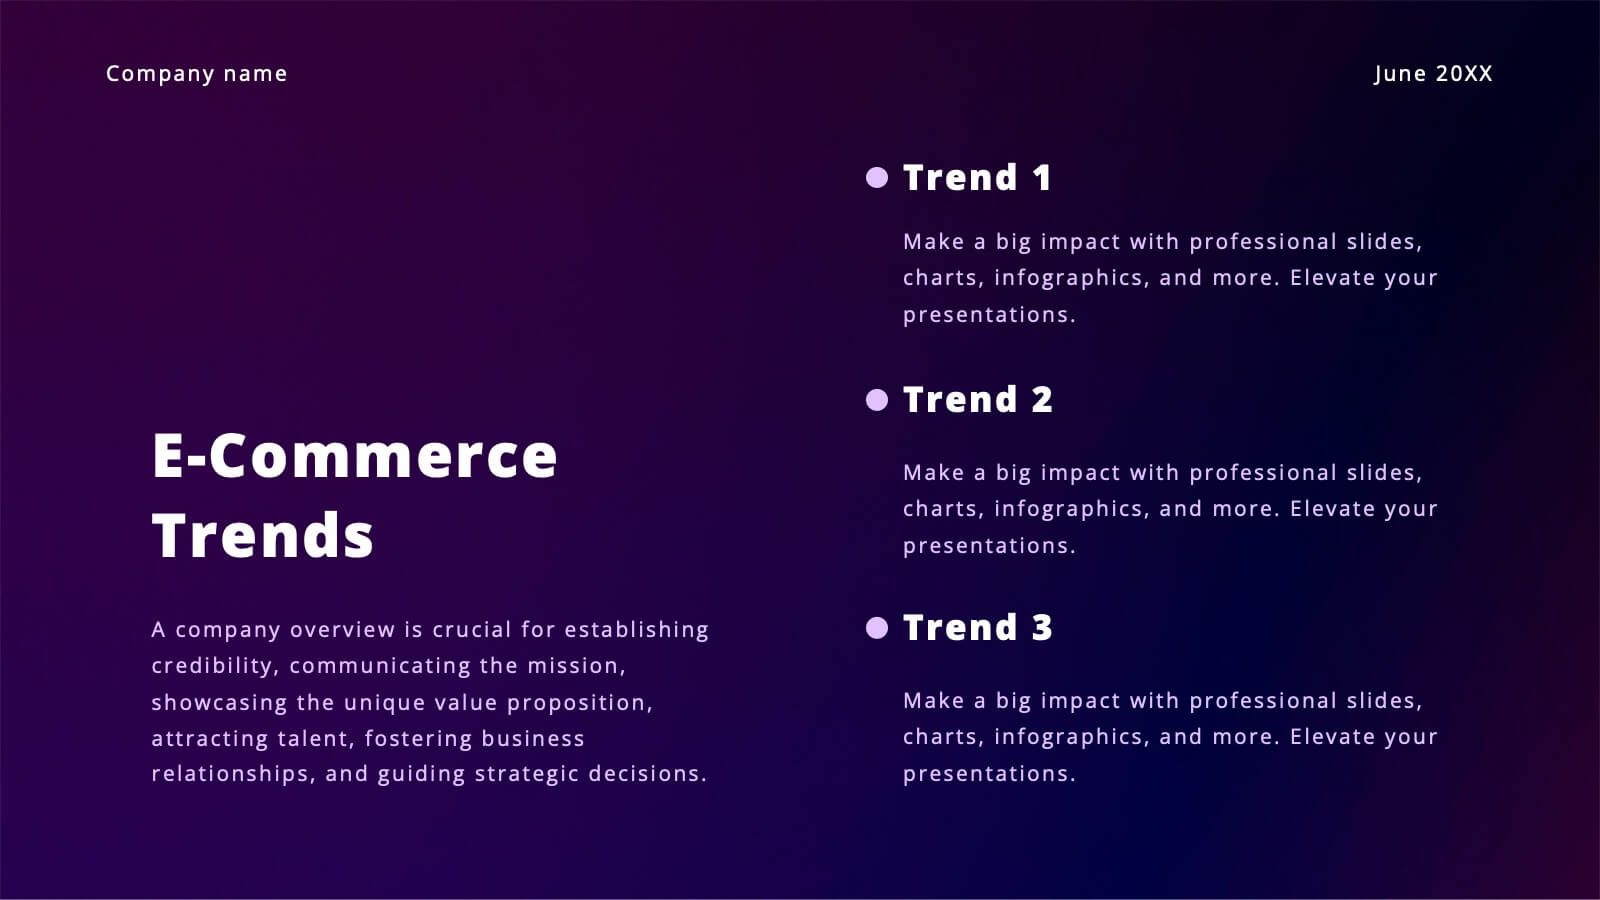
Vibrant Content Marketing Pitch Deck Presentation
Boost your marketing pitch with this vibrant deck! Covering industry overviews, customer behavior analysis, and emerging technologies, it’s designed to captivate your audience. Highlight social media strategies, data-driven marketing, and e-commerce trends effortlessly. Perfect for presenting a comprehensive marketing plan. Compatible with PowerPoint, Keynote, and Google Slides. Make your next pitch stand out!


8 diapositivas
Health and Safety Training
Create impactful safety briefings with this visual slide designed around a caution-sign layout. Perfect for outlining training modules, compliance steps, or workplace hazard procedures, it presents four key points using icons and color-coded elements. Fully customizable in PowerPoint, Keynote, and Google Slides.


4 diapositivas
End-to-End Supply Chain Optimization Presentation
Streamline your logistics strategy with this modern End-to-End Supply Chain Optimization slide. Featuring bold vector icons representing production, automation, and distribution, this layout clearly visualizes key supply chain stages. Ideal for presenting operations flow, logistics planning, or manufacturing improvements. Fully customizable in PowerPoint, Keynote, and Google Slides for seamless integration into your business deck.


25 diapositivas
Hollowfern Brand Identity Presentation
Showcase your brand's unique essence with this structured and visually appealing brand identity presentation template. Highlight key elements like brand values, logo design, color palettes, and typography, providing a cohesive foundation for your brand's image. Dive deeper into the brand tone, consumer personas, and competitive positioning to ensure clarity and alignment with your target audience. This template offers dedicated sections for market analysis, unique selling proposition, and brand guidelines, helping you communicate your strategy with professionalism. Whether you're crafting a social media presence, building a website, or refining packaging designs, this template empowers you to stay consistent and compelling. Fully compatible with PowerPoint, Google Slides, and Keynote, it's tailored for seamless customization and presentation across platforms.


7 diapositivas
Brainstorm Bubble Map Infographic
A brainstorm bubble map is a visual representation used to generate and organize ideas, concepts, or information around a central theme or topic. This infographic template is designed to be a versatile tool commonly utilized in brainstorming sessions, planning, problem-solving, or organizing thoughts. Compatible with Powerpoint, Keynote, and Google Slides. Fully customizable, visualize a multitude of colorful bubbles branching out from the central theme, each encapsulating a unique idea or concept. The vibrant and lively color palette adds an element of fun, reflecting the joy that comes from a successful brainstorming session.


5 diapositivas
Business Growth Cycle Presentation
Illustrate your company’s journey with the Business Growth Cycle slide. This dynamic layout features four sleek arrow segments that represent each phase of growth—from initiation to expansion. Color-coded steps and minimalist icons help guide the audience through your strategy clearly and efficiently. Ideal for outlining roadmaps, business stages, or workflow transitions. Fully editable and compatible with PowerPoint, Keynote, and Google Slides.


23 diapositivas
Echo Startup Pitch Deck Template Presentation
This sleek pitch deck template is perfect for showcasing your startup’s potential. Highlight your problem, solutions, revenue model, and unique value proposition in a professional format. It's fully customizable, easy to use, and compatible with PowerPoint, Keynote, and Google Slides, making it ideal for impressing investors.


5 diapositivas
OKR-Based Goal Setting Approach
Clarify your objectives and key results with this visual OKR-Based Goal Setting slide. Each target icon represents a focused initiative, helping teams align and measure progress clearly. Fully editable in PowerPoint, Keynote, and Google Slides.