


Características


¿Tienes alguna pregunta?
Recomendar


6 diapositivas
Business Plan Next Steps Presentation
Map out your strategy with the Business Plan Next Steps Presentation template. This visually structured layout helps outline key actions, milestones, and priorities for business growth and execution. Ideal for entrepreneurs, executives, and project managers, this slide ensures clarity and alignment on upcoming initiatives. Fully customizable in PowerPoint, Keynote, and Google Slides for easy integration into your planning process.


7 diapositivas
Core Business Values Slide Presentation
Show what your company stands for with a bold, structured layout that highlights the principles driving your success. This presentation is ideal for communicating organizational values, culture, and goals in a professional, visually balanced way. Fully editable and compatible with PowerPoint, Keynote, and Google Slides for easy customization.


6 diapositivas
Skills Gap Assessment Infographic
The Skills Gap refers to the mismatch between the skills and qualifications that employers seek in their workforce and the skills possessed by job seekers or employees. This infographic template is a visual representation of the evaluation and analysis of the skills gap within a specific organization, industry, or job sector. The infographic is designed to help businesses and stakeholders understand the disparity between the skills required for certain roles and the skills possessed by the current workforce. By identifying the skills gap, organizations can develop targeted training and development programs to bridge the gap and enhance their employees' skills.


6 diapositivas
Staff Integration and Onboarding Journey Presentation
Streamline your onboarding process with the Staff Integration and Onboarding Journey Presentation. This clean, step-by-step layout uses human icons to represent each phase of a new hire's journey—from orientation to full integration. Ideal for HR professionals, it’s fully editable in Canva, PowerPoint, Keynote, or Google Slides for easy customization.


4 diapositivas
3-Circle Venn Diagrams Presentation
Unlock clarity with a bold visual that highlights how ideas, data, or teams connect at key intersection points. This presentation makes complex relationships easy to explain with clean circles, labels, and structured insights. Fully editable and compatible with PowerPoint, Keynote, and Google Slides.


6 diapositivas
Progressive Insurance Infographics
Explore Progressive Insurance with our customizable infographic template. This template is fully compatible with popular presentation software like PowerPoint, Keynote, and Google Slides, allowing you to easily customize it to showcase various aspects of Progressive Insurance, its services, and achievements. The Progressive Insurance infographic template offers a visually engaging platform to highlight the company's history, insurance offerings, customer satisfaction, and industry leadership. Whether you're an insurance professional, a potential customer, or a financial analyst, this template provides a user-friendly canvas to create informative presentations and educational materials about Progressive Insurance. Learn more about Progressive Insurance with this SEO-optimized infographic template, thoughtfully designed for clarity and ease of use. Customize it to showcase Progressive's unique features, coverage options, and innovations, making it a valuable resource for sharing information about the company with your audience. Start crafting your personalized infographic today to explore the world of Progressive Insurance.


6 diapositivas
Psychology Mind Map Template Presentation
Unlock the brain’s potential with this smart and sleek visual! Perfect for organizing complex concepts, this mind map template helps you visualize psychological theories, thoughts, or data connections in a head-shaped layout using colored hexagons. Easily editable and professionally designed, it works seamlessly in PowerPoint, Keynote, and Google Slides.


12 diapositivas
Quarterly Status Report Presentation
Crafted for clarity and impact, the Quarterly Status Report presentation template efficiently summarizes a period's achievements and insights. The opening slide immediately captivates the audience, clearly setting the stage for a comprehensive review. Subsequent slides meticulously organize critical data points, from financial forecasts to project milestones, allowing for a granular examination of past performance. The report not only reflects on the quarter's outcomes but also offers a well-defined path forward, with strategic recommendations and a thoughtful action plan. Concluding on a note of gratitude, the template acknowledges the audience's time and consideration, while the final credits slide ensures due recognition of all informational sources used throughout the presentation.


5 diapositivas
Key Data and Performance Numbers Slide
Visualize data with impact using the Key Data and Performance Numbers Slide Presentation. This infographic-style layout features a central pie chart and five bold percentage callouts, making it ideal for presenting insights, progress, or KPIs. Easily customize the colors, titles, and text in PowerPoint, Keynote, or Google Slides.


27 diapositivas
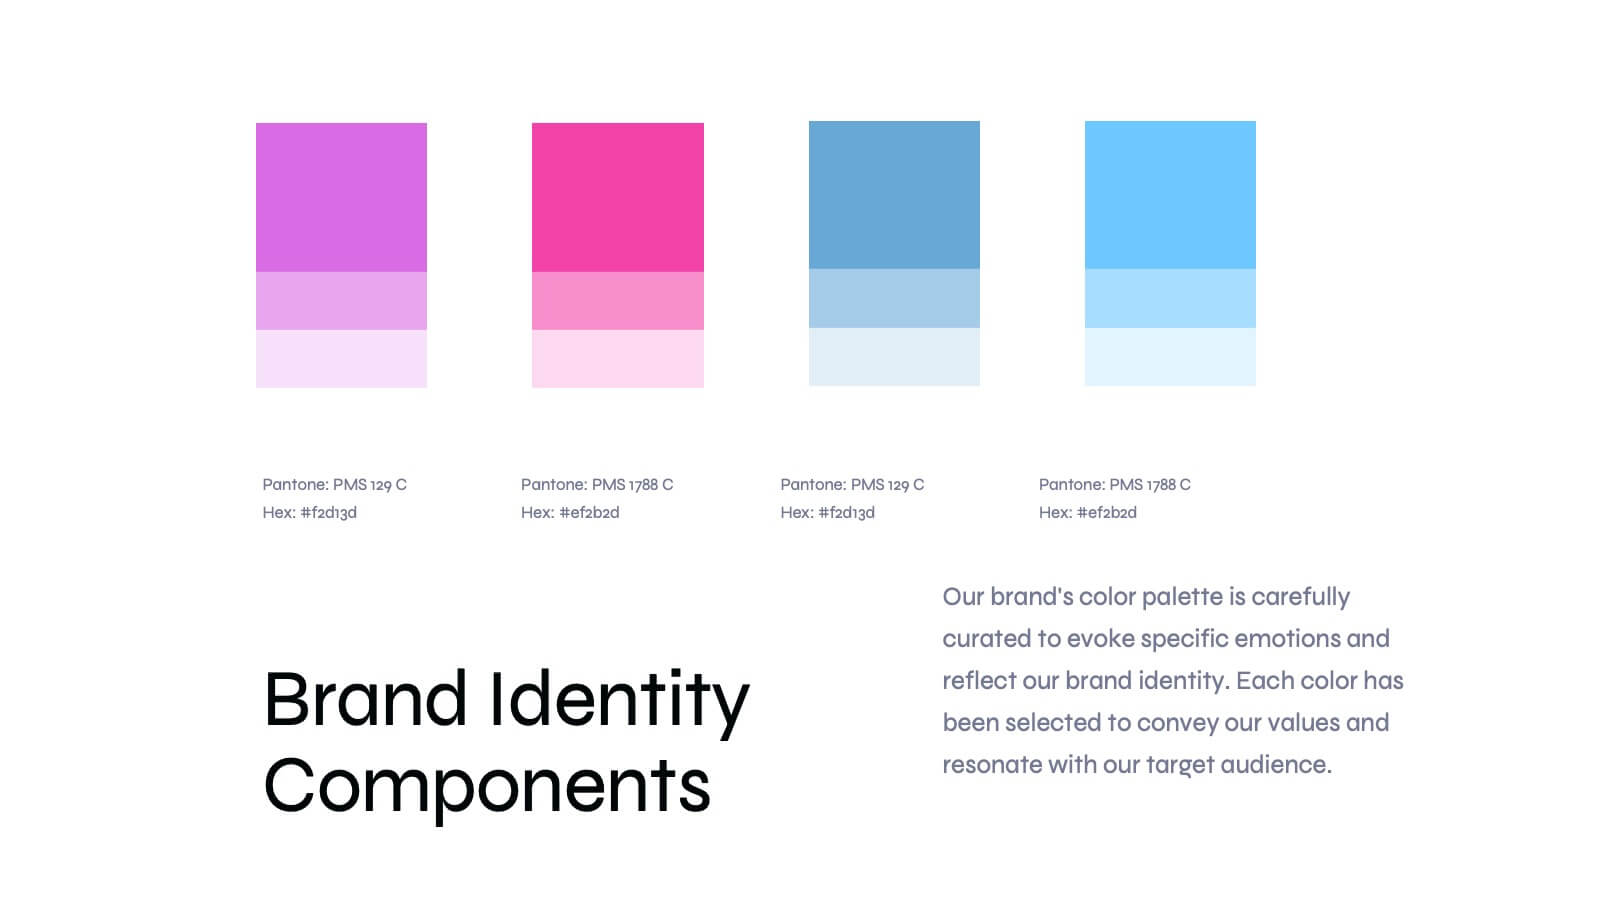
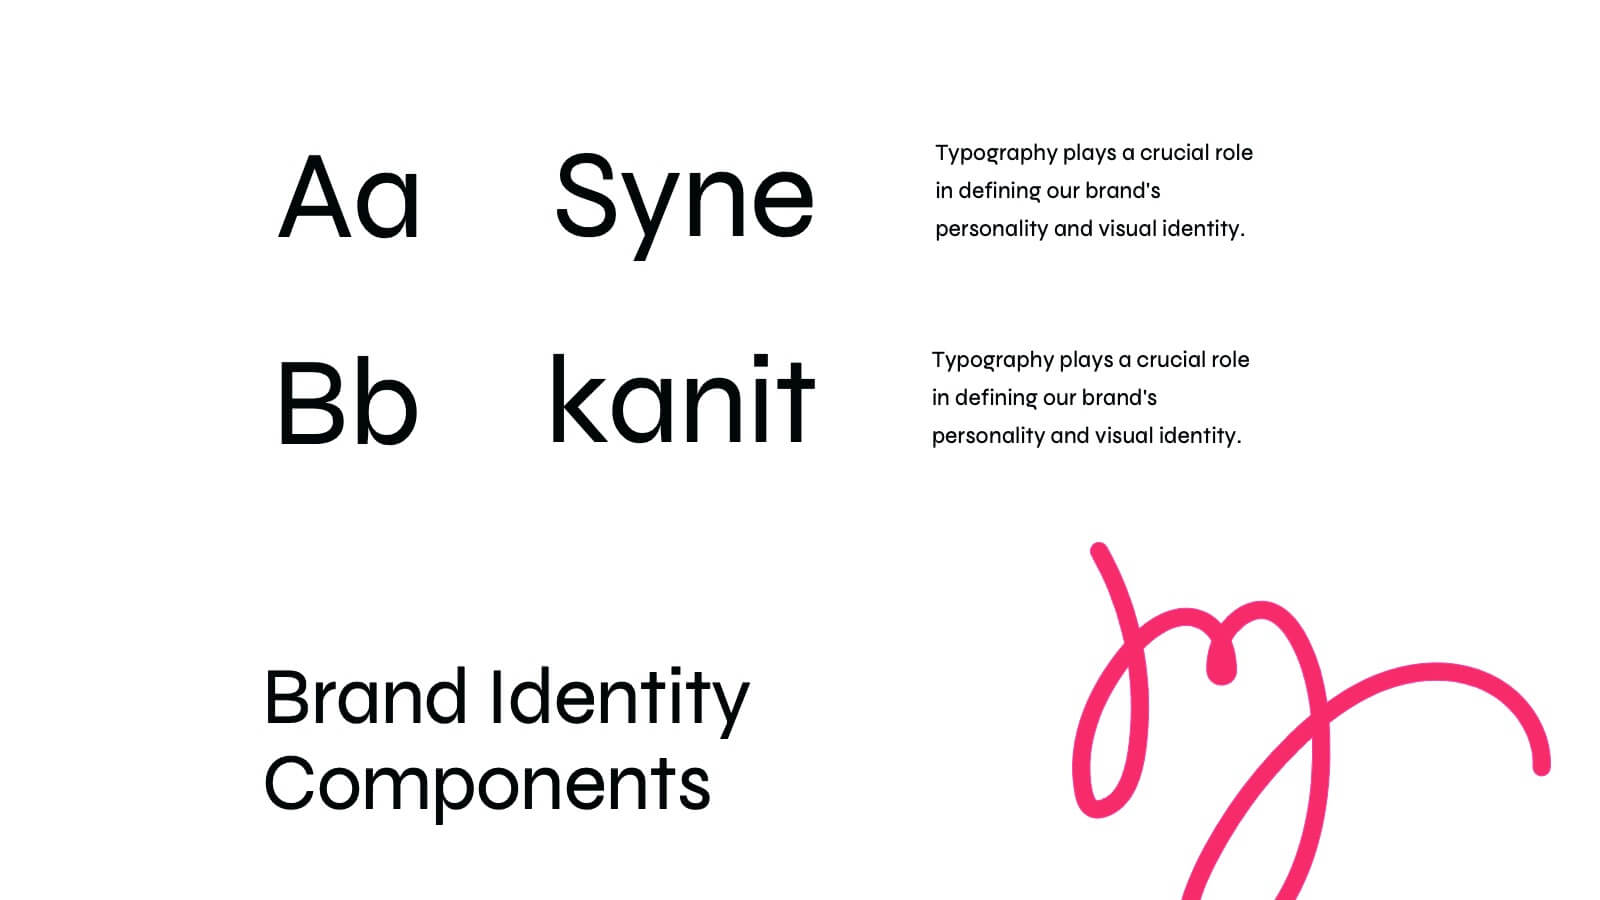
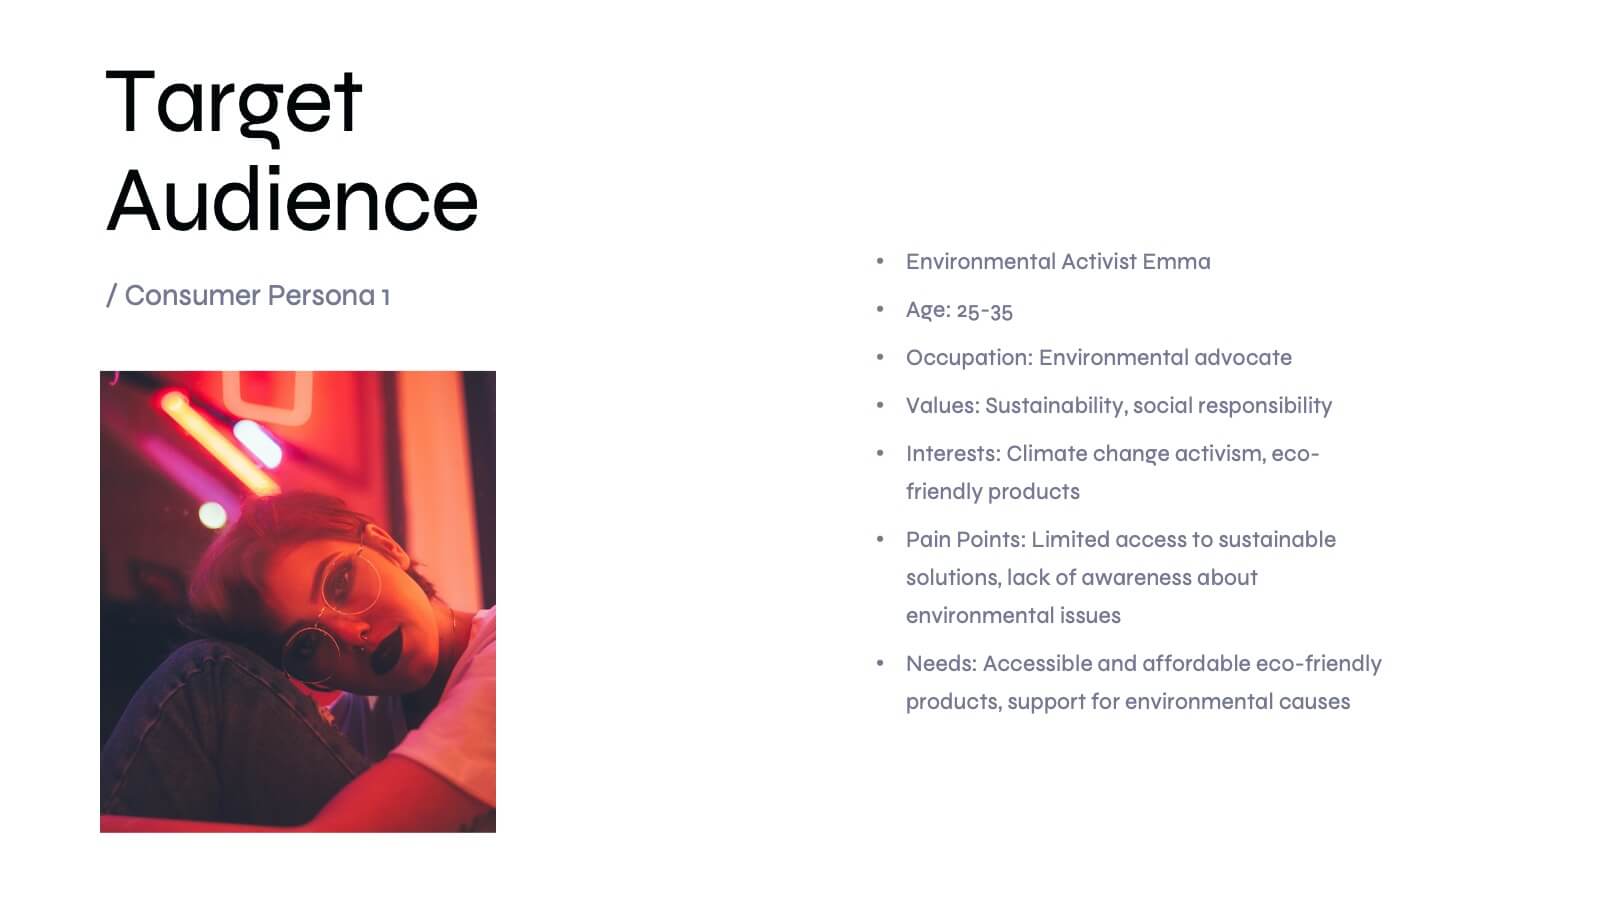
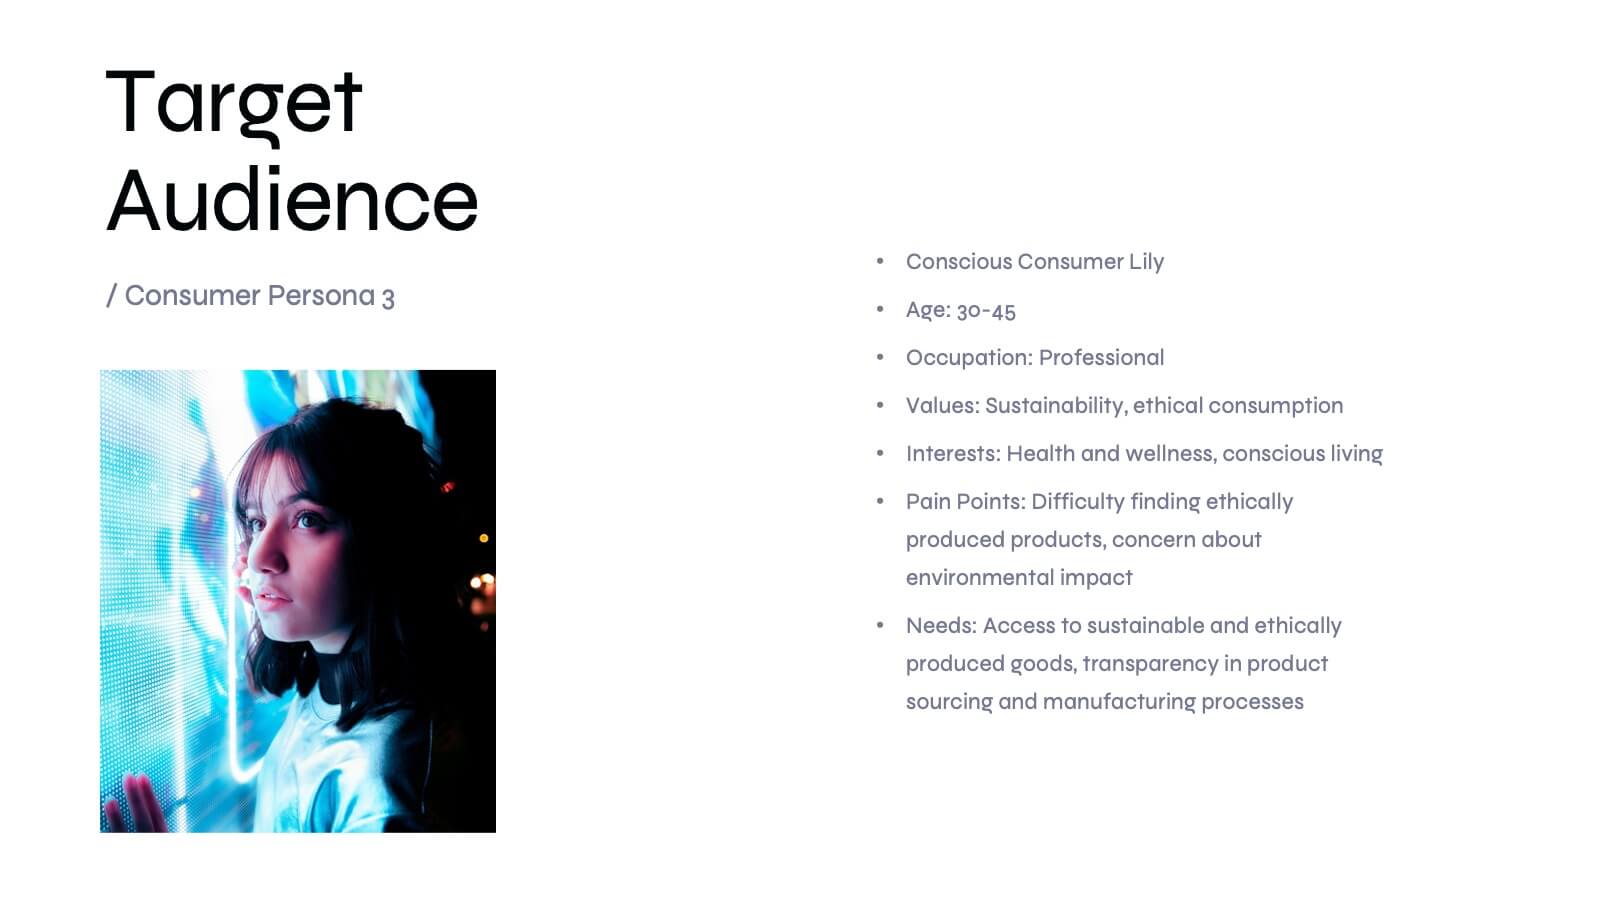
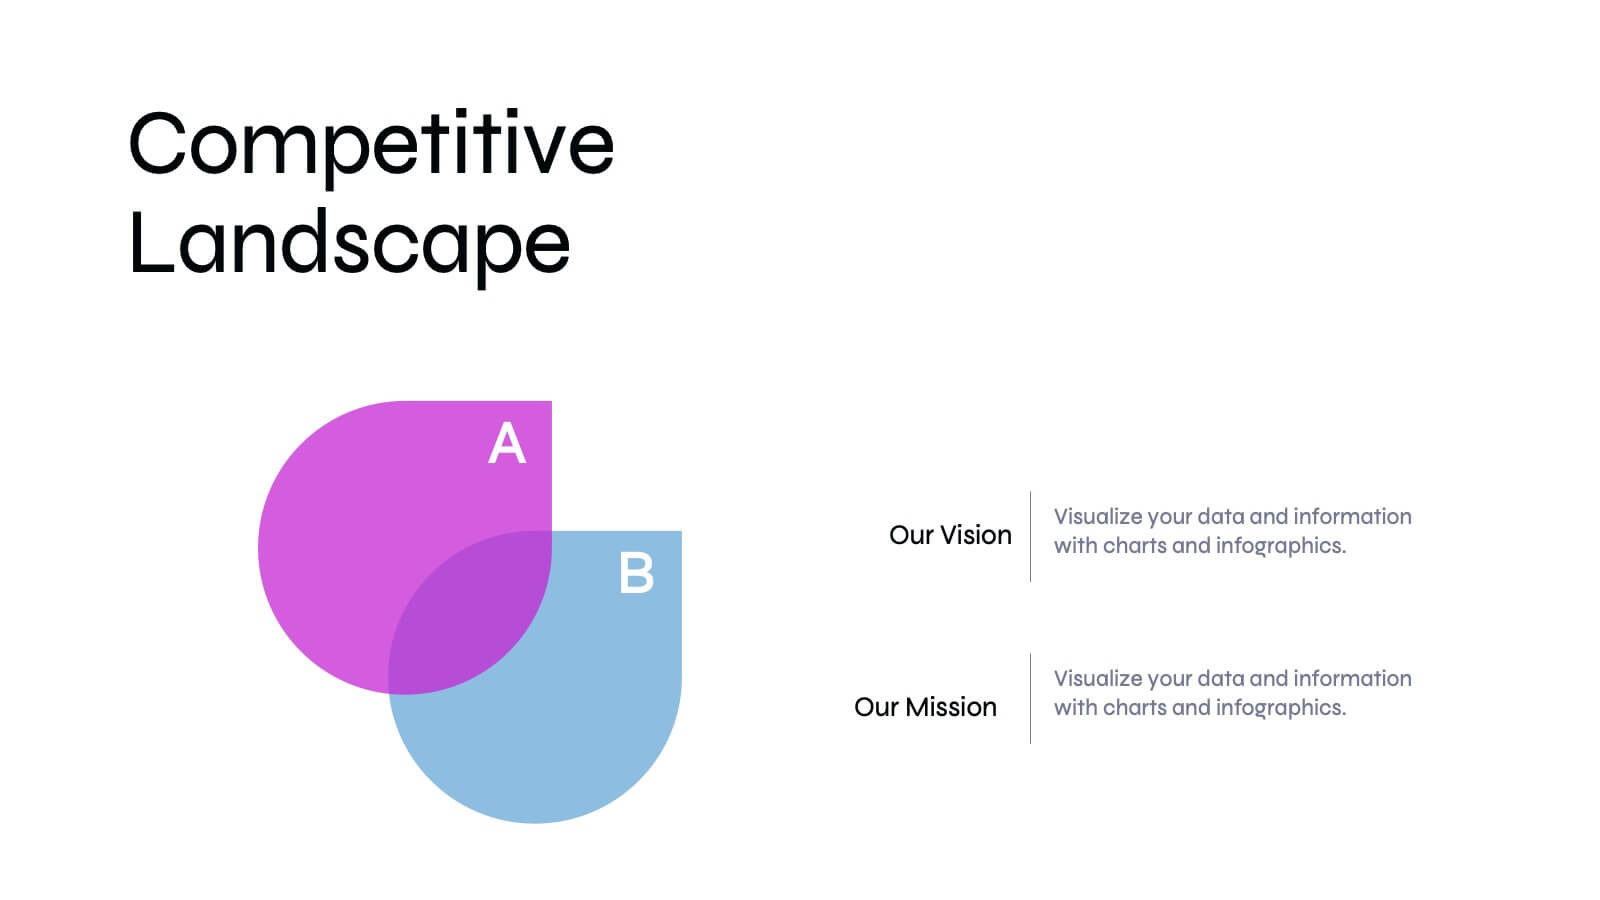
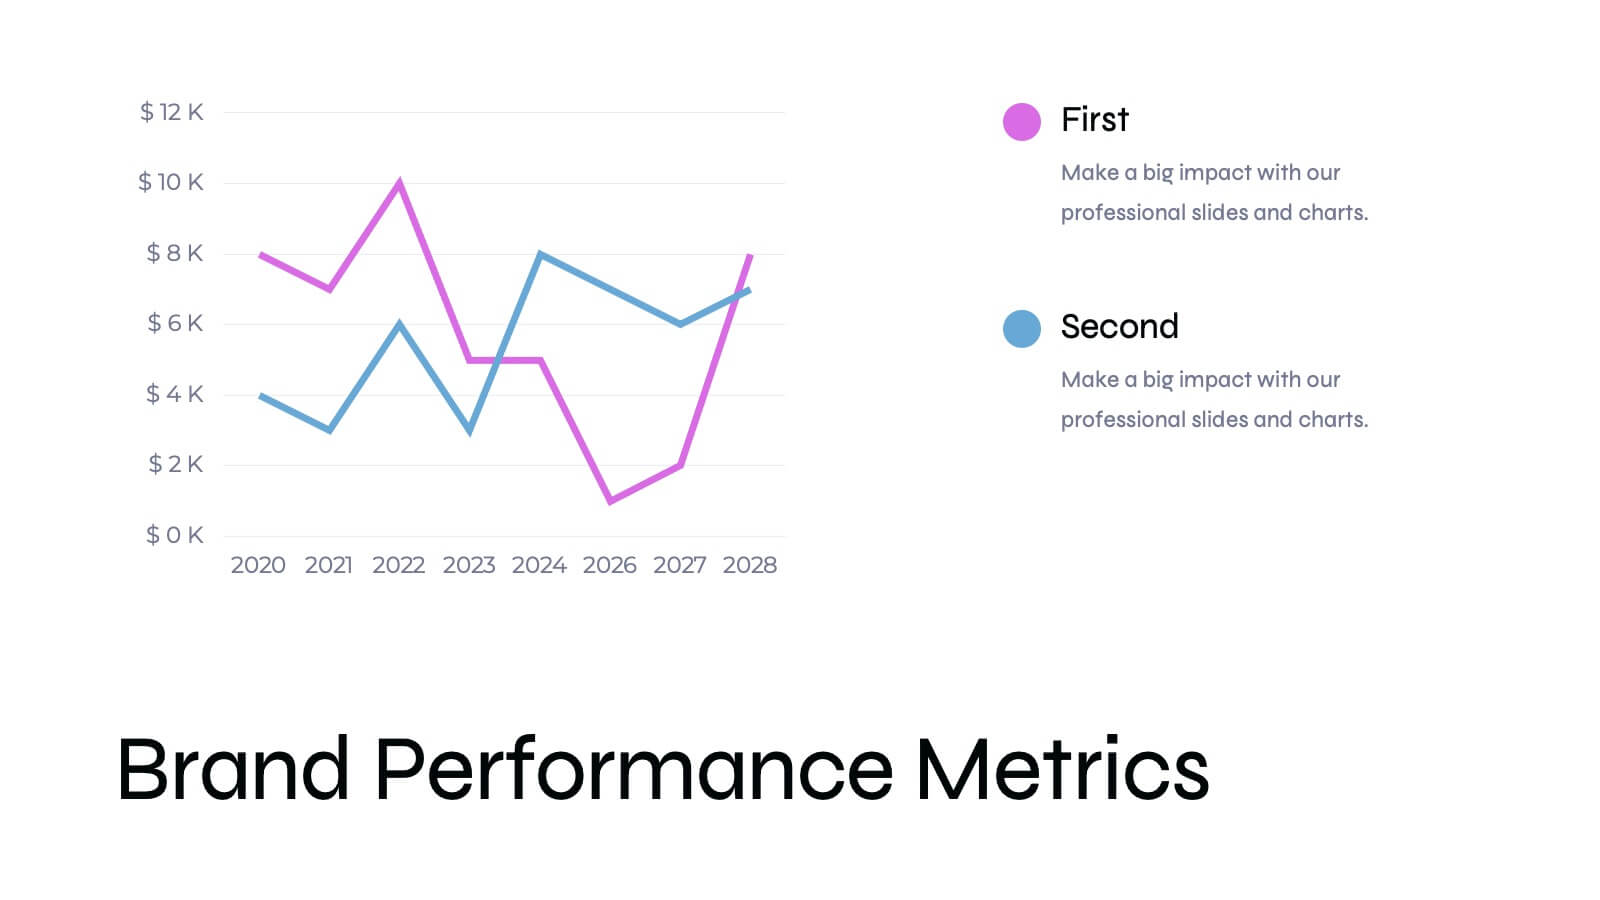
Basilisk Brand Guidelines Proposal Presentation
Present your brand strategy effectively with this modern brand guidelines proposal template! It includes sections for brand vision, values, identity, and market analysis. Fully customizable and compatible with PowerPoint, Keynote, and Google Slides, it’s perfect for showcasing your brand's identity and ensuring consistency across all platforms.


7 diapositivas
Quantitative Insights and Data Analysis Presentation
Present survey results or demographic research with clarity using the Quantitative Insights and Data Analysis Presentation. This template features colorful, category-coded tables that simplify complex data, making it perfect for showcasing consumer segments, market research findings, or statistical insights. Fully editable in PowerPoint, Keynote, and Google Slides.


6 diapositivas
Supply Chain Management Strategy
Navigate your next big idea with a flow that’s clear, visual, and sharp. This presentation template breaks down key business logistics and process steps into a bold, easy-to-follow infographic layout. Ideal for showcasing strategic planning and operational structure, it's fully compatible with PowerPoint, Keynote, and Google Slides for effortless use.


6 diapositivas
Security Finance Infographics
The "Security Finance" infographic template is a sleek and authoritative visual tool, impeccably designed for PowerPoint, Keynote, and Google Slides. This template is an indispensable resource for financial analysts, security brokers, and investment advisors who aim to articulate the nuances of security finance including investment strategies, risk management, and portfolio diversification. This template methodically outlines the critical components of security finance, such as stocks, bonds, market analysis, and financial instruments. It's crafted to present complex financial concepts and data in a digestible and visually engaging format. This makes it an excellent aid for financial presentations, investor briefings, or educational seminars on capital markets and investment principles. The design is as professional as it is insightful, with a color scheme that is both sophisticated and indicative of financial acumen. This not only enhances the visual appeal of the presentation but also aligns with the seriousness and precision of financial discussions. Whether used in a corporate setting, a training module, or an academic lecture, this template ensures that the intricacies of "Security Finance" are communicated with clarity, sophistication, and visual impact.


24 diapositivas
Catalyst Strategic Planning Report Presentation
Unleash your strategic vision with the Catalyst Strategic Planning Report template! This vibrant and dynamic layout is designed to make your strategic planning presentations not only effective but also visually captivating. The template’s playful yet professional design elements, including bold color blocks and creative graphics, draw attention to key points, ensuring your message resonates with your audience. From SWOT analysis to market trends, and resource allocation to action plans, every slide is crafted to communicate your strategic objectives clearly and compellingly. Perfect for business reviews, strategic meetings, or investor presentations, this template allows you to present data-driven insights and actionable steps in an engaging manner. It’s fully customizable, making it easy to adapt to your brand’s colors and style. Whether you’re presenting to a team or stakeholders, the Catalyst template provides the perfect platform to articulate your vision. Compatible with PowerPoint, Keynote, and Google Slides, it’s your go-to tool for impactful strategic presentations!


10 diapositivas
Corporate Framework and Structure Presentation
Clearly define your corporate framework and structure with this professional infographic template. Ideal for executives, team leaders, and project managers, this slide visually organizes organizational hierarchy, roles, and key responsibilities in a clean and structured layout. Fully editable in PowerPoint, Keynote, and Google Slides, allowing seamless customization for your company's needs.


10 diapositivas
Farming Technologies and Crop Management
Present cutting-edge insights with the Farming Technologies and Crop Management Presentation. This visually compelling slide uses wind turbine illustrations to symbolize innovation in agriculture. Ideal for showcasing smart farming tools, sustainable practices, and crop optimization strategies. Fully editable and compatible with PowerPoint, Keynote, and Google Slides.


5 diapositivas
Market Growth Strategies in North America Map Presentation
Unveil regional growth opportunities with the Market Growth Strategies in North America Map template, which provides a strategic layout for presenting business growth metrics across various regions.This template includes data-driven graphs to visualize performance and strategy deployment effectively. It's designed to aid professionals in making informed decisions and is compatible with PowerPoint, Keynote, and Google Slides.