


Características


¿Tienes alguna pregunta?
Recomendar


4 diapositivas
Financial Cost Management Strategies Presentation
Effectively plan and monitor financial performance with the Financial Cost Management Strategies Presentation template. This slide provides a clear roadmap for cost optimization, budget allocation, and financial efficiency improvements. Ideal for finance teams, business strategists, and executives aiming for streamlined cost control. Fully editable in PowerPoint, Keynote, and Google Slides for easy customization.


7 diapositivas
Sustainable Agriculture Infographic Presentation
An Agriculture Infographic presents information and data related to agriculture and the farming industry. This template is designed to cover a wide range of topics, including crop production, livestock farming, food processing, distribution, and sustainable agriculture practices. Use this infographic to provide information on the economic, social, and environmental impacts of agriculture, as well as to showcase new technologies and innovations in the farming industry. This infographic includes 7 slide layouts each with unique illustrations related to agriculture, charts, and diagrams.


6 diapositivas
Sales Strategy 30-60-90 Day Plan Presentation
Drive sales success with this structured 30-60-90 day strategy template! Designed to help sales teams and professionals set clear objectives, track progress, and optimize performance, this layout ensures a smooth transition from planning to execution. Fully customizable and compatible with PowerPoint, Keynote, and Google Slides for seamless presentations.
8 diapositivas
Directional Arrow Timeline Flow
Highlight key milestones or project phases with this smooth, flowing arrow timeline layout. Designed for project managers, team leads, and strategists to showcase sequential steps, launch plans, or performance stages. Fully customizable in PowerPoint, Keynote, and Google Slides—change icons, colors, and text to match your brand style.


26 diapositivas
Beauty Products Company Profile Presentation
A beauty products company is a business that specializes in the development, manufacturing, marketing, and sale of various beauty and skincare products. This presentation template is designed to showcase your cosmetics and skincare brand in the most captivating and alluring way possible. With a blend of elegance and modernity, this template is your beauty brand's ticket to leaving a lasting impression on clients, investors, and partners. Fully customizable and compatible with Powerpoint, Keynote, and Google Slides. The sophisticated color palette will reflect the elegance of your beauty company.


10 diapositivas
Checklist and Action Plan List Presentation
Stay organized and achieve goals efficiently with this checklist and action plan template. Designed for task tracking, project management, and strategic planning, it provides a clear visual structure for prioritizing tasks. Perfect for professionals and teams aiming for productivity. Compatible with PowerPoint, Keynote, and Google Slides for seamless editing and presentation.


5 diapositivas
Innovation with Design Thinking Framework
Boost creativity and problem-solving with the Innovation with Design Thinking Framework Presentation. This slide features a vertically stacked rocket diagram symbolizing the five key phases of design thinking—perfect for illustrating iterative innovation processes. Each level includes editable text and icons, helping you align stakeholders around empathy, ideation, and prototyping. Ideal for workshops, innovation teams, educators, or product development presentations. Fully customizable in PowerPoint, Keynote, and Google Slides.


4 diapositivas
Athlete Performance Metrics Presentation
Track and display key performance data with this Athlete Performance Metrics slide. Featuring a semi-circular layout with sports icons, percentages, and editable text areas, this template helps visualize stats clearly. Ideal for coaching reports or sports analysis. Compatible with PowerPoint, Keynote, and Google Slides for easy customization and use.


2 diapositivas
Professional Proposal for Project Approval Presentation
Impress stakeholders and decision-makers with the Professional Proposal for Project Approval Presentation. Designed to guide your audience through key objectives and visual justifications, this clean, image-rich layout is ideal for startups, teams, and consultants. Fully customizable in PowerPoint, Keynote, and Google Slides.


21 diapositivas
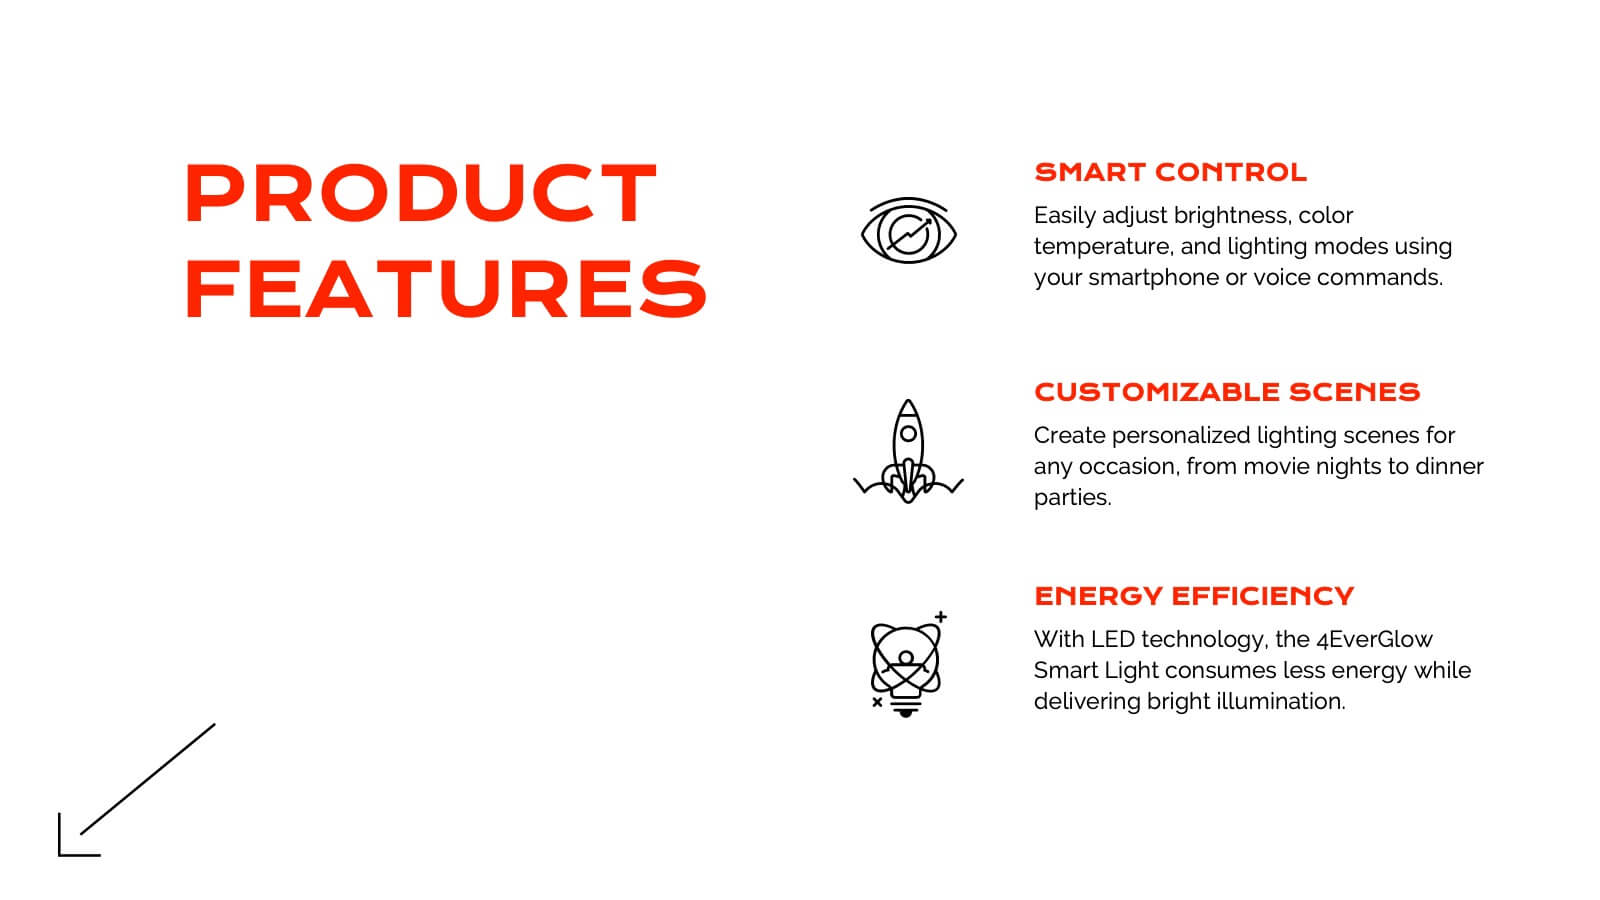
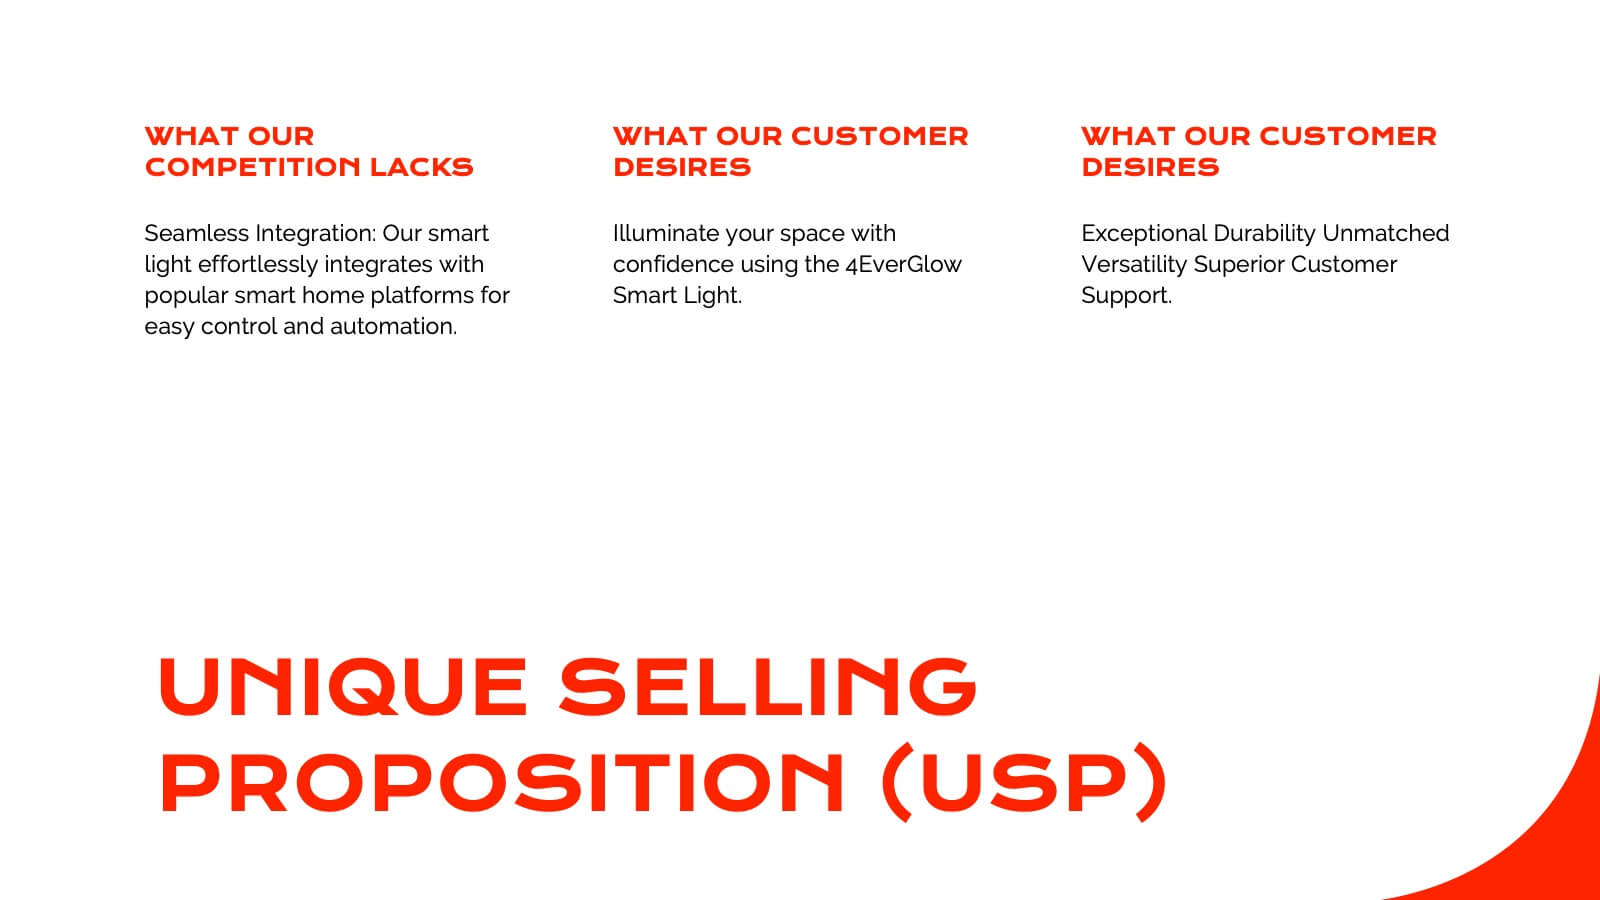
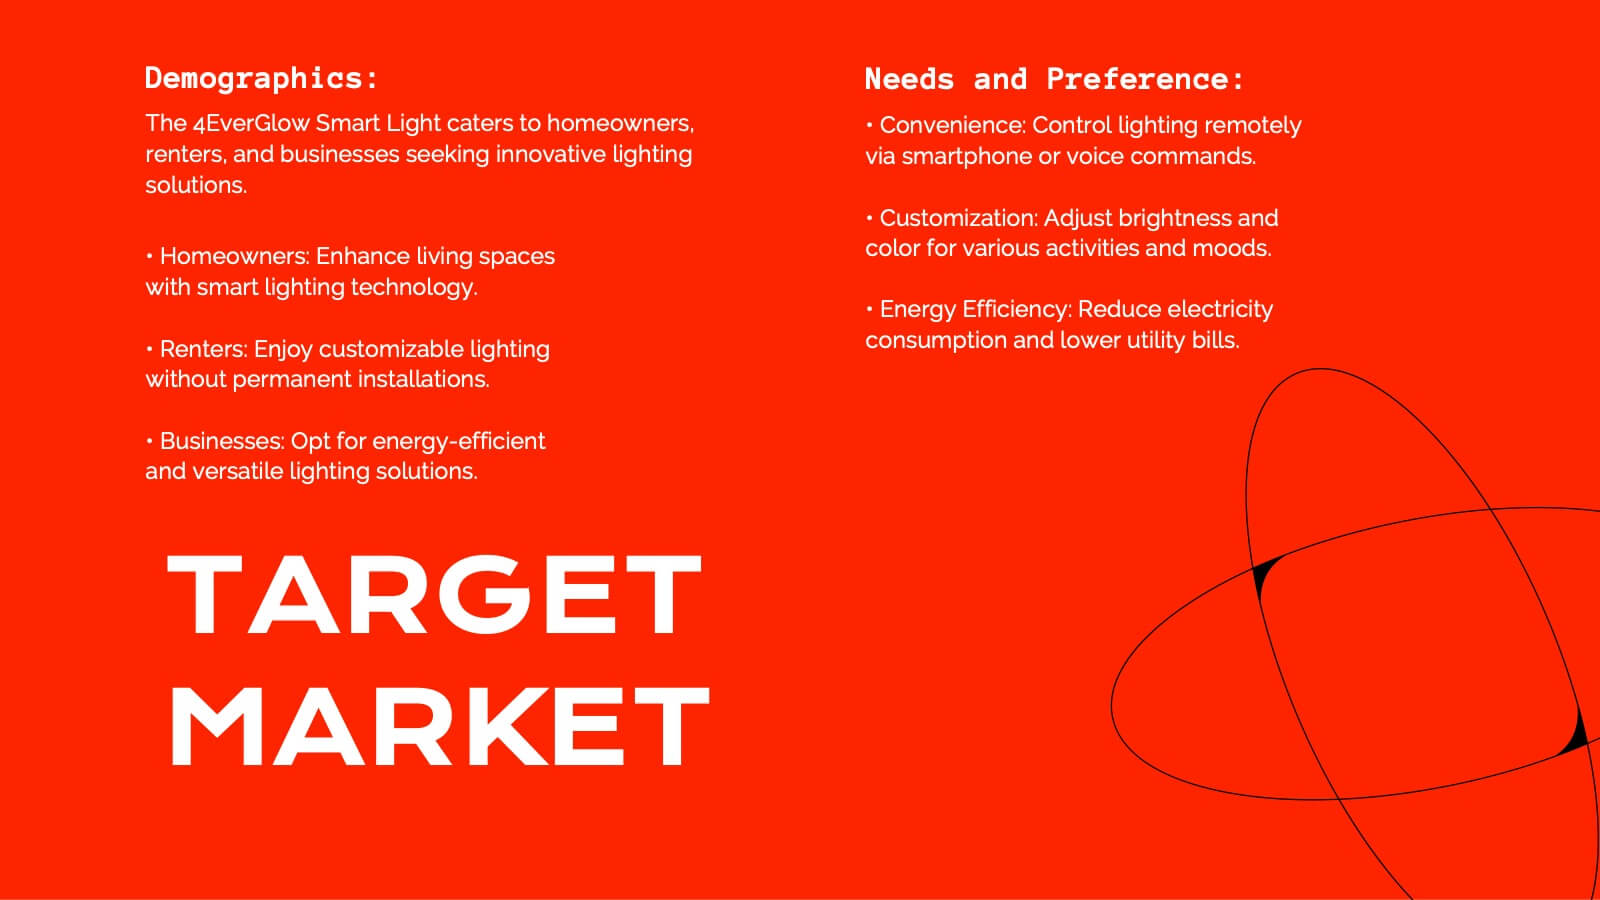
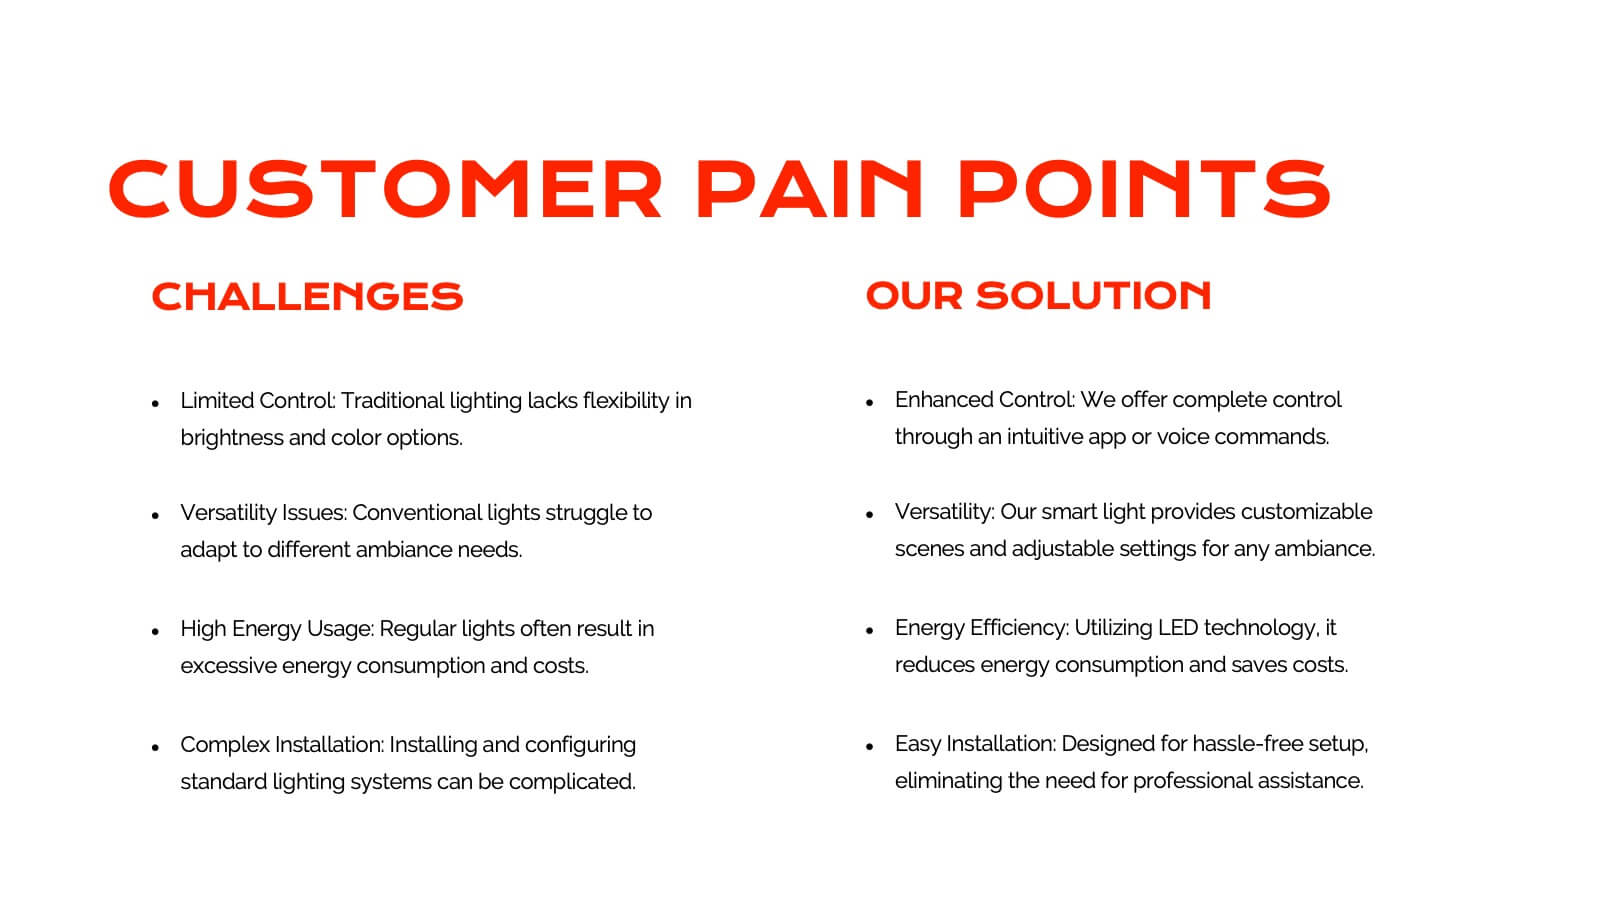
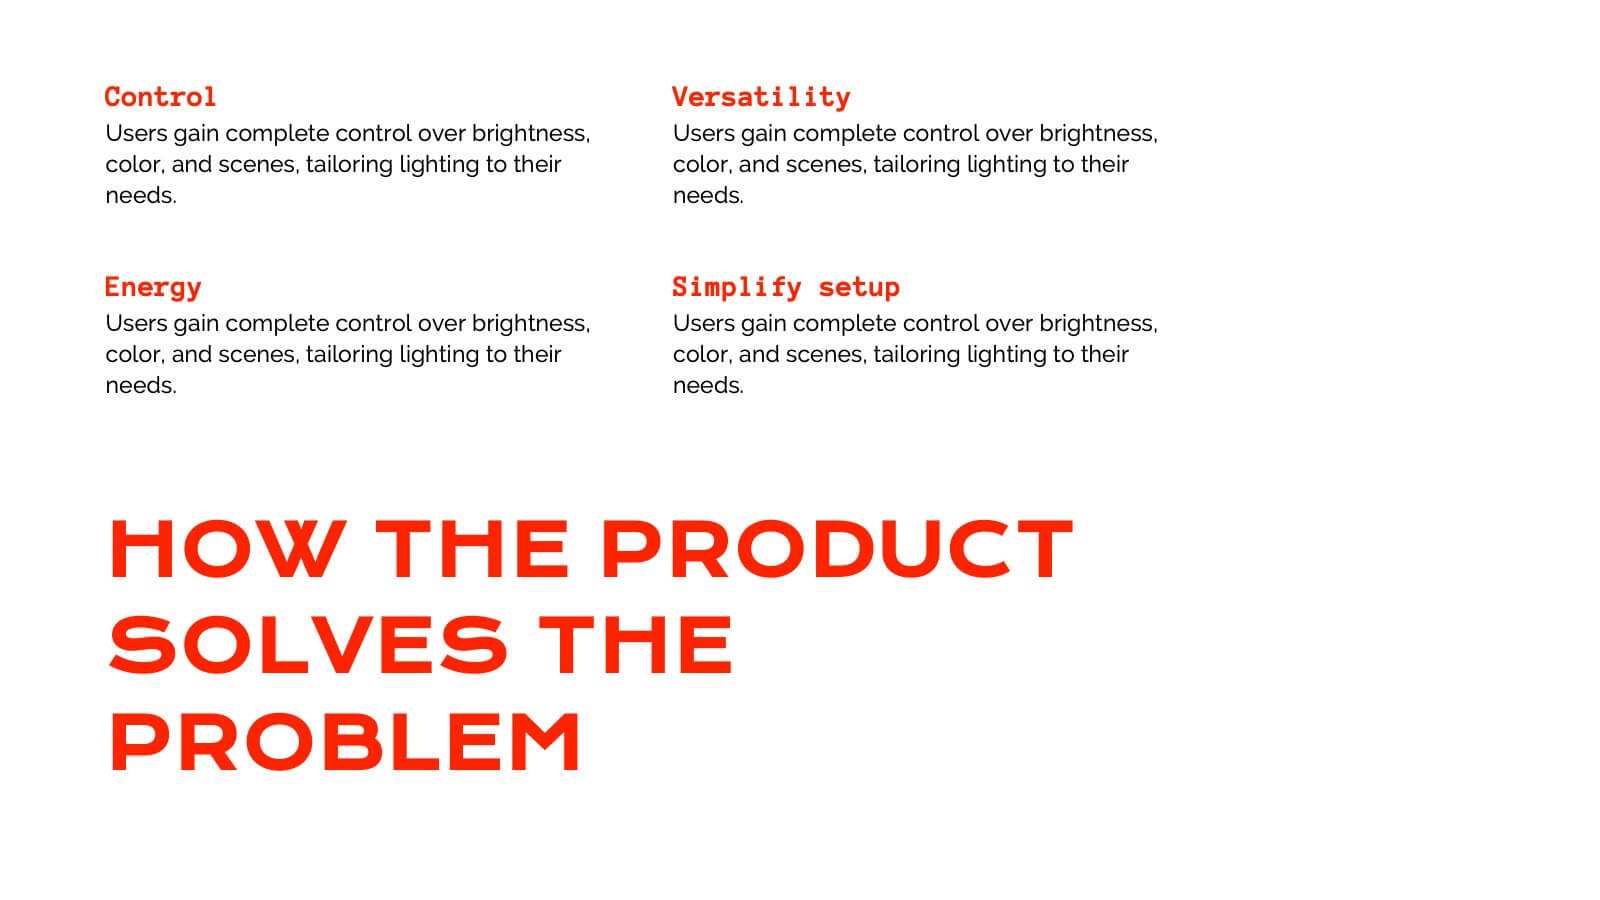
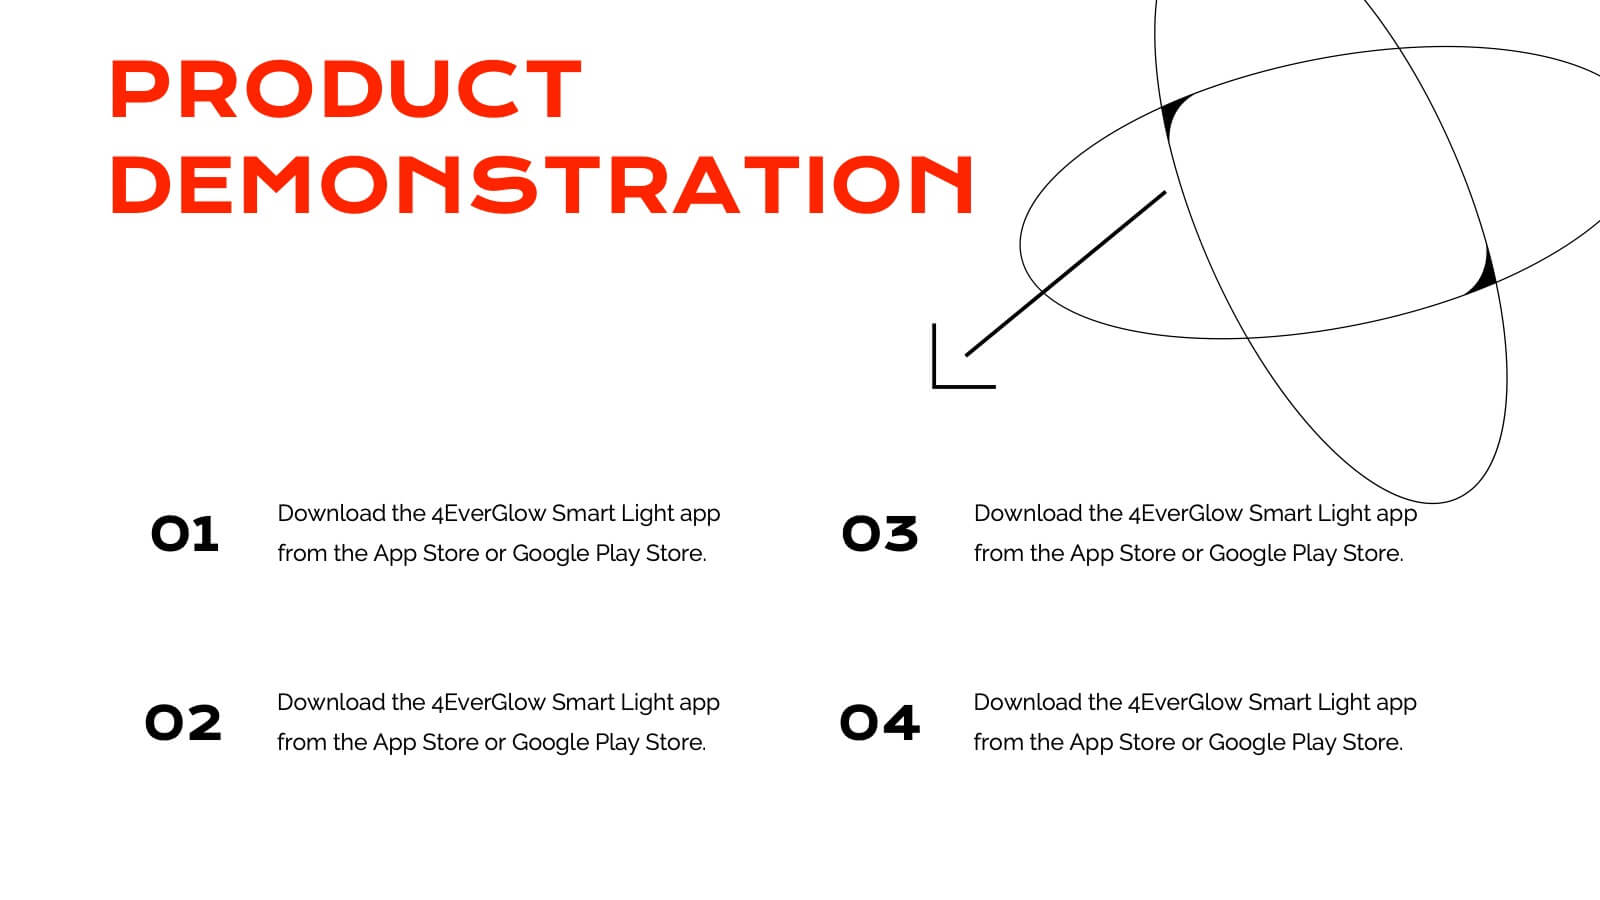
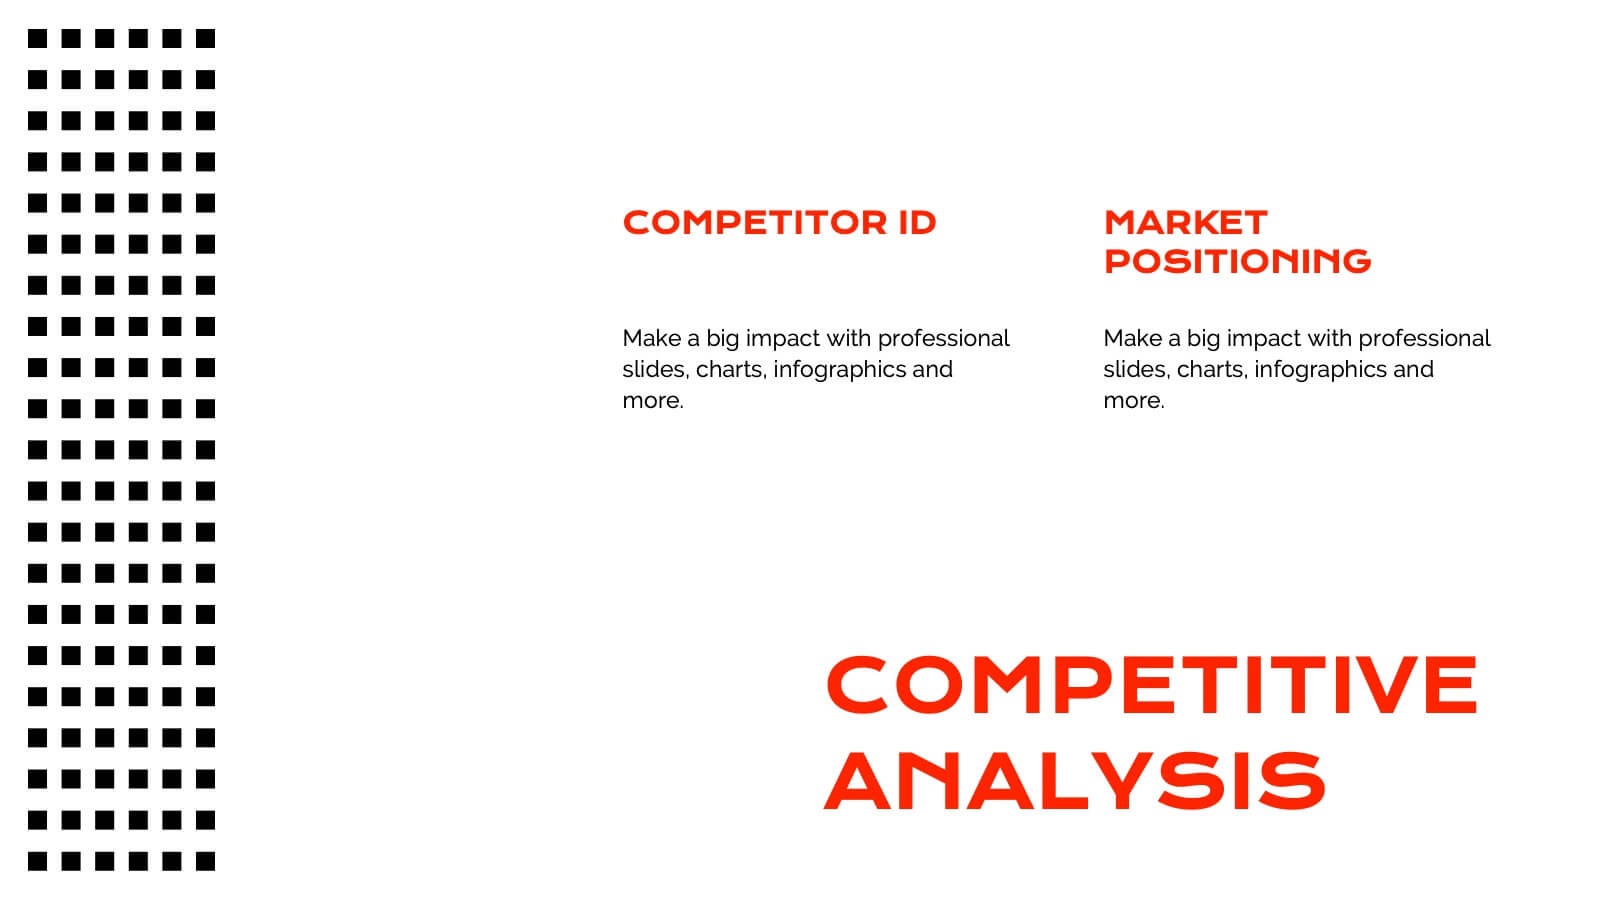
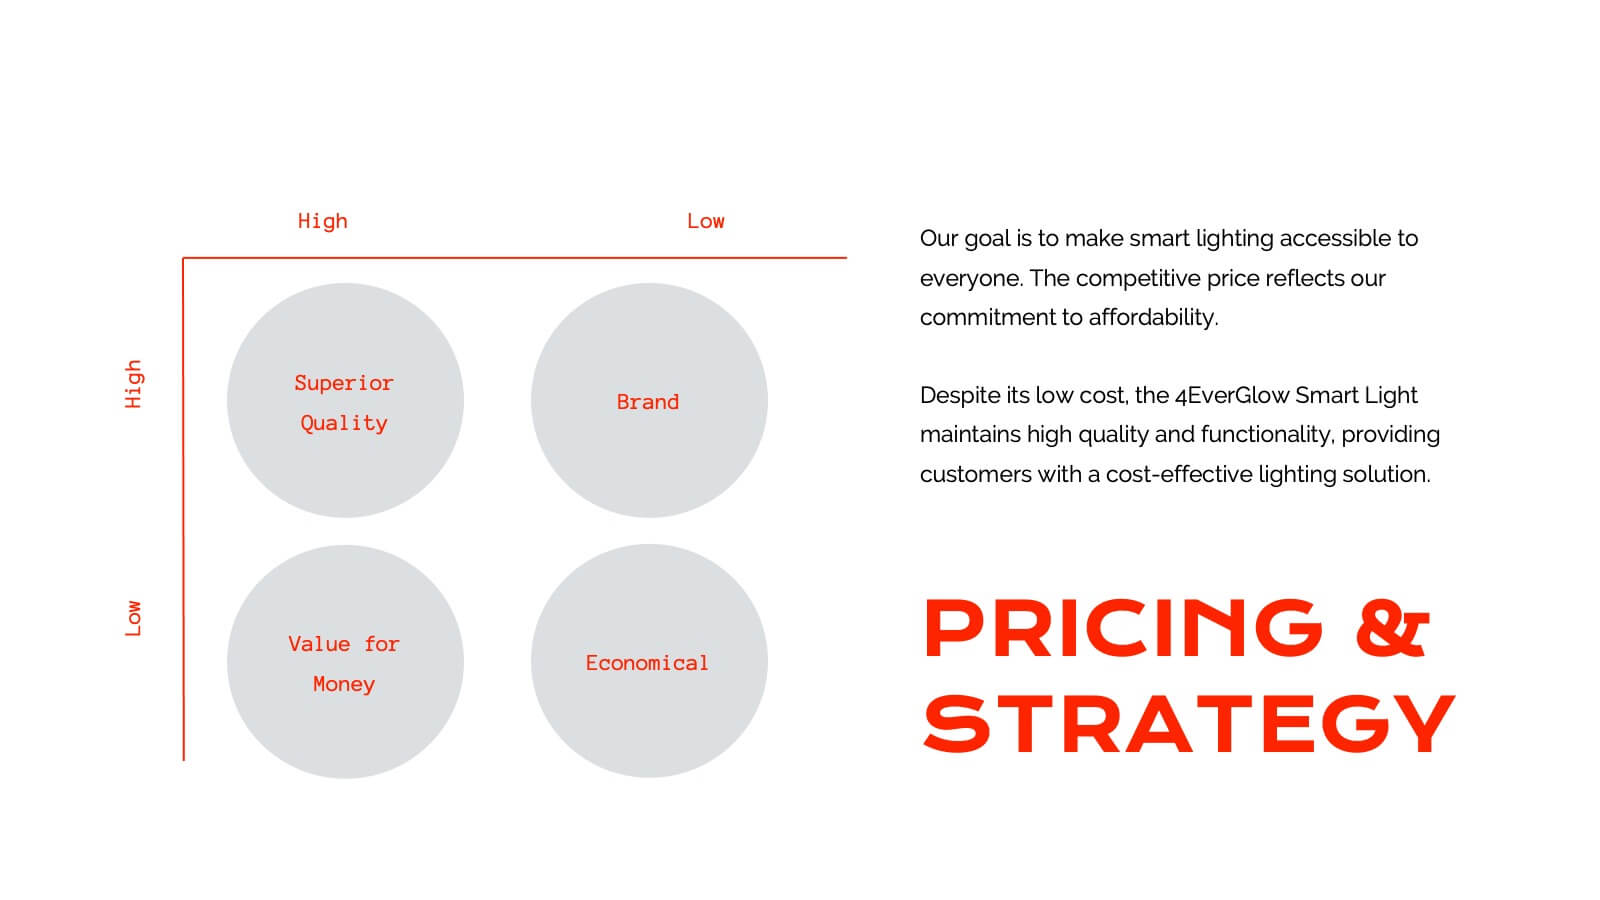
Juventas Product Roadmap Presentation
Get ready to dazzle your audience with a visually striking presentation that takes them through the entire product journey! This template covers essential areas such as product features, target market analysis, and competitive positioning. With its sleek, modern design, it's perfect for capturing attention and delivering clear information. Compatible with PowerPoint, Keynote, and Google Slides for effortless use across platforms.


8 diapositivas
SWOT-Based Competitive Analysis
Clearly map your organization’s strengths, weaknesses, opportunities, and threats with this dynamic infographic layout. Ideal for strategic planning sessions, this template uses a continuous loop to show interconnection between internal and external factors. Fully editable in PowerPoint, Keynote, and Google Slides.


21 diapositivas
Design Creative Concept Presentation
Enhance your creative presentations with this Creative Concept template. It features slides for objectives, color palettes, typography options, and prototyping steps. Ideal for designers and creative teams, this template supports PowerPoint, Keynote, and Google Slides, facilitating a comprehensive and engaging presentation of creative projects.


7 diapositivas
Simple Table of Content Slide Presentation
A clean, structured layout makes it easy to guide your audience through key sections with clarity and flow. This simple table of content slide helps you introduce topics, outline ideas, and set expectations in a polished, professional way. Fully compatible with PowerPoint, Keynote, and Google Slides.


5 diapositivas
Behavioral Psychology Diagram Presentation
Give your audience something to think about—literally. This bold and modern infographic layout lets you visualize complex human behavior patterns through simple, colorful brain-mapping diagrams. Perfect for presenting psychological insights, decision-making models, or behavioral science data. Fully compatible with PowerPoint, Keynote, and Google Slides for easy customization and professional use.


4 diapositivas
Executive Summary Business Presentation
Summarize key business insights effectively with this executive summary template! Designed to present an overview of your strategy, problem statement, solutions, and conclusions in a structured format, this layout ensures clarity and impact. Ideal for reports, proposals, and business plans. Fully customizable and compatible with PowerPoint, Keynote, and Google Slides.


7 diapositivas
Team Leadership and Management Presentation
Unlock the secrets of effective team leadership and management with our detailed presentation template. Designed for training sessions and workshops, it provides clear guidance on key leadership principles and team management tactics through engaging graphics and strategic layouts. Ideal for enhancing team dynamics and leadership skills.


5 diapositivas
Capital Allocation Strategy Overview
Break down your financial strategy visually with the Capital Allocation Strategy Overview Presentation. This semi-circle diagram helps you present four key spending or investment categories clearly and professionally. Ideal for budget planning, operational expenses, or strategic financial decisions. Fully editable in PowerPoint, Keynote, and Google Slides.