


Características


¿Tienes alguna pregunta?
Recomendar


23 diapositivas
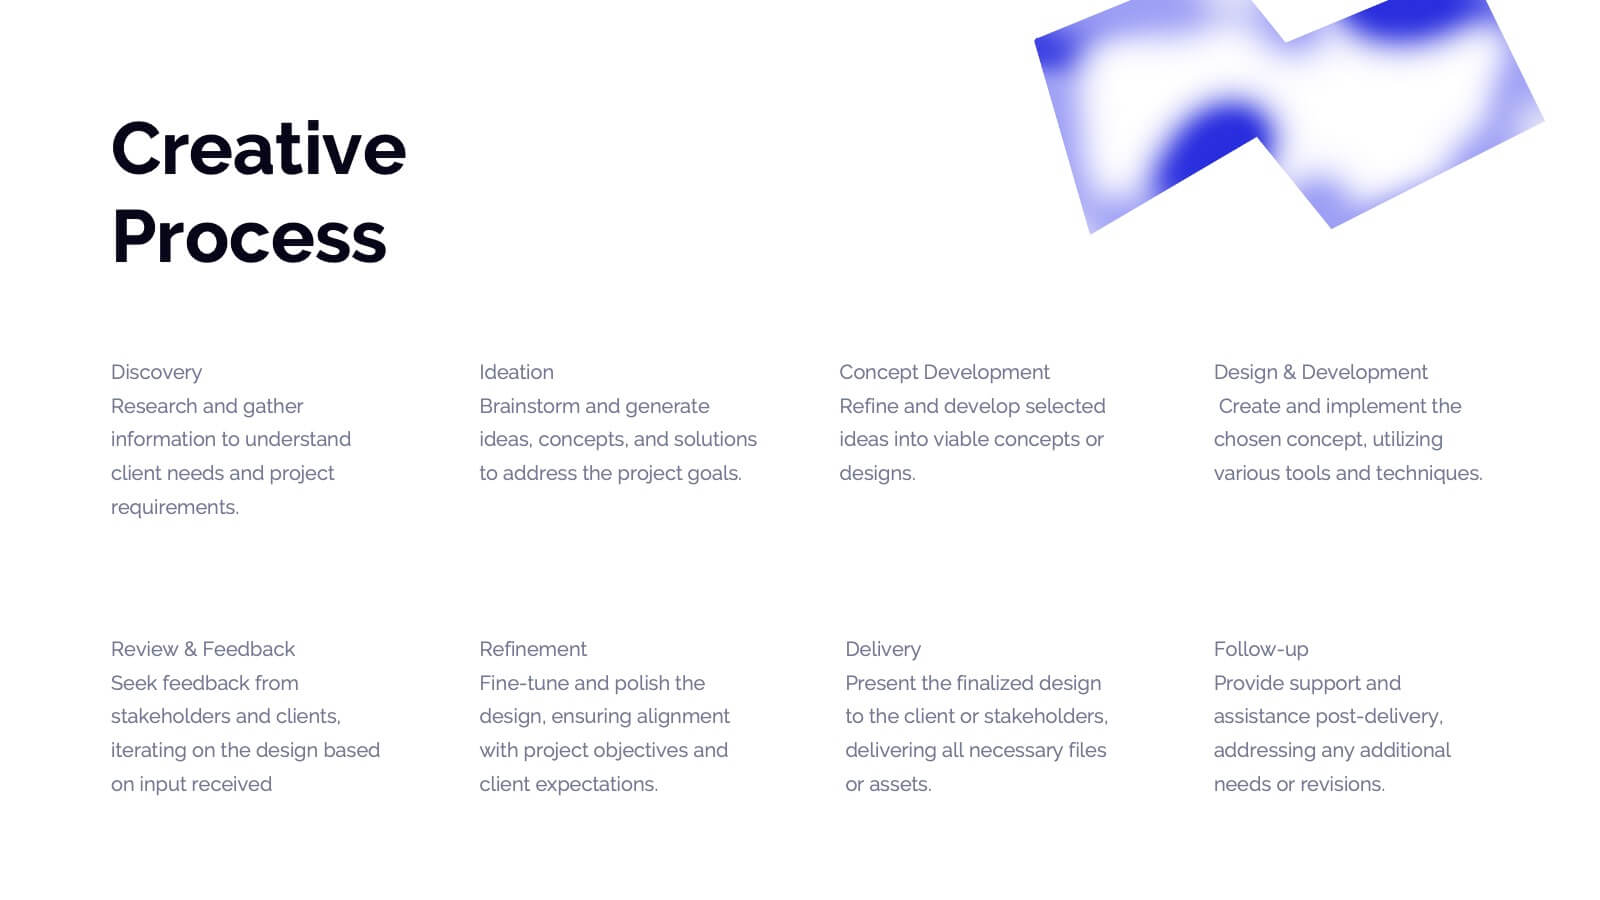
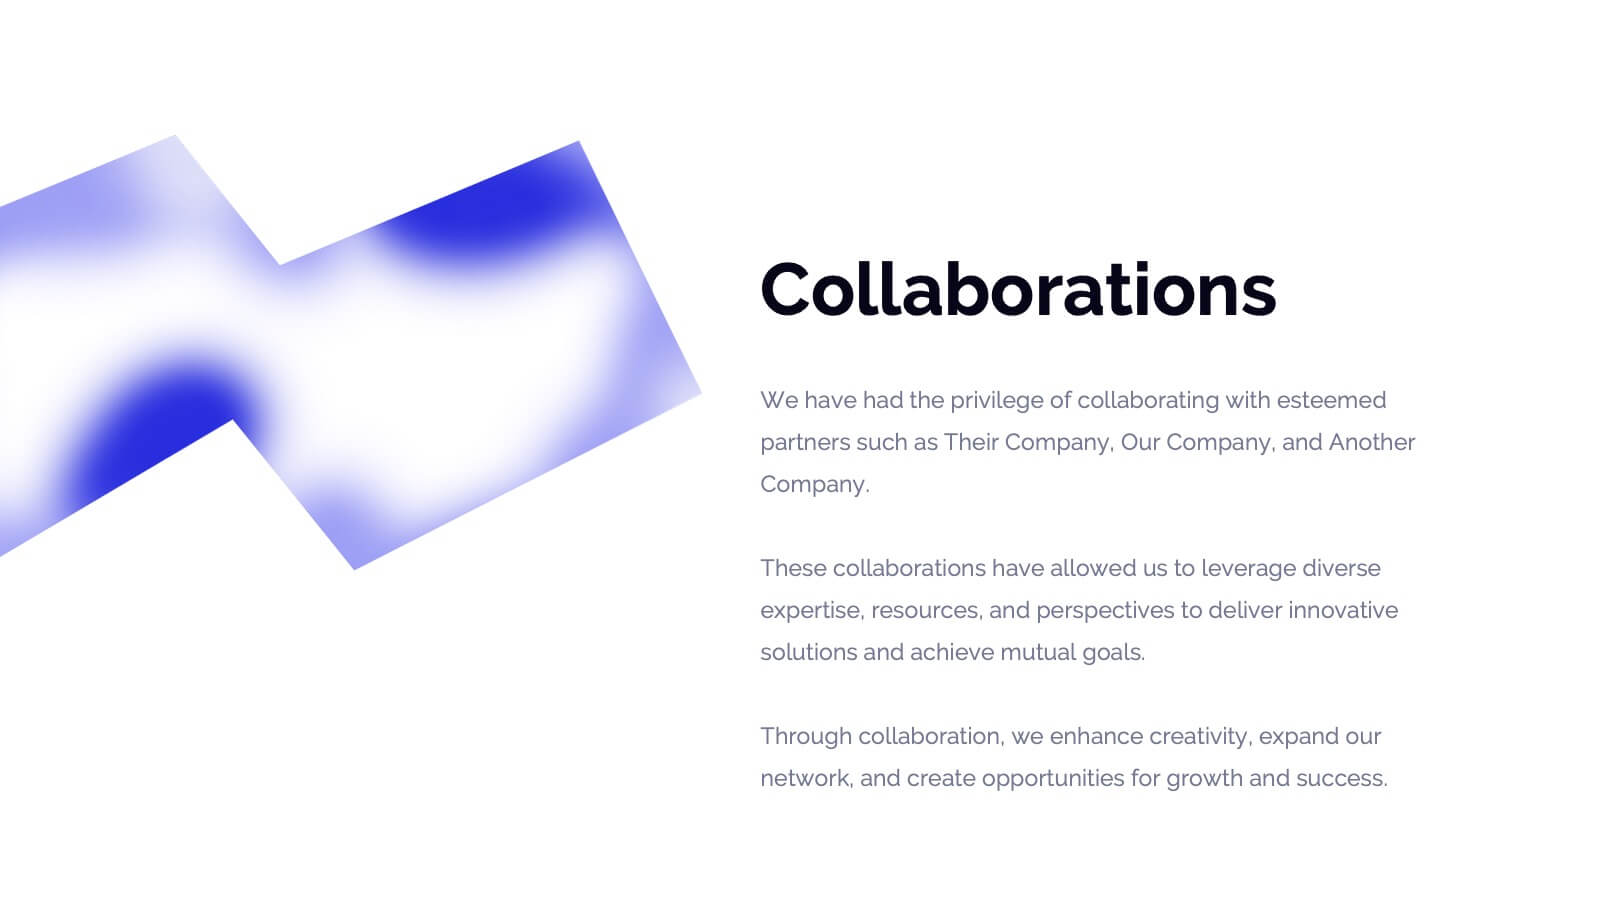
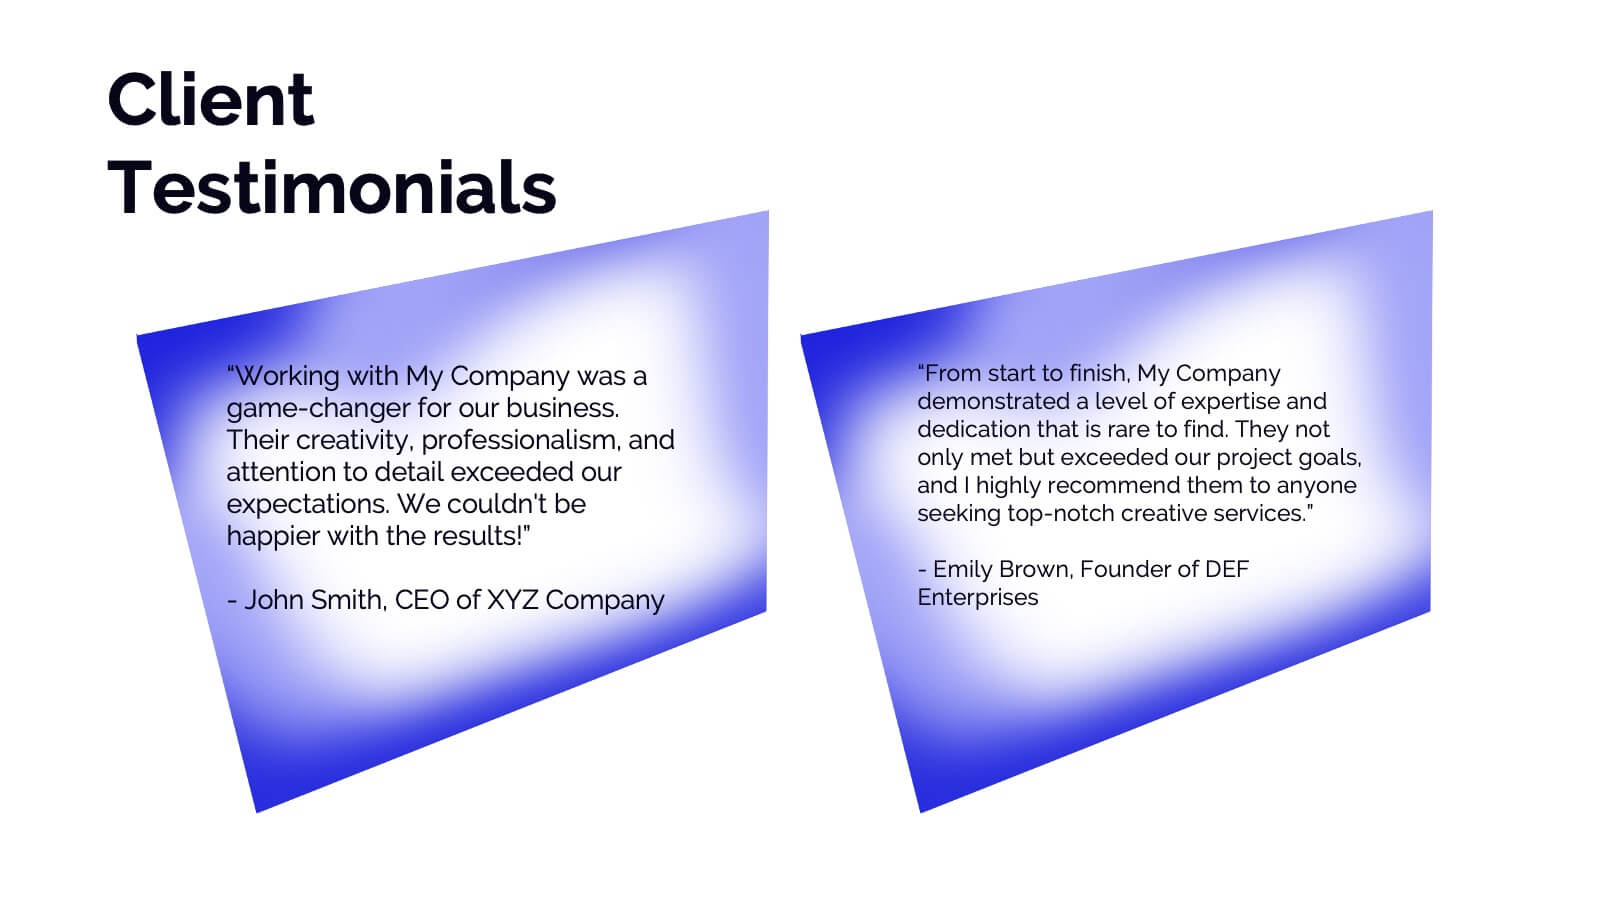
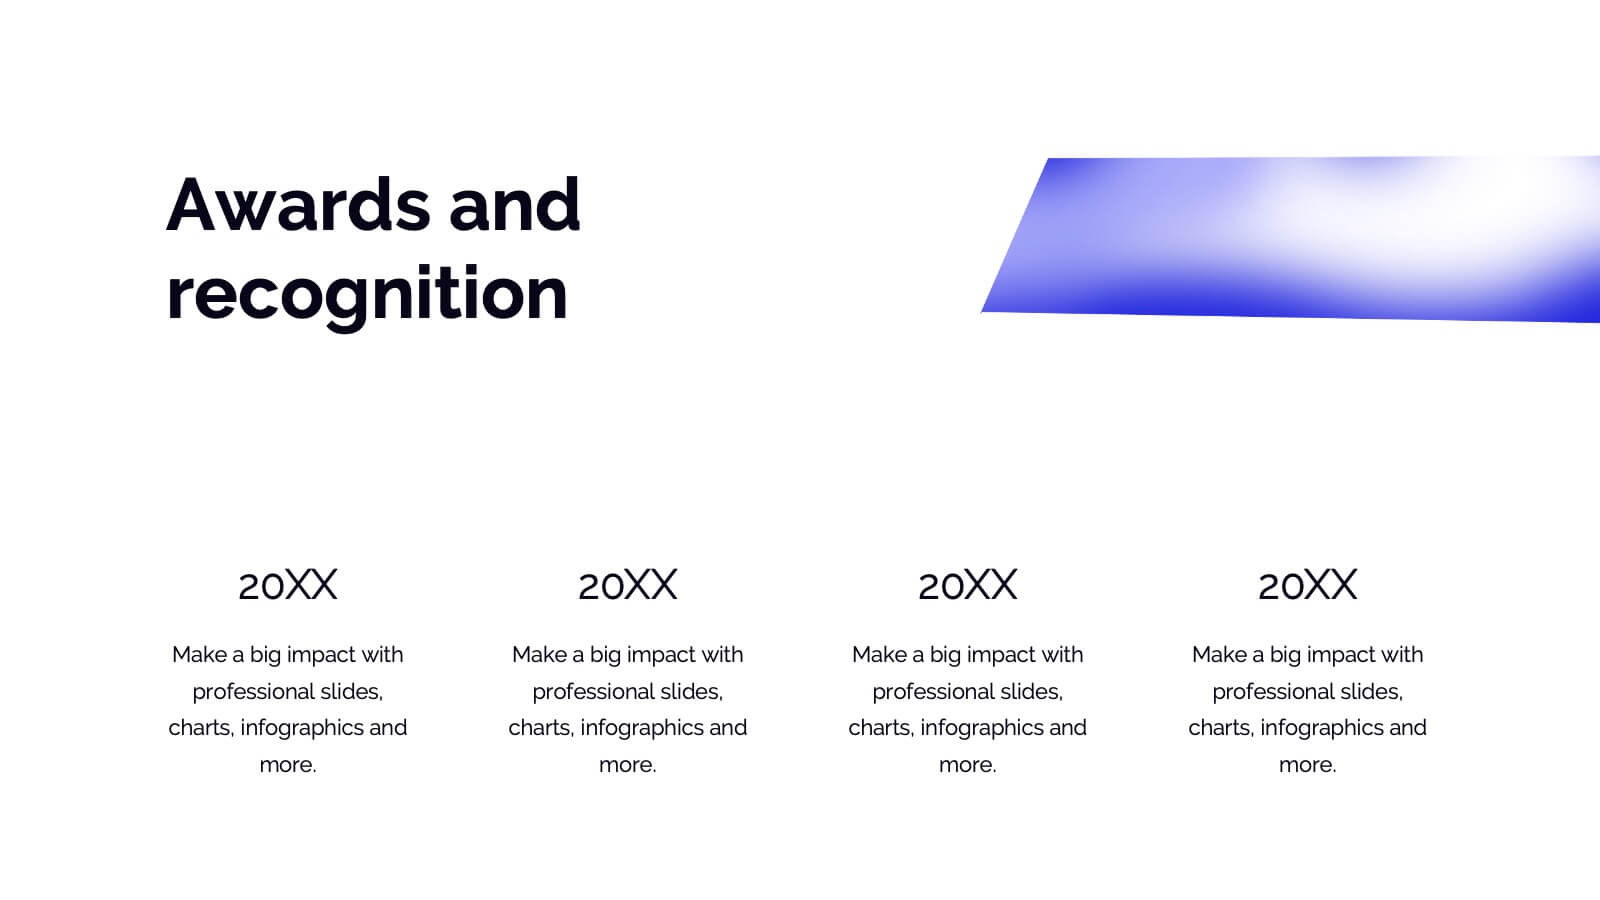
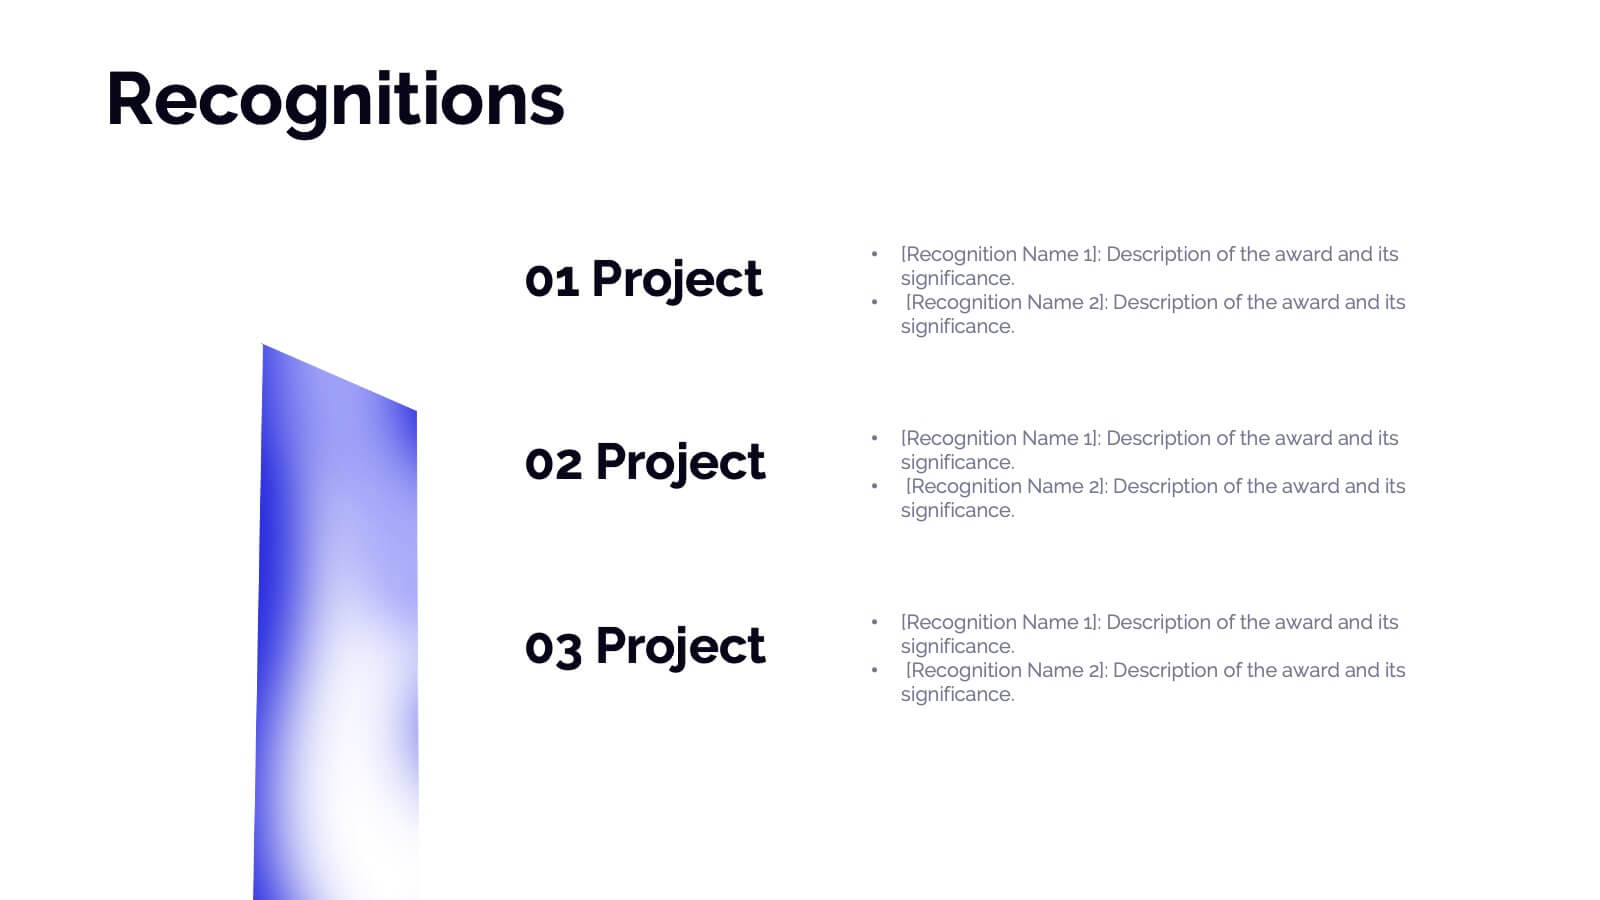
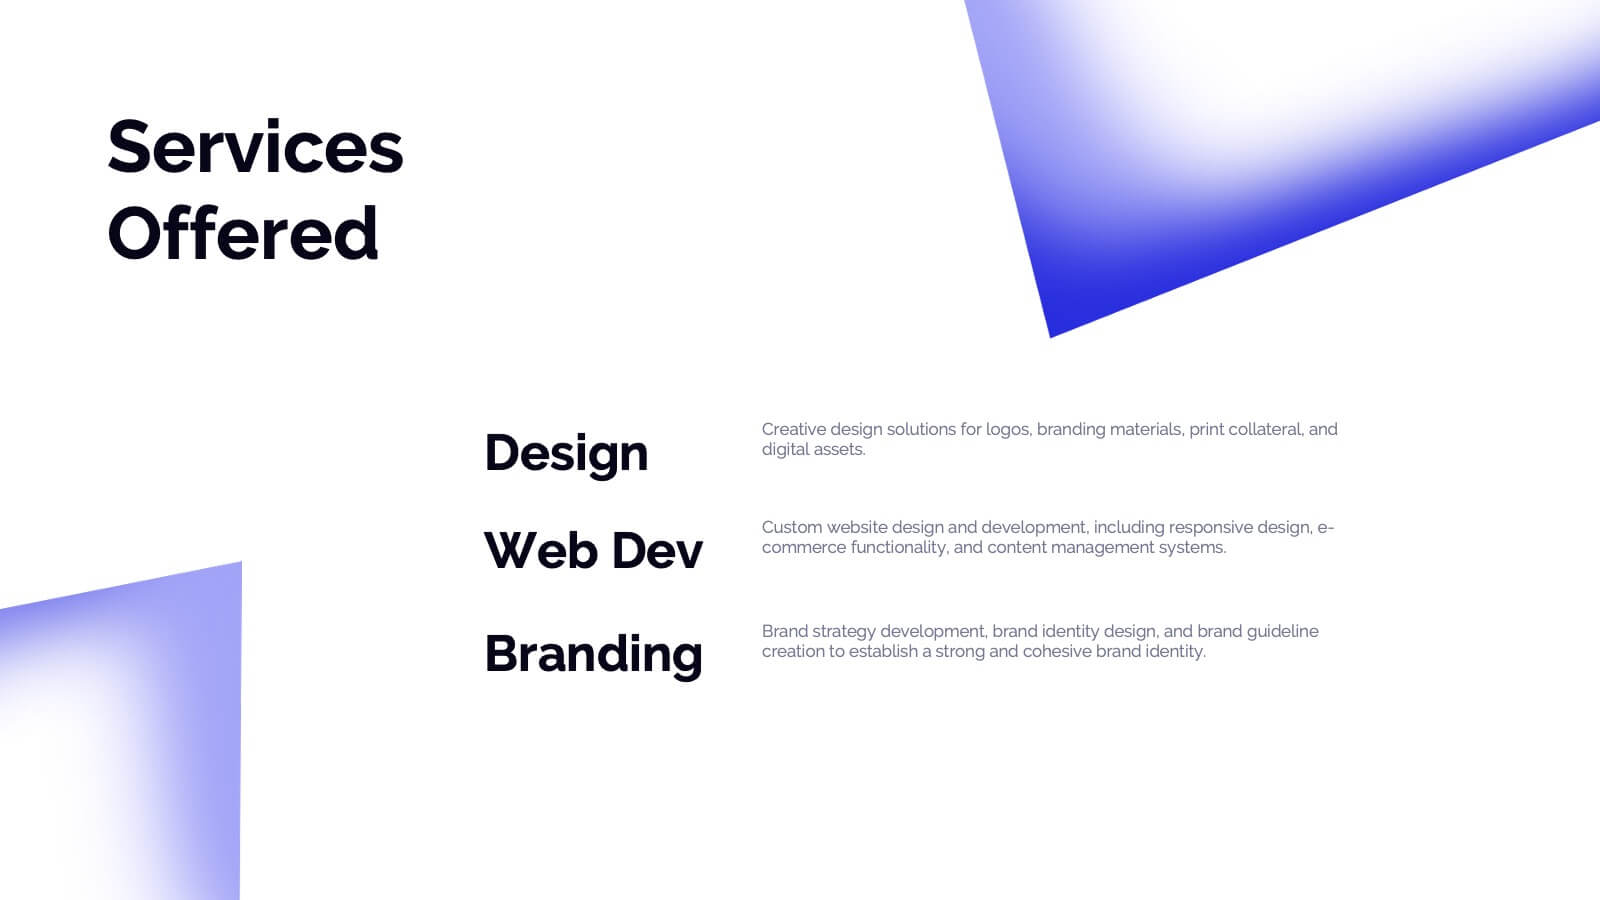
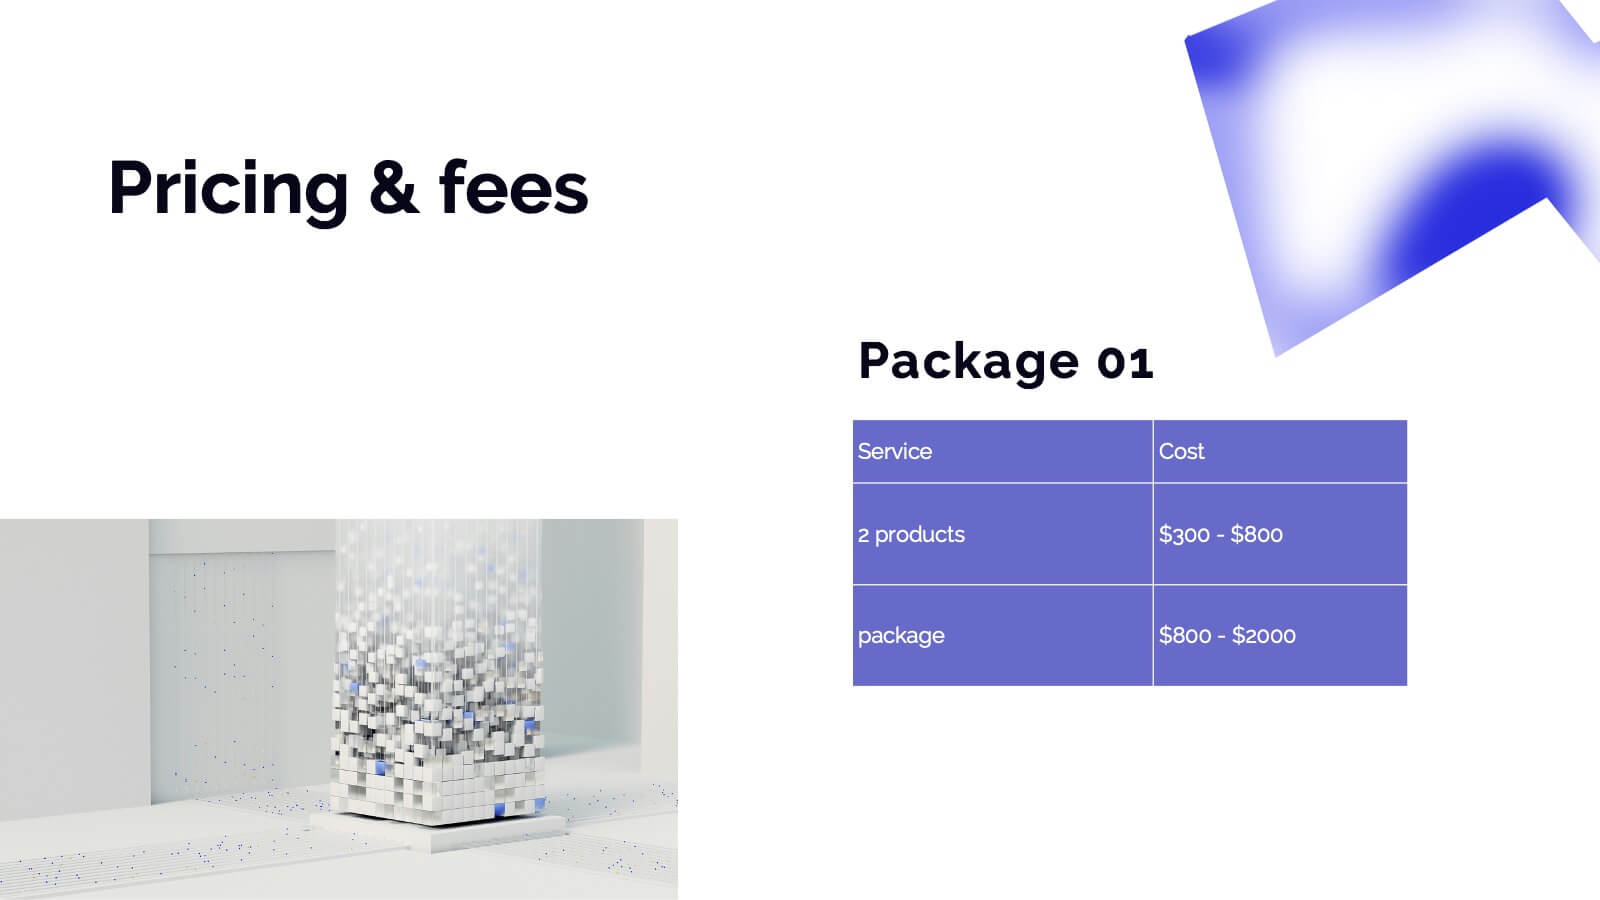
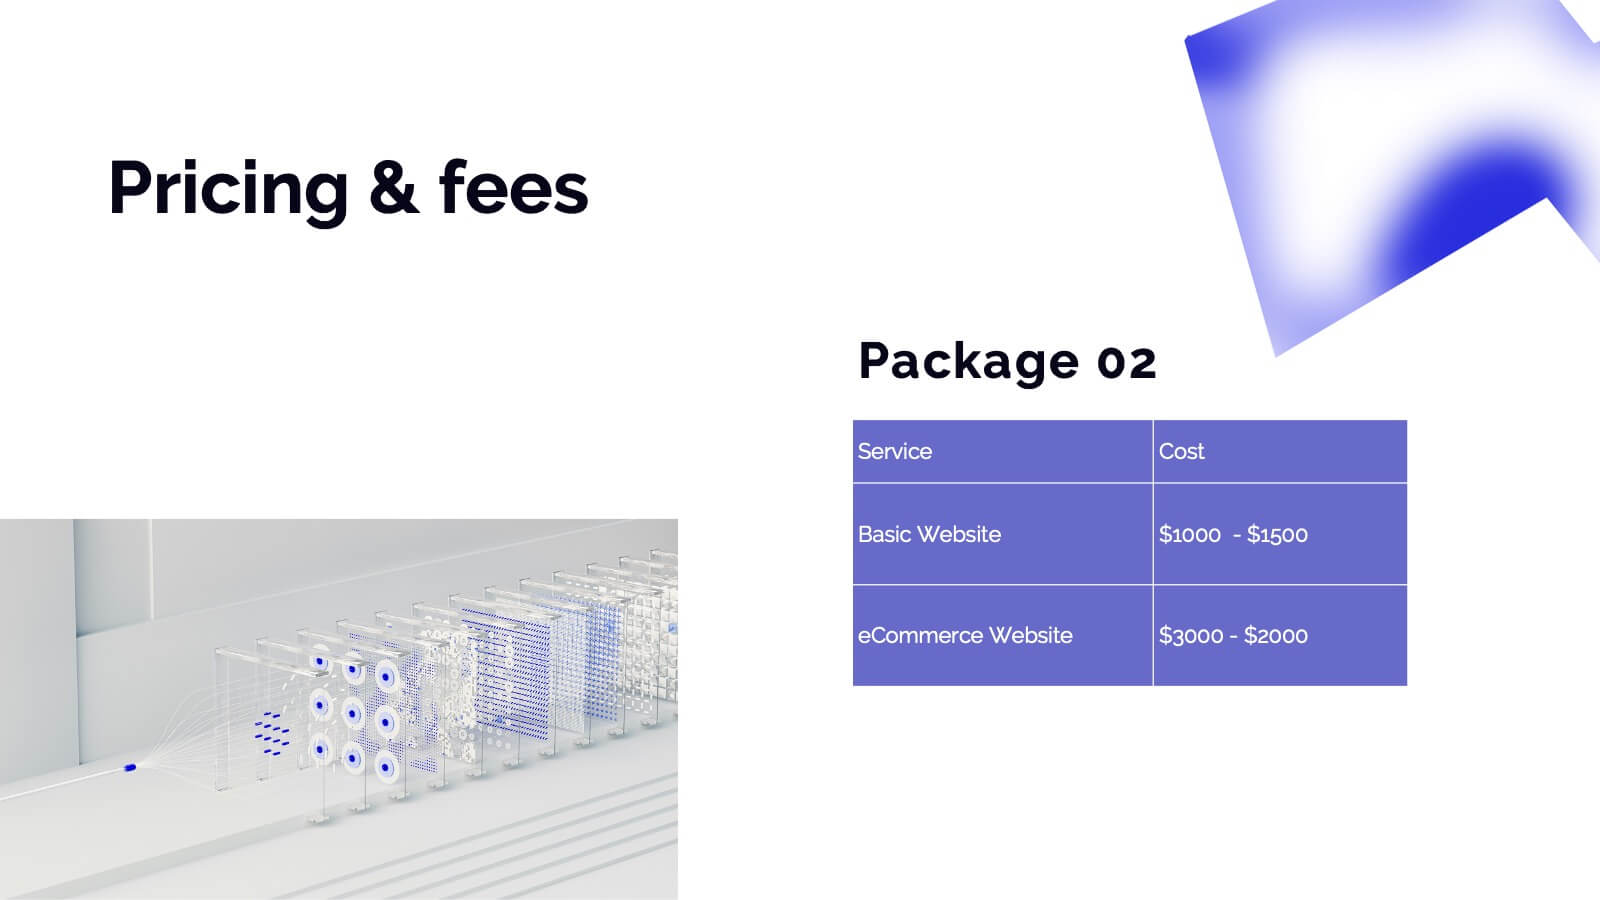
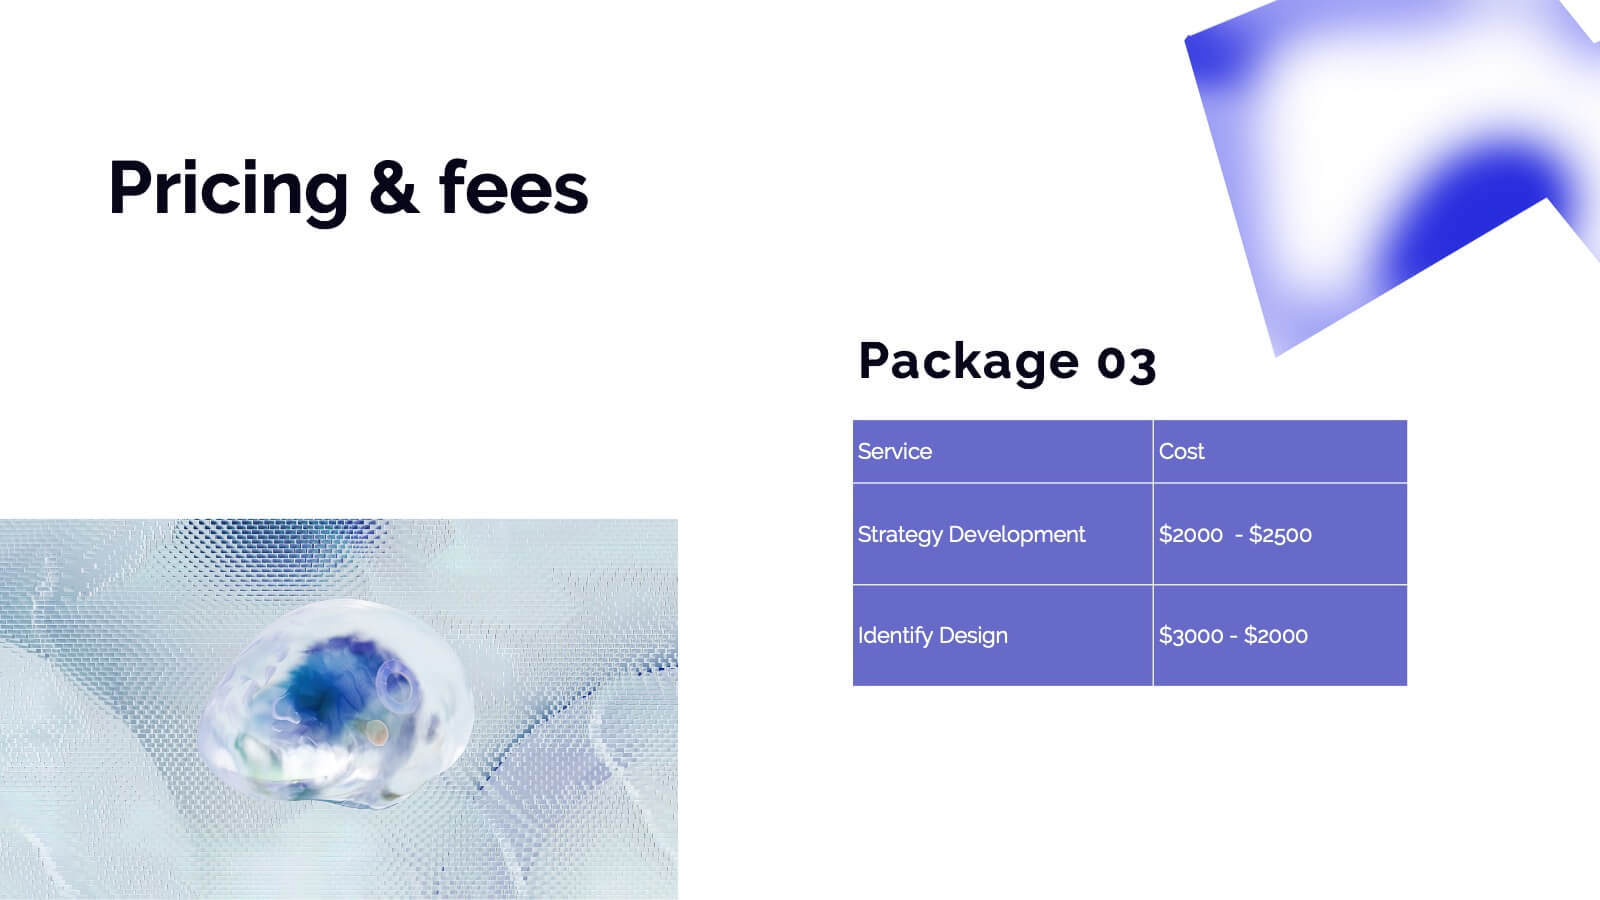
Dryad Photography Portfolio Template Presentation
Showcase your photography skills with this elegant and professional portfolio presentation template! Perfect for highlighting your projects, style, and creative process, this template covers everything from client testimonials to pricing and services offered. It’s ideal for photographers wanting to present their work with style and clarity. Compatible with PowerPoint, Keynote, and Google Slides for effortless sharing and presentations.


21 diapositivas
Moonshade Strategic Planning Report Presentation
This strategic planning template provides a comprehensive framework to align your business objectives with actionable plans. With sections for SWOT analysis, resource allocation, key metrics, and growth opportunities, it ensures that every element is covered for successful execution. Customizable in PowerPoint, Keynote, and Google Slides, it's perfect for building focused, strategic initiatives.


8 diapositivas
Effective Task Delegation with RACI Presentation
Streamline task ownership and team collaboration using this Effective Task Delegation with RACI template. Featuring a bold, visually segmented layout, this slide helps clearly define who is Responsible, Accountable, Consulted, and Informed for each step of your workflow. Perfect for project managers, HR leaders, and operations teams seeking to enhance clarity, reduce bottlenecks, and boost productivity. Fully customizable in PowerPoint, Keynote, and Google Slides to match your team structure and brand style.


5 diapositivas
Smart Agriculture and Sustainability Trends
Highlight the future of farming with the Smart Agriculture and Sustainability Trends Presentation. This slide features a sleek visual progression of plant growth stages, symbolizing innovation, eco-conscious development, and data-driven agricultural trends. Ideal for sustainability reports, agritech proposals, and environmental briefings. Fully editable and compatible with PowerPoint, Keynote, and Google Slides.


7 diapositivas
Human Resources Administration Infographic
Human Resources Administration involves managing and overseeing various aspects of an organization's human capital and related processes. Our HR administration Infographic is your compass in the vast realm of HR, guiding you through essential aspects, best practices, and strategies crucial for successful HR management. This template is your guide to navigating the HR terrain. Compatible with Powerpoint, Keynote, and Google Slides. Discover best practices, strategies, and essential aspects of HR, empowering you to lead with expertise, empathy, and efficiency in the exciting world of human resources.


4 diapositivas
Insurance Business Overview Presentation
Bring clarity and professionalism to your financial presentations with this sleek and modern design. Ideal for outlining key insights, policies, or service breakdowns, it visually communicates business protection and stability. Fully customizable and compatible with PowerPoint, Keynote, and Google Slides for an engaging and polished presentation experience.


10 diapositivas
Financial Dashboard Report Presentation
Stay on top of your financial metrics with the Financial Dashboard Report Presentation. Featuring clean visuals like line charts and icon-labeled KPIs, this layout makes complex data easy to understand. Perfect for monthly reviews, investor updates, or business reports. Fully editable in PowerPoint, Keynote, and Google Slides.


10 diapositivas
Agile Project Status Review Presentation
Streamline your Agile methodologies with our "Agile Project Status Review" presentation templates. Designed to enhance visual communication, these templates help you effectively display project phases from start to finish. Ideal for dynamic project management, they are compatible with PowerPoint, Keynote, and Google Slides, ensuring seamless integration into your workflow.


4 diapositivas
Left and Right Brain Diagram Presentation
Unlock the perfect blend of logic and creativity with a visual layout that highlights how analytical thinking and imaginative ideas work together. This presentation makes it easy to compare concepts, explain processes, and illustrate dual perspectives with clarity and color. Fully compatible with PowerPoint, Keynote, and Google Slides.


4 diapositivas
Sustainable Farming Practices Presentation
Explore the essentials of sustainable farming with our visually engaging presentation template. Perfect for educational and advocacy purposes, it outlines key practices that promote environmental sustainability in agriculture. This template features easy-to-understand graphics and placeholders for comprehensive discussions on eco-friendly farming techniques.


6 diapositivas
Scrum Team Roles and Sprint Planning Presentation
Visualize your Agile workflow with this Scrum team diagram. Highlight roles, responsibilities, and key sprint planning phases in a clear, circular flow. Ideal for project managers, team leads, or Agile coaches. Fully editable in PowerPoint, Keynote, and Google Slides to support your software development or Agile training presentations.


5 diapositivas
Team Roles and Responsibilities Matrix Presentation
Define accountability with this Team Roles and Responsibilities Matrix. Clearly map tasks to team members using RACI codes (Responsible, Accountable, Consulted, Informed). Ideal for project planning, cross-functional alignment, and team coordination. Fully editable and compatible with PowerPoint, Keynote, and Google Slides to suit any workflow or team structure.


27 diapositivas
Drift Rebranding Project Plan Presentation
Transform your brand with this comprehensive rebranding project template! Perfect for presenting brand identity, market analysis, and strategic positioning, it includes slides for logos, color palettes, and brand guidelines. Engage your audience with visually striking designs and detailed content. Compatible with PowerPoint, Keynote, and Google Slides for easy, professional presentations on any platform.


21 diapositivas
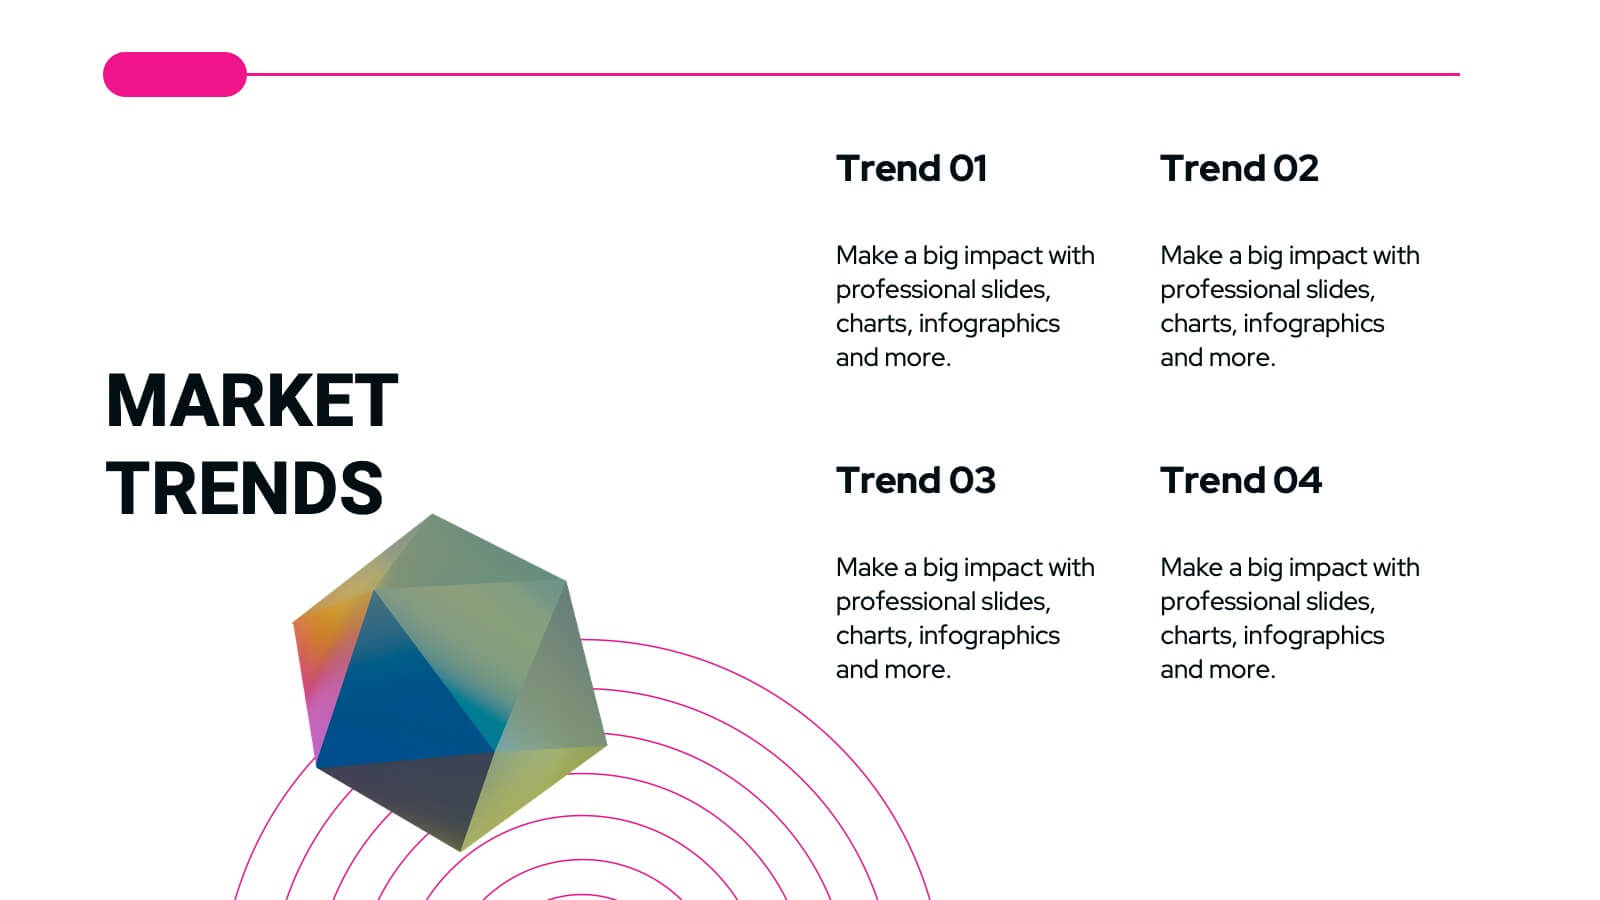
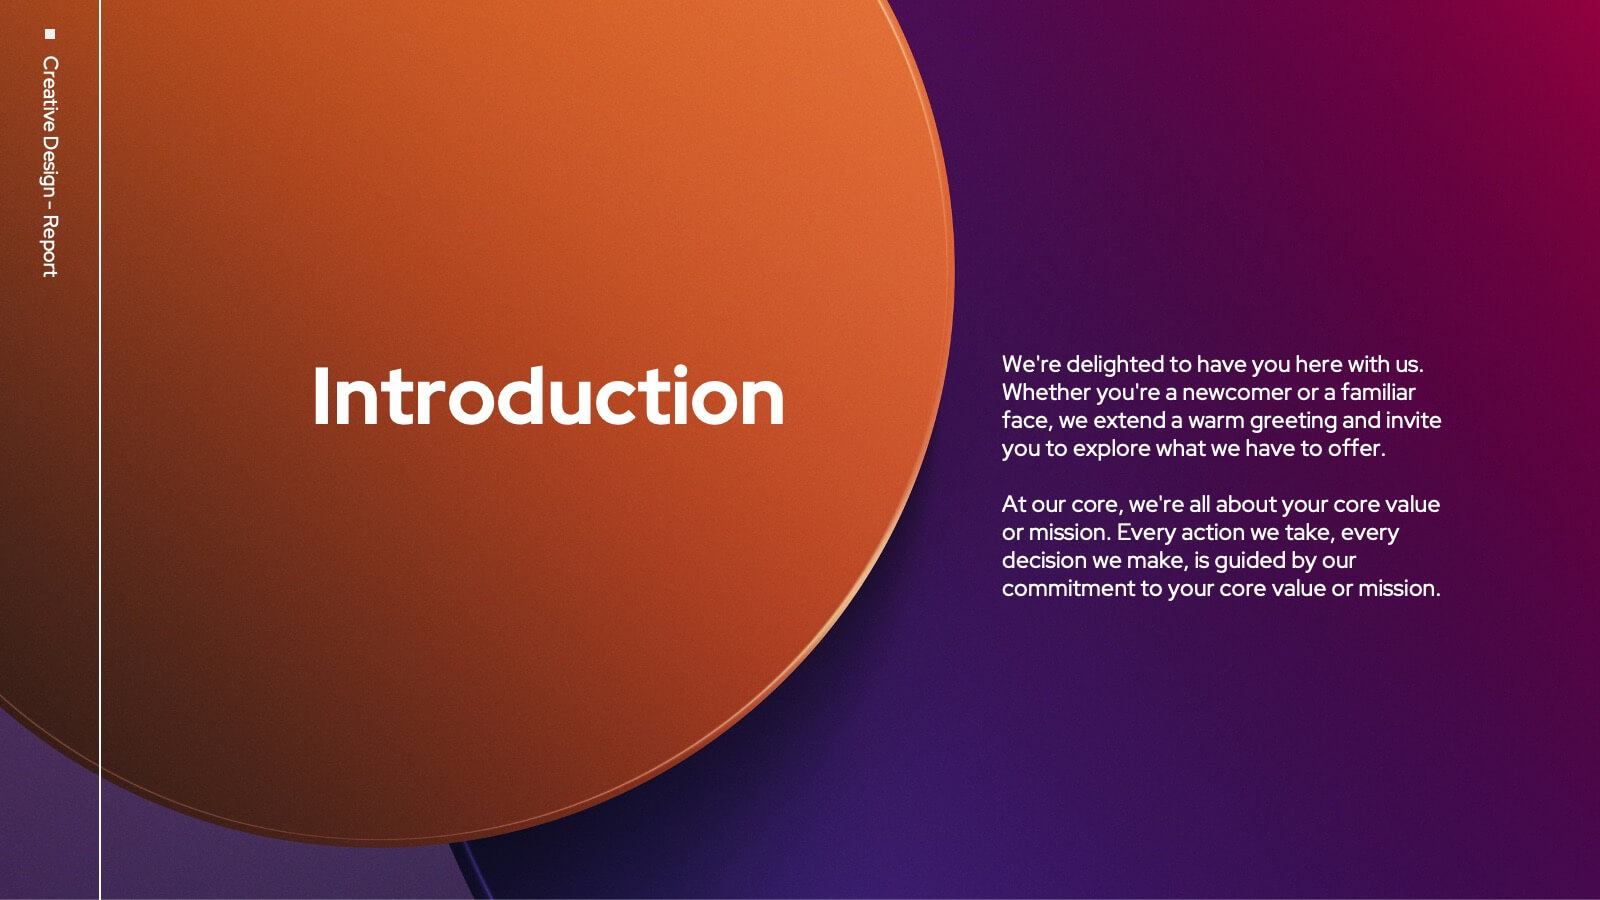
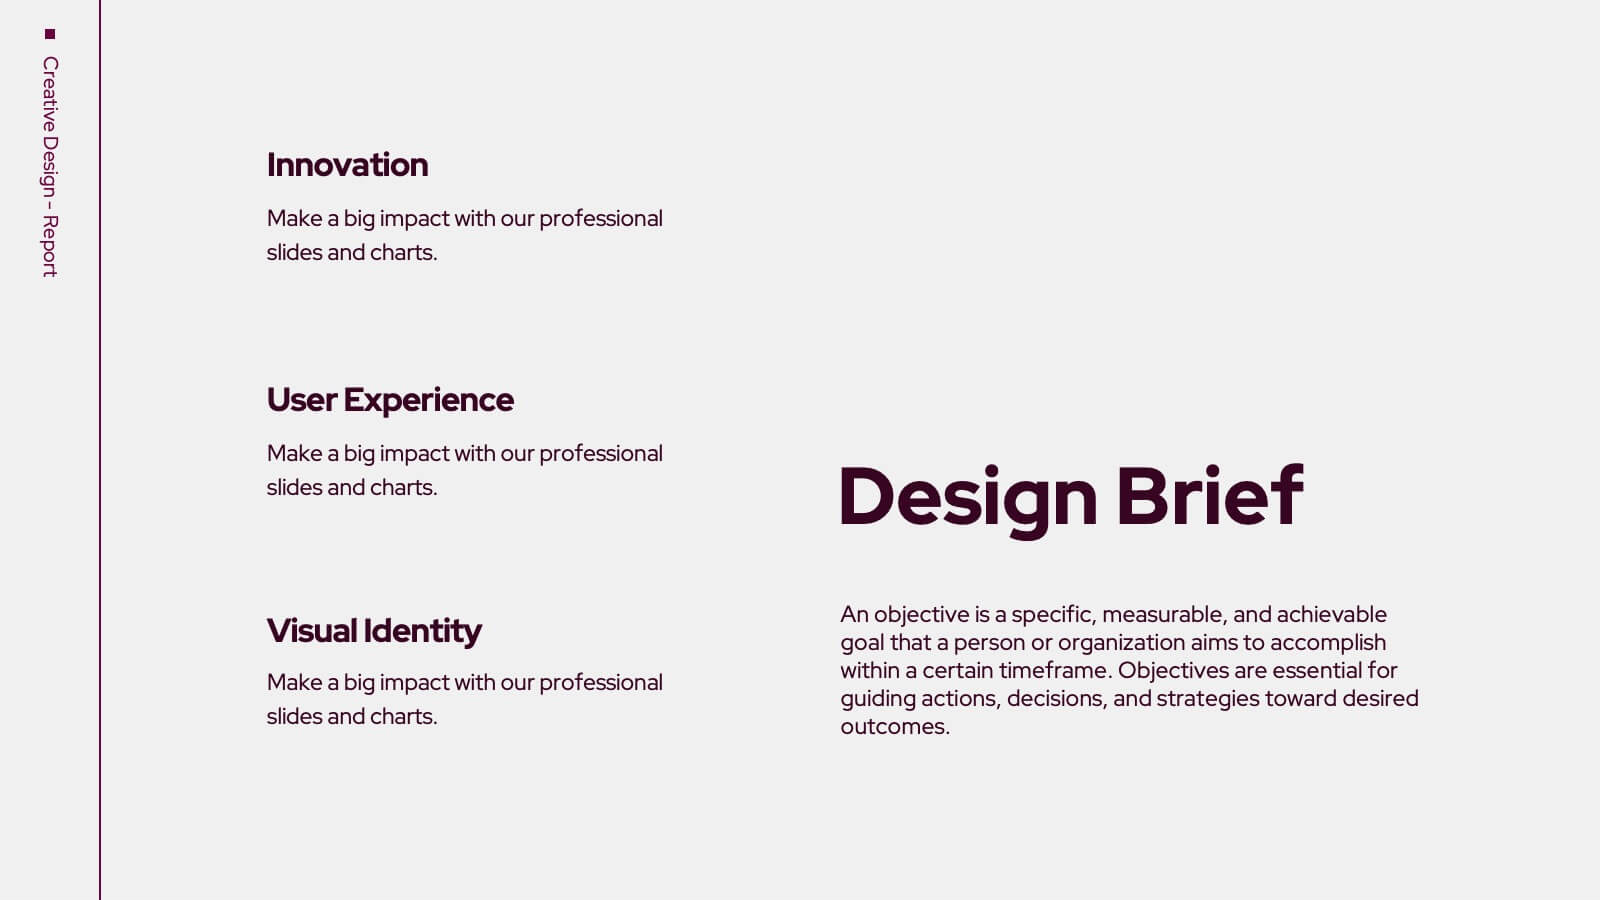
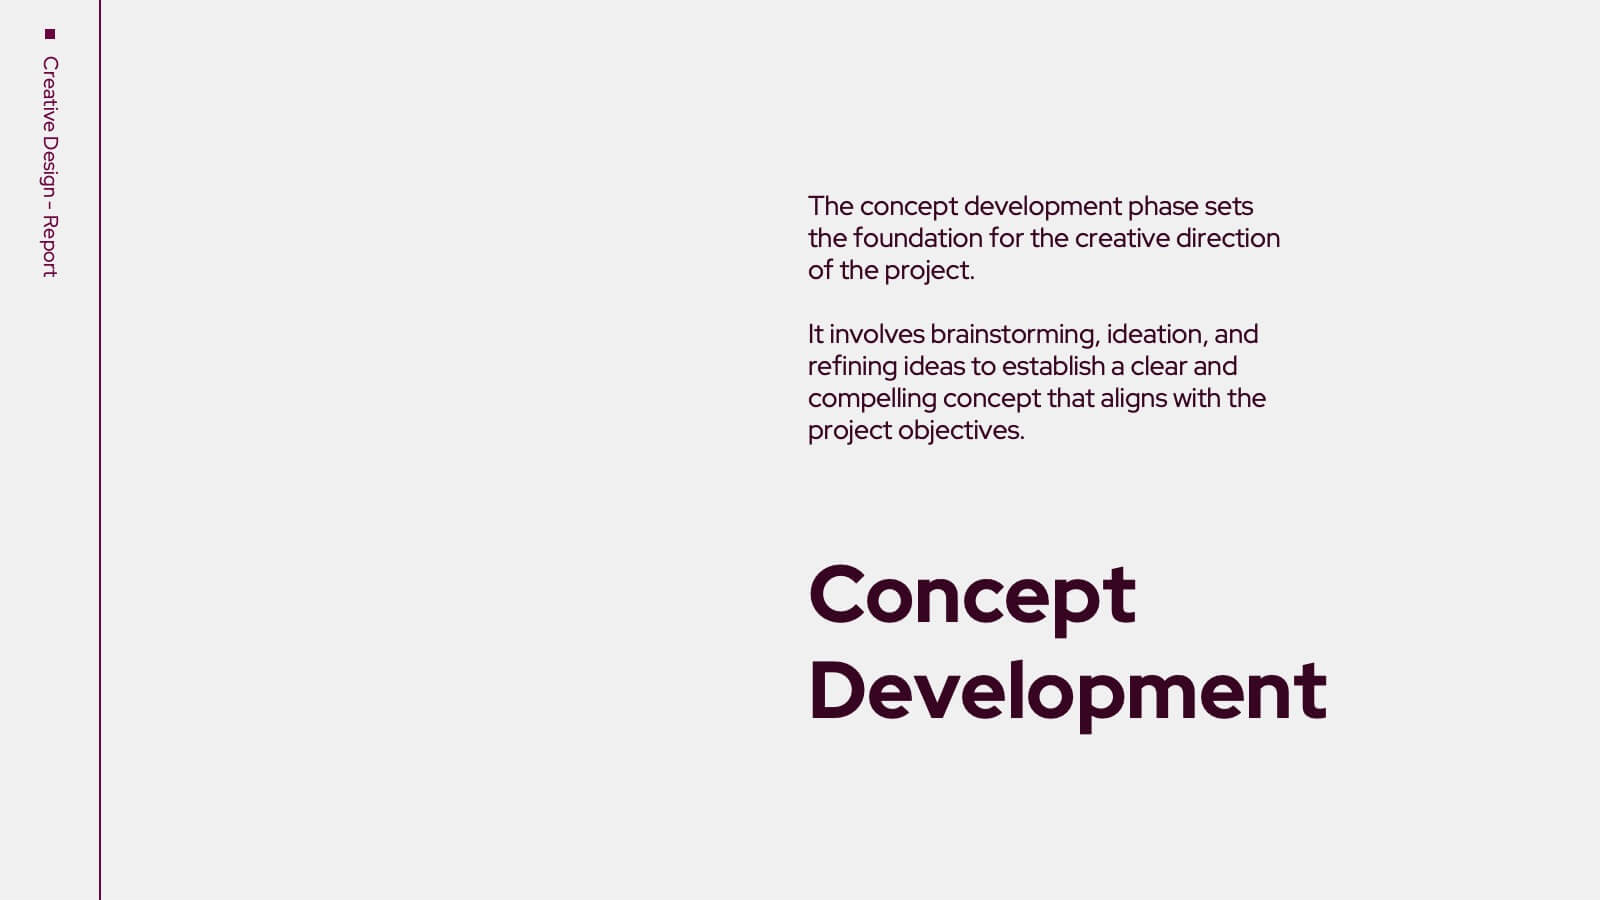
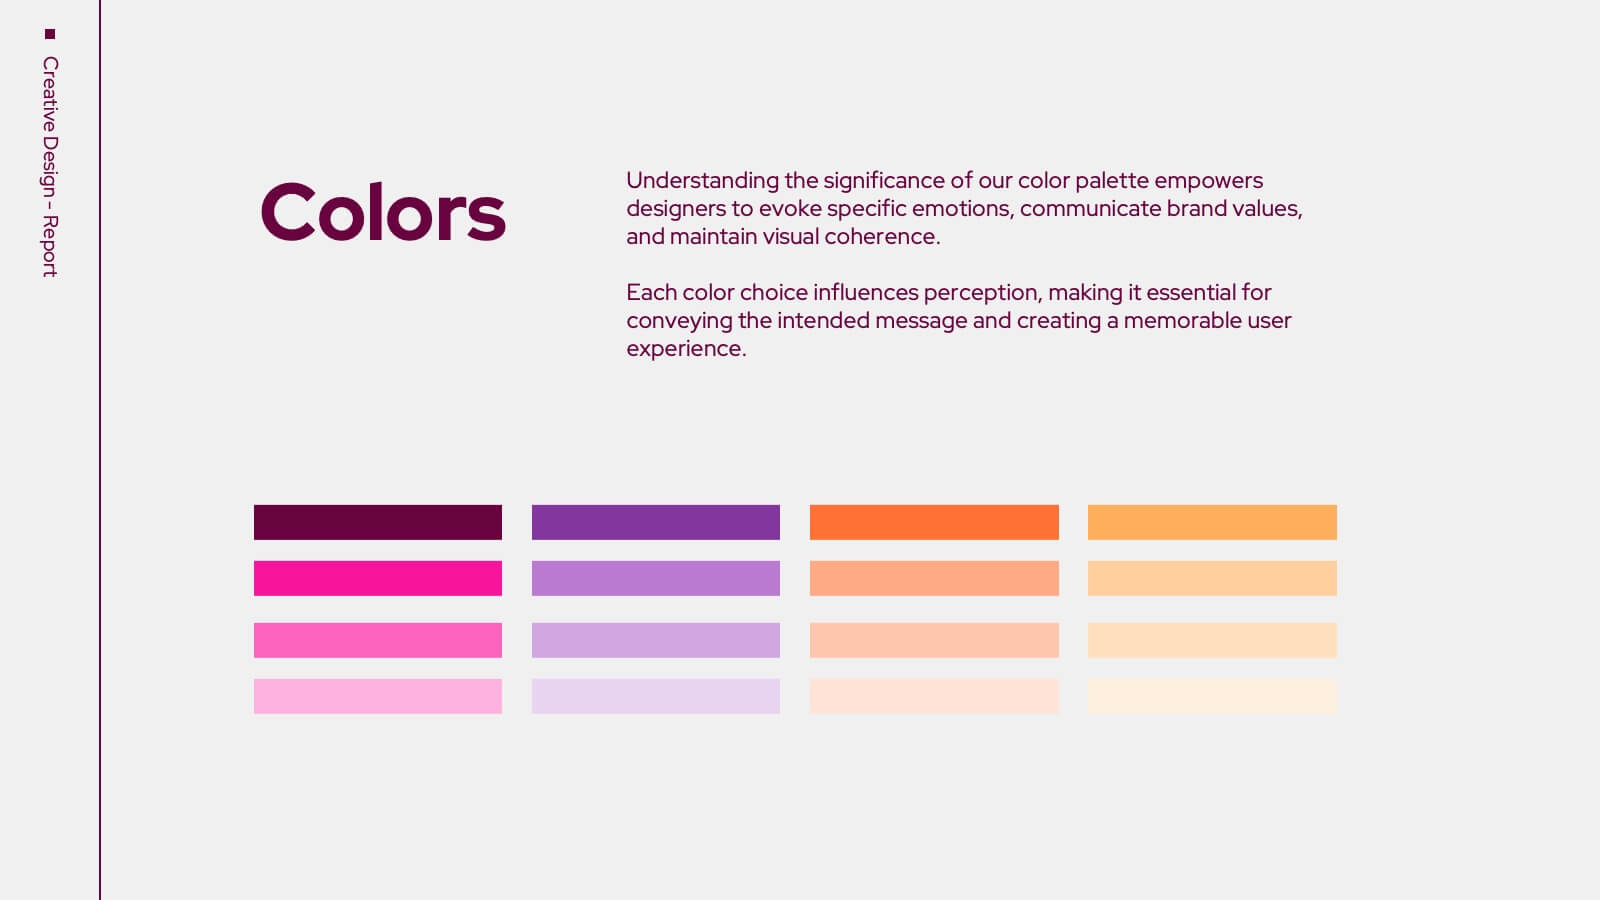
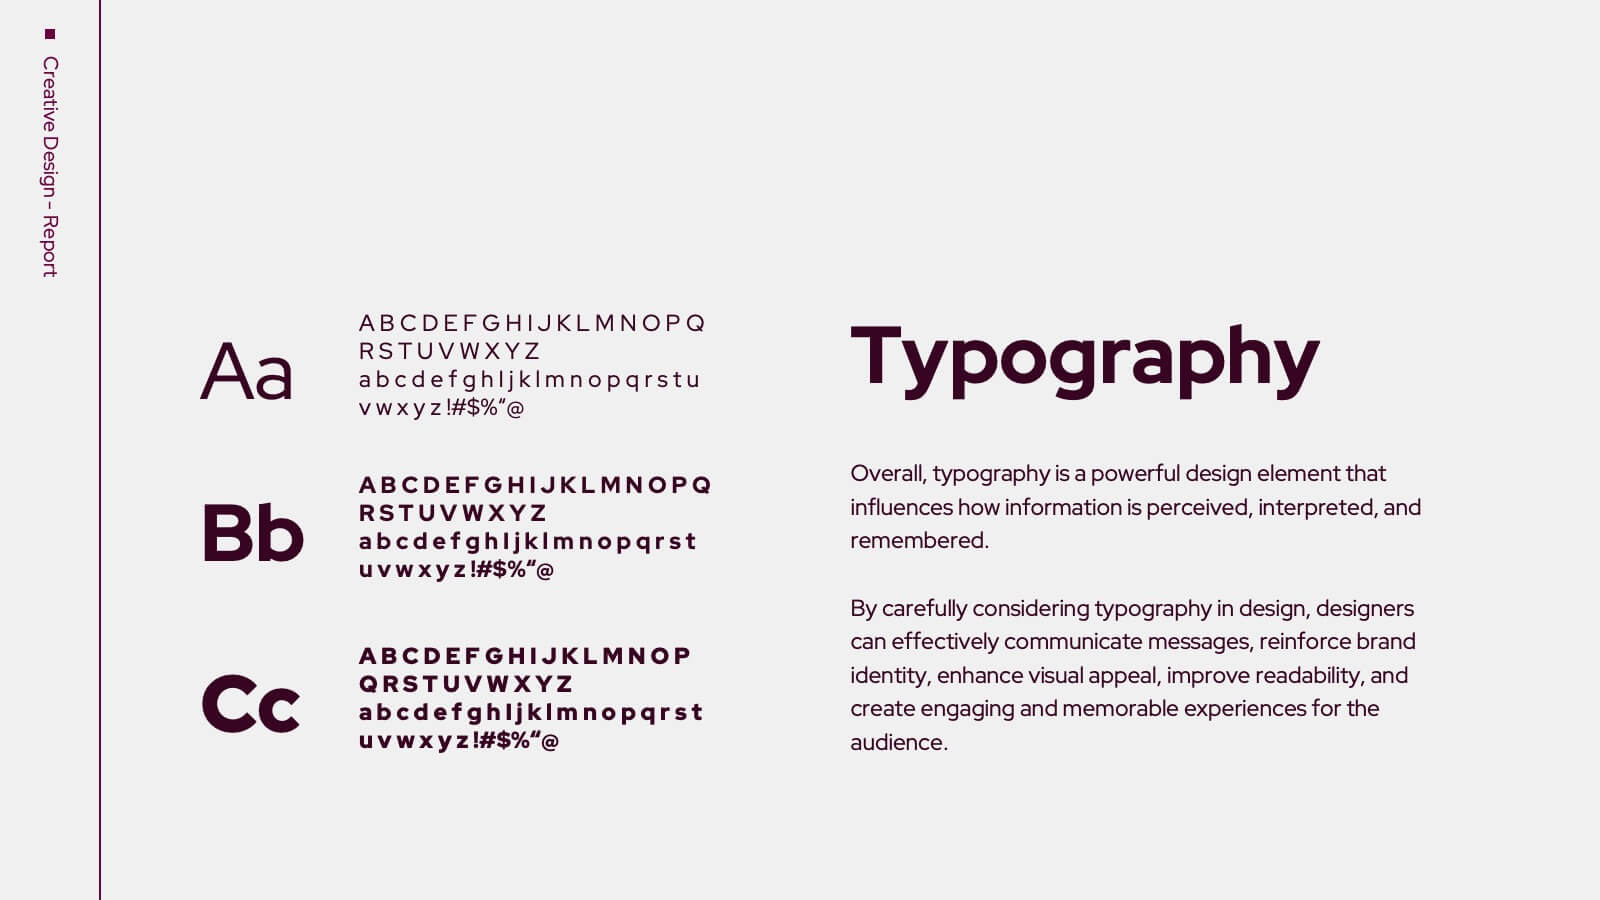
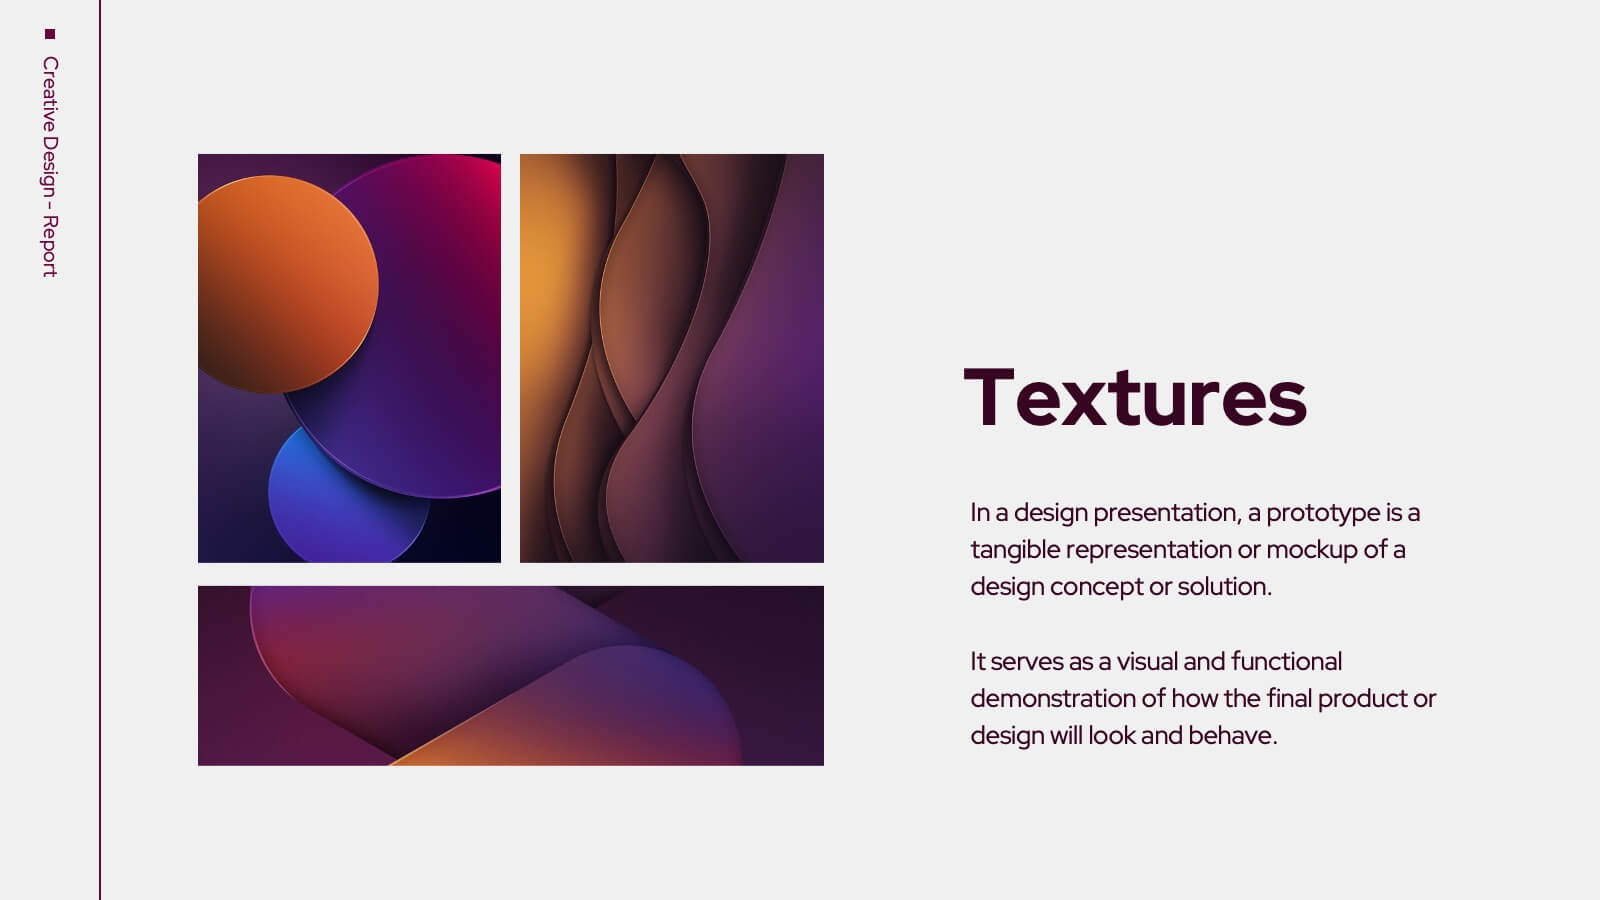
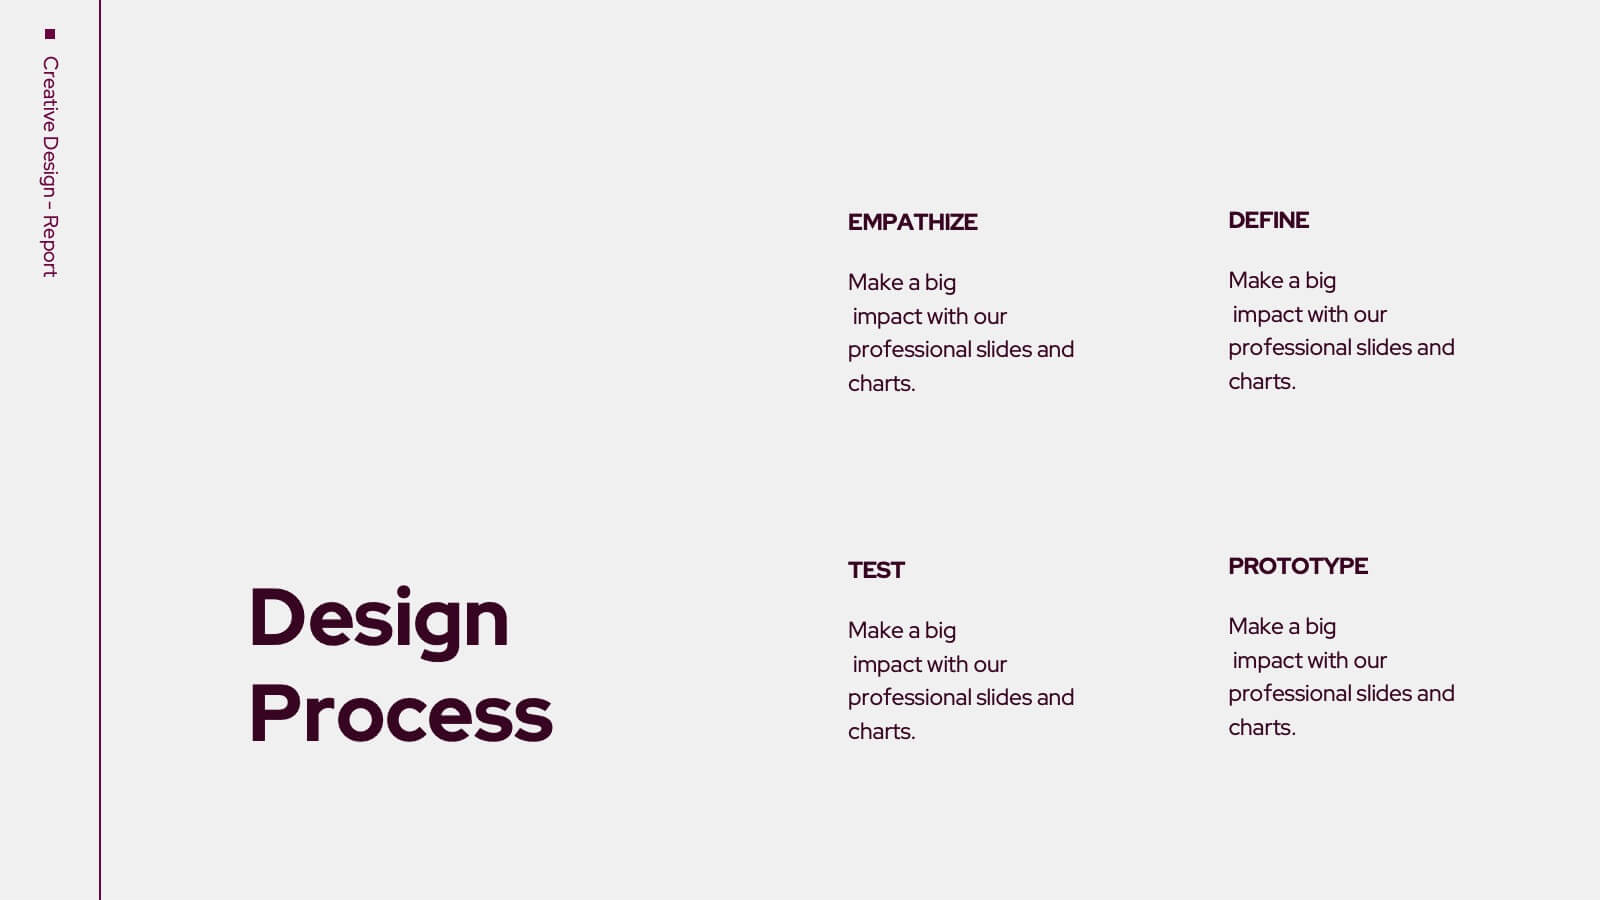
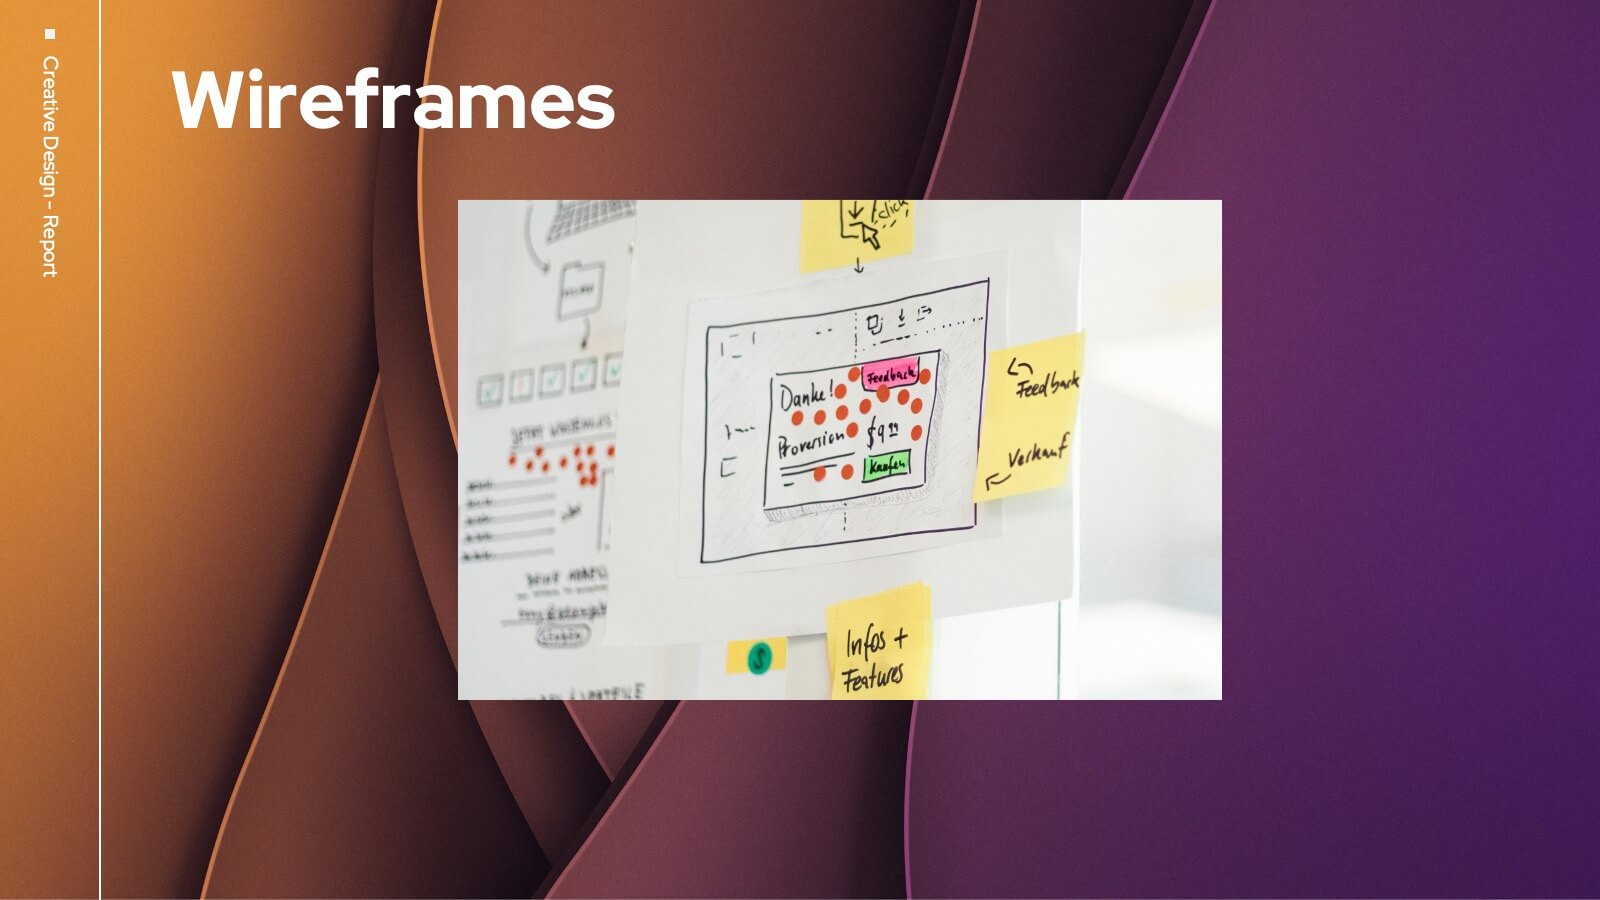
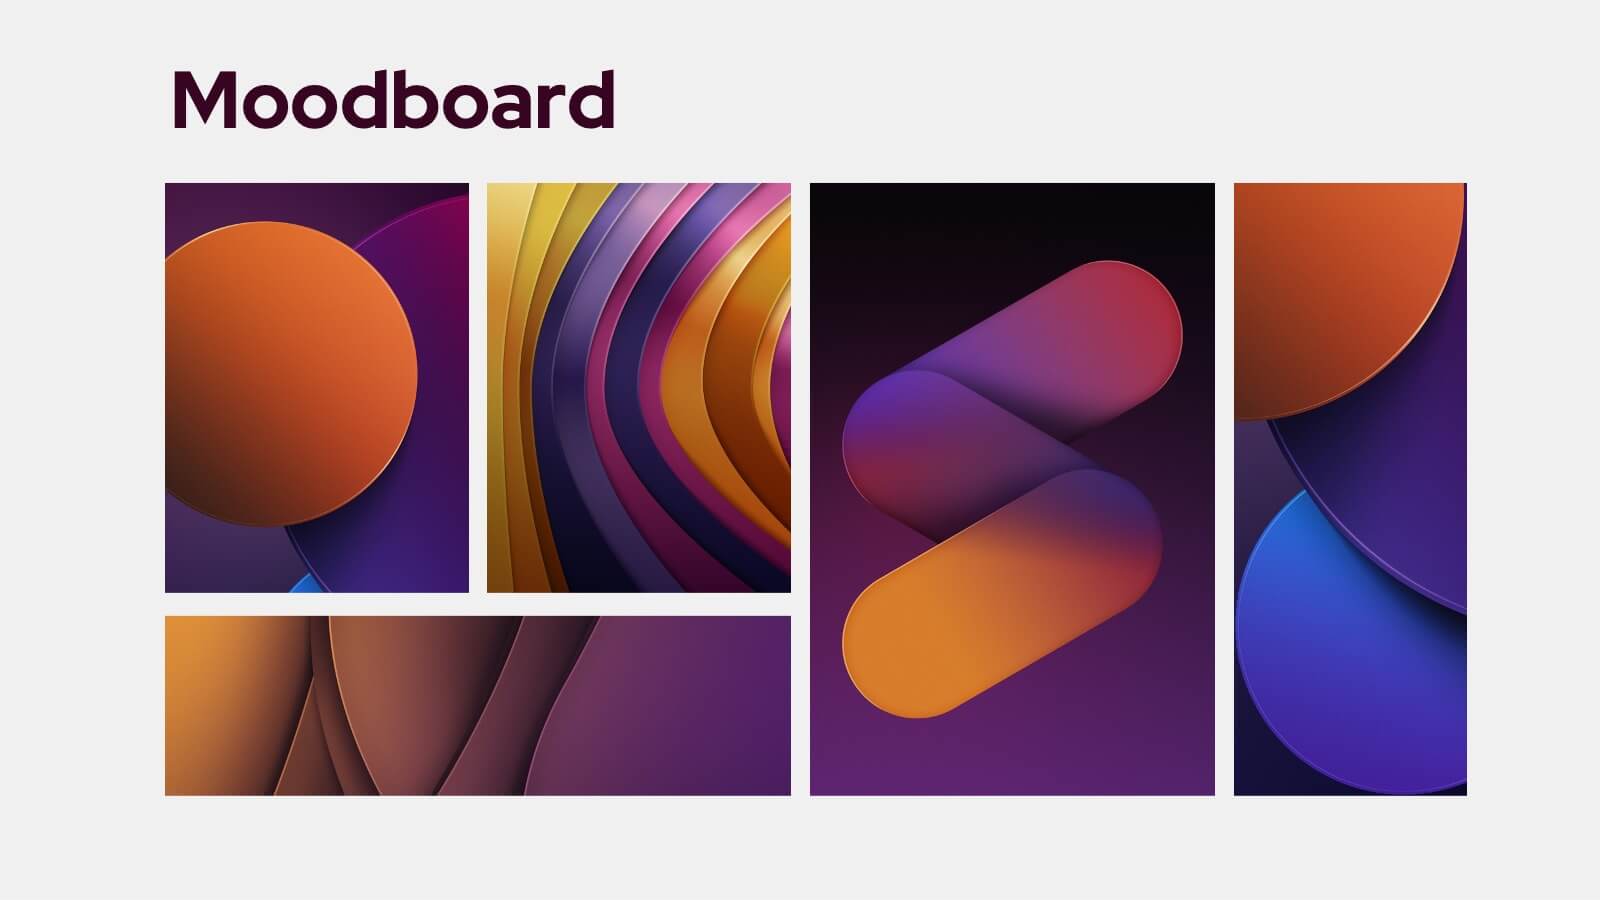
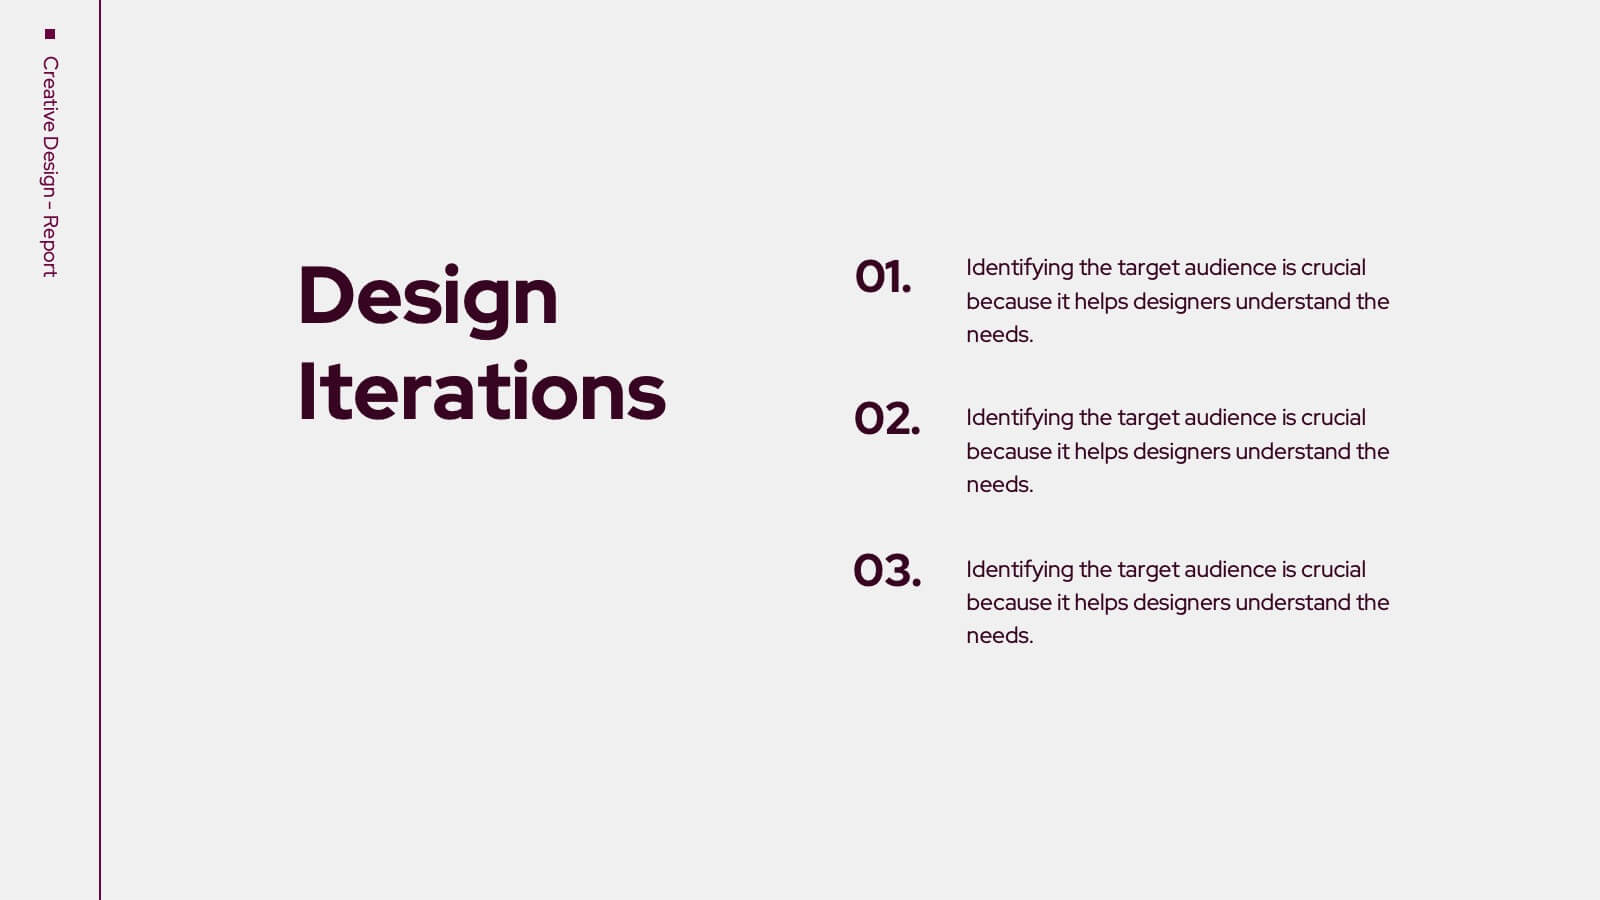
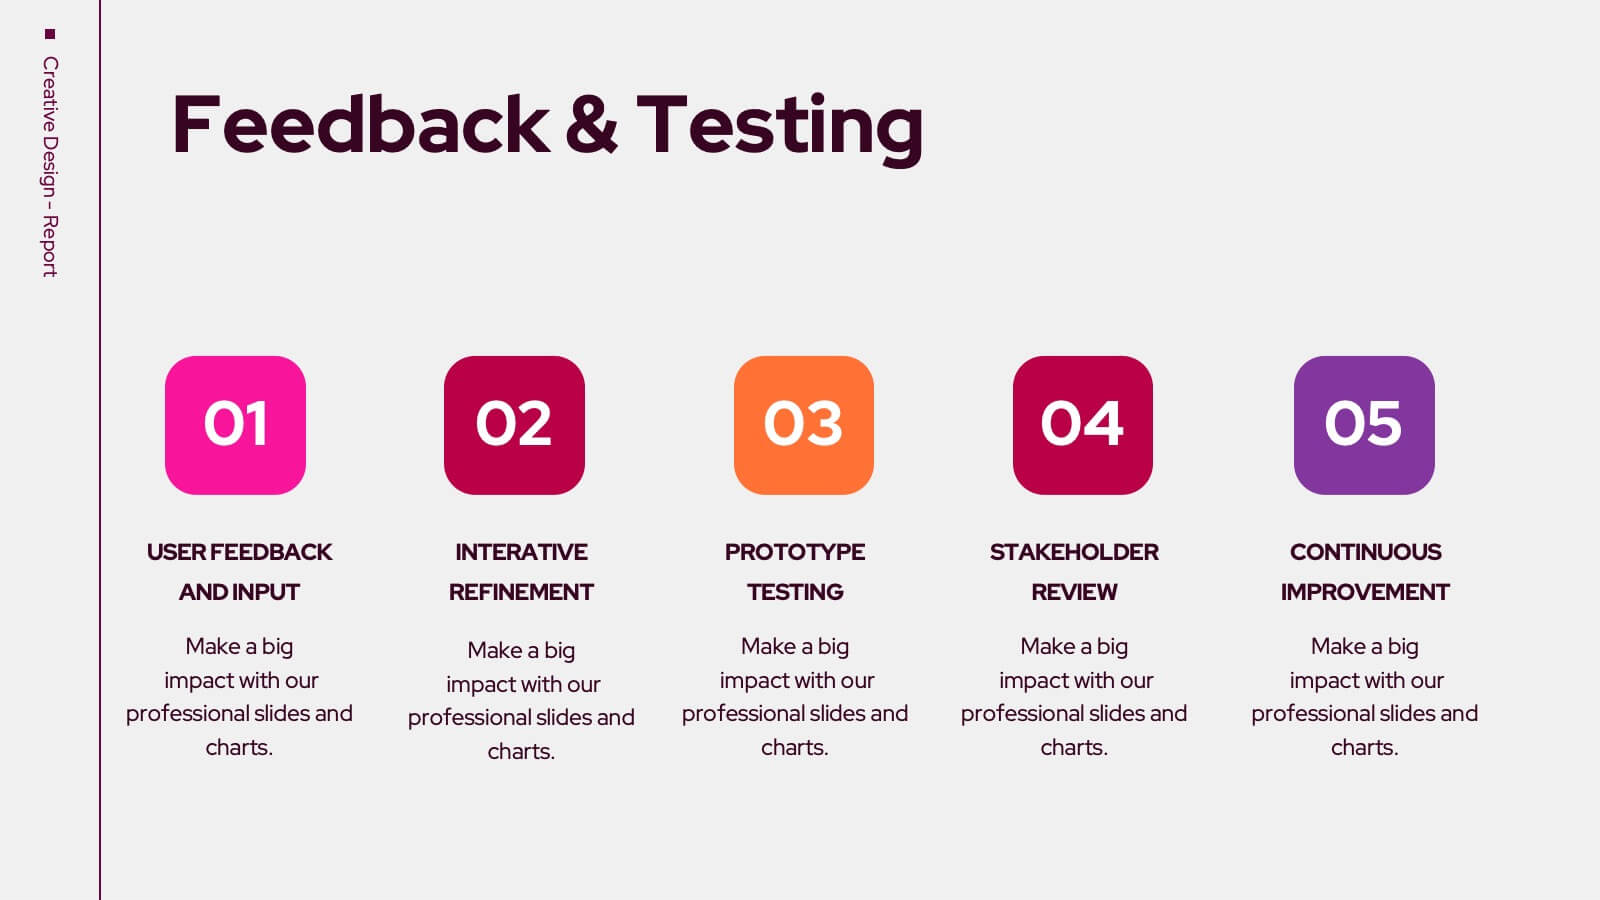
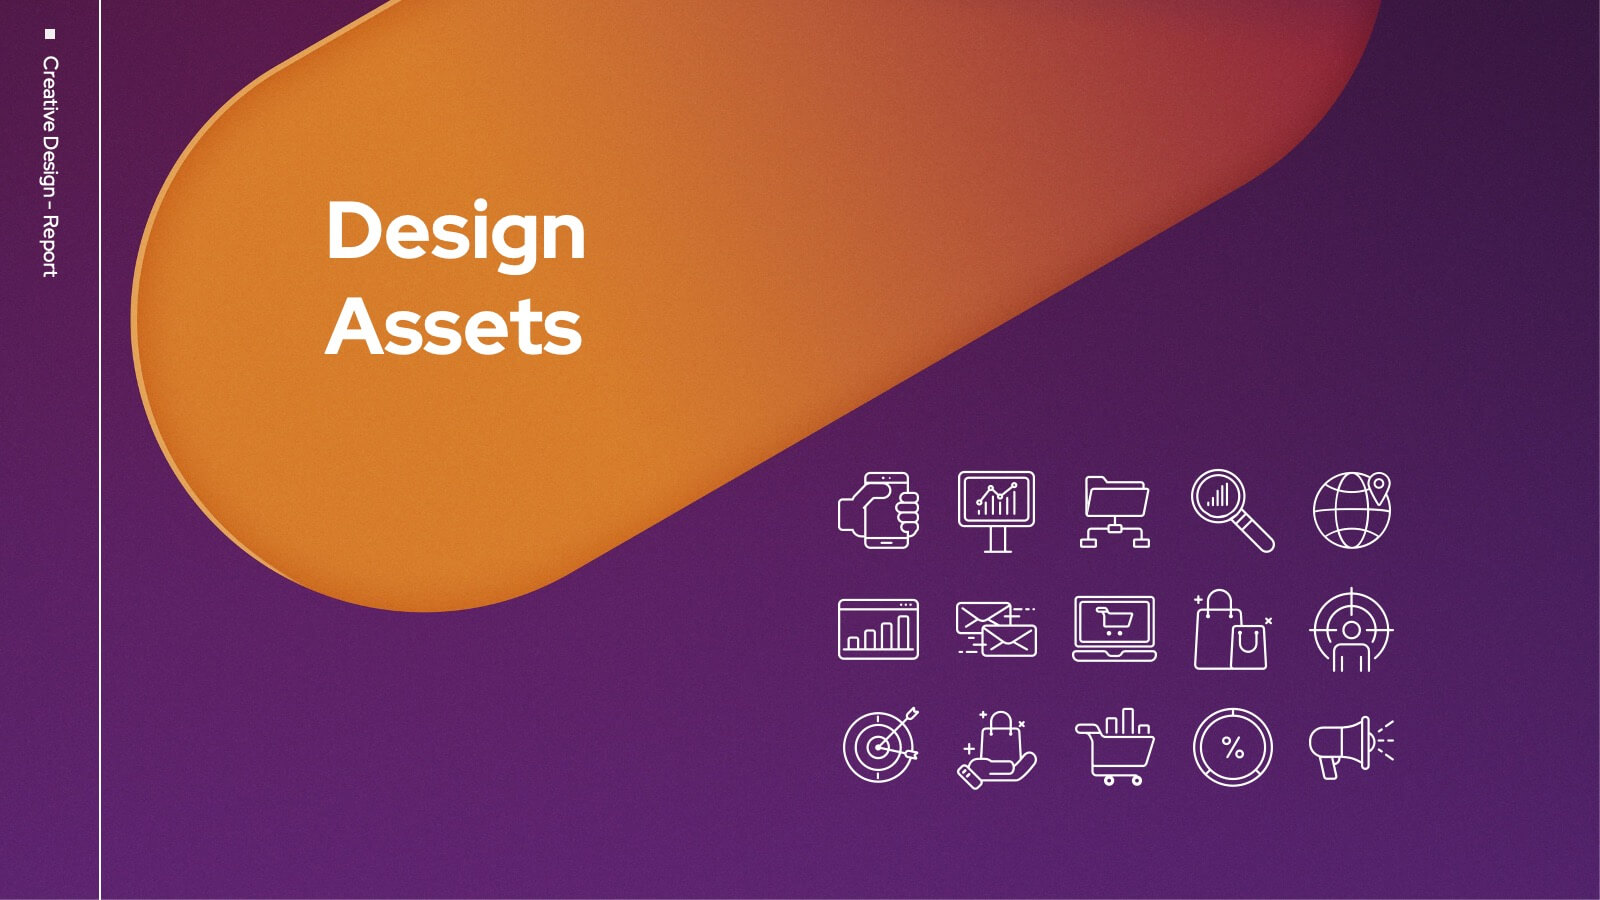
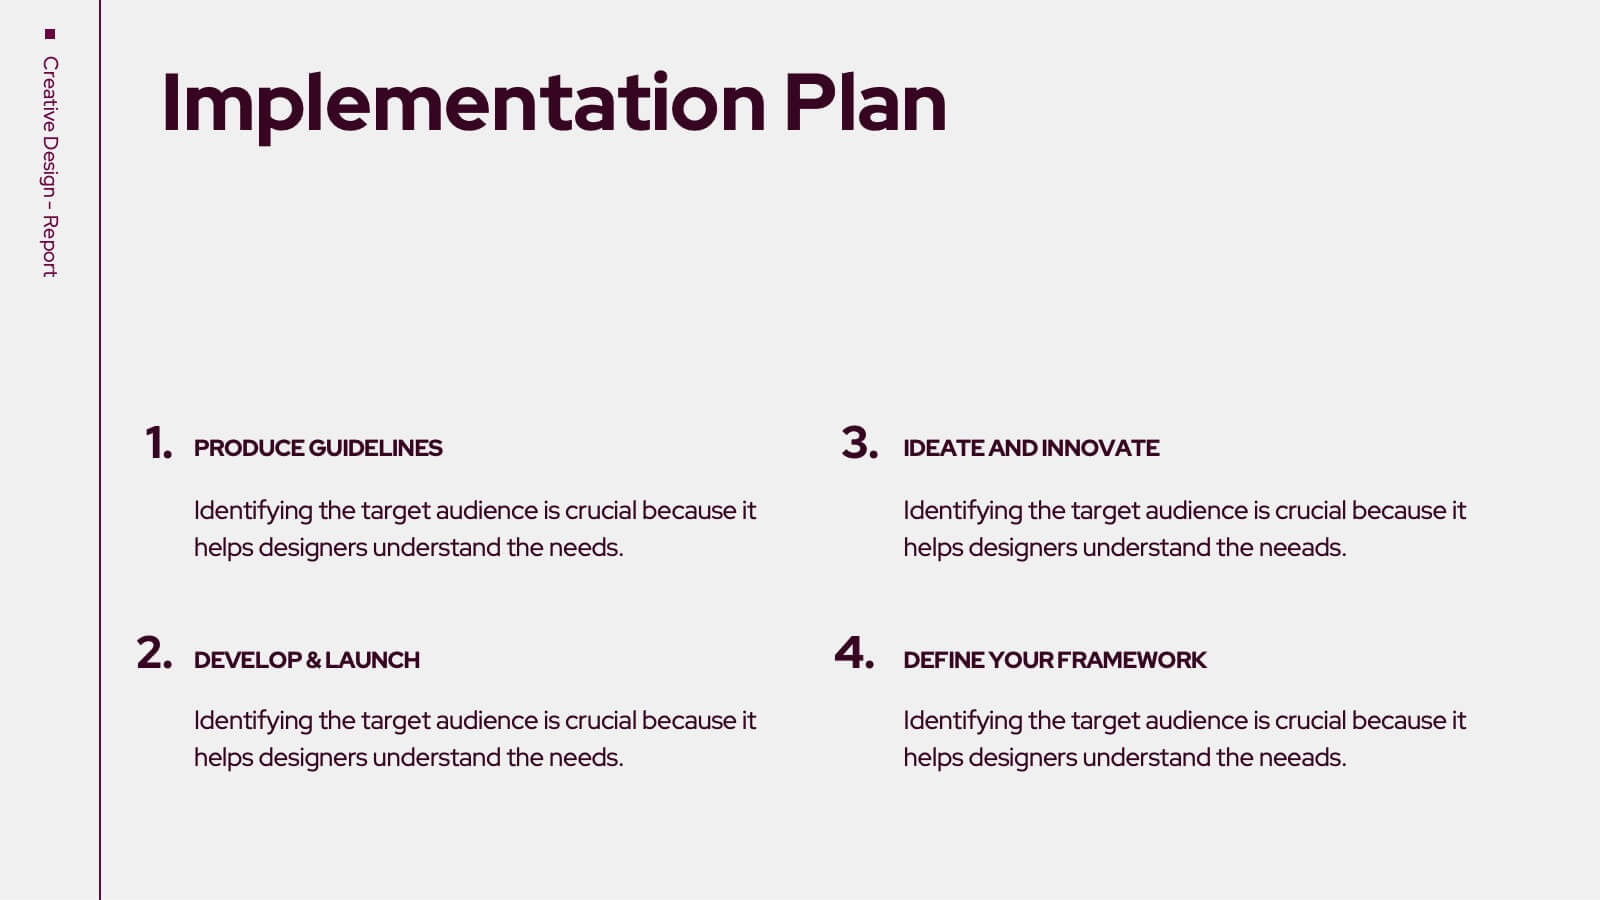
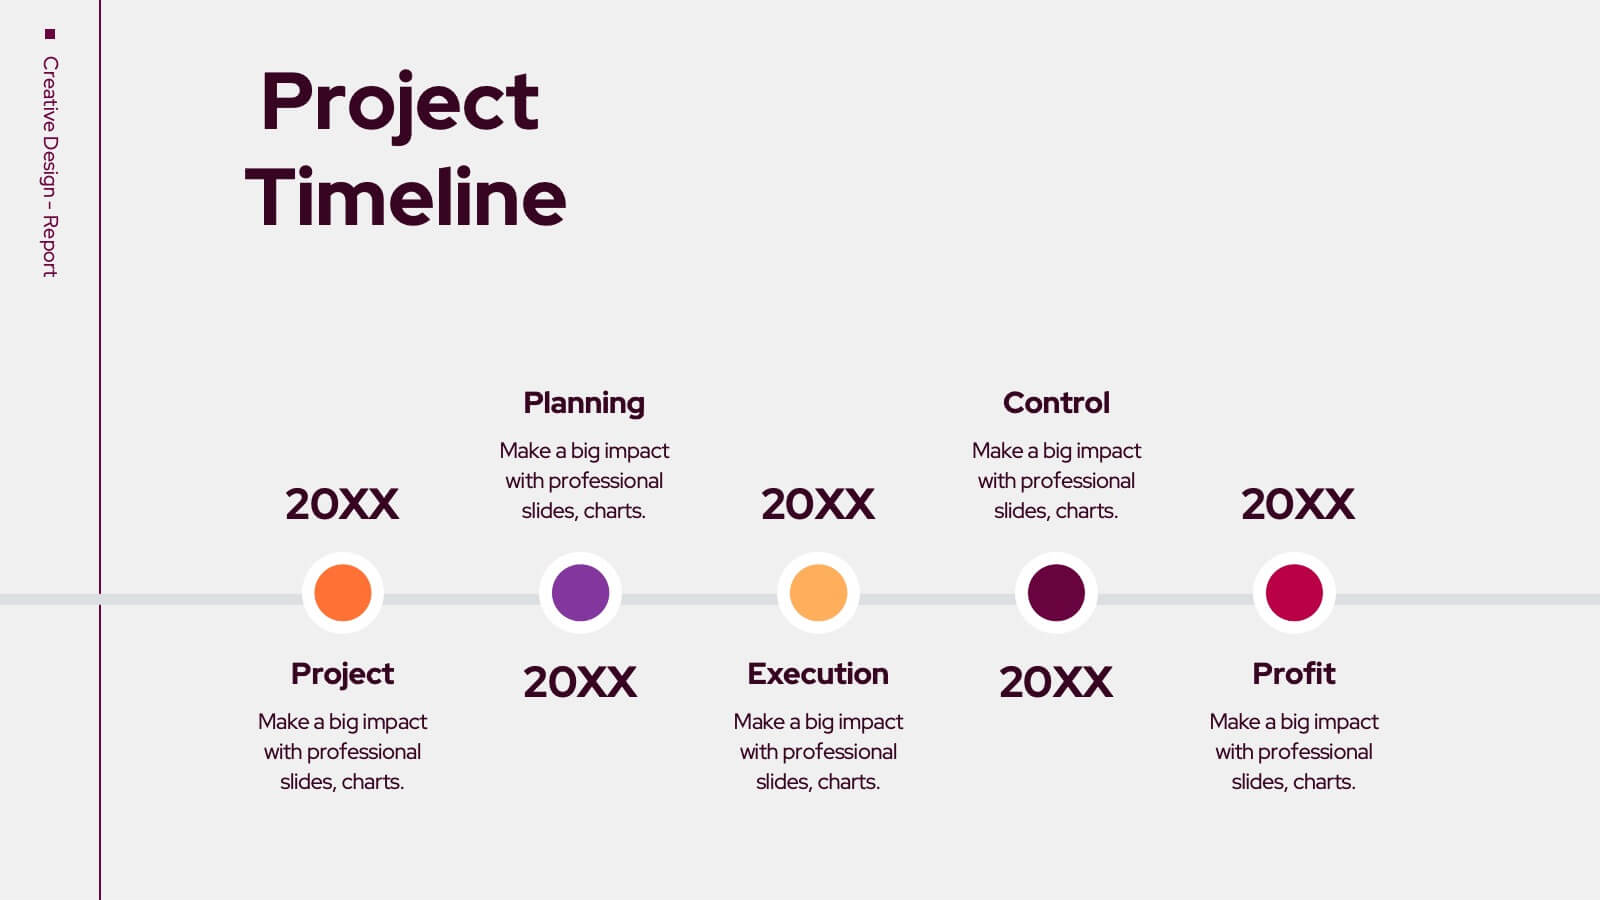
Trojan Creative Design Report Presentation
Unleash your creativity with this striking Trojan-inspired presentation template! Ideal for showcasing your design projects, this presentation enables you to highlight key concepts, inspirations, and visual elements effectively. Its engaging layout ensures your ideas shine through, captivating your audience. Compatible with PowerPoint, Keynote, and Google Slides for seamless presentations.


6 diapositivas
Agenda Network Infographic
Elevate your networking events with our sophisticated collection of agenda slide templates. These slides are crafted to structure and present the flow of activities at networking events, making them essential for coordinators who aim to foster professional connections among attendees. Each template is designed with clarity and style, featuring clean lines and modern graphics to outline key segments of your event, such as welcome remarks, networking sessions, panel discussions, and closing statements. The thoughtful layout includes designated spaces for time slots, session titles, and speaker details, ensuring that participants can easily follow the event's progression and plan their participation accordingly. These slides are fully customizable, allowing you to match the visual design with your event’s theme or corporate branding. The adaptable format makes it simple to insert or remove sections based on the specific needs of your event. Ideal for business conferences, industry meet-ups, or any professional gathering, these agenda slides help you manage and execute a seamless networking experience.


7 diapositivas
Exponential Growth Infographic
Exponential growth refers to a process where a quantity grows at a consistent percentage rate per unit of time. This infographic template takes your audience on a visual expedition through the marvels of exponential expansion, turning complex data into a clear and engaging narrative. Compatible with Powerpoint, Keynote, and Google Slides. This features dynamic visuals like ascending graphs and vibrant charts, this infographic embodies the essence of exponential growth, making this come alive. Showcase the growth trajectory using ascending line graphs or bar charts, visually representing the skyrocketing growth in a way that's easy to comprehend.


5 diapositivas
Healthcare Services and Medical Systems Presentation
Visualize your healthcare processes with this hexagonal layout designed for medical topics. Each section highlights key service areas, ideal for presenting hospital systems, diagnostics, or treatment paths. With five editable steps, it's perfect for health professionals, researchers, or medical trainers using PowerPoint, Keynote, or Google Slides.