


Características


¿Tienes alguna pregunta?
Recomendar


7 diapositivas
Technology Skills Gap Infographic Presentation
A Skills Gap Infographic is a visual representation of the difference between the skills that employers need and the skills that are possessed by job seekers or employees. This template illustrates the gap between the skills that are required for a particular job and the skills that are currently available in the workforce. This template include charts, diagrams, and other visual elements that help to explain the extent of the skills gap, as well as its impact on the economy, businesses, and individuals. Use this to raise awareness about the skills gap and its implications to encourage action.


6 diapositivas
Logistics and Procurement Supply Chain Presentation
Optimize your supply chain strategy with the Logistics and Procurement Supply Chain template. Designed to illustrate key logistics processes, procurement flows, and operational efficiency, this structured layout helps you present crucial data with clarity. Fully customizable and compatible with PowerPoint, Keynote, and Google Slides for seamless business integration.


4 diapositivas
Interlocking Puzzle Chart Design Presentation
Unlock big ideas with a visual design that clicks your concepts together like a seamless 3D puzzle. This presentation makes it easy to explain connected processes, relationships, or strategic components in a clean, engaging way. Perfect for business, planning, and team alignment. Fully compatible with PowerPoint, Keynote, and Google Slides.


7 diapositivas
E-Learning Infographic Presentation Template
An E-learning Infographic is an informative design that shows all the different ways that e-learning can be used in your classroom, as well as the benefits associated with each one. This infographic illustrates the popularity of e-learning and gives tips for creating compelling learning materials. This template is equipped with all the resources needed to create your e-learning infographic. It comes fully customizable and ready-to-use. This Infographic template provides a bare-bone structure and design, leaving space for you to add your own content and create the best presentation!


6 diapositivas
Pillar Ideas Infographic
"Pillar ideas" usually refer to the fundamental principles, concepts, or key components that form the foundation of a particular topic, strategy, or framework. This infographic template outlines and explains the core pillars or key principles of a particular topic, concept, or strategy. These pillars are essential for understanding and implementing the core aspects of that subject. The pillars included in the infographic provide structure and a clear understanding of the foundational elements that contribute to the success and effectiveness of various endeavors. This template is compatible with Powerpoint, Keynote, and Google Slides.


5 diapositivas
Data Analytics Heat Map
Visualize data intensity and trends effortlessly using this heat map-style layout. Ideal for performance tracking, comparative analysis, and decision-making frameworks, this slide organizes information by low, medium, and high value ranges. Fully customizable in PowerPoint, Keynote, and Google Slides.


6 diapositivas
Progressive Insurance Infographics
Explore Progressive Insurance with our customizable infographic template. This template is fully compatible with popular presentation software like PowerPoint, Keynote, and Google Slides, allowing you to easily customize it to showcase various aspects of Progressive Insurance, its services, and achievements. The Progressive Insurance infographic template offers a visually engaging platform to highlight the company's history, insurance offerings, customer satisfaction, and industry leadership. Whether you're an insurance professional, a potential customer, or a financial analyst, this template provides a user-friendly canvas to create informative presentations and educational materials about Progressive Insurance. Learn more about Progressive Insurance with this SEO-optimized infographic template, thoughtfully designed for clarity and ease of use. Customize it to showcase Progressive's unique features, coverage options, and innovations, making it a valuable resource for sharing information about the company with your audience. Start crafting your personalized infographic today to explore the world of Progressive Insurance.


5 diapositivas
Purpose-Driven Mission and Values Presentation
Present your organization’s core purpose and guiding principles with this Purpose-Driven Mission and Values presentation. This clean, flag-style layout is perfect for showcasing five key pillars such as integrity, collaboration, or innovation. Easily customizable in Canva, PowerPoint, or Google Slides to align with your brand.


5 diapositivas
Overcoming Strategic Business Challenges Presentation
Break down complex obstacles with this step-by-step "Overcoming Strategic Business Challenges" presentation. Featuring a stair-like 3D visual with figures symbolizing progress and setbacks, each slide is divided into four clear milestones. Ideal for showcasing pain points, strategic pivots, or recovery plans. Customize each step with your insights in PowerPoint, Keynote, or Google Slides.


5 diapositivas
Business SWOT Evaluation Framework Presentation
Deliver clear strategic analysis with the Business SWOT Evaluation Framework Presentation. This layout features a modern quadrant design that segments Strengths, Weaknesses, Opportunities, and Threats around a central focus, making your insights easy to digest. Fully editable in PowerPoint, Canva, and Google Slides—perfect for business planning and executive reporting.


5 diapositivas
Lean Startup Business Presentation
A fresh, energetic layout brings your ideas to life, making it easy to present streamlined processes and early-stage strategies with clarity. This presentation highlights key steps, insights, and goals in a clean, modern flow designed for fast-moving teams. Fully compatible with PowerPoint, Keynote, and Google Slides.


22 diapositivas
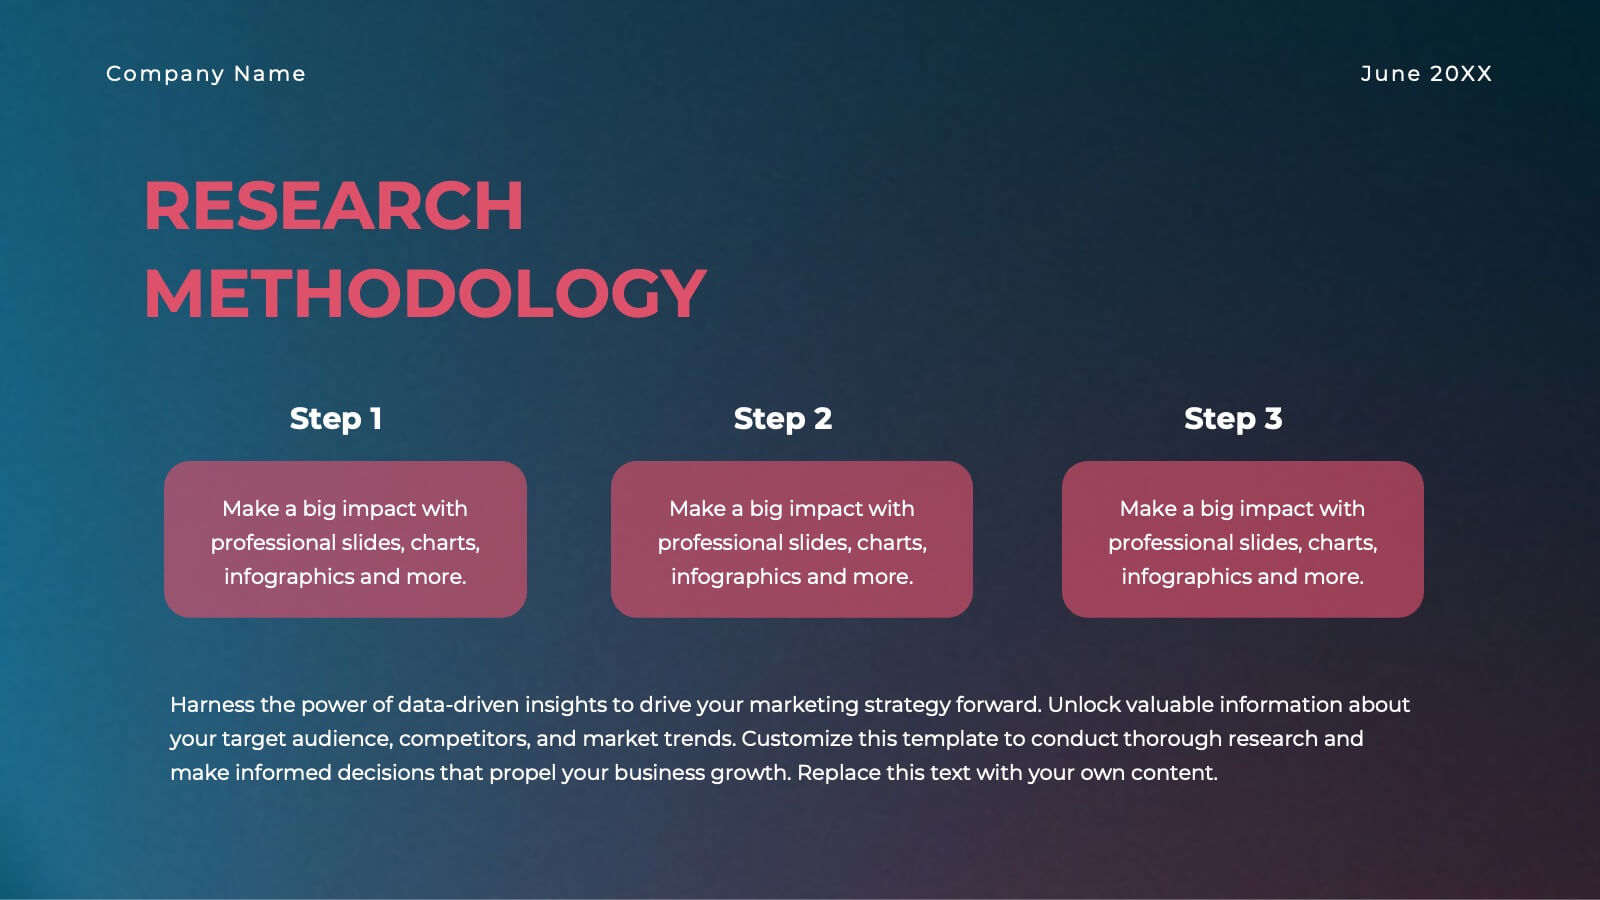
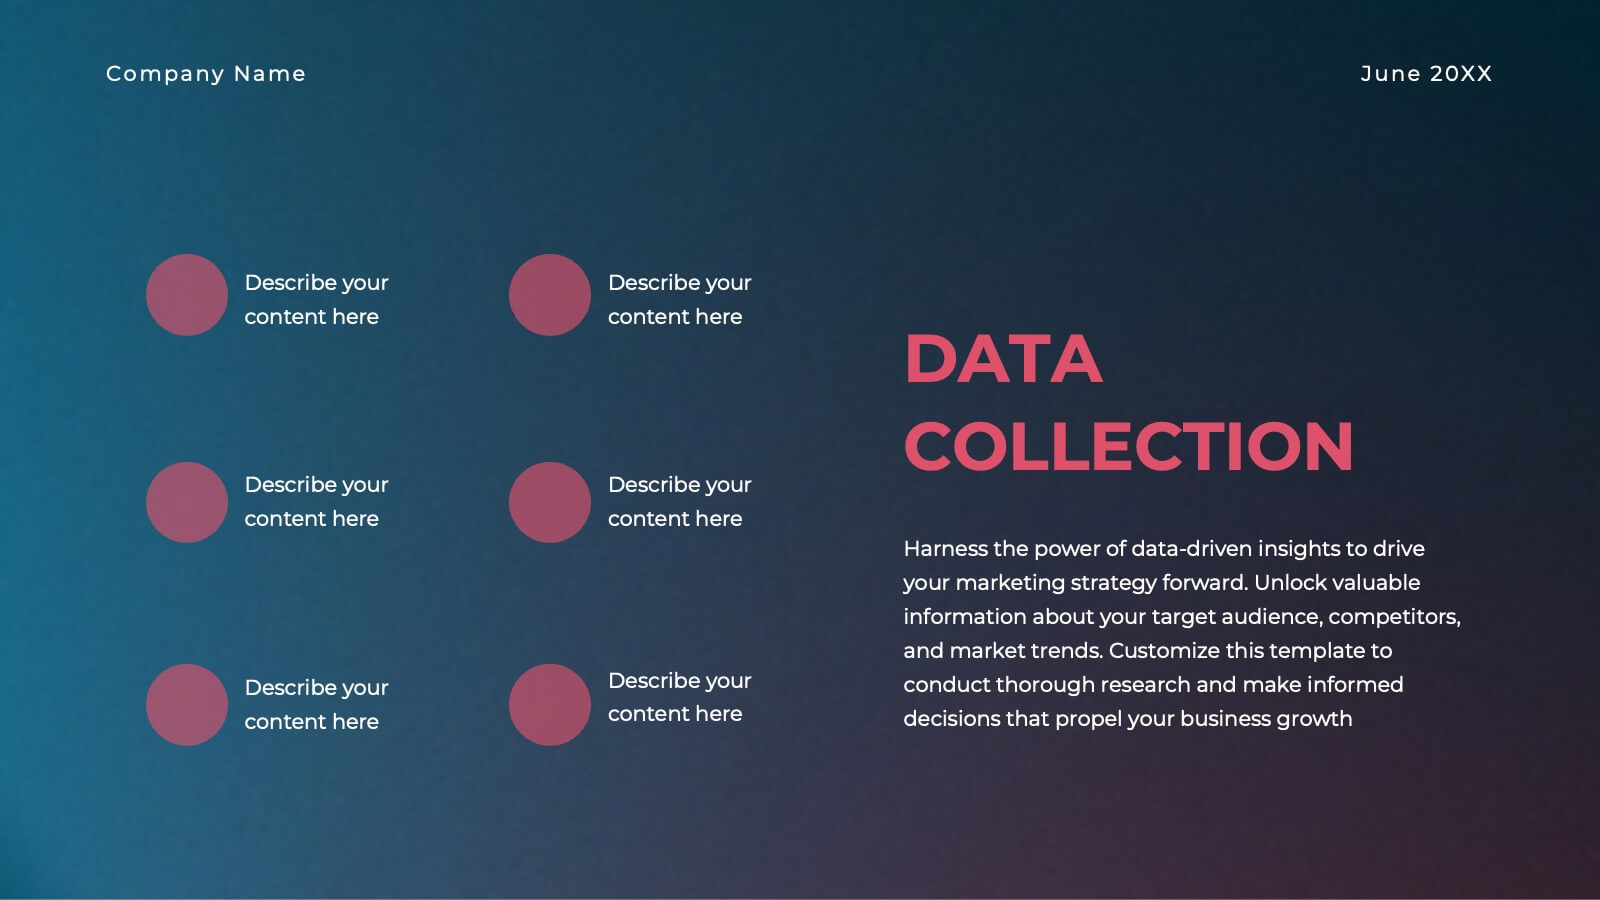
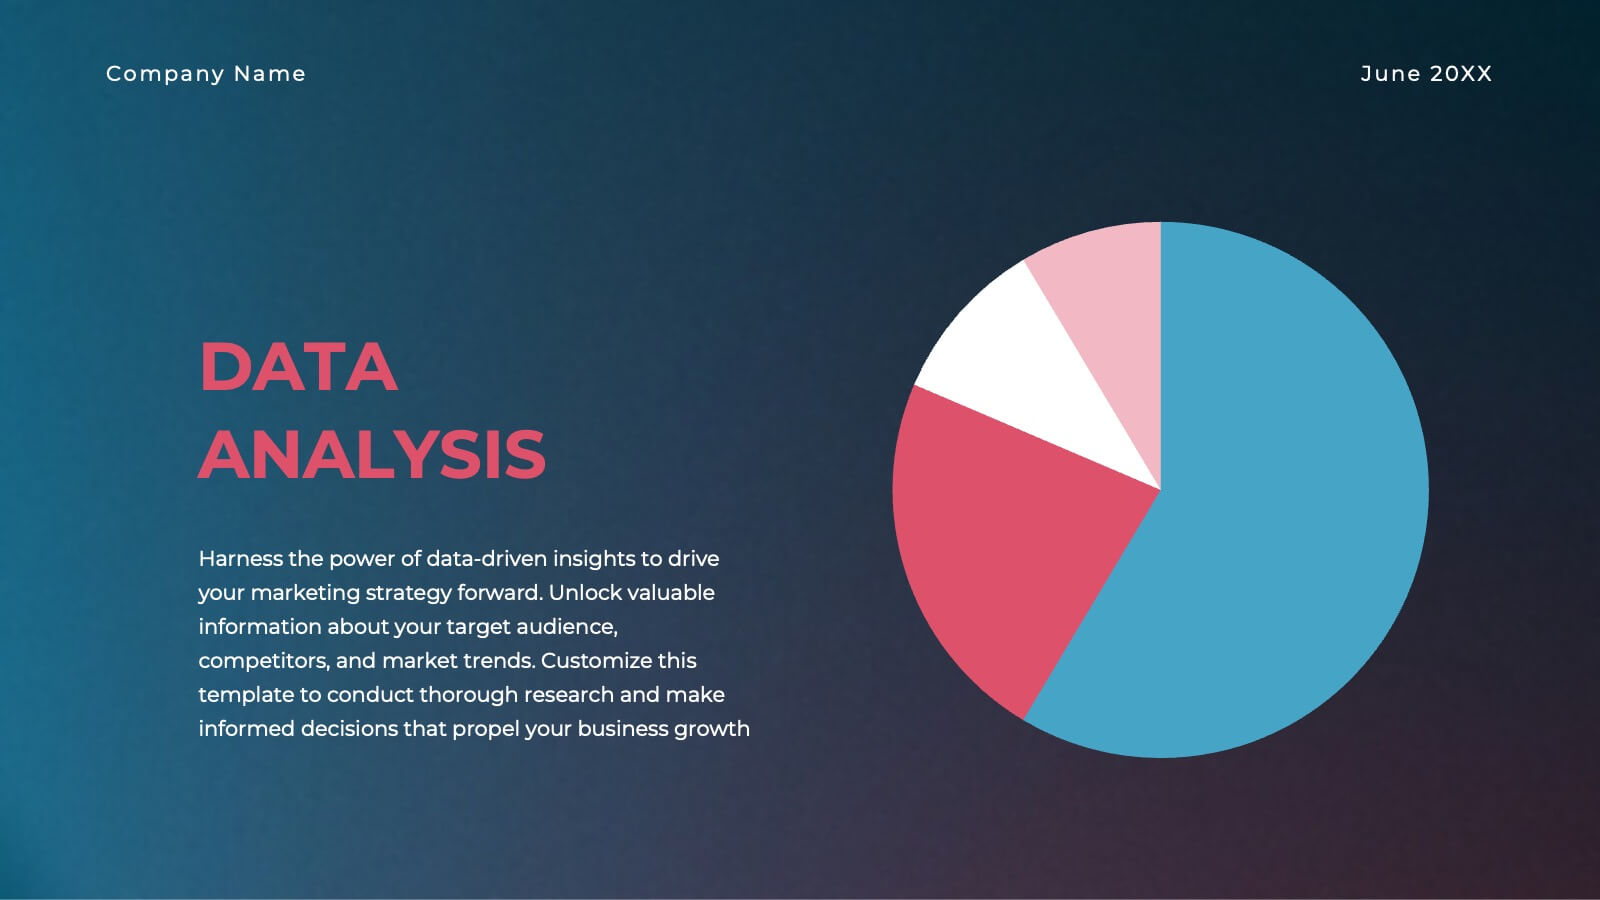
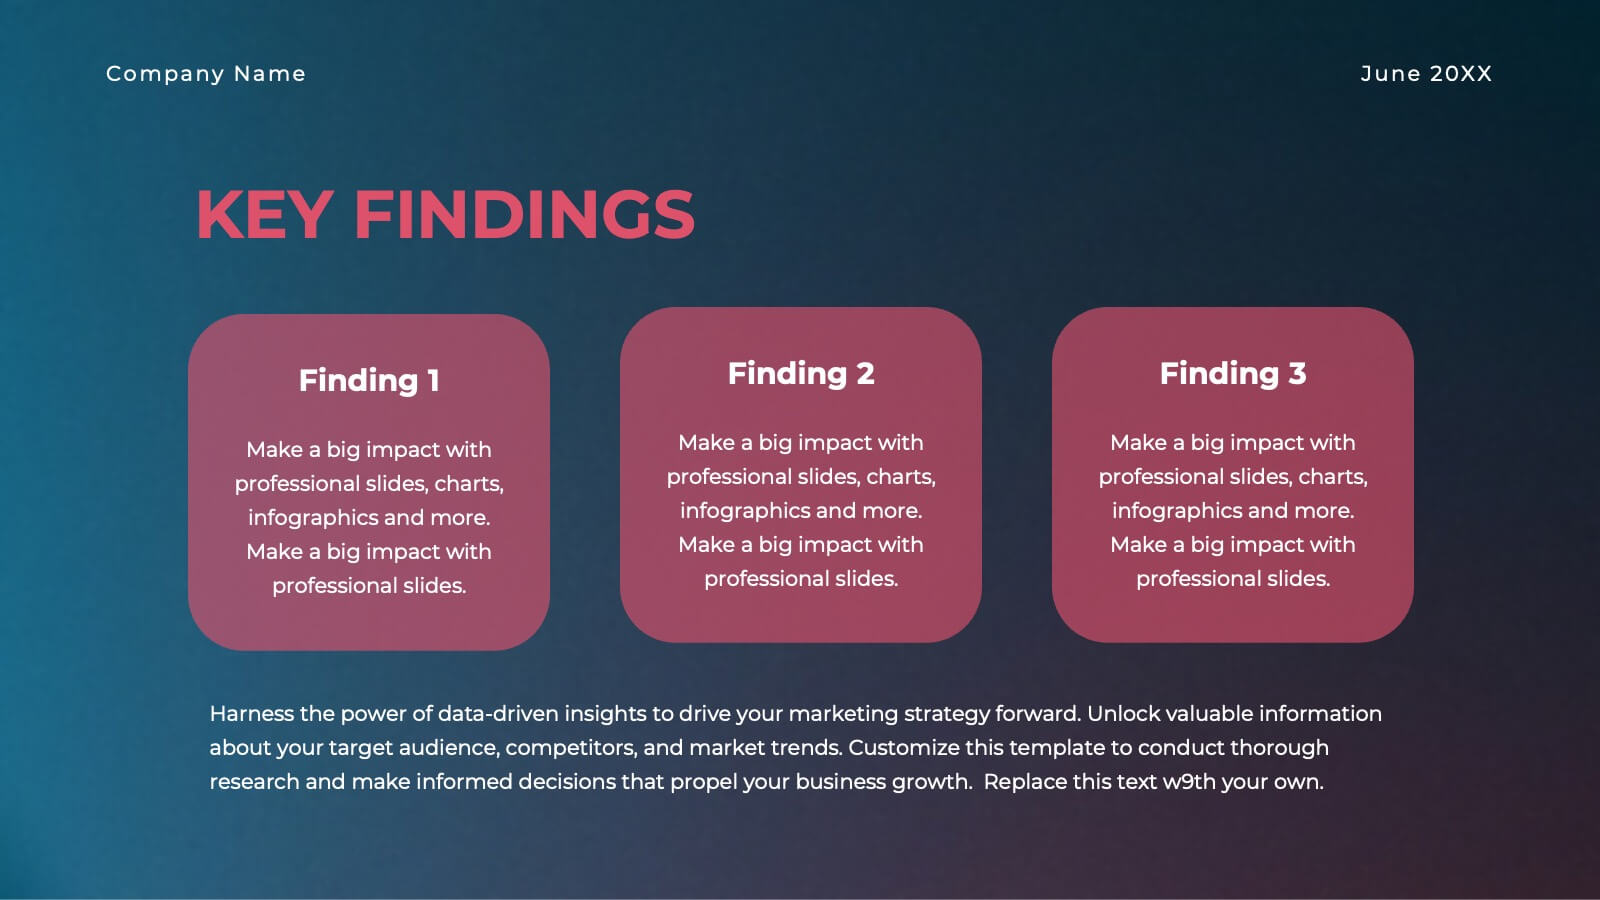
Gold Research Proposal Presentation
Present your research with impact using this sleek and modern research proposal template! Featuring sections for objectives, data collection, analysis, key findings, and recommendations, this template helps organize your research clearly and professionally. Fully customizable and compatible with PowerPoint, Keynote, and Google Slides, it's ideal for any research presentation.


26 diapositivas
Creative Home Office Setups Presentation
Transform your workspace into an inspiring and productive haven with this engaging presentation on creative home office setups. Covering ergonomic design, aesthetic organization, tech essentials, and personalized decor, this template helps you present ideas that enhance efficiency and comfort. Fully customizable and compatible with PowerPoint, Keynote, and Google Slides for a seamless experience.


7 diapositivas
Chart Comparison Infographic Presentation
Chart Comparison is the process of comparing different charts or graphs to identify similarities. It involves analyzing multiple sets of data by visually presenting them in charts. Use this template to show the comparison of various charts and how things look when they are compared. This template will help you create a professional Infographic presentation that highlights the key differences between data sets. Each chart can have it's own color, so you can use any color you want. You can also add text in the chart with your own content, and edit in Powerpoint, Keynote, or Google Slides.


5 diapositivas
Business and Personal Goal Planning Presentation
Align your vision with action using the Business and Personal Goal Planning slide. This clean, professional layout helps break down up to four key objectives using flag-themed visuals, customizable text blocks, and supportive icons. Perfect for comparing business goals with personal development targets in a single view. Fully editable in PowerPoint, Keynote, and Google Slides—ideal for team meetings, coaching sessions, or strategic planning.


6 diapositivas
Financial Credit Card Analysis Presentation
The Financial Credit Card Analysis presentation template offers a comprehensive visual tool for comparing different aspects of credit card features. Designed for clarity and impact, this template showcases key data points like interest rates, reward programs, fees, and user benefits across multiple cards in a color-coded format. Each segment is clearly labeled for easy understanding, making it an excellent choice for financial analysts, advisors, or anyone presenting credit card options to clients or within financial education workshops. The modular design allows for customizable sections to adapt to specific needs or to highlight particular cards or features effectively.


4 diapositivas
Communication Model and Channels Presentation
Illustrate how your messages move through various channels using this clean, visual communication model slide. Ideal for team briefings, marketing workflows, or internal training, it simplifies how information is shared across platforms. Fully editable in Canva, PowerPoint, and Google Slides for seamless customization to match your branding and messaging goals.