


Características


¿Tienes alguna pregunta?
Recomendar


6 diapositivas
Bubble Diagram for Idea Development
Streamline your brainstorming sessions and visualize concept progression with this Bubble Diagram for Idea Development presentation. Featuring a circular, color-coded layout from A to F, it’s ideal for mapping interconnected ideas, workflows, or innovation cycles. Easily editable in PowerPoint, Keynote, and Google Slides.


7 diapositivas
Pillar Points Infographic Presentation
A Pillar Infographic presents information on a specific topic or subject in a clear and organized manner. It consists of several sections or "pillars" that are interconnected and support the overall message of the infographic. In this template each pillar can be used to represent different aspects of the topic being discussed. Each section contains relevant data, statistics, and other information that illustrates the aspect. This can be used in marketing and advertising to promote products or services, as well as in education and journalism to explain complex ideas in a visually appealing way.


5 diapositivas
5-Step Process Flow
Visualize any workflow or sequential plan with this dynamic 5-step process template. Designed with a flowing arrow layout, it’s ideal for illustrating strategies, timelines, or key project phases in a clear, modern style. Fully editable for PowerPoint, Keynote, and Google Slides users.


5 diapositivas
Spider Chart for Mind Organization Presentation
Clarify complex ideas with the Spider Chart for Mind Organization Presentation. This layout visually maps key topics and subtopics, helping you identify patterns, priorities, or areas of focus. Ideal for planning, decision-making, and brainstorming sessions. Fully customizable in Canva, PowerPoint, Google Slides, and Keynote for seamless use.


5 diapositivas
World History Infographic Presentation
Bring the past to life with this engaging World History Infographic presentation. Featuring a circular layout with 4 editable sections, this infographic allows you to highlight key events, historical milestones, or cultural movements. Ideal for educators, students, and history enthusiasts, it’s designed for clarity, storytelling, and visual appeal. Fully compatible with PowerPoint, Keynote, and Google Slides – and easy to customize for any topic or timeline.


5 diapositivas
Artificial Intelligence Categories Infographics
Artificial Intelligence has the potential to revolutionize industries and create new opportunities for businesses and individuals. These infographic templates provide an overview of the different categories of artificial intelligence based on their functionality and applications. These infographics feature futuristic designs with icons and illustrations to represent each category of AI. The categories in this template are described with a short summary and corresponding icon or illustration. The infographic is designed with a vertical layout and uses a blue color scheme throughout. This template is perfect to introduce the basics of AI to an audience.


20 diapositivas
Illumira Design Proposal Presentation
Impress clients with this modern and professional design proposal presentation template. It covers key sections such as project summary, objectives, budget breakdown, and action plans. Fully customizable with clean layouts and engaging visuals, perfect for showcasing your design solutions effectively. Compatible with PowerPoint, Keynote, and Google Slides.


23 diapositivas
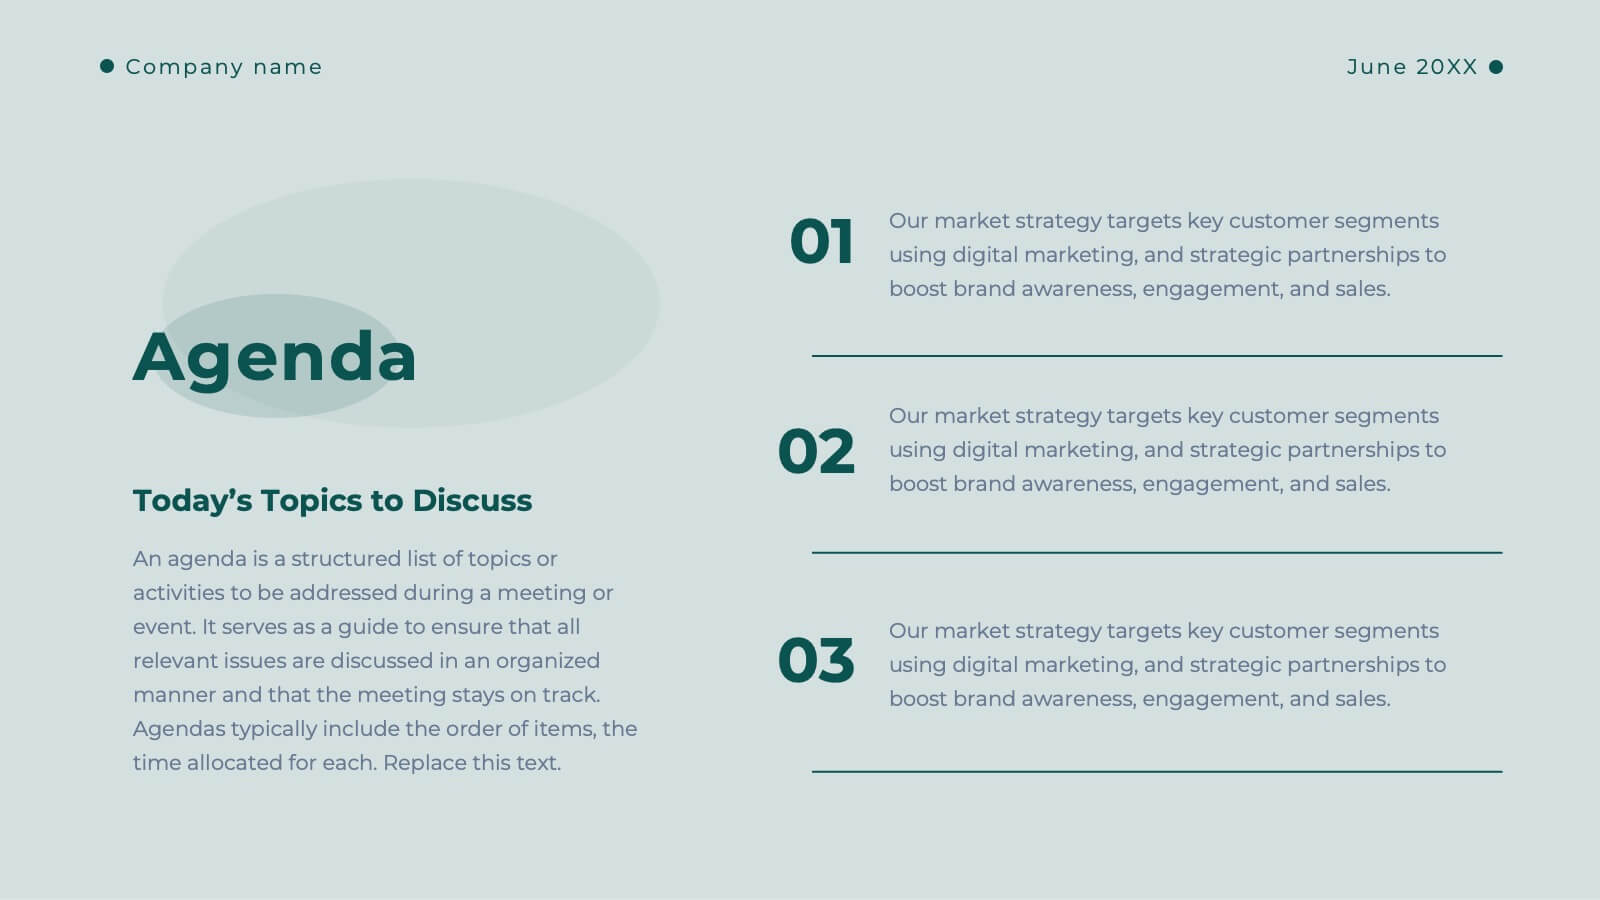
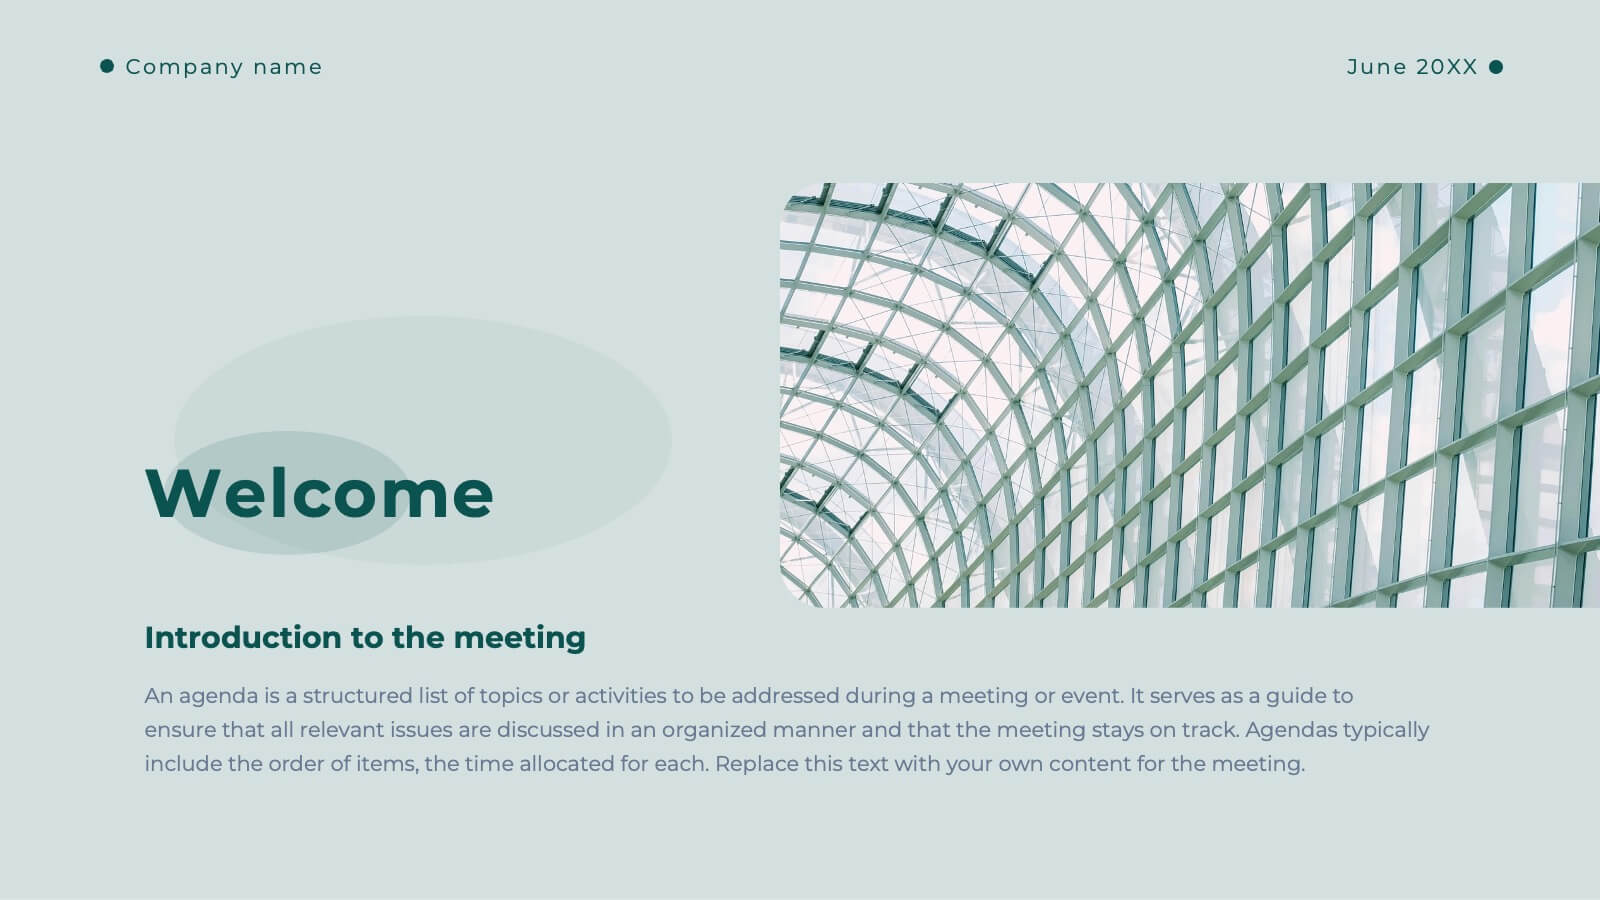
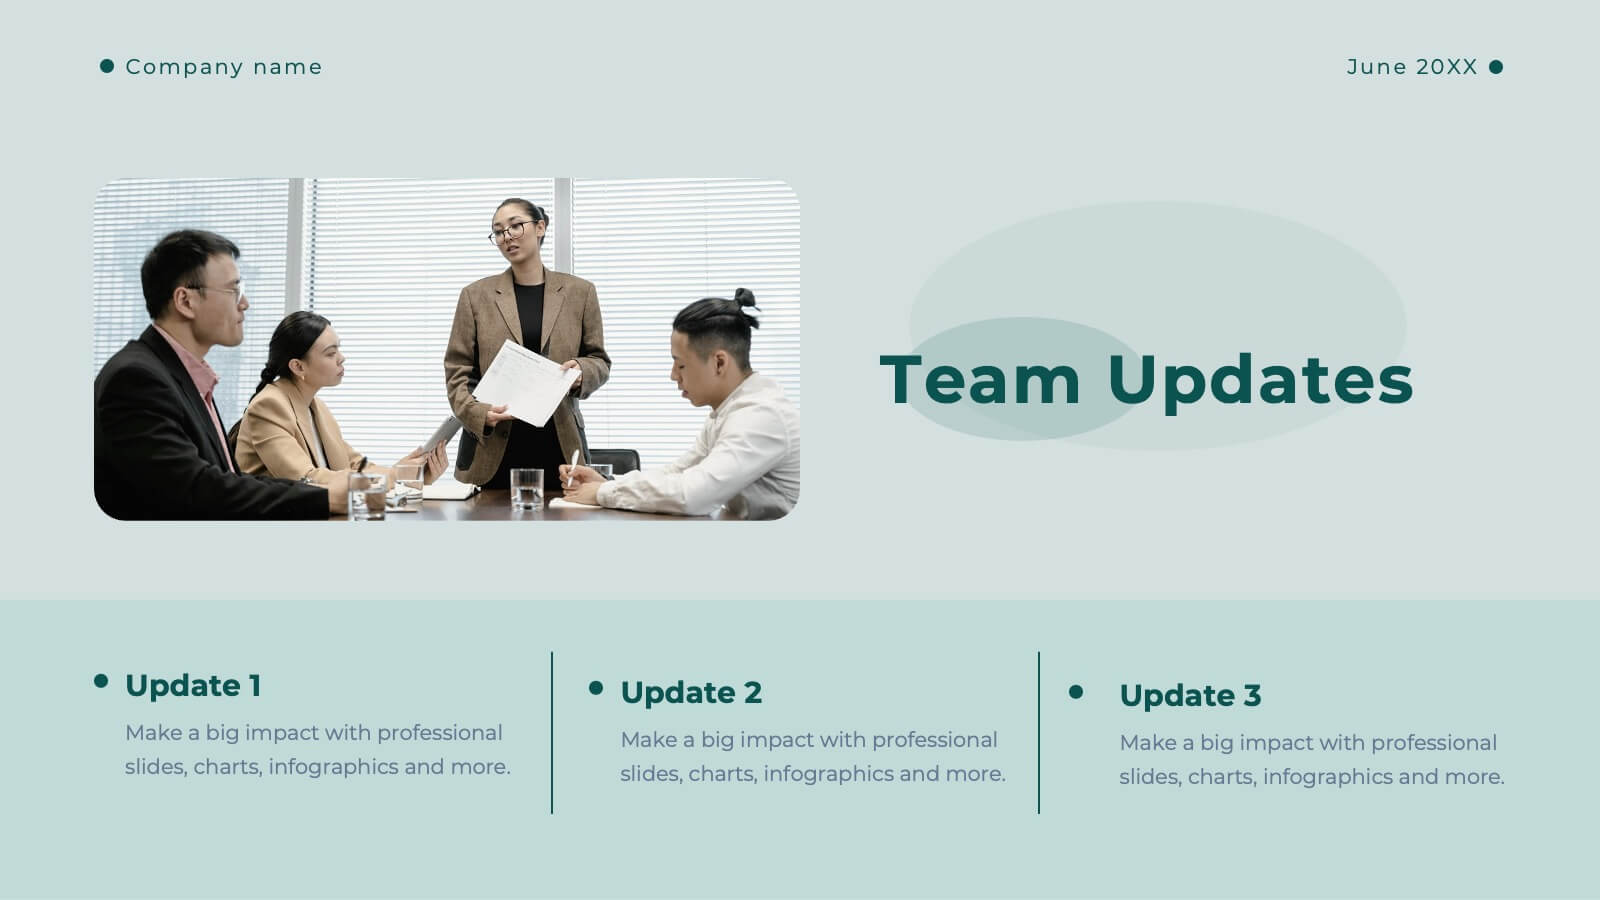
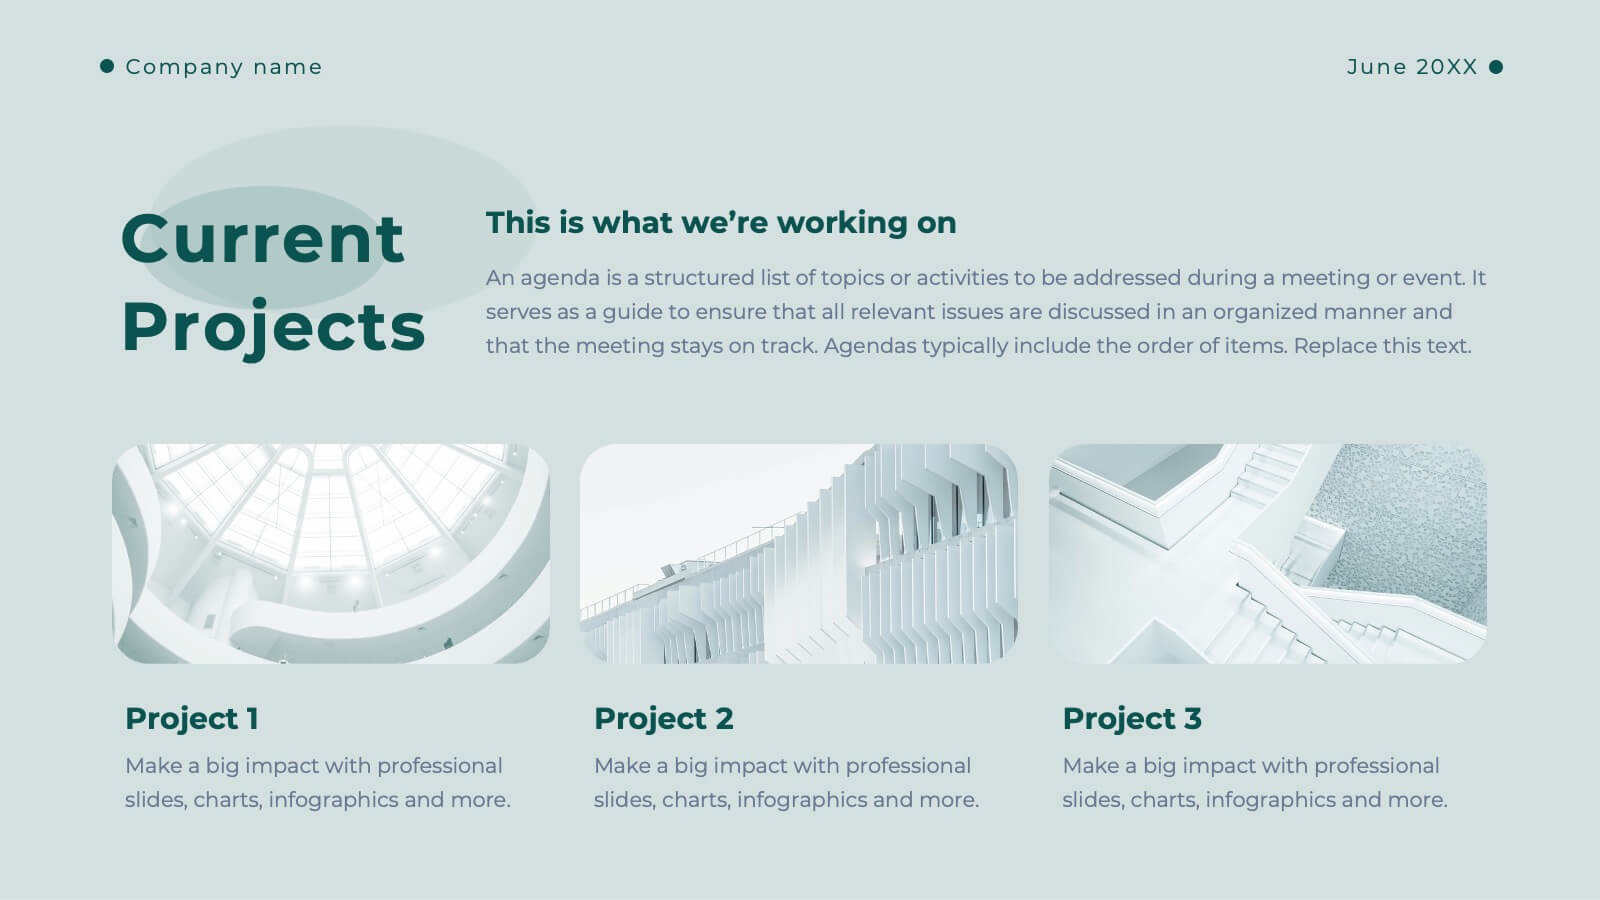
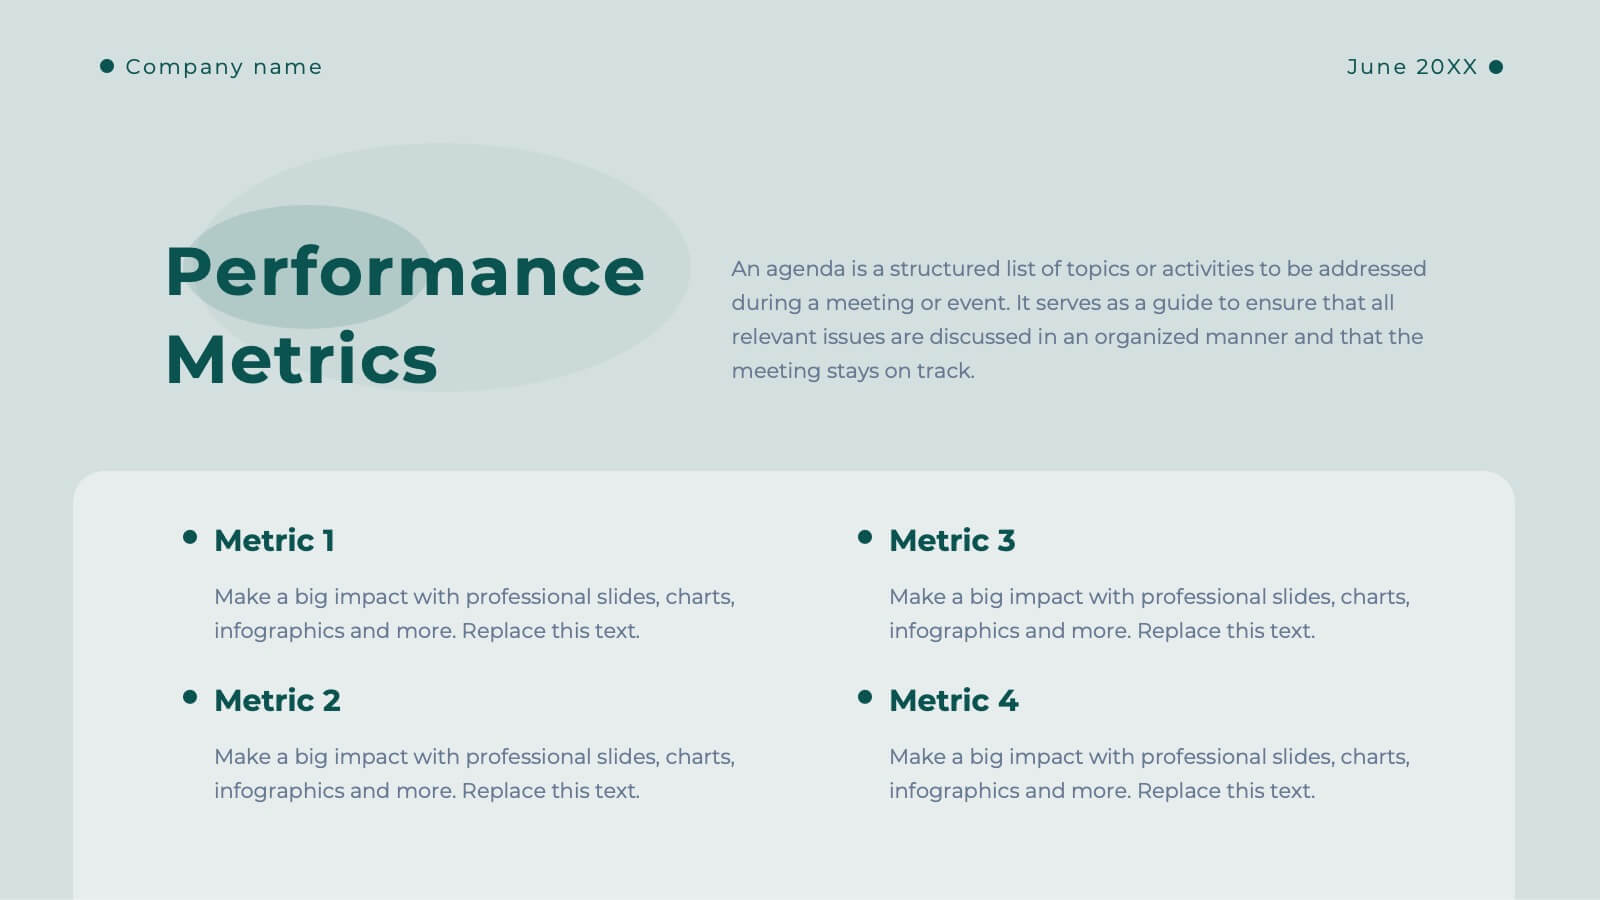
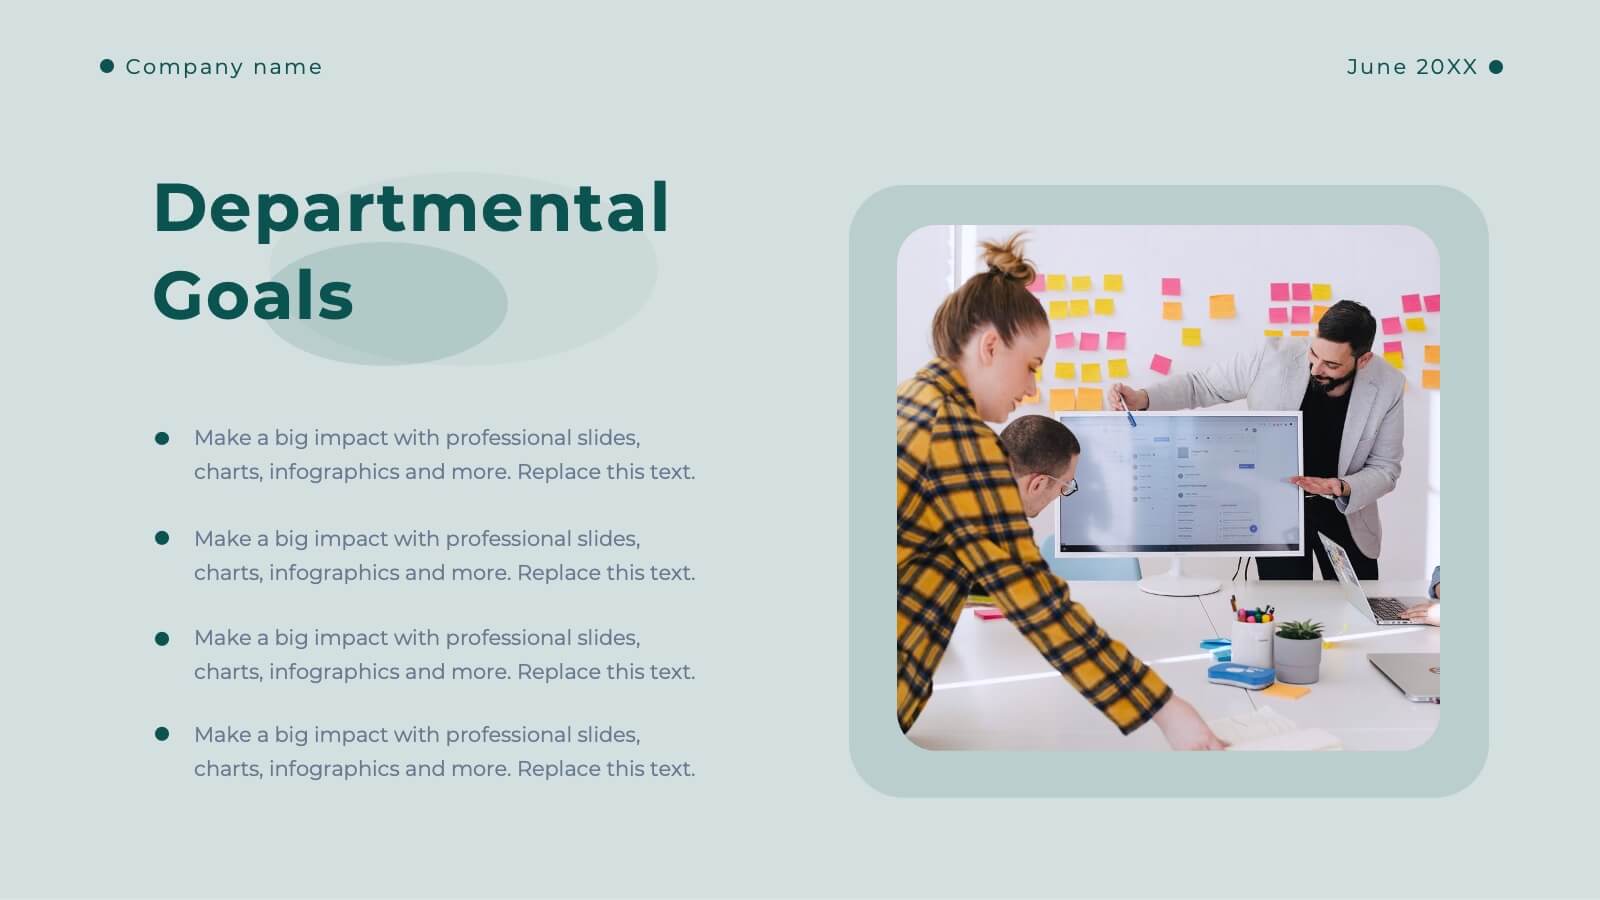
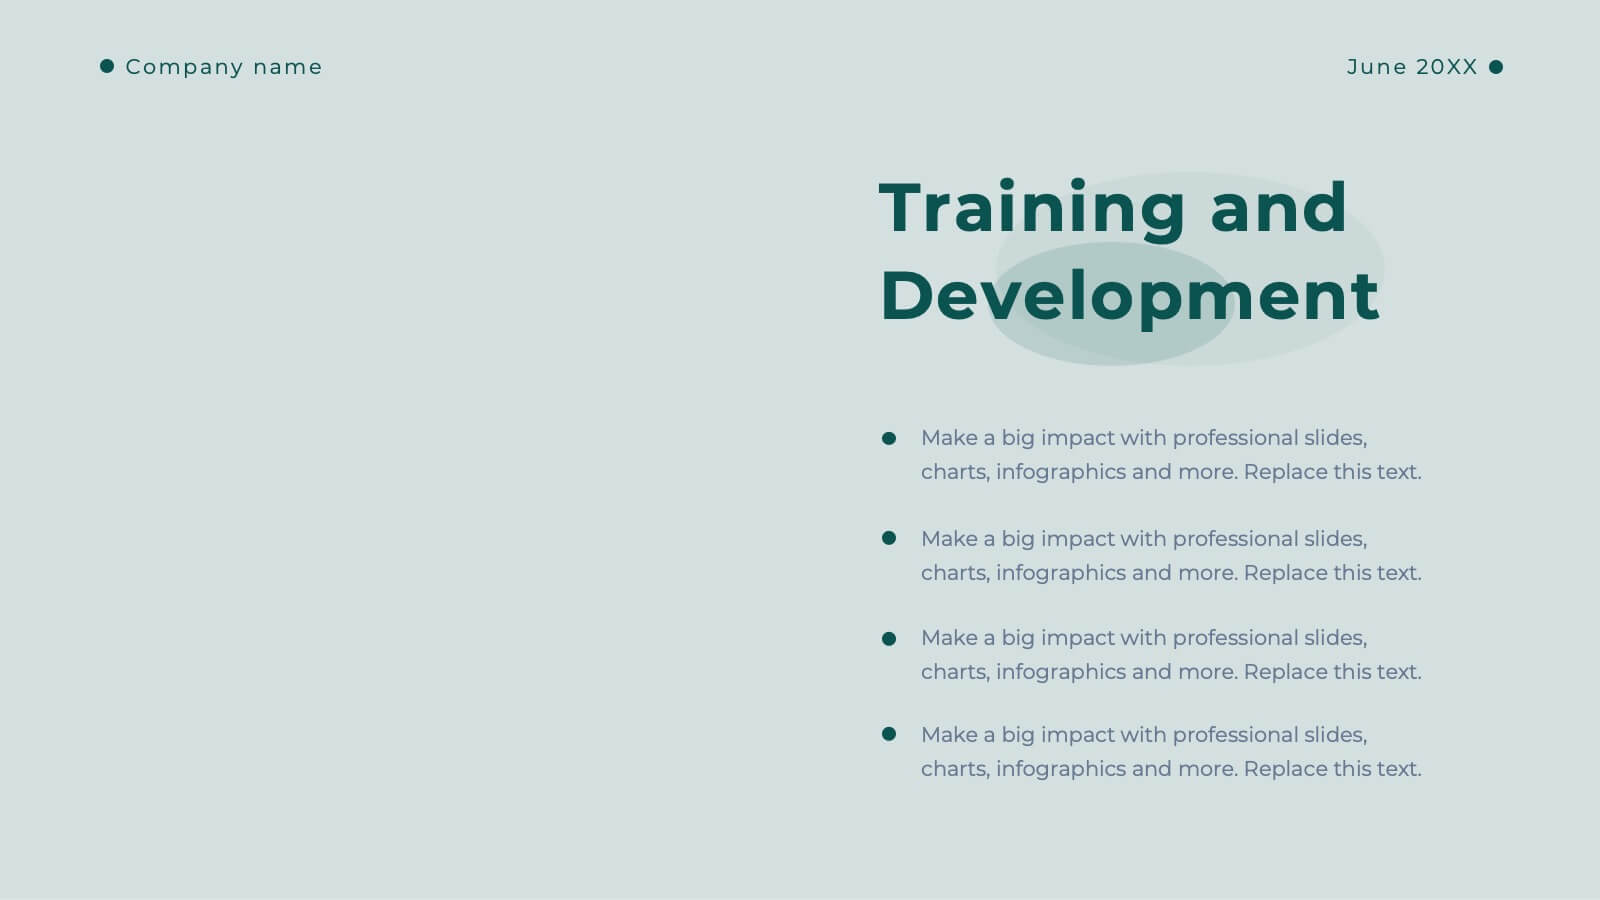
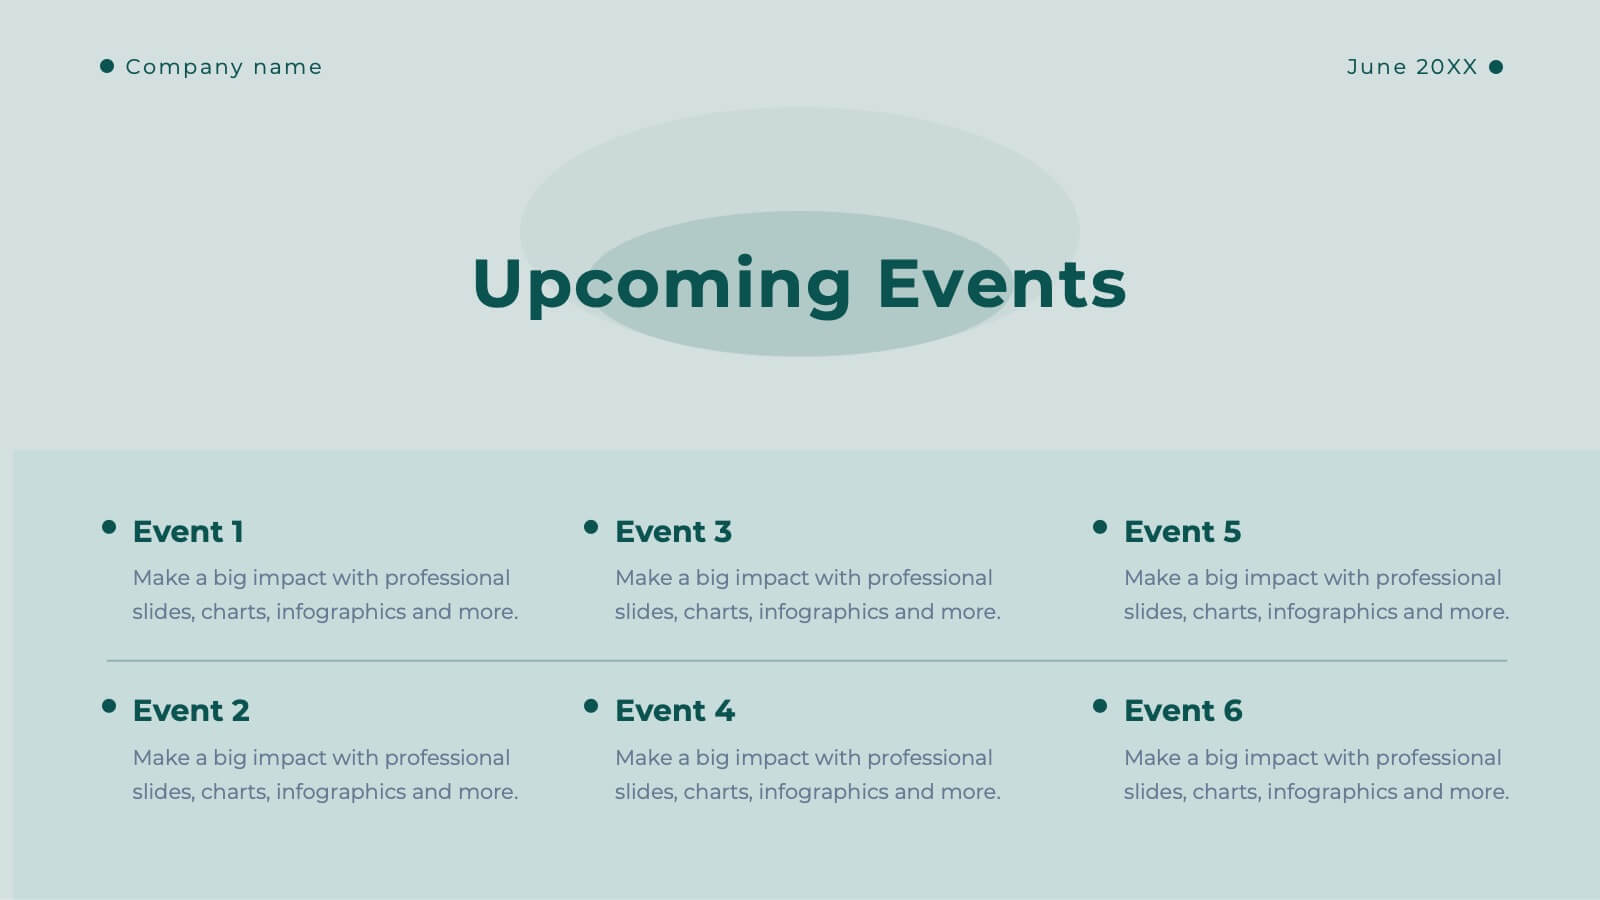
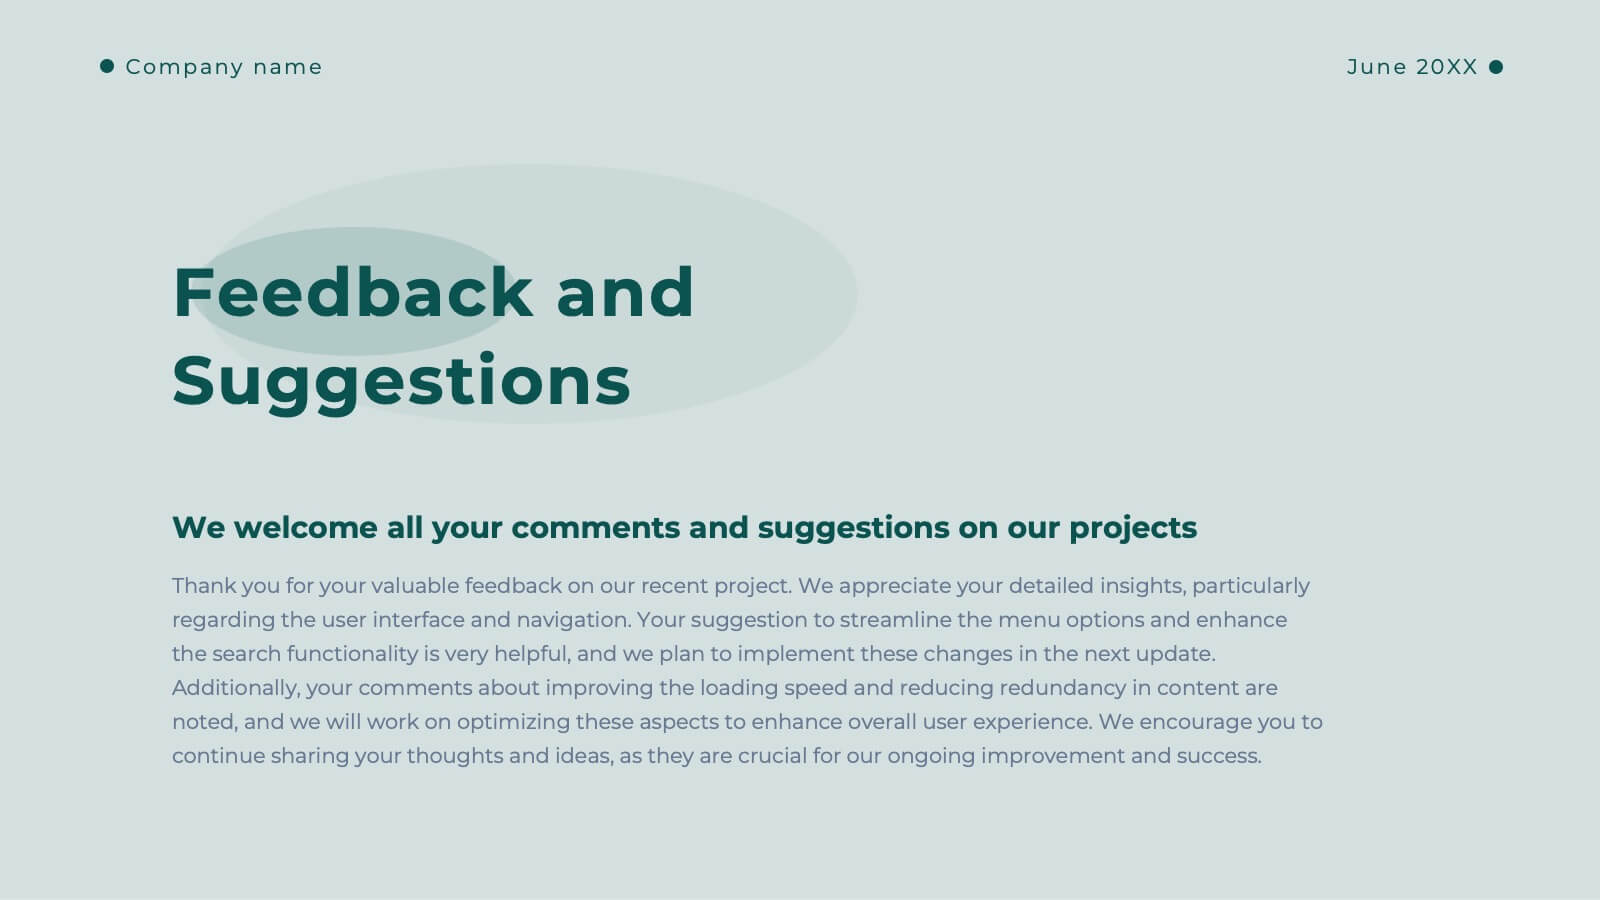
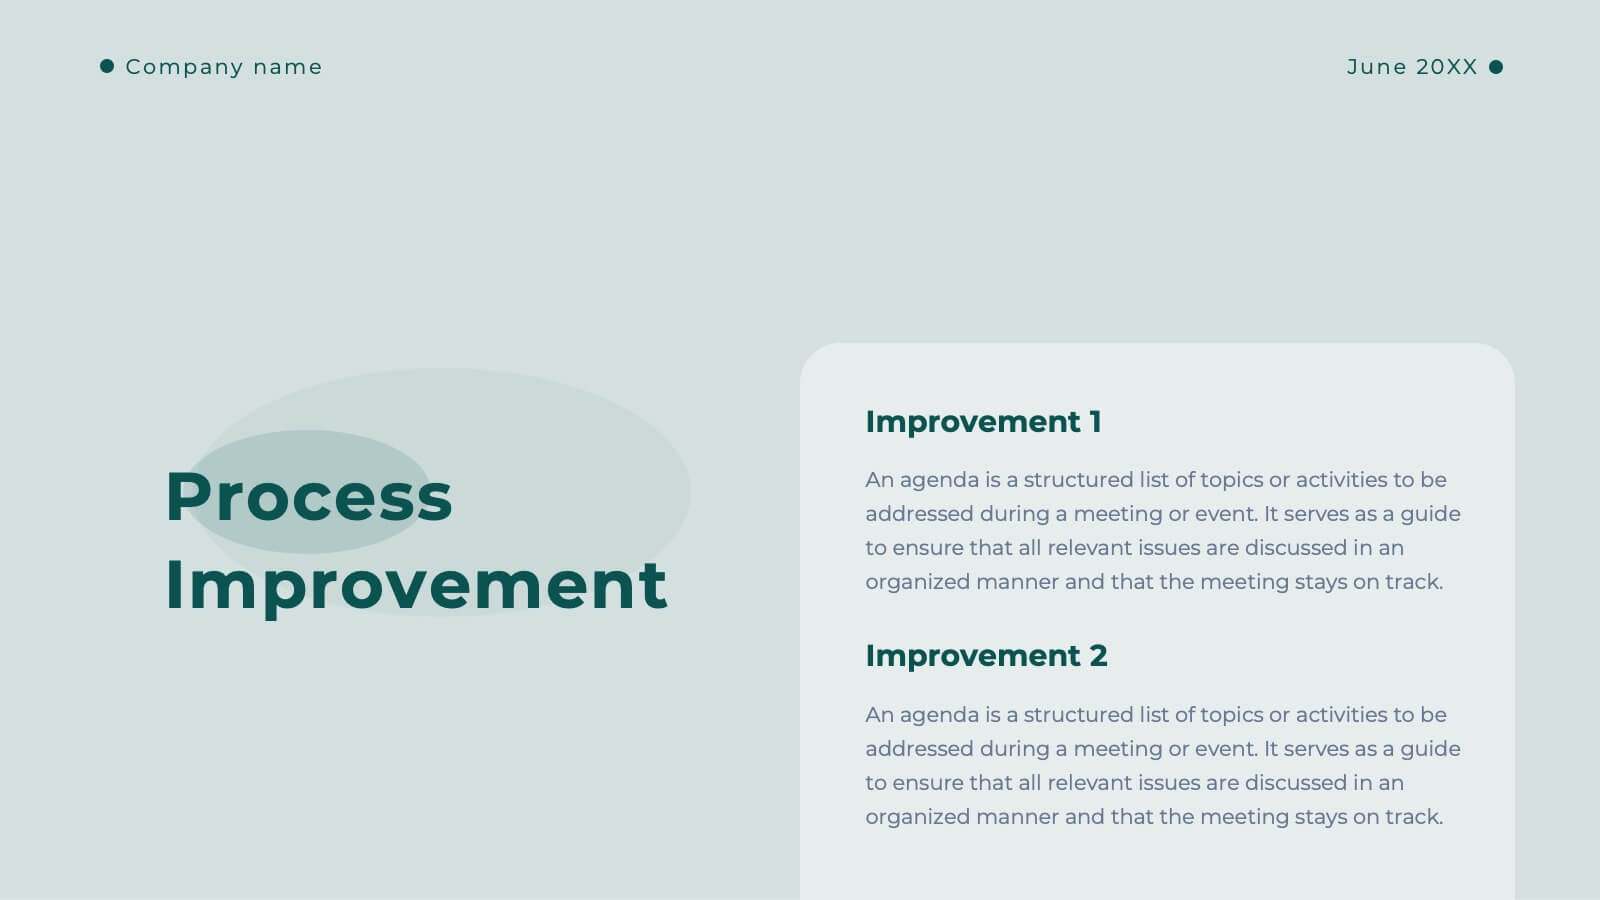
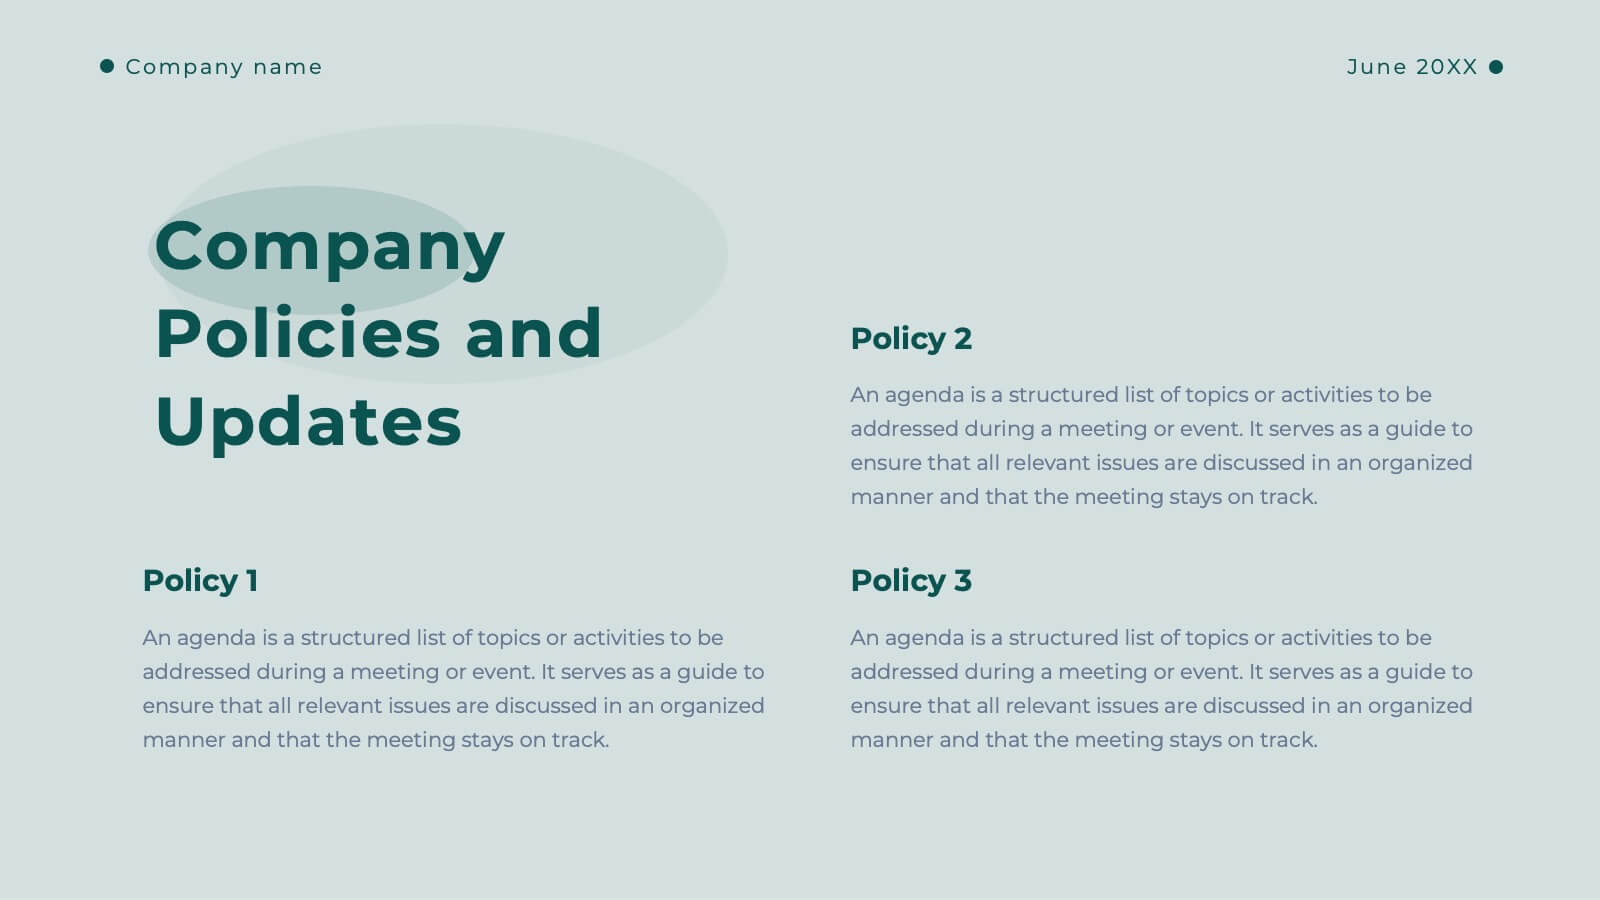
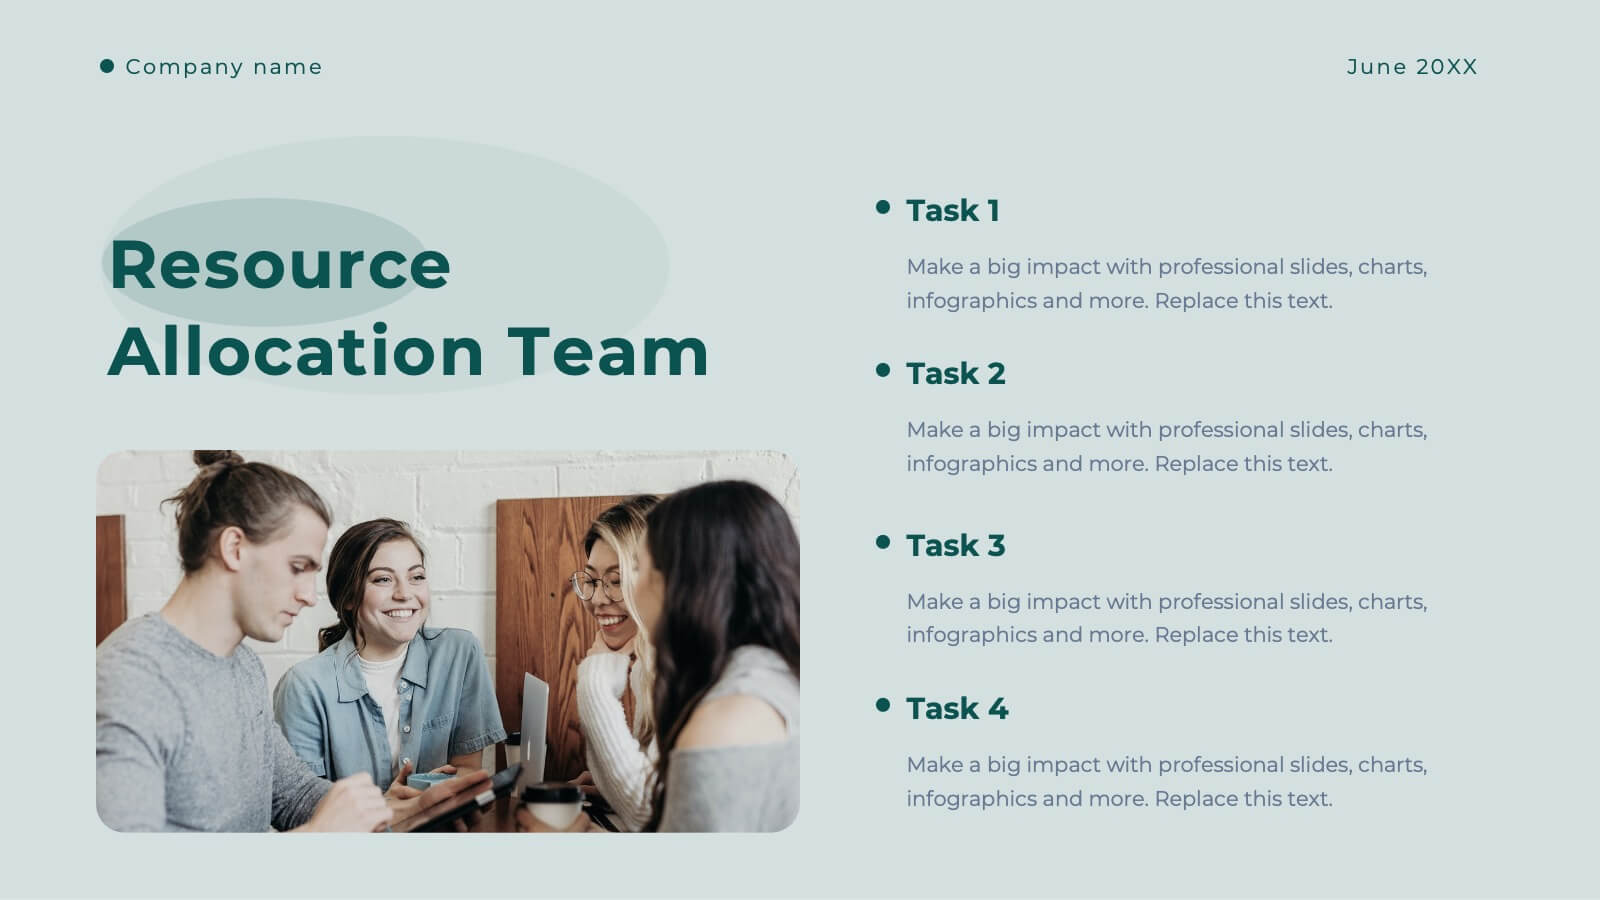
Clarity Business Operations Plan Presentation
Optimize your business operations with this sleek presentation template! Perfect for outlining team updates, key achievements, and performance metrics, it includes slides for departmental goals, process improvements, and upcoming events. Engage your team with clear visuals and detailed content. Compatible with PowerPoint, Keynote, and Google Slides for seamless presentations on any platform.


5 diapositivas
Pet Clinic Business Strategy Presentation
Enhance your pet clinic's approach with our Pet Clinic Business Strategy presentation template. This layout is expertly designed to outline your clinic’s key strategies and enhance your operational excellence, making it perfect for meetings, stakeholder presentations, and strategic workshops.


3 diapositivas
Search Engine Optimization Strategy Presentation
Stand out in your next presentation with this dynamic visual breakdown of digital visibility tactics. Perfect for marketers, business owners, or SEO specialists, this colorful circular infographic highlights the key pillars of a search strategy in a way that's both professional and easy to follow. Compatible with PowerPoint, Keynote, and Google Slides.


5 diapositivas
Strategic Inquiry Mapping Presentation
Bring your ideas to life with a fresh visual flow that maps key questions into action. This strategic template helps you organize complex inquiries across five stages—from insights and communication to analysis and execution. Fully editable and easy to use in PowerPoint, Keynote, and Google Slides for clear visual storytelling.


5 diapositivas
Root Cause Analysis Fishbone Format Presentation
Break down complex problems with the Root Cause Analysis Fishbone Format Presentation. Designed to identify contributing factors visually, this diagram helps teams analyze causes across multiple categories—ideal for quality control, troubleshooting, and process improvement. Fully editable in Canva, PowerPoint, or Google Slides for effortless customization.


6 diapositivas
Work Flow Chart Infographic
Enhance process understanding with our Workflow Chart Infographic, suitable for Powerpoint, Google Slides, and Keynote. Ideal for project managers, team leads, and operational managers, this infographic simplifies the visualization of workflow processes. With customizable shapes representing different stages, tasks, or decisions, this template helps clearly demonstrate the flow of tasks from start to completion. It's an effective tool for illustrating sequences, responsibilities, and handoffs in business processes. Use this infographic to streamline your operations and communicate processes with clarity to your team and stakeholders.


4 diapositivas
Strategic Project Proposal Plan Presentation
Plan with Precision! The Strategic Project Proposal Plan Presentation helps you outline key objectives, strategies, and milestones with a structured, professional design. Perfect for project managers, consultants, and business leaders, this template ensures clarity and impact. Fully editable and compatible with PowerPoint, Keynote, and Google Slides for effortless customization.


6 diapositivas
Organizational Objectives and Key Results Presentation
Showcase your strategic goals and measurable outcomes with the Organizational Objectives and Key Results template. Designed with a sleek radial key layout, it’s ideal for mapping priorities and tracking progress. Fully editable in Canva, PowerPoint, and Google Slides, allowing easy customization of colors, icons, and text to fit your objectives.


6 diapositivas
Strategy for Effective Solutions Presentation
Unlock strategic clarity with the Strategy for Effective Solutions template, which effectively organizes complex strategies into six interconnected segments, ideal for sequentially showcasing business insights. Its clear, systematic design supports concise communication and is compatible with PowerPoint, Keynote, and Google Slides, making it a versatile tool for professional presentations.


5 diapositivas
Business Goals Roadmap Presentation
Bring your long-term vision to life with a clear, structured roadmap that highlights each milestone in your business journey. This presentation helps you outline key objectives, track progress, and communicate strategic priorities with ease. Ideal for planning, strategy, and growth discussions. Fully compatible with PowerPoint, Keynote, and Google Slides.