


Características


¿Tienes alguna pregunta?
Recomendar


6 diapositivas
Unique Intersection Comparison Diagram
Illustrate complex relationships with clarity using the Unique Intersection Comparison Diagram Presentation. This visually engaging 5-circle diagram highlights overlaps and distinct points, ideal for showcasing cross-functional collaboration, multi-variable strategies, or layered comparisons. Each segment supports titles and brief text, making it perfect for business planning, product features, or audience segmentation. Fully editable in PowerPoint, Keynote, and Google Slides.


7 diapositivas
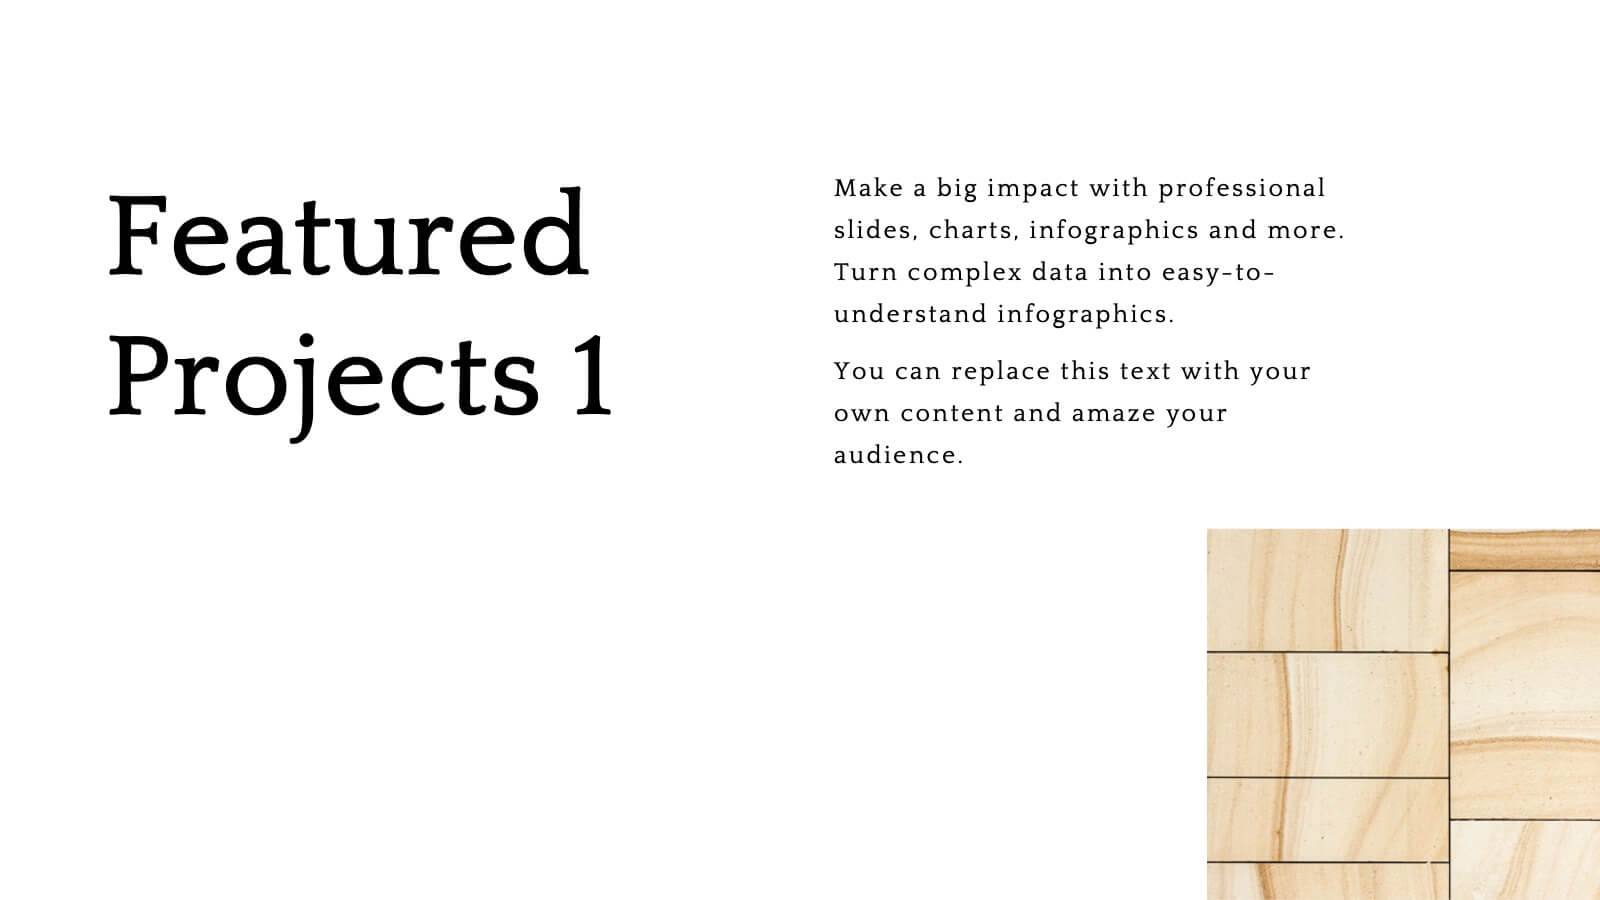
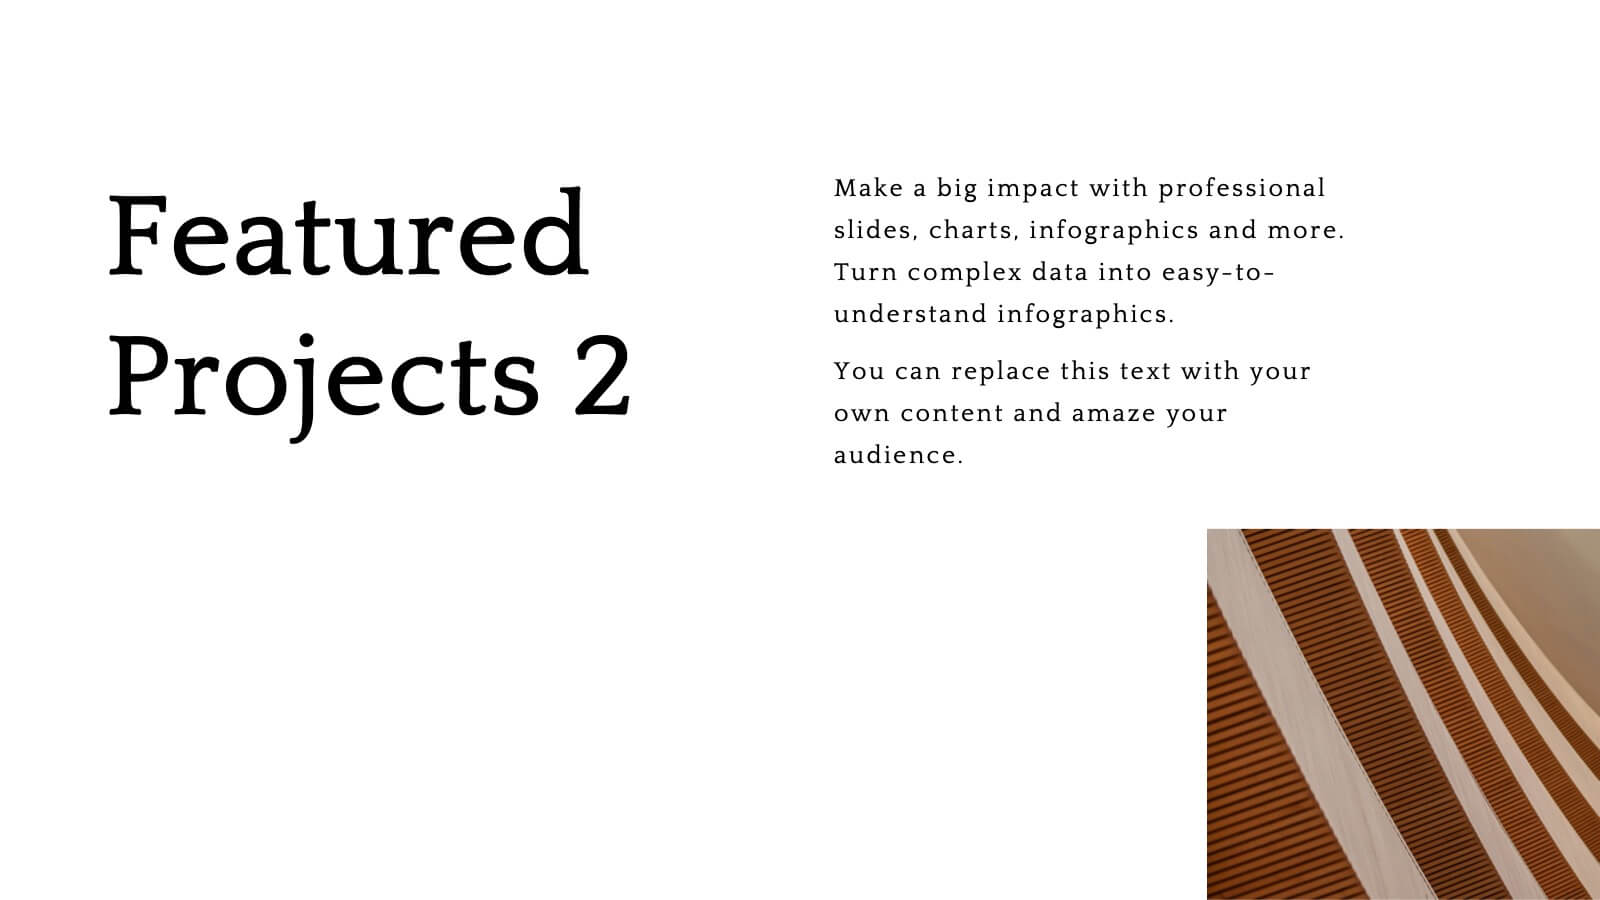
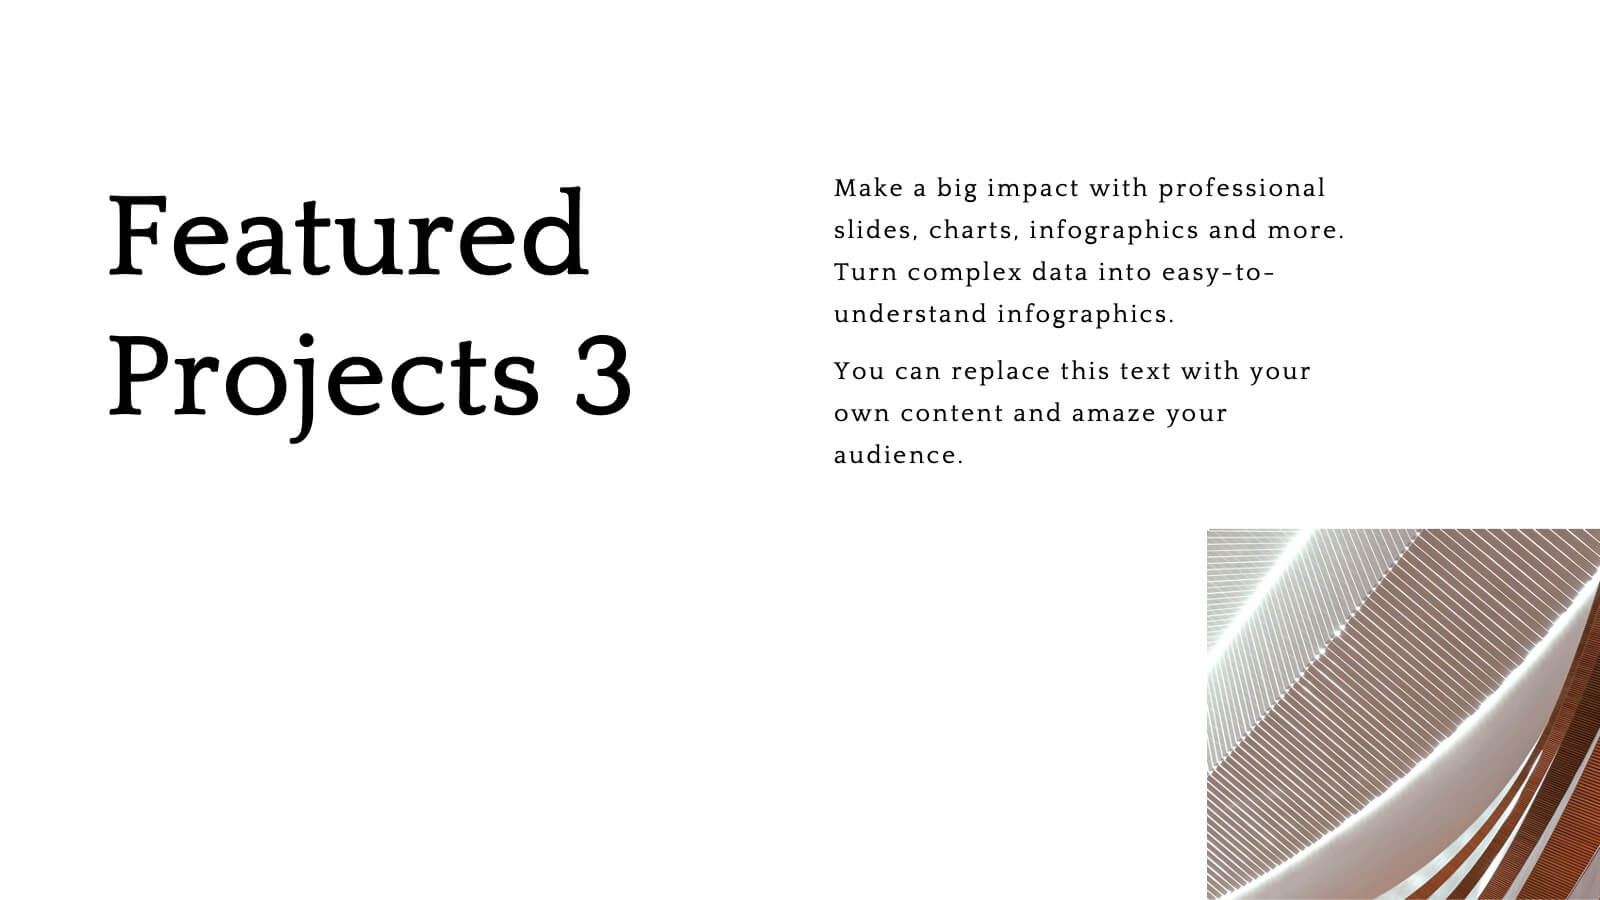
Project Introduction Infographic
Effortlessly introduce your projects with our collection of project introduction slide templates, tailored for clear and effective communication. These templates are ideal for providing an overview of project goals, scopes, and deliverables, ensuring all key points are conveyed to stakeholders efficiently. Each template features a modern design, incorporating sleek graphics and bold text to highlight critical information, making them perfect for kickoff meetings, client presentations, or internal reviews. The layouts are carefully structured to guide the audience through the introduction process, including the presentation of team members, project timelines, and expected outcomes. Fully customizable to fit your specific project needs, these templates allow you to modify colors, fonts, and imagery to align with your brand identity and project requirements. Utilize these professionally designed slides to make a compelling case for your project, engaging your audience right from the start.


6 diapositivas
Employee Feedback Survey Results Presentation
Showcase Employee Feedback Survey Results with a data-driven and professional layout designed for clear visualization and analysis. This PowerPoint, Keynote, and Google Slides-compatible template features stacked bar charts for easy trend comparison, helping you present workplace insights effectively. Fully customizable with editable text, colors, and labels, this template ensures a seamless and engaging presentation of employee feedback metrics.


7 diapositivas
Company Title Infographic
This collection of slides is designed to vividly present company profiles and services, utilizing a dynamic color palette of blue, yellow, and white to create an engaging viewer experience. Each slide is meticulously crafted to cater to specific content, enhancing the presentation's overall effectiveness and appeal. Starting with the "Empathy Map" slide, it offers a detailed insight into customer perceptions and experiences, essential for tailoring services to meet client needs. The "SEO Report" slide focuses on showcasing quantifiable data, critical for evaluating marketing success. A dedicated "Portfolio" slide highlights past achievements, pivotal for attracting potential clients and investors by demonstrating proven capability and success. Further slides like "What We Do" and "Objectives" provide clear, straightforward layouts that detail the company’s primary activities and strategic goals, respectively. The "Projects" slide offers a glimpse into current and prospective projects, illustrating ongoing development and future aspirations. Ideal for stakeholder briefings, marketing pitches, or internal reviews, these templates support companies in communicating a cohesive and comprehensive narrative of their operational scope and strategic direction.


6 diapositivas
Gantt Charts Analysis Infographic
Streamline your project planning with our Gantt Chart Analysis Infographic, designed for seamless integration with Powerpoint, Google Slides, and Keynote. The Gantt chart layout allows you to display activities against a time scale, making it easy to identify key phases, task durations, and overlapping activities. Each bar represents a task, with colors and lengths that can be customized to reflect different stages or priorities. Perfect for detailing project timelines, and workflow coordination, this template is a visual aid that enhances clarity and fosters collaborative project management. With this Gantt Chart infographic, you can ensure your project stays on track.


12 diapositivas
Sales Metrics Dashboard Presentation
Unlock a sharper view of your sales story with a clean, data-driven layout that highlights performance trends at a glance. This presentation organizes KPIs, charts, and progress indicators into an easy-to-follow dashboard that supports smarter decision-making. Fully compatible with PowerPoint, Keynote, and Google Slides.


5 diapositivas
Identifying and Mitigating Risks Presentation
Master risk management with the Identifying and Mitigating Risks template, designed to deliver clear and impactful presentations that outline key risk factors and mitigation strategies. It features easily customizable icons representing various aspects of risk assessment. This template allows professionals to effectively communicate risk mitigation strategies, ensuring essential information is concise and understandable. Additionally, it is compatible with PowerPoint, Keynote, and Google Slides.


6 diapositivas
Strategic Triangle Layout Presentation
Turn your ideas into a visual roadmap with this sleek, geometric layout that balances design and strategy. Perfect for illustrating workflows, key milestones, or connected concepts, it helps your message flow seamlessly across stages. Fully editable and compatible with PowerPoint, Keynote, and Google Slides for effortless customization.


26 diapositivas
E-commerce Business Strategies Presentation
Dive into the dynamic world of e-commerce with a presentation that’s a portal into the marketplace of tomorrow. This is not just a slideshow; it’s a strategic map charting the course through the ever-evolving digital bazaar. Picture the first slide, a welcoming gateway that beckons you into the realm of online trade, setting the scene for a narrative of innovation and growth. As you navigate through, you encounter the visionaries, the driving force behind the brands, presented as pioneers on a quest for digital dominance. Each slide serves as a stepping stone, unveiling options for conquering virtual marketplaces, with comparative analyses that dissect successful tactics. Financial projections, illustrated not simply as statistics, but as trophies to be won in the grand game of e-commerce. The closing slide is not a mere farewell, but a pledge to continue the voyage into the boundless potential of online business, leaving viewers not just informed, but inspired to join the revolution.


30 diapositivas
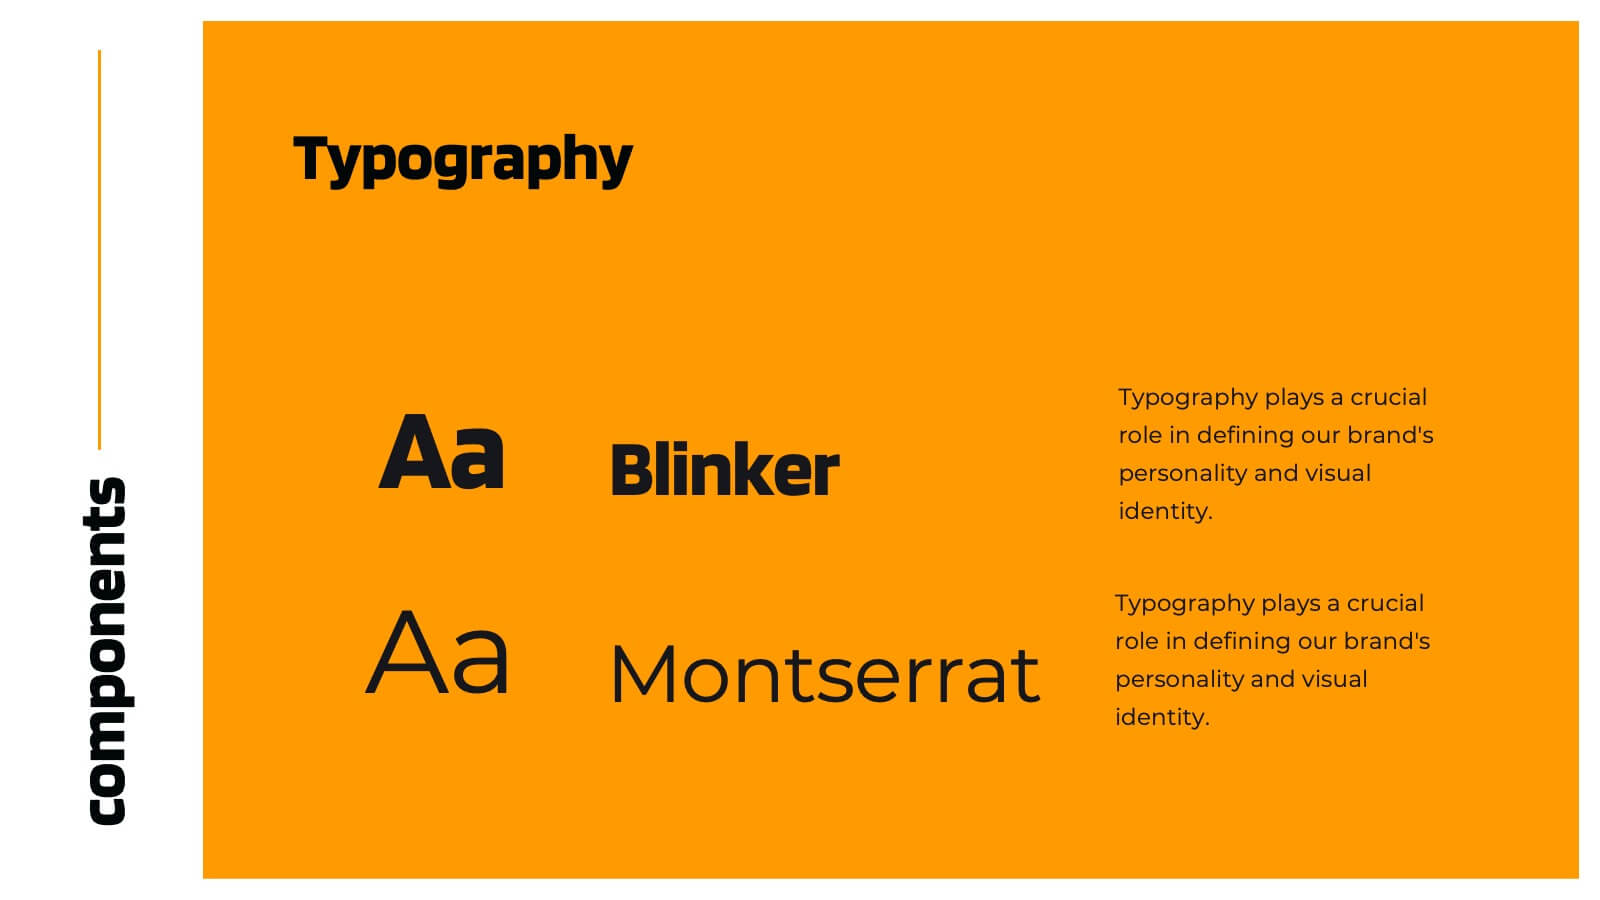
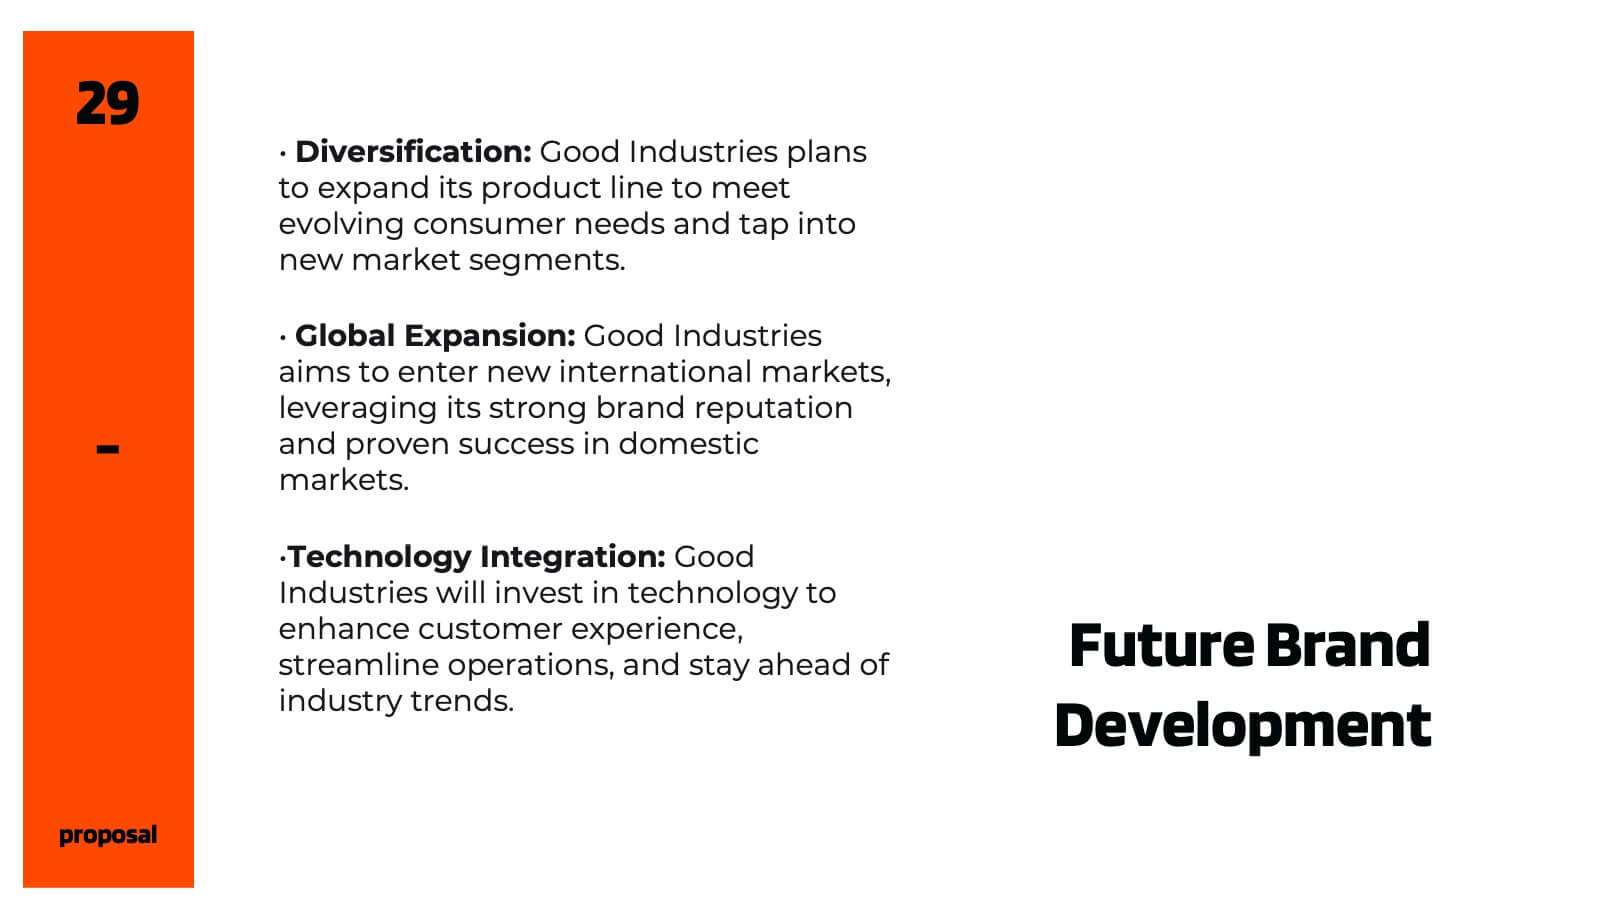
Chromalight Brand Guidelines Proposal Presentation
Elevate your brand's story with this visually engaging presentation template that embodies modern, professional aesthetics. From mission and vision statements to brand identity and market positioning, each slide is crafted to showcase your brand's core essence. Ideal for brand strategists and marketers, this template is compatible with PowerPoint, Keynote, and Google Slides.


6 diapositivas
Butterfly Chart Data Visualization
Present complex comparisons with visual elegance using the Butterfly Chart Data Visualization Presentation. This eye-catching format displays six key data points split symmetrically across two wings—perfect for showcasing contrasts like pros vs. cons, before vs. after, or product comparisons. Each section is color-coded and paired with editable text areas for clarity. Ideal for reports, strategy meetings, and decision-making decks. Fully compatible with PowerPoint, Keynote, and Google Slides for effortless customization.


24 diapositivas
Catalyst Strategic Planning Report Presentation
Unleash your strategic vision with the Catalyst Strategic Planning Report template! This vibrant and dynamic layout is designed to make your strategic planning presentations not only effective but also visually captivating. The template’s playful yet professional design elements, including bold color blocks and creative graphics, draw attention to key points, ensuring your message resonates with your audience. From SWOT analysis to market trends, and resource allocation to action plans, every slide is crafted to communicate your strategic objectives clearly and compellingly. Perfect for business reviews, strategic meetings, or investor presentations, this template allows you to present data-driven insights and actionable steps in an engaging manner. It’s fully customizable, making it easy to adapt to your brand’s colors and style. Whether you’re presenting to a team or stakeholders, the Catalyst template provides the perfect platform to articulate your vision. Compatible with PowerPoint, Keynote, and Google Slides, it’s your go-to tool for impactful strategic presentations!

21 diapositivas
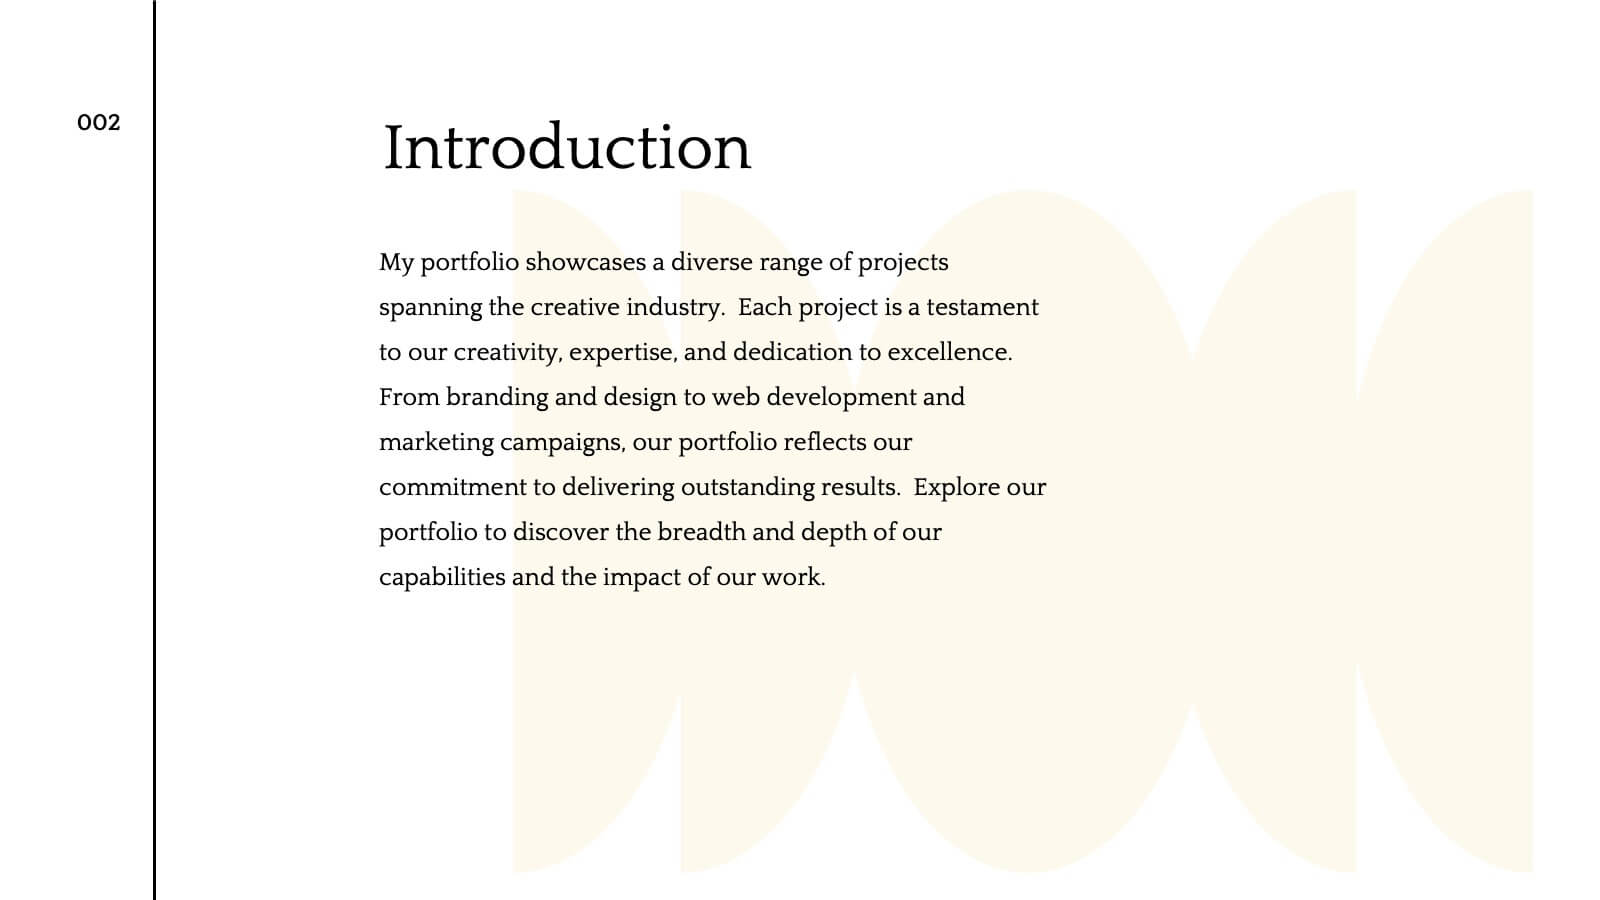
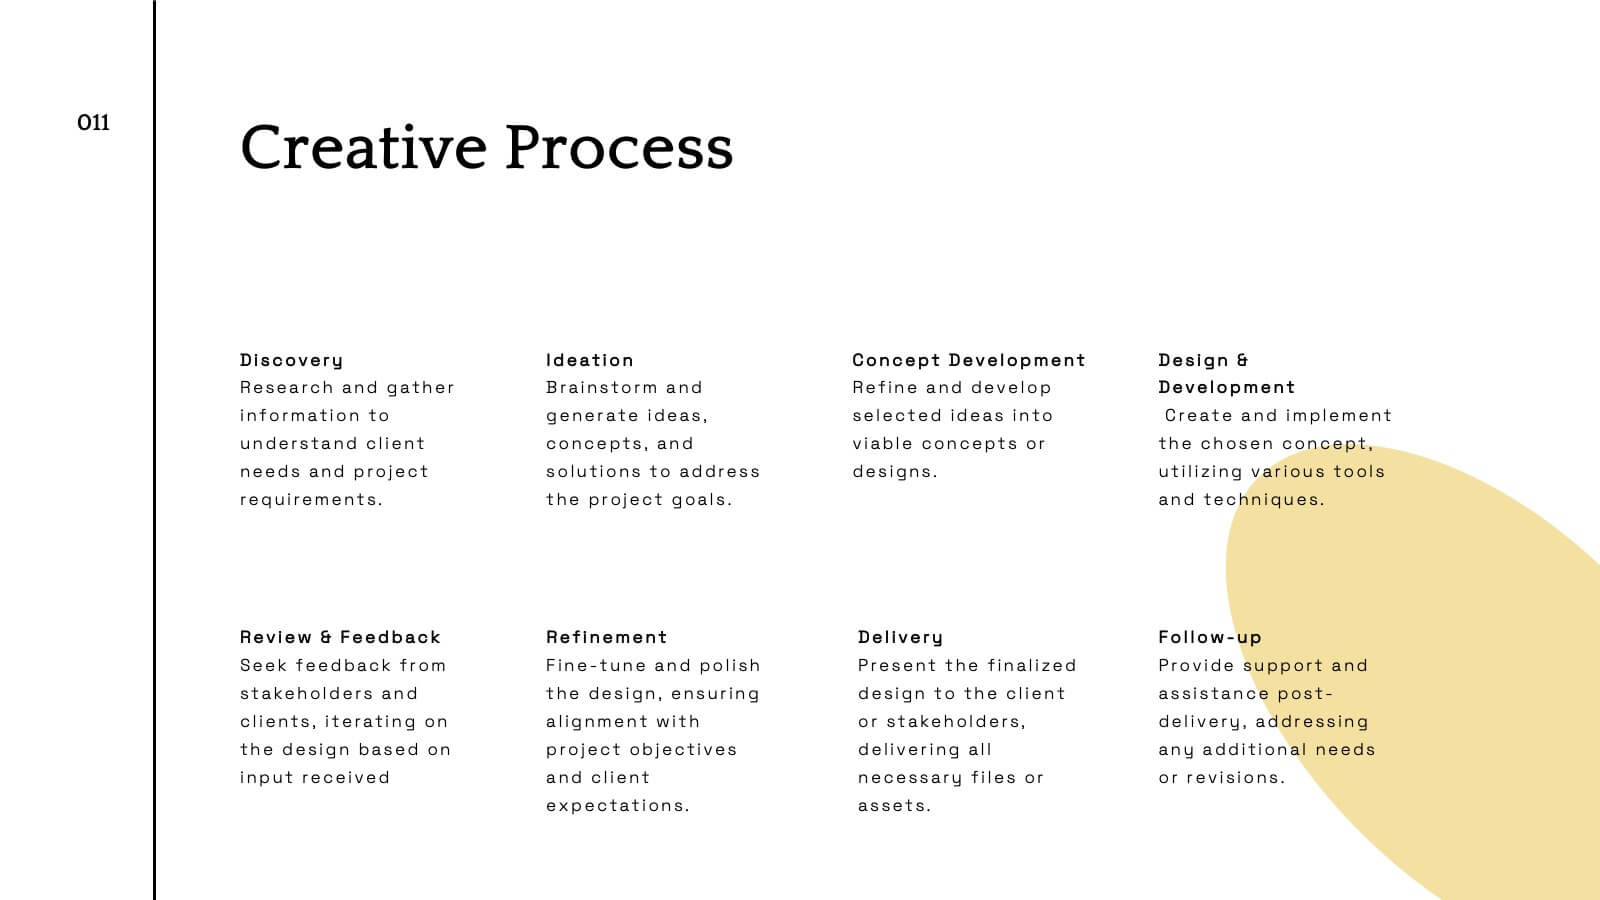
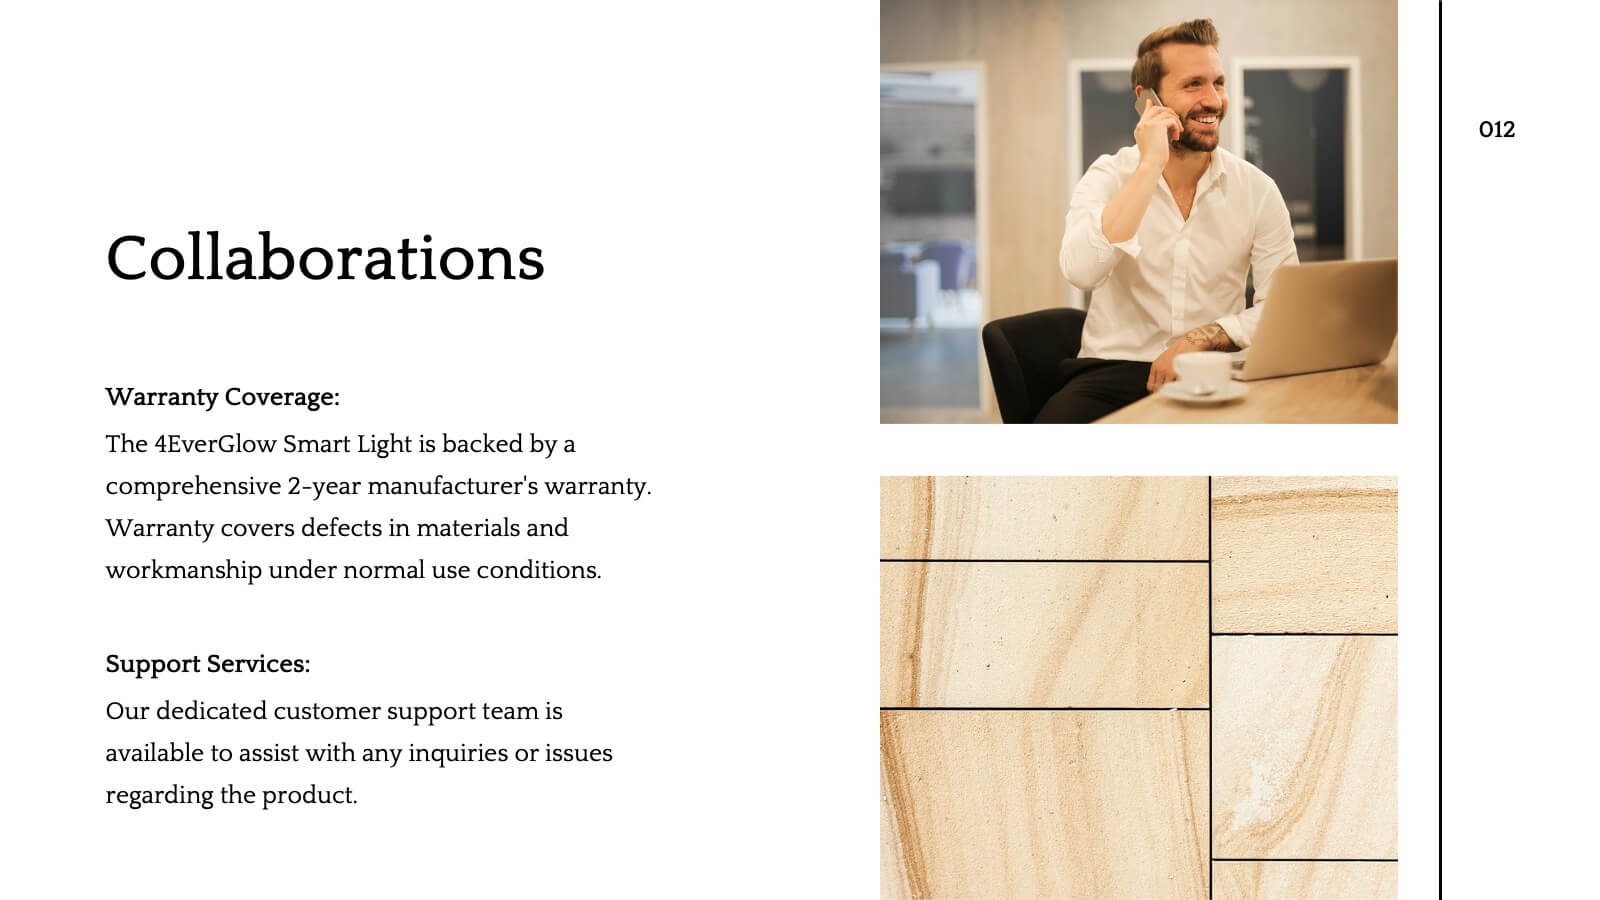
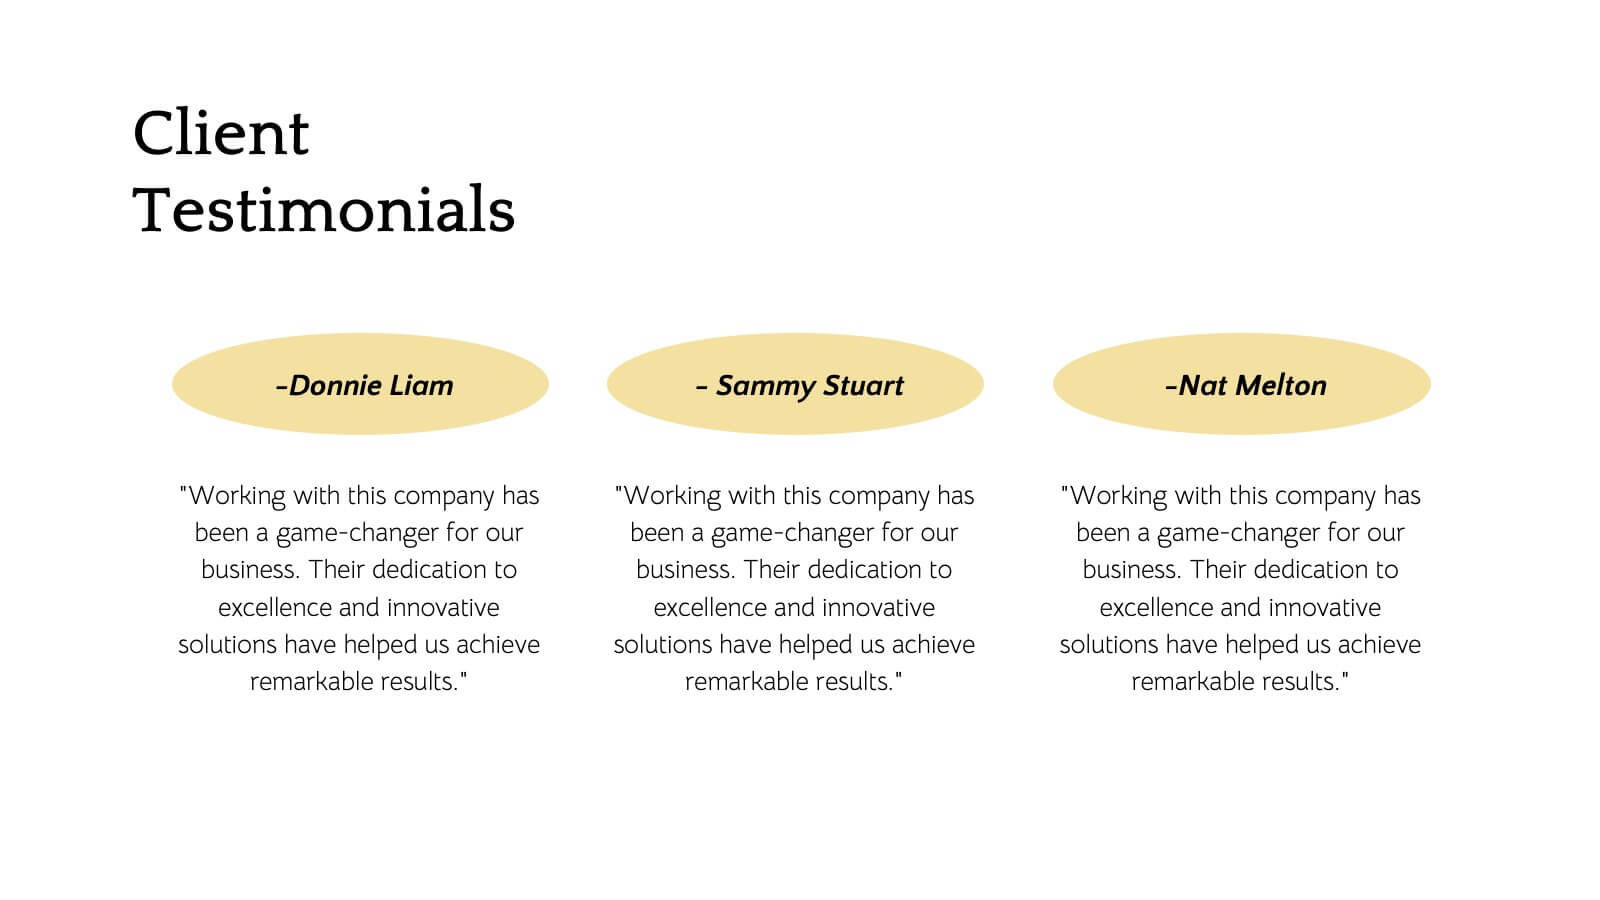
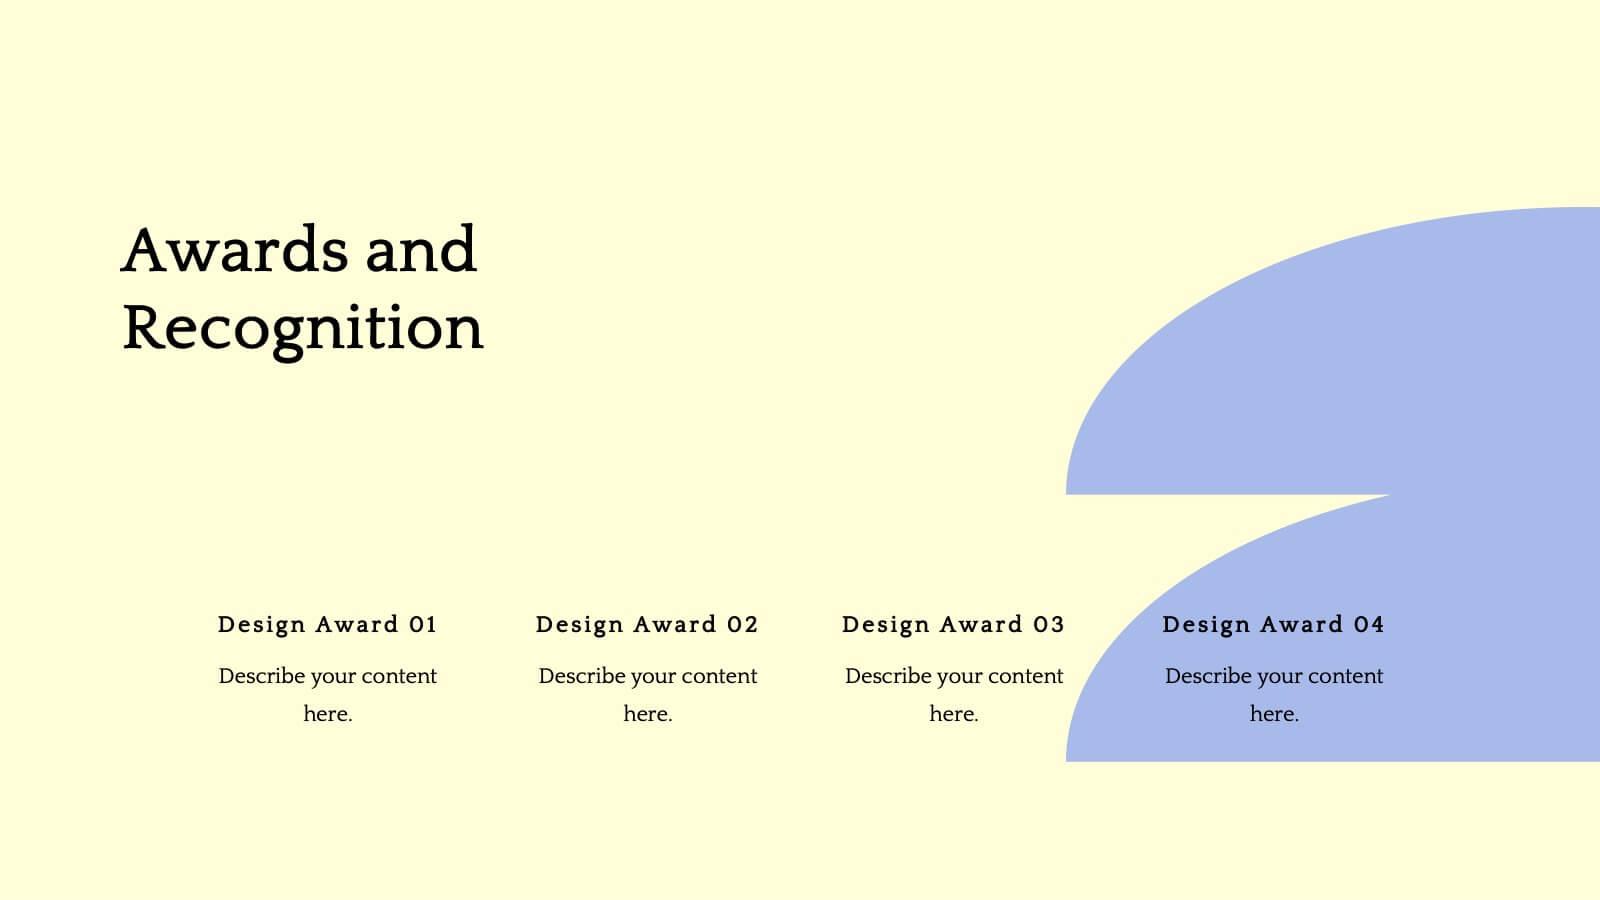
Flare Creative Portfolio Presentation
Showcase your creative work with this elegant portfolio template! Perfect for highlighting projects, client testimonials, and services offered. Ideal for artists, designers, and creatives aiming to impress clients and collaborators. Compatible with PowerPoint, Keynote, and Google Slides, this template ensures your portfolio is clear, professional, and visually stunning. Make your work shine!


7 diapositivas
Vision Infographic
Elevate your presentations with our range of Slide Templates, tailored to showcase long-term objectives and strategies. These designs vary from simple and clean to bold and engaging, ensuring that every slide effectively communicates your forward-looking plans. Each template is crafted for easy customization to suit your brand's style, including areas for essential details, data representation, and motivational elements. They are perfect for aligning your team, engaging stakeholders, and promoting strategic discussions. Ideal for business presentations, team meetings, and motivational sessions, these templates offer a professional way to present your future goals and engage your audience effectively.


4 diapositivas
Strategic SWOT Matrix Overview Presentation
Present your strategic insights with clarity using the Strategic SWOT Matrix Overview Presentation. This modern slide layout features a sleek horizontal design that separates Strengths, Weaknesses, Opportunities, and Threats into visually distinct segments. Ideal for business planning, strategy reviews, or team discussions. Fully editable in PowerPoint, Canva, and Google Slides.


6 diapositivas
Project Proposal Slide Deck Presentation
Make your next pitch unforgettable with a clean, structured layout that turns complex project ideas into a clear visual story. Ideal for presenting timelines, goals, or performance metrics, it helps you communicate your proposal with confidence and precision. Fully compatible with PowerPoint, Keynote, and Google Slides for effortless editing.


22 diapositivas
Marketing Research Presentation
Streamline your data presentation with our Marketing Research template. It includes comprehensive slides on research objectives, methodology, data analysis, and key findings. Ideal for academic and professional settings, this template is compatible with PowerPoint, Keynote, and Google Slides, enhancing your research presentations with precision and professionalism.