


Características


¿Tienes alguna pregunta?
Recomendar


6 diapositivas
Social Relationship Infographics
Revitalize your presentations on social dynamics with our Social Relationship infographic, seamlessly compatible with Powerpoint, Keynote, and Google Slides. This infographic is a perfect addition for sociologists, relationship coaches, and educators who aim to discuss the complexities and interconnectedness of social relationships. The infographic offers a visual breakdown of different social relationship types, the dynamics within those relationships, and the factors influencing social interactions. It's designed to help audiences understand the different layers and nuances that make up social connections, whether in personal networks, communities, or professional environments. Incorporating this infographic into your presentations will assist in illustrating how relationships are formed, maintained, and evolved. It serves as an educational tool that can lead to deeper discussions about social bonds, communication patterns, and relationship management. Utilize this infographic to provide a clear and impactful visual representation of the fundamental concepts in social relationship studies.


5 diapositivas
5G Wireless Technology Infographics
5G technology refers to the fifth generation of wireless communication technology. These infographic templates are designed to showcase the key features, benefits, and impact of 5G technology. These are perfect for technology enthusiasts, professionals, educators, or anyone looking to explain the concept and advancements of 5G. Educate and inform your audiences about the concept, benefits, and applications of 5G technology with these infographics. It is fully customizable and has attention-grabbing design elements making it easy to create a compelling presentation about the advancements and potential of 5G technology.


6 diapositivas
Scope Planning Template for Project Teams Presentation
Turn teamwork into strategy with a clear, circular layout that maps every phase of your project plan. This modern presentation helps teams define objectives, assign roles, and visualize scope effortlessly. Easy to edit and fully compatible with PowerPoint, Keynote, and Google Slides for seamless collaboration and customization.


5 diapositivas
Multi-Level Concentric Circles Framework Presentation
Visualize relationships and layered strategies with the Multi-Level Concentric Circles Framework Presentation. This template uses interlinked circular nodes to represent multi-tier systems, process flows, or strategic components in an intuitive layout. Easily editable in PowerPoint, Keynote, and Google Slides for seamless integration into your presentations.


10 diapositivas
Market Positioning Competitive Analysis
Visually assess your brand’s position in the market with this quadrant-based layout designed for strategic clarity. This slide helps showcase key comparisons across marketing analysis, target audience alignment, unique value proposition, and messaging consistency. Fully editable in PowerPoint, Keynote, and Google Slides.


5 diapositivas
Dynamic Pricing Strategies
Make pricing strategy look smart and data-driven with this bold, modern infographic template. Designed to explain how pricing evolves with demand, value, and profit margins, this slide visually guides viewers through key steps in your dynamic pricing model. Fully editable and compatible with PowerPoint, Keynote, and Google Slides for seamless use.


7 diapositivas
RAPID Profit Matrix Infographic
Delve into the systematic world of decision-making with our RAPID Matrix infographic. Cloaked in the trustworthiness of blue tones and complemented by the proactive energy of green, our template elucidates the RAPID framework—Recommend, Agree, Perform, Input, Decide—in an engaging and comprehensible manner. Adorned with exact infographics, distinct icons, and tailored image placeholders, it demystifies roles and responsibilities within decision-making processes. Perfectly calibrated for Powerpoint, Keynote, or Google Slides. An invaluable tool for project managers, business leaders, or any team seeking clarity in its decision-making process. Engage, clarify, and execute with precision.


6 diapositivas
Innovative Idea Pitching Guide Presentation
Present your ideas with clarity using the Innovative Idea Pitching Guide Presentation. This dynamic five-step circular flow design is perfect for showcasing pitch stages, idea development, or startup concepts. Each section includes icons and text blocks to clearly explain key points, keeping your message organized and impactful. Fully editable in Canva, PowerPoint, Keynote, and Google Slides.


6 diapositivas
Pattern-Based Layouts Using Geometry
Present your process, timeline, or flow with clarity using the Pattern-Based Layouts Using Geometry Presentation. This clean, step-by-step format uses bold numbered icons and curved geometric blocks to guide viewers through five key stages. Ideal for sequential content, strategies, or workflows. Easily customizable in PowerPoint, Keynote, and Google Slides.
5 diapositivas
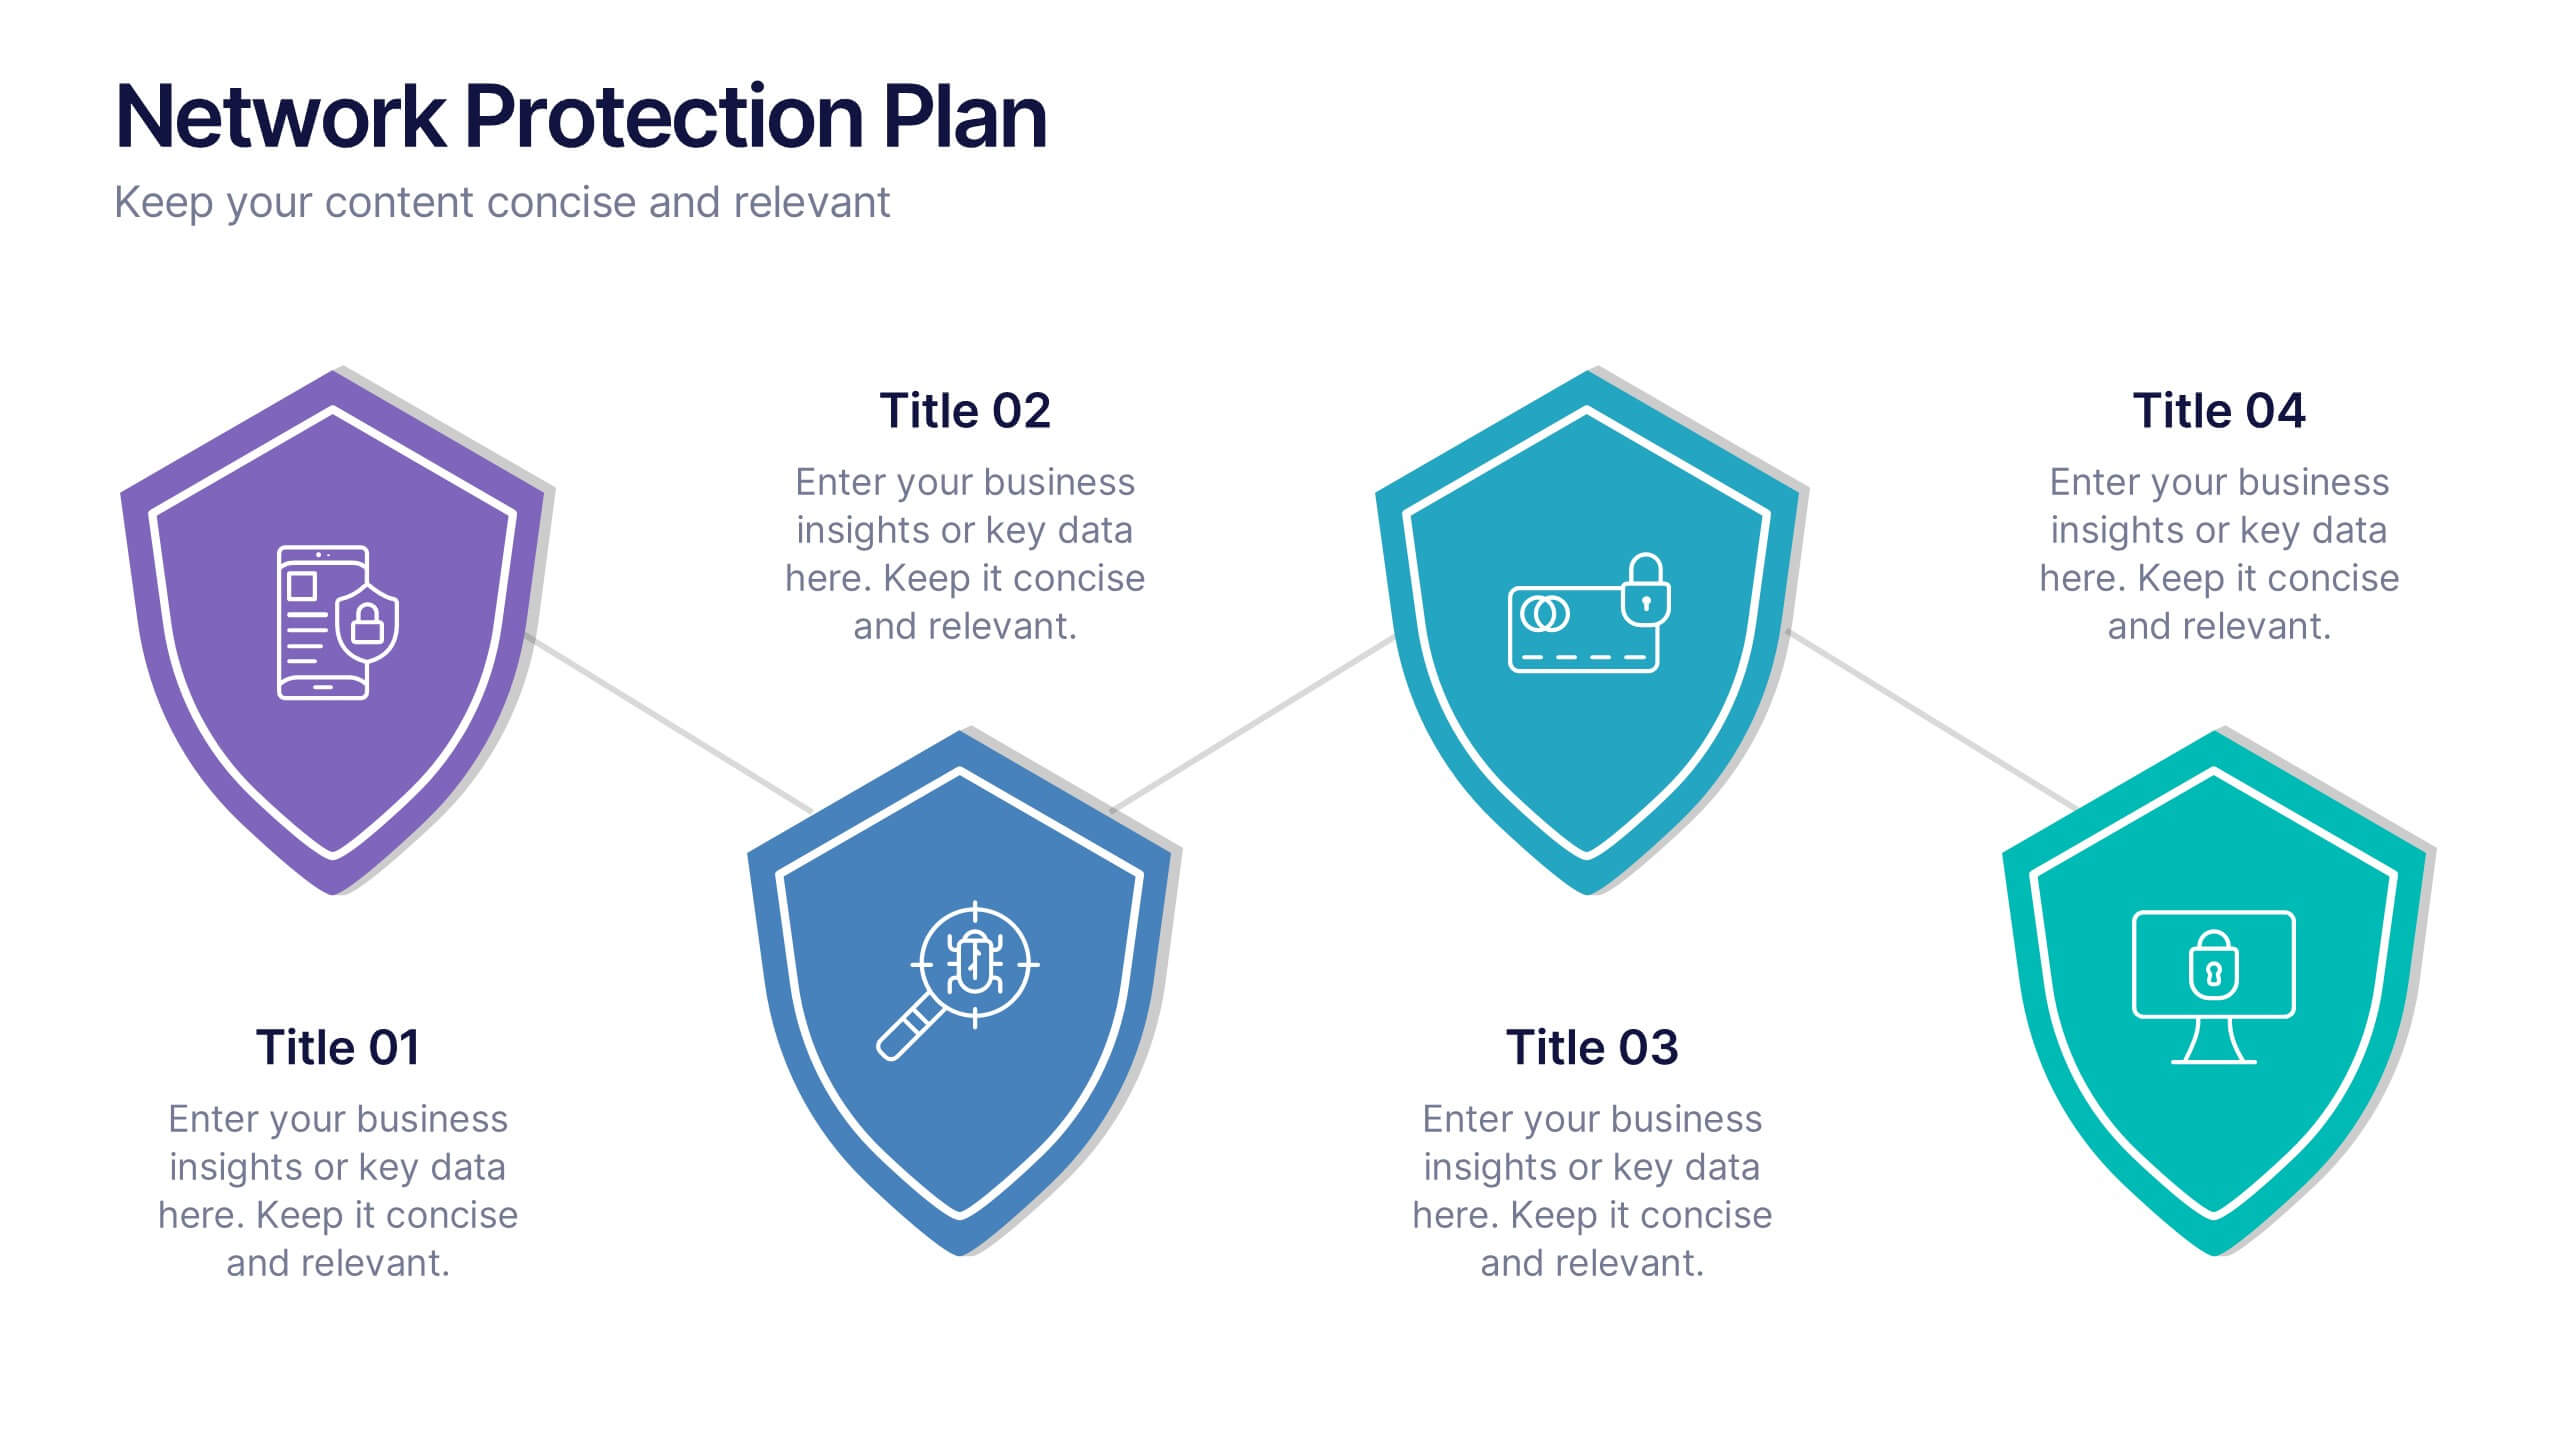
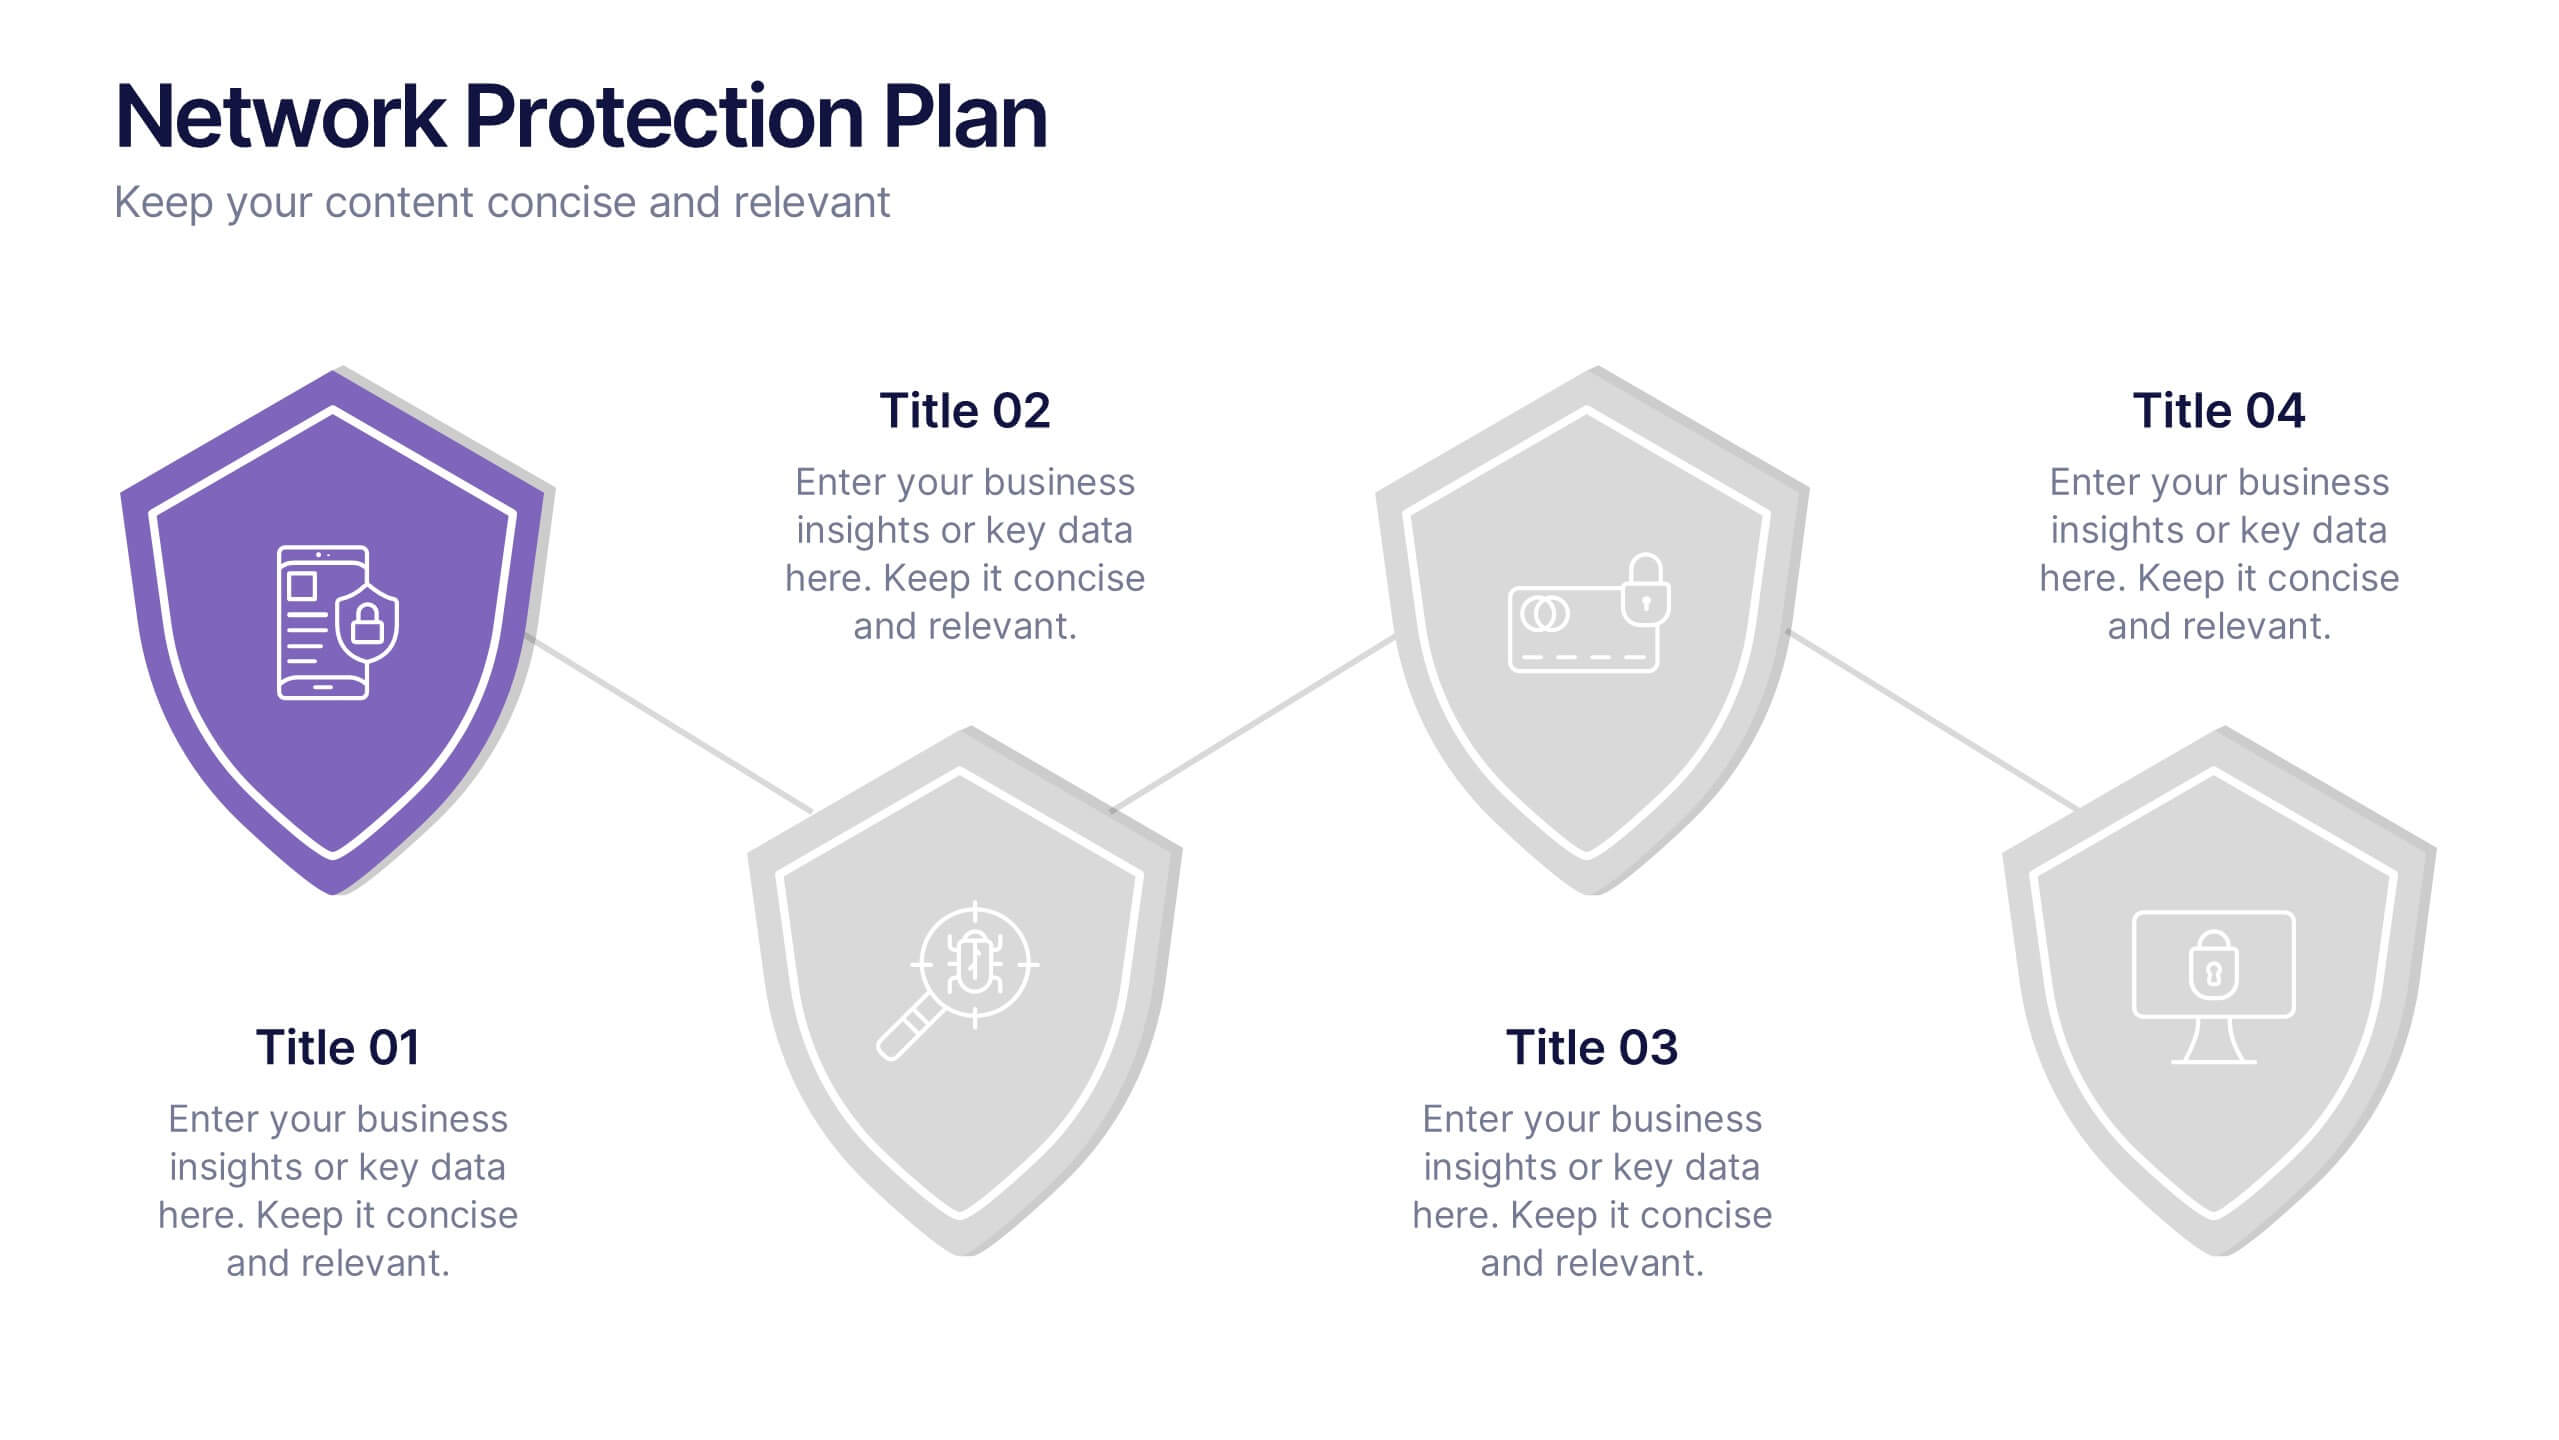
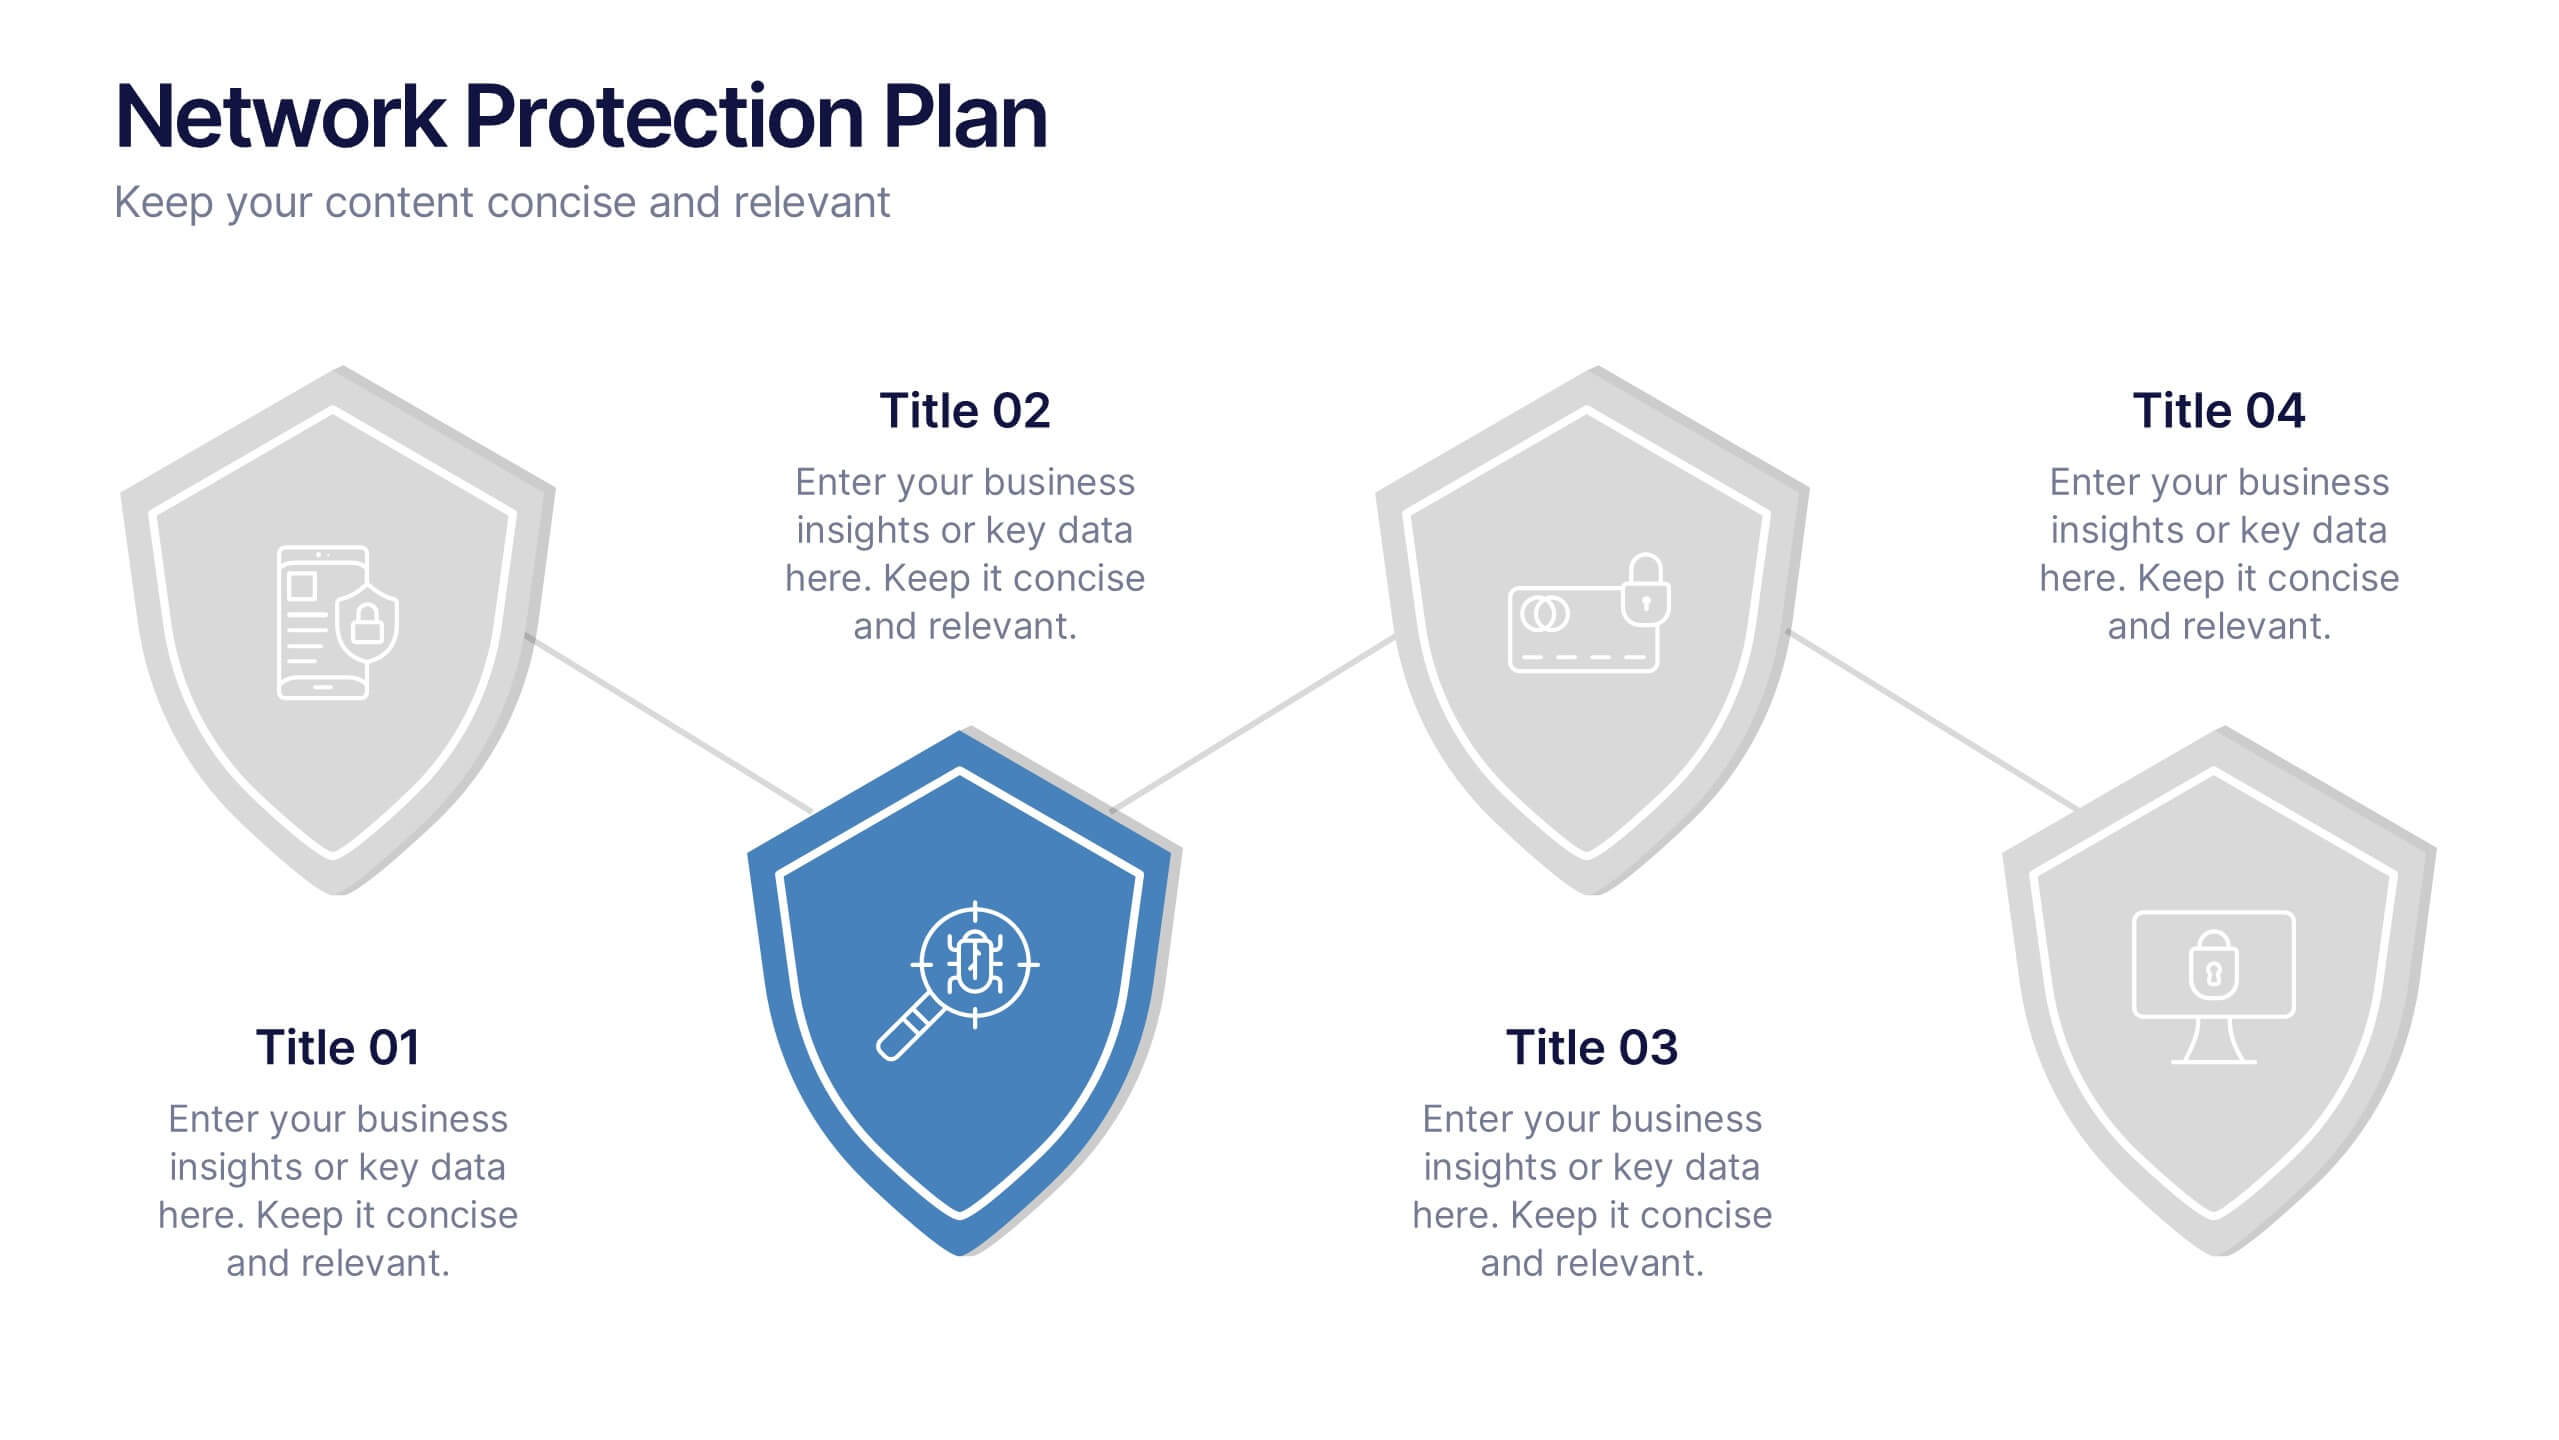
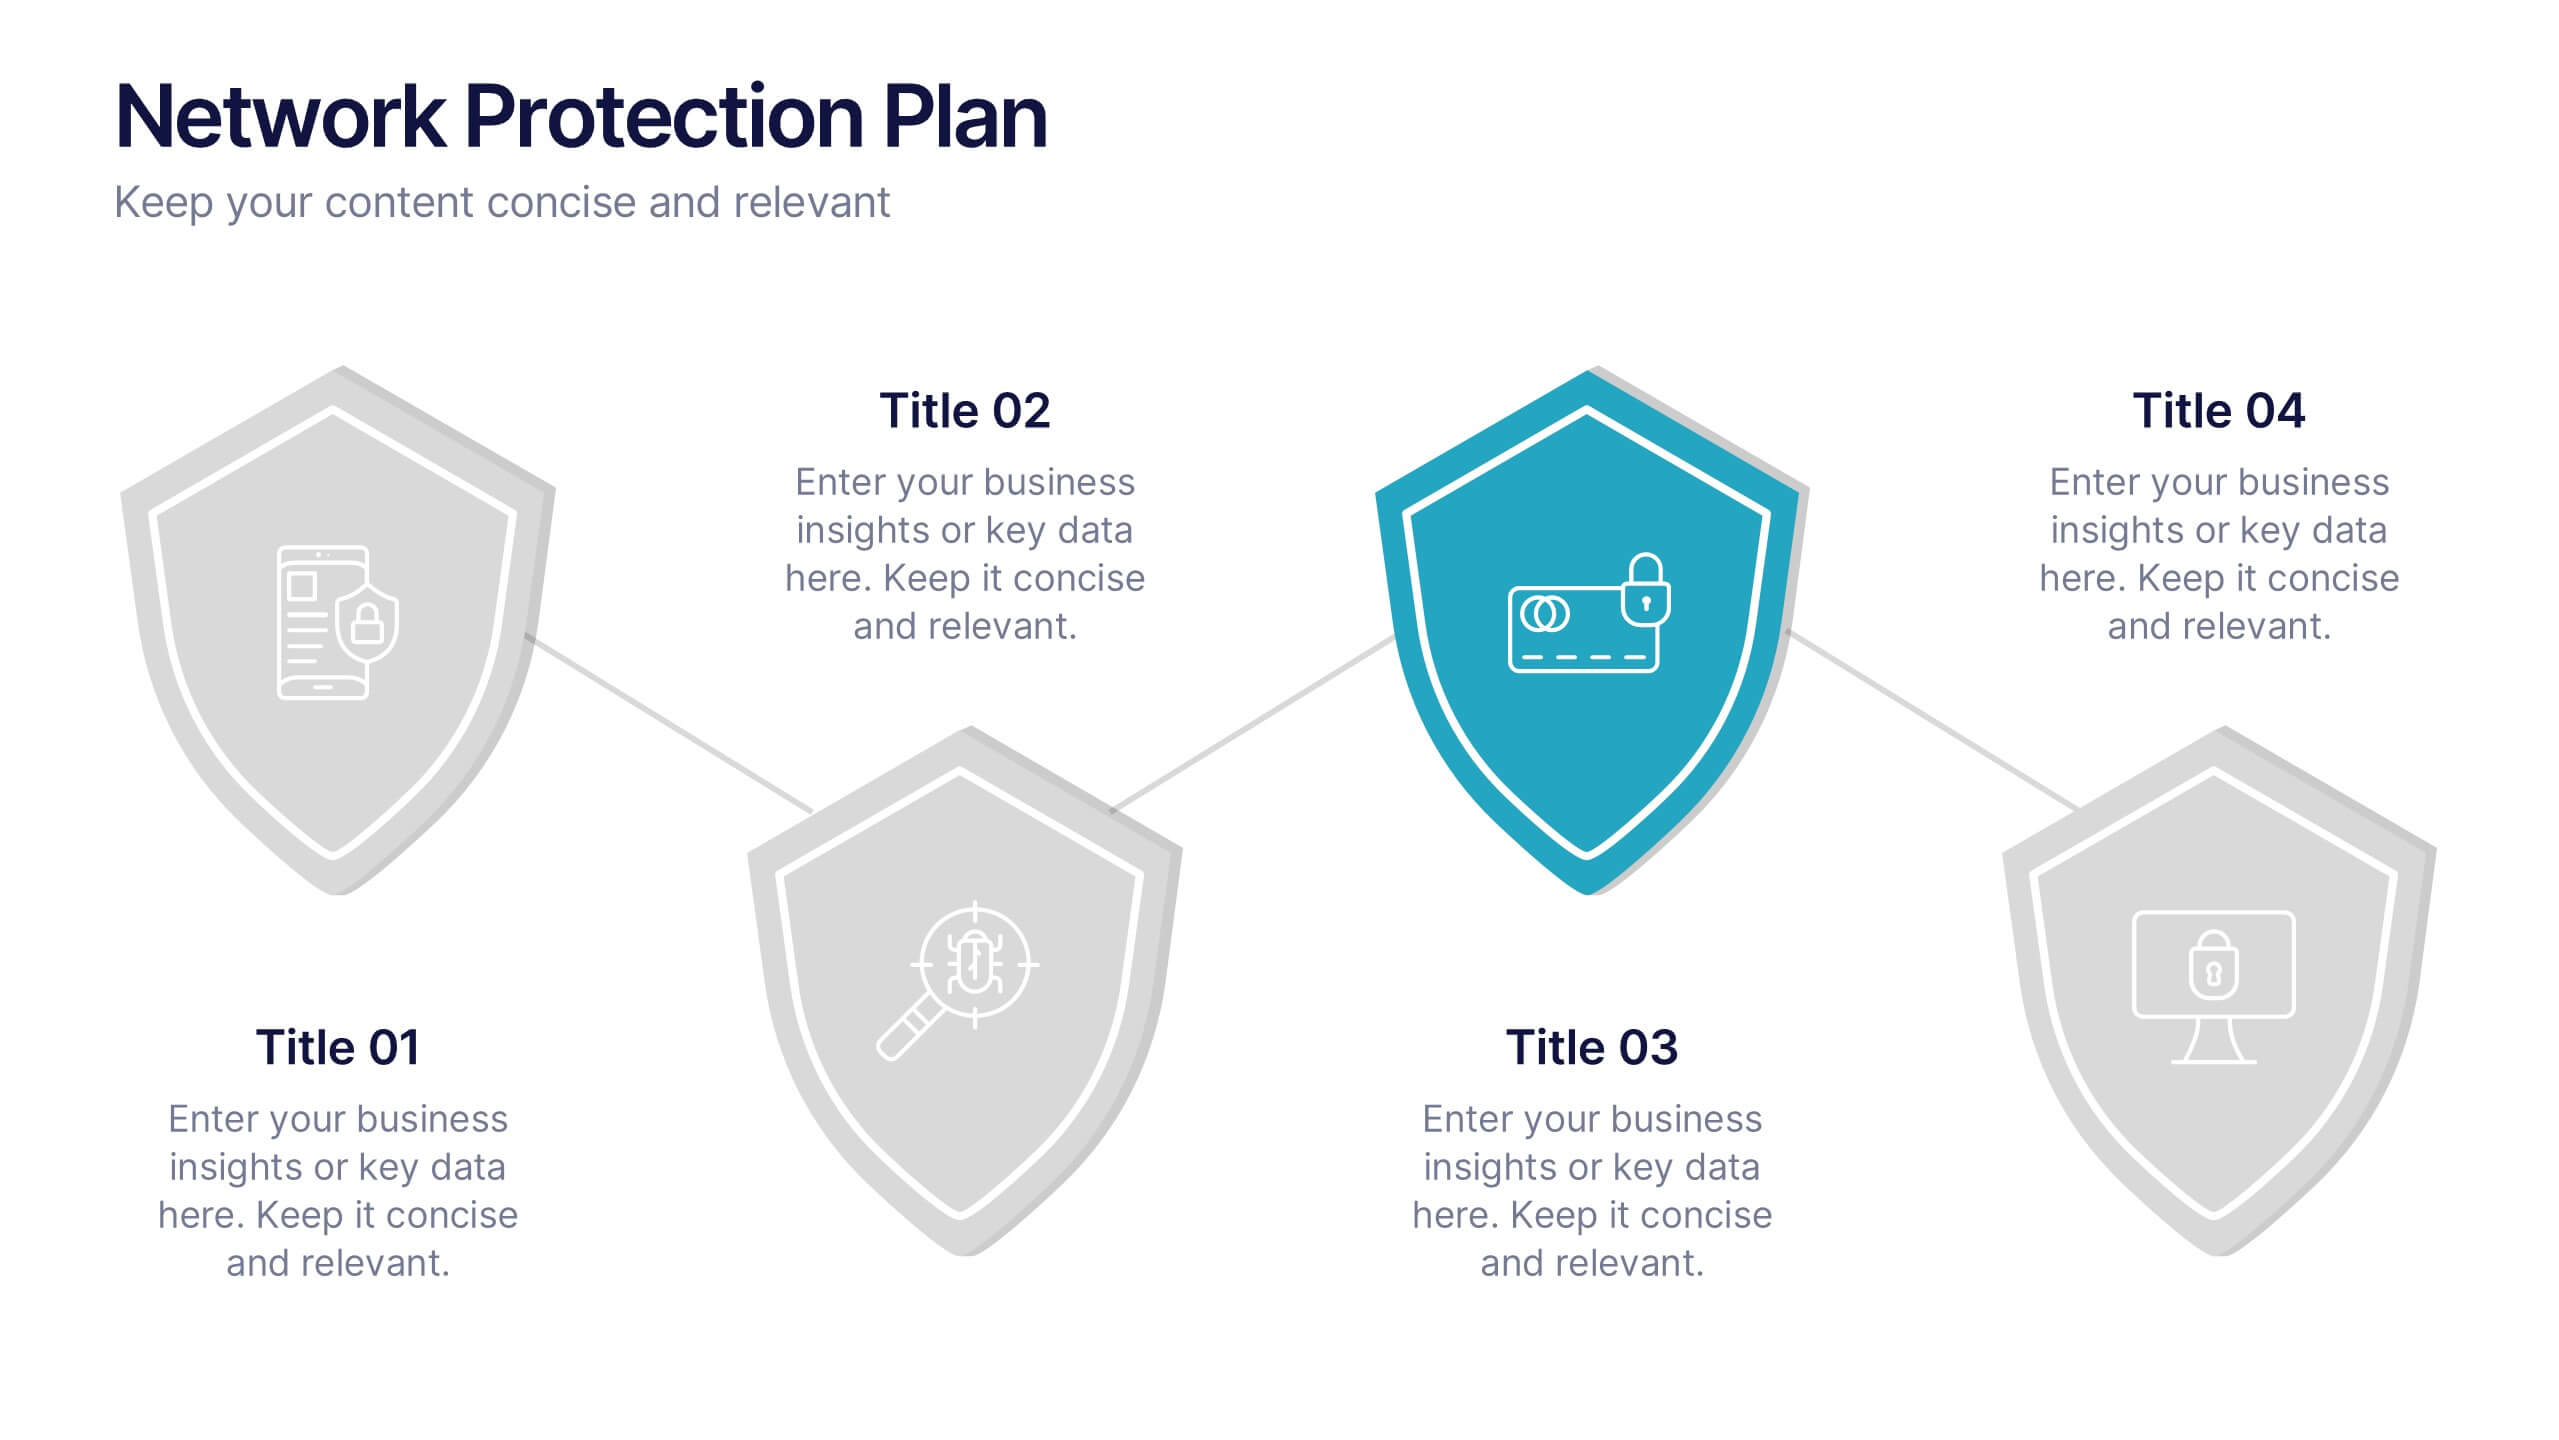
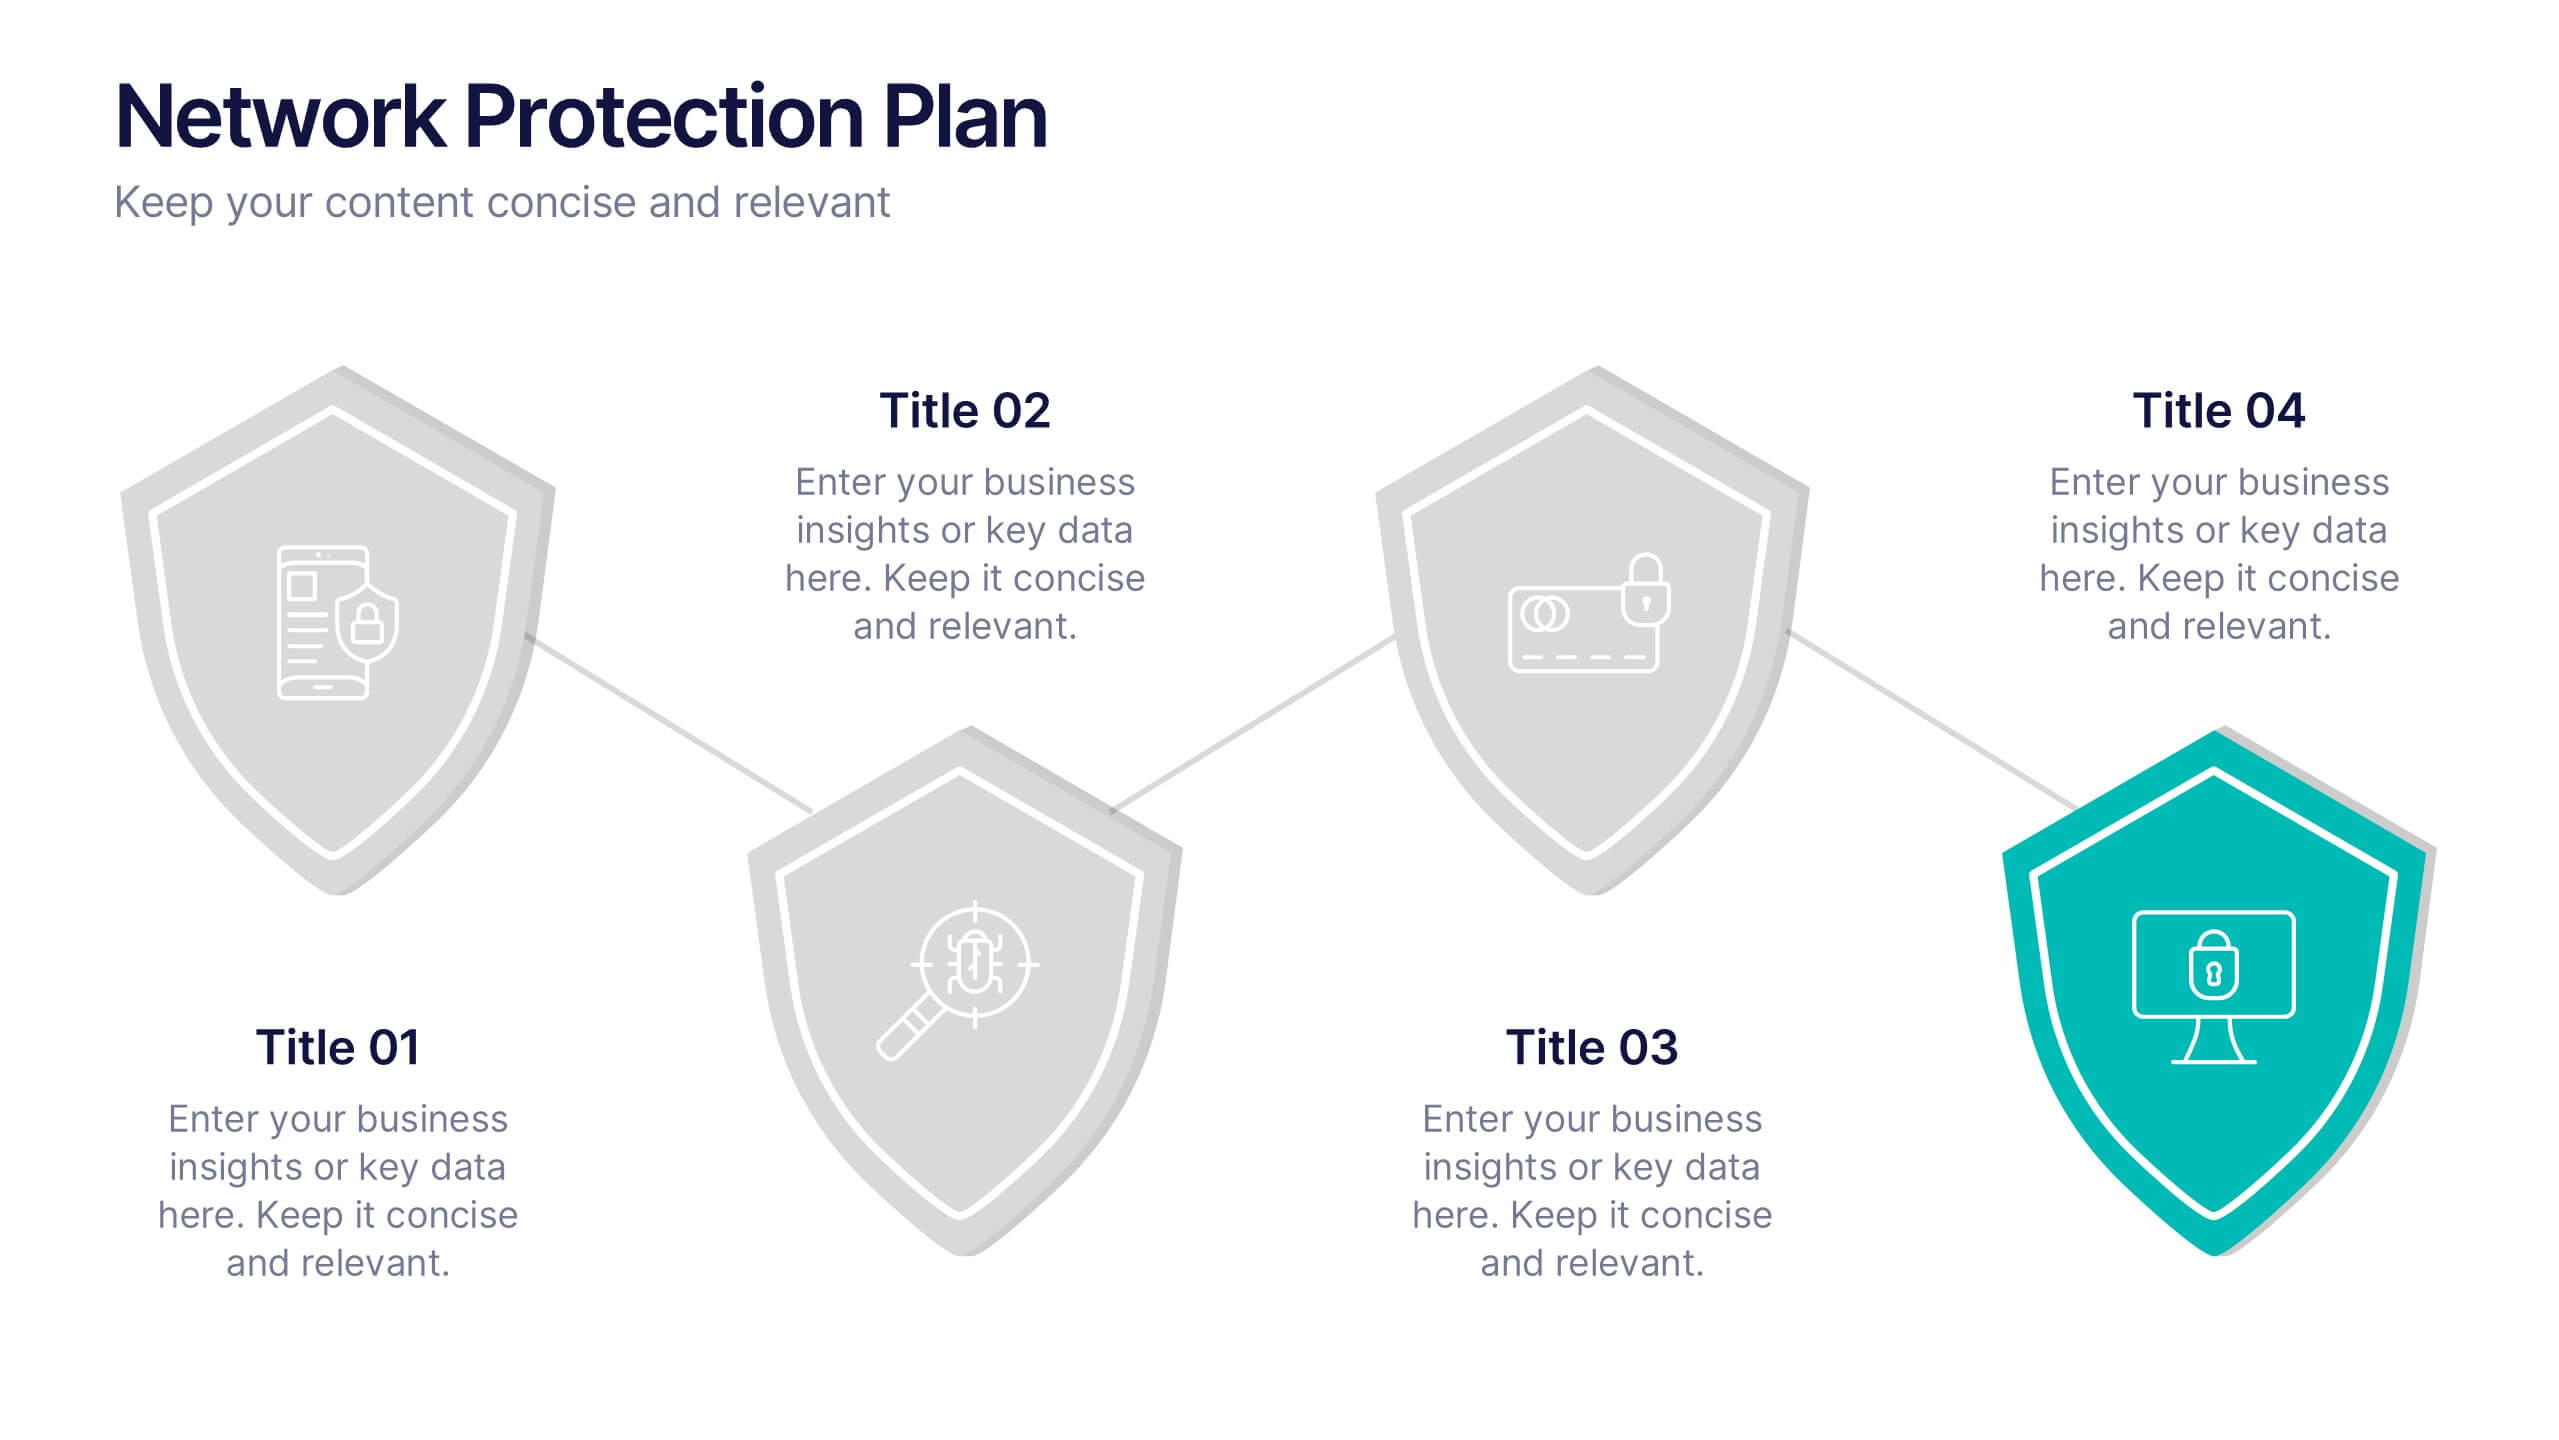
Network Protection Plan Presentation
Bold visuals and clean structure make this presentation a powerful way to communicate your protection strategy with clarity and confidence. It helps you break down key security stages, outline responsibilities, and show how each layer strengthens overall network resilience. Fully compatible with PowerPoint, Keynote, and Google Slides.


8 diapositivas
Project Execution Next Steps
Break down your implementation plan with this visually engaging 3D layered funnel infographic. Ideal for showcasing four key stages in project delivery, each step is color-coded and paired with icons and descriptive text. Great for status updates, strategy meetings, or team briefings. Fully customizable in PowerPoint, Keynote, and Google Slides.


7 diapositivas
Objective Statement Infographic
An objective is a specific and measurable goal or target that an individual, team, or organization aims to achieve within a defined period. This infographic template serves as a roadmap, guiding actions and decisions toward a desired outcome. Our objective statement infographic isn't just a canvas; it's a launchpad for your goals and aspirations. Fully customizable and compatible with Powerpoint, Keynote, and Google Slides. This infographic is bold, vibrant, and strategically designed, this will propel your objectives into the spotlight, ensuring clarity and resonance for your audience.


4 diapositivas
Project Planning in Four Steps Presentation
Streamline your workflow with the Project Planning in Four Steps presentation. This structured slide layout simplifies task organization, milestone tracking, and goal-setting into a clear, four-step process. Perfect for business strategies, project management, and team collaboration. Fully customizable and compatible with PowerPoint, Keynote, and Google Slides for effortless integration.


4 diapositivas
Task Automation Workflow Presentation
Streamline your operations with the Task Automation Workflow template, designed to visualize automated processes and optimize efficiency. Perfect for project managers and teams, this template helps clarify task dependencies, process flows, and automation impact. Fully customizable and compatible with PowerPoint, Keynote, and Google Slides for seamless workflow presentations.


8 diapositivas
Geographic South America Template Presentation
Explore your data through a clean, professional map that highlights key insights and regional details across South America. Ideal for presenting demographics, business distribution, or performance metrics, this design combines clarity with impact. Fully compatible with PowerPoint, Keynote, and Google Slides for easy editing and seamless presentation.


7 diapositivas
Stakeholder Strategy Infographic
Empower your organization's approach to its stakeholders with our stakeholder strategy infographic. Colored in a mix of vibrant orange, crisp white, and bold red, this infographic not only informs but also captures attention. Ideal for business strategists, project managers, and team leaders, it visually dissects the intricate layers of stakeholder engagement and strategy. Its design includes specialized graphics, tailored icons, and strategic image placeholders to guide your storytelling. Whether you're presenting in PowerPoint, Keynote, or Google Slides, this template is your key to a well-orchestrated stakeholder communication.


10 diapositivas
Depth-Based Visual Charts in 3D Presentation
Elevate your data storytelling with the Depth-Based Visual Charts in 3D Presentation. This slide set transforms layered information into eye-catching 3D stack visuals—perfect for showcasing rankings, workflows, or strategic hierarchies. Fully editable in PowerPoint, Keynote, and Google Slides for seamless customization.