


Características


¿Tienes alguna pregunta?
Recomendar


12 diapositivas
Compliance and Policy Management Presentation
Visualize your compliance ecosystem with the Compliance and Policy Management Presentation. Designed around a planetary orbit concept, this slide maps core policies at the center with surrounding regulations and enforcement layers. Each orbit can represent levels of governance, department roles, or regulatory zones—making it ideal for risk teams, auditors, and legal advisors. Fully customizable in PowerPoint, Keynote, and Google Slides for seamless use.
8 diapositivas
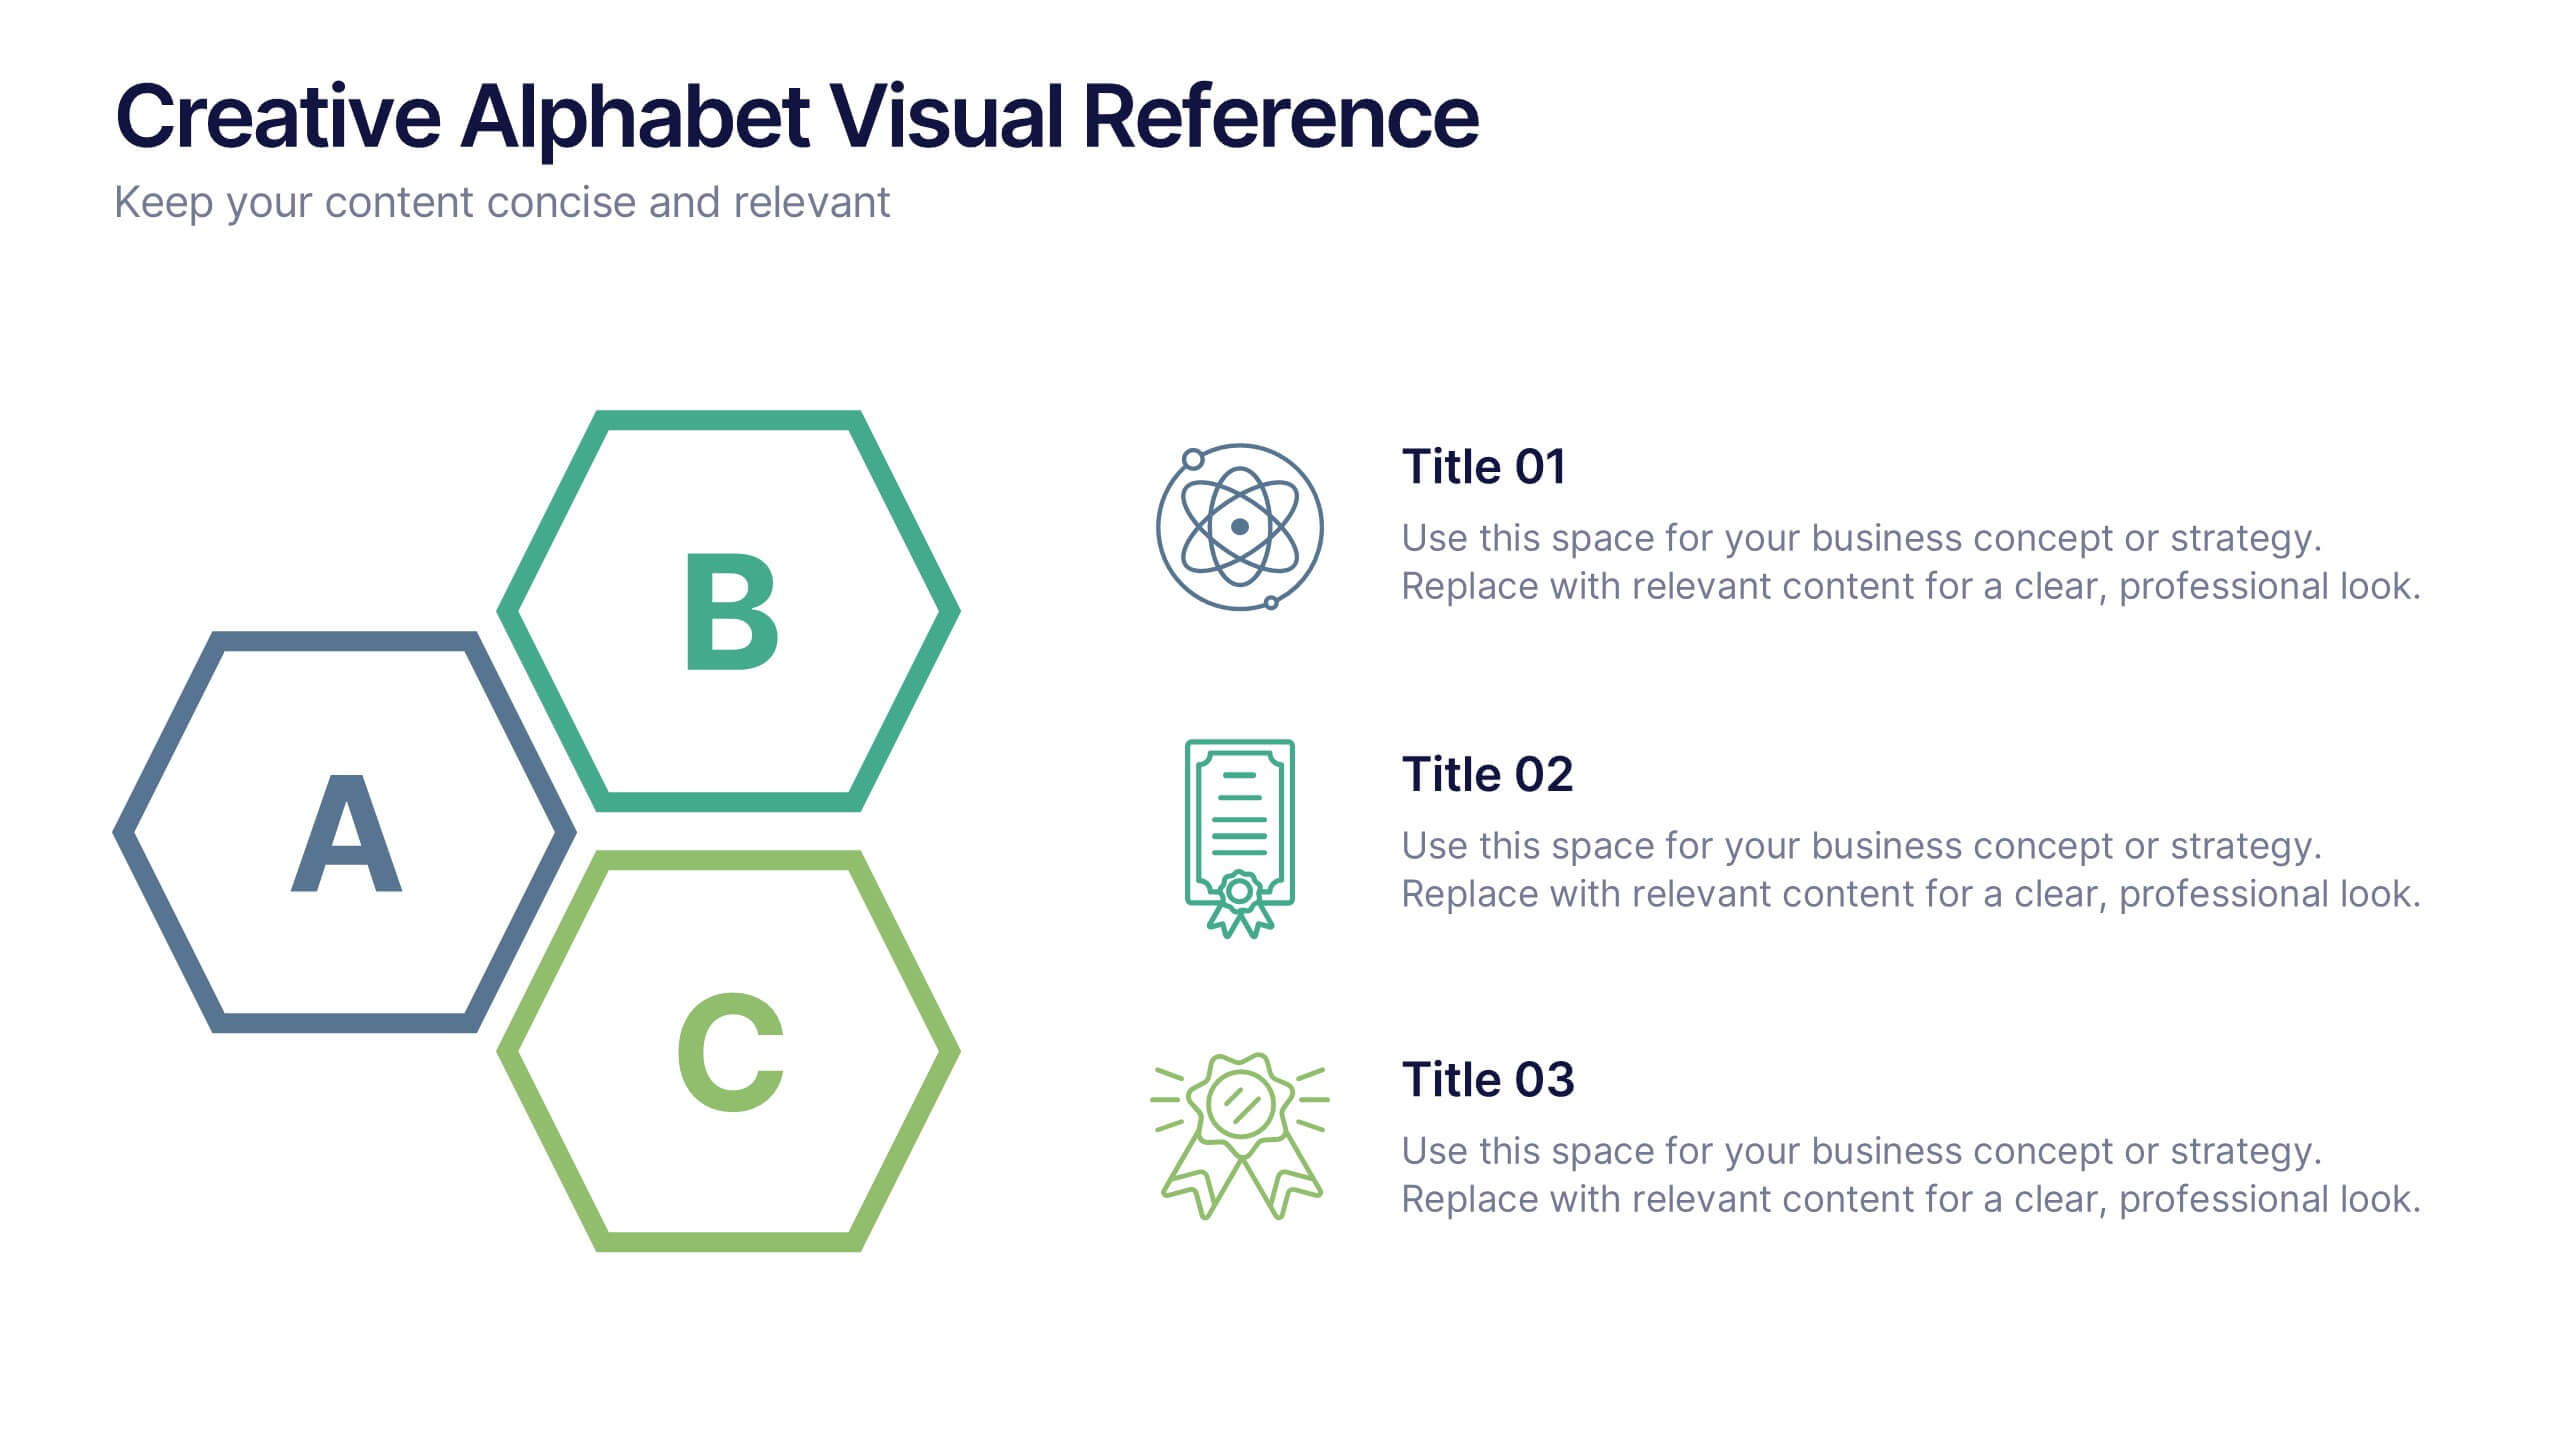
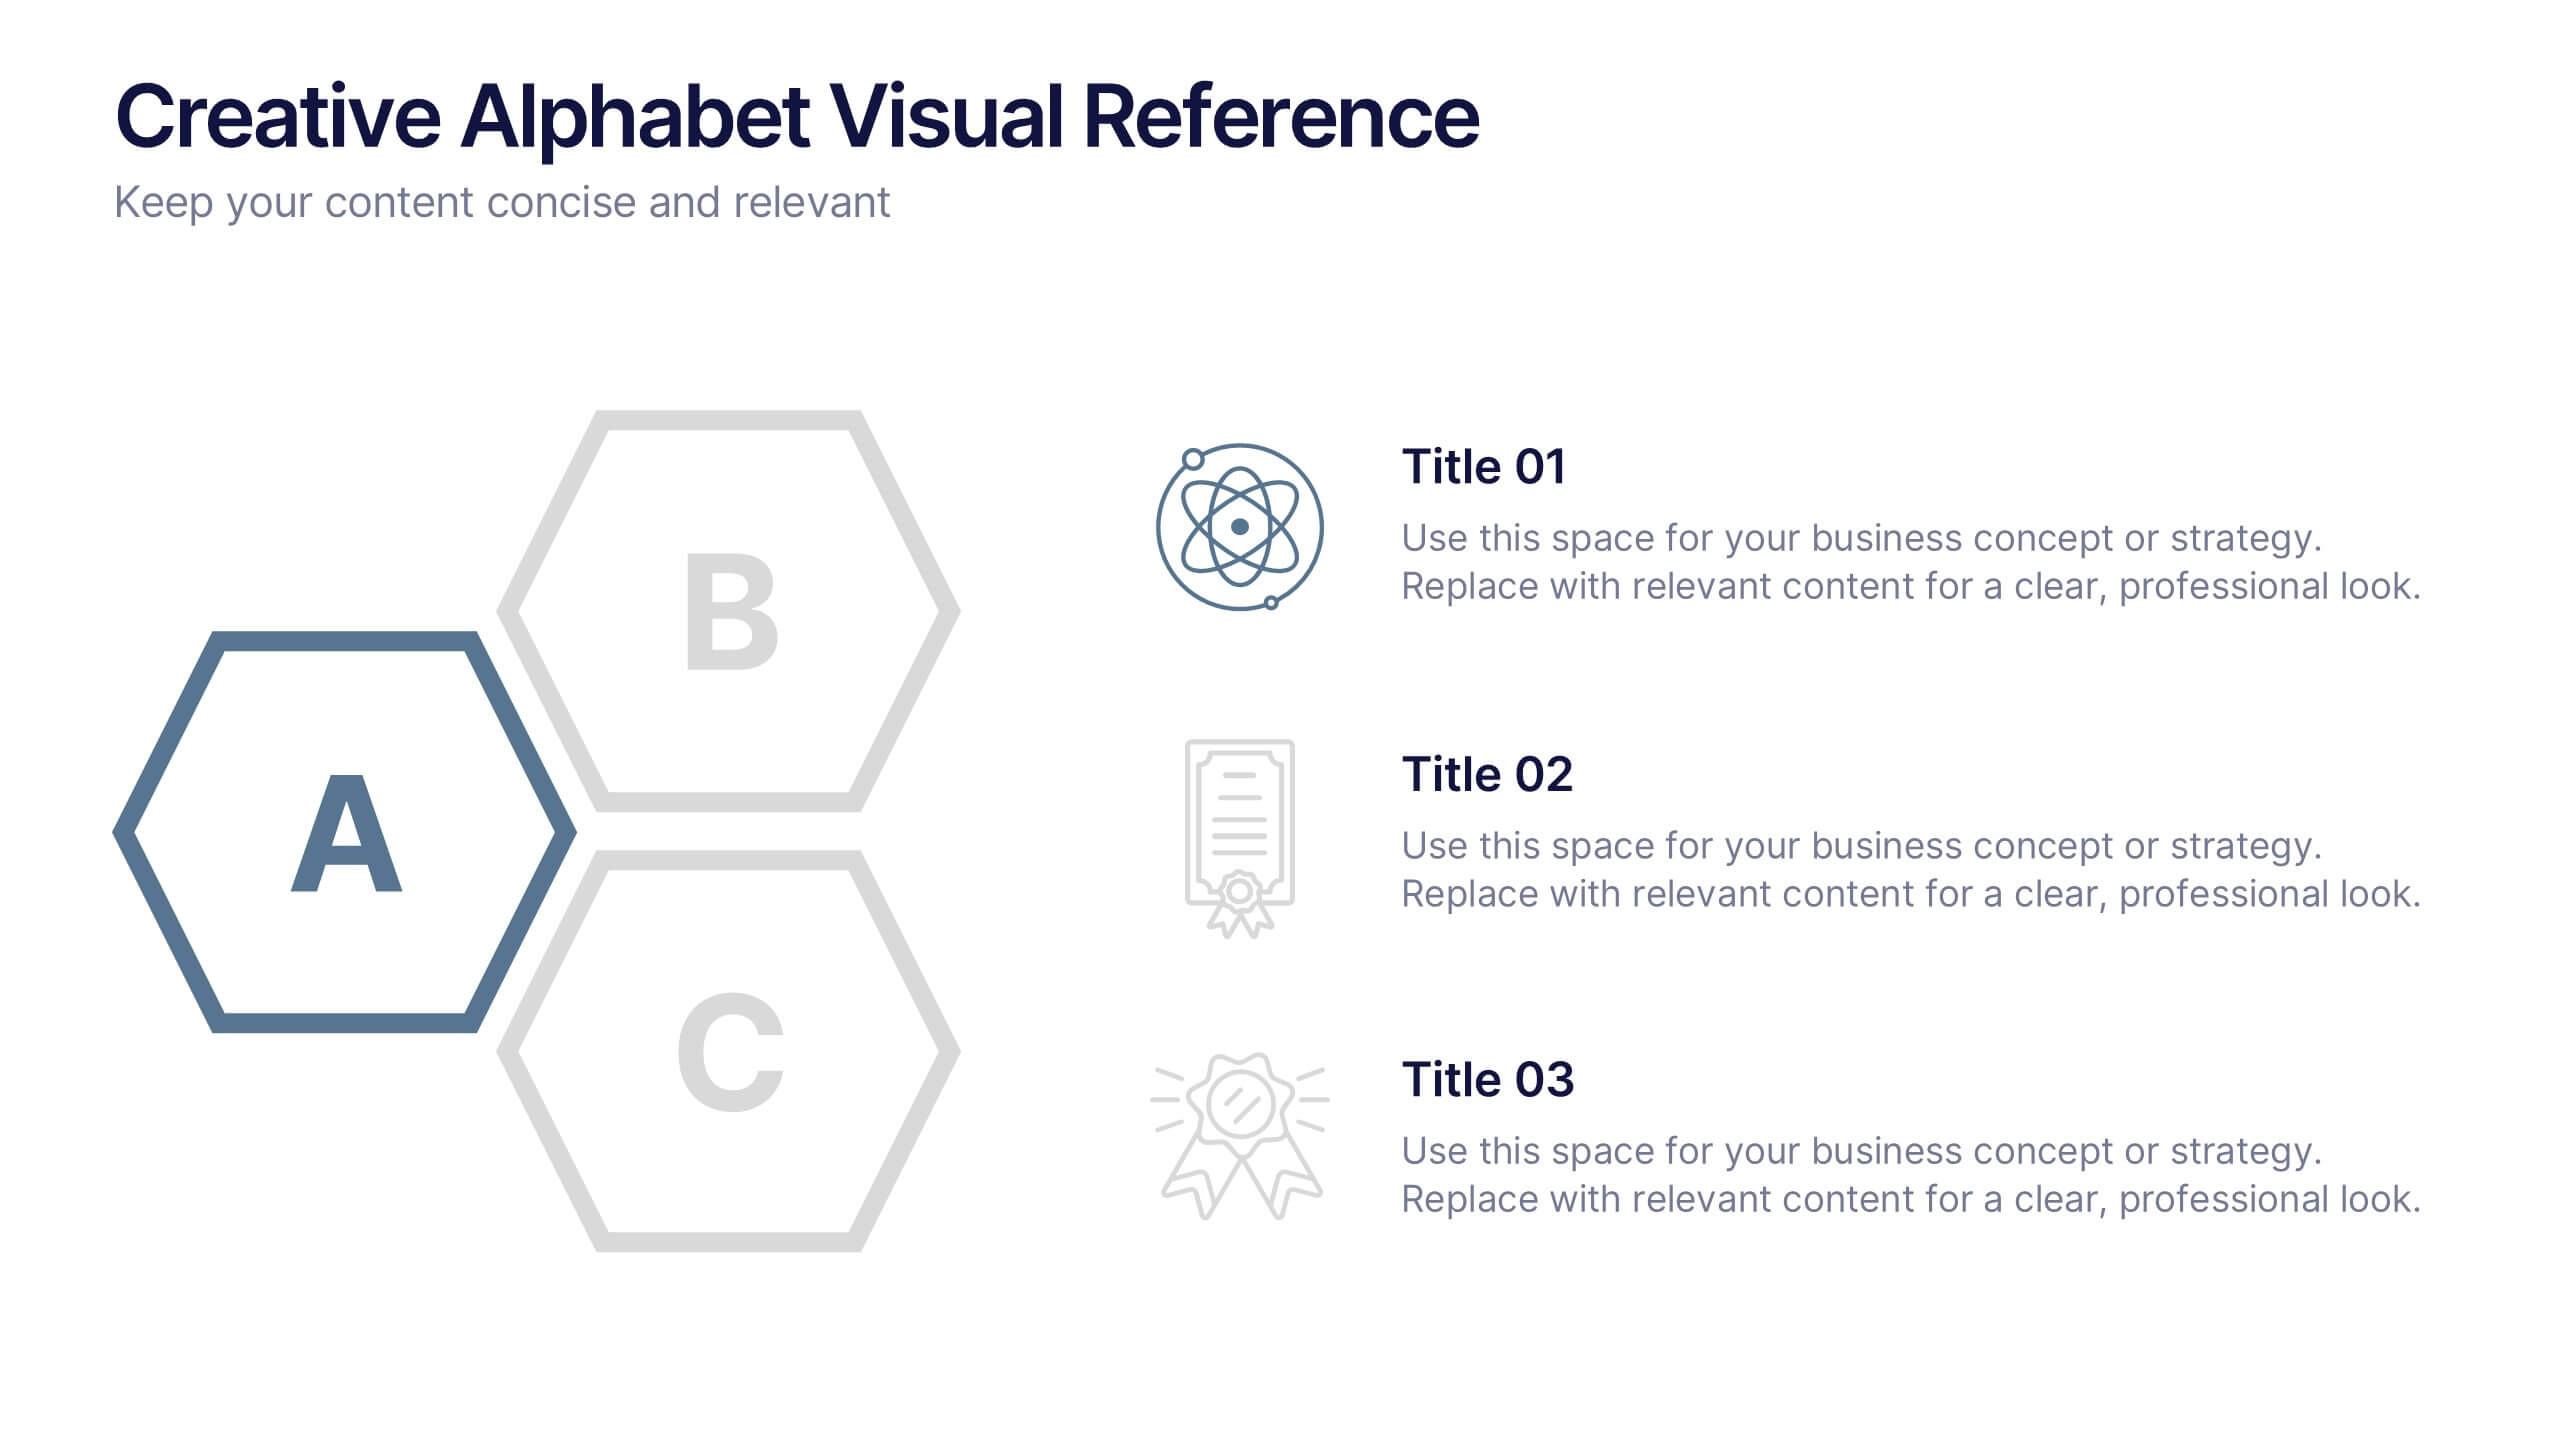
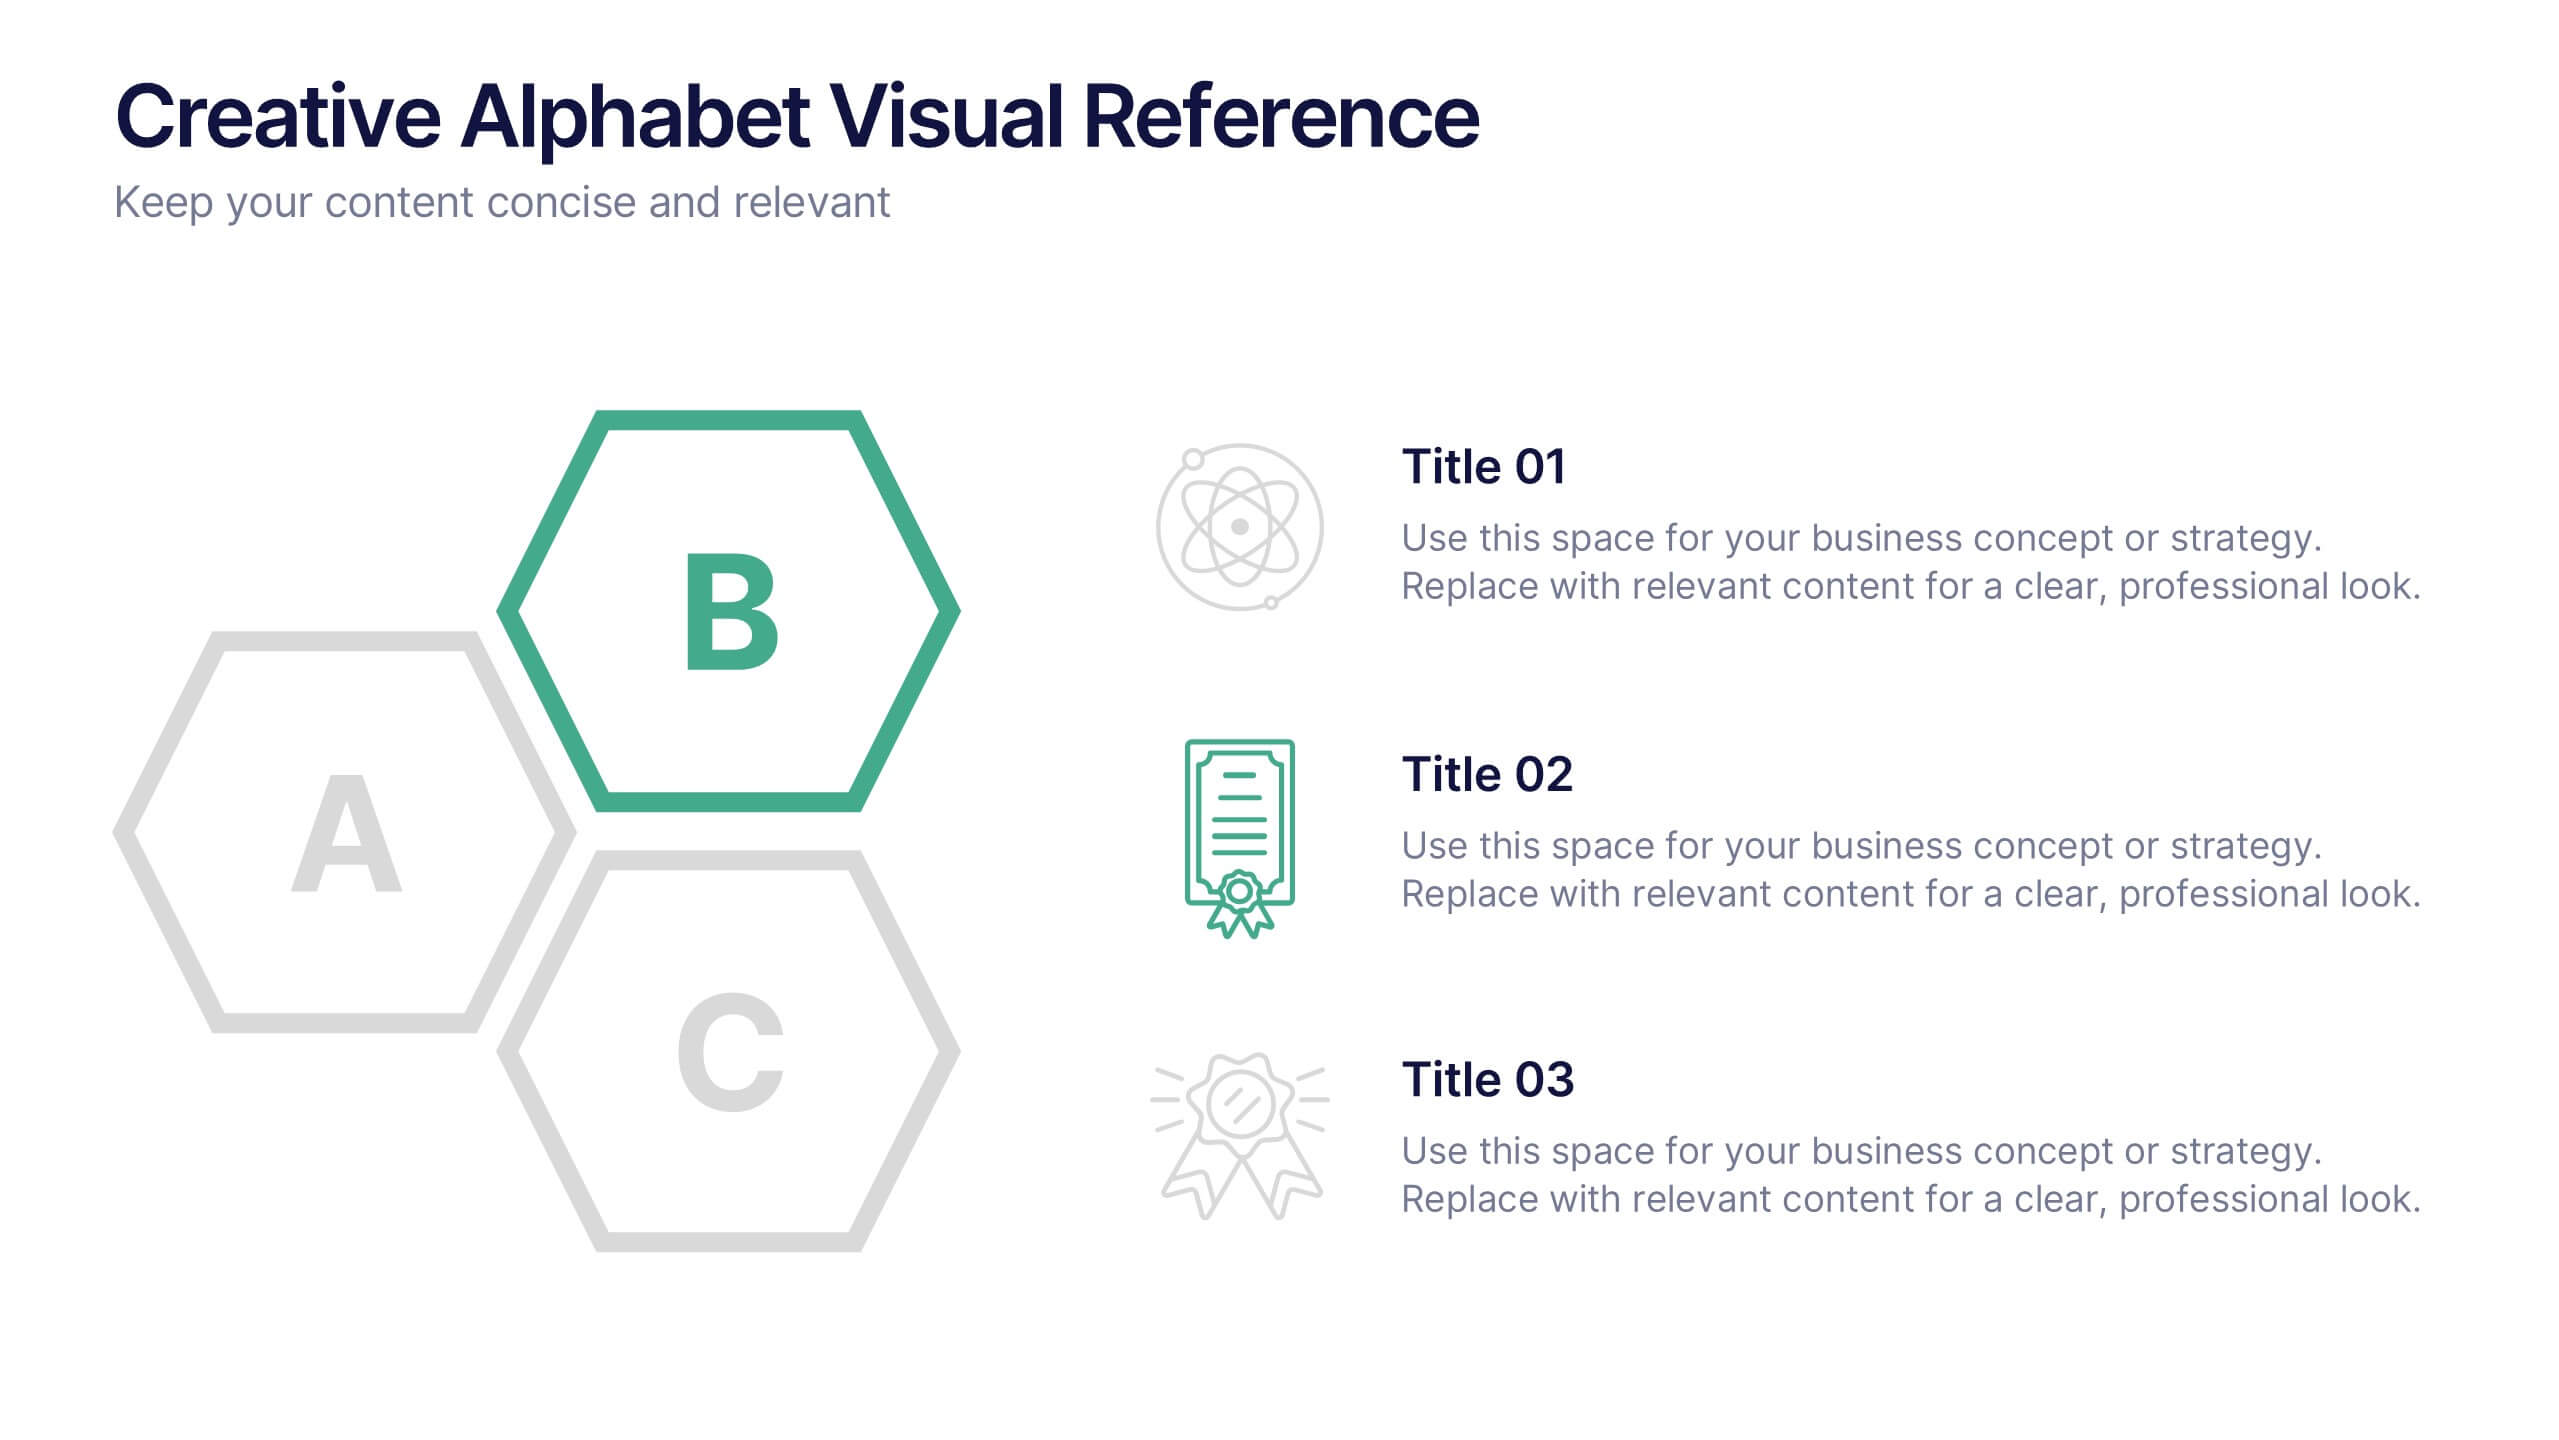
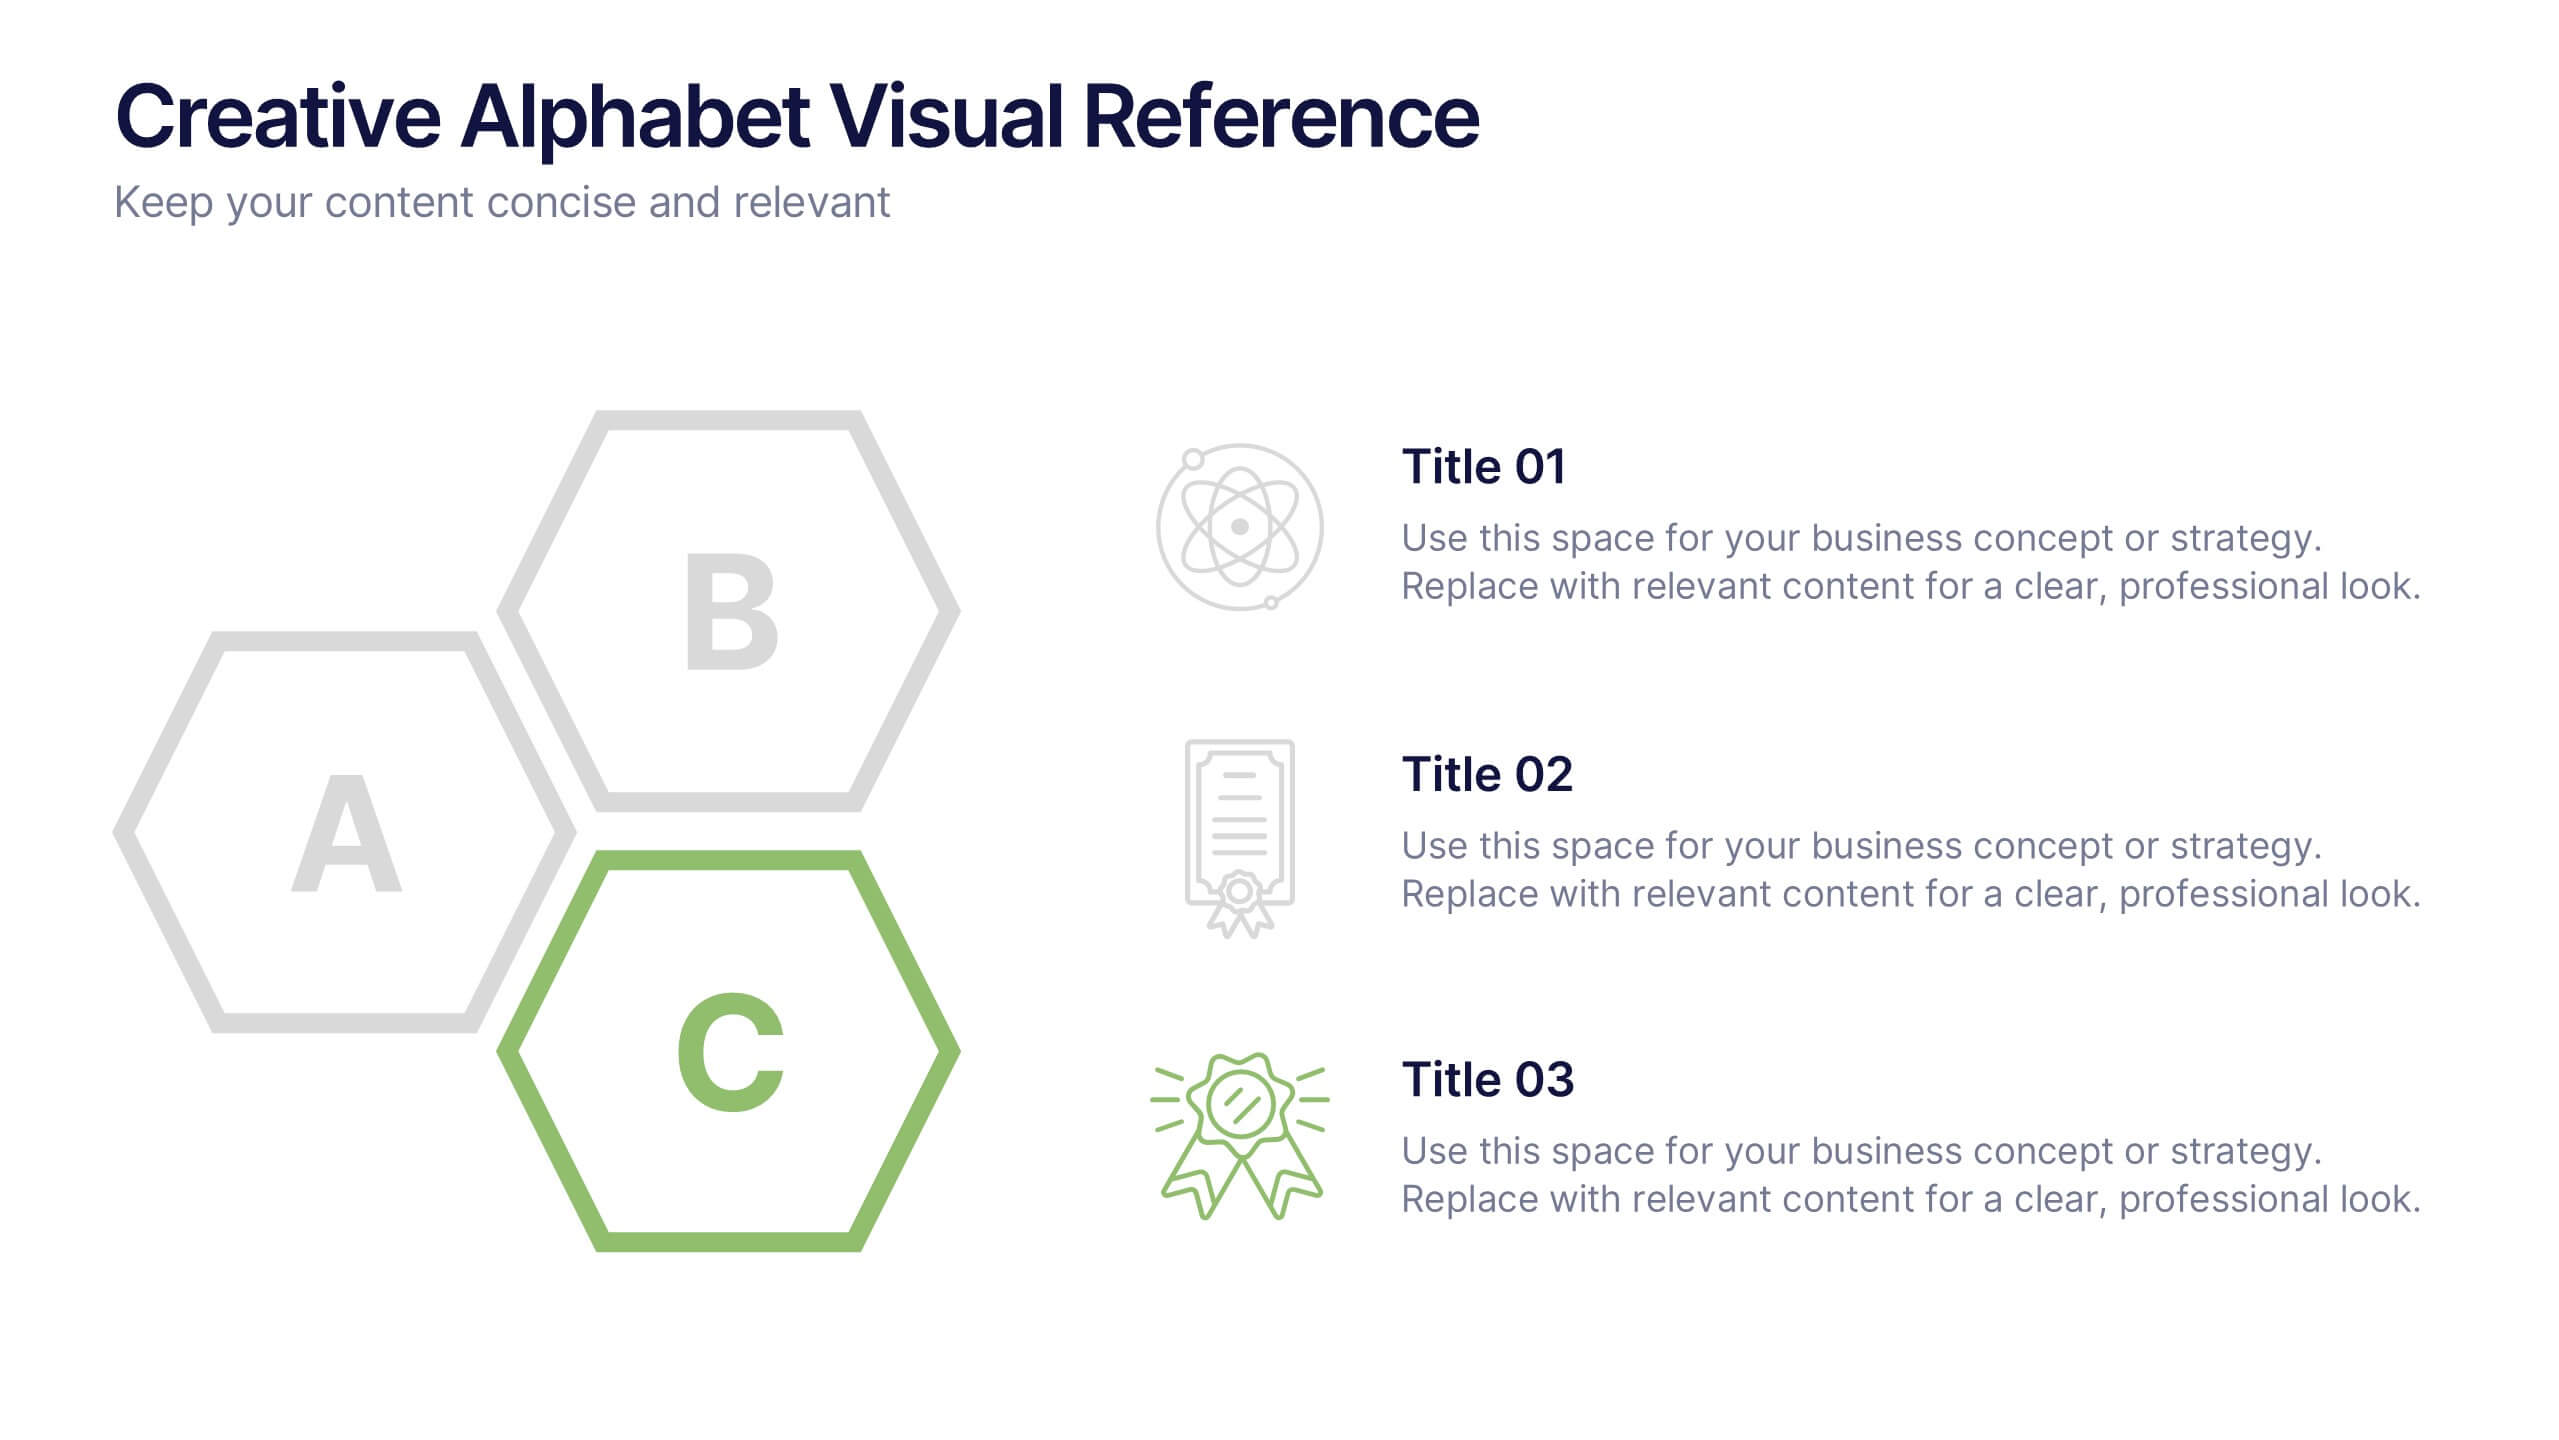
Creative Alphabet Visual Reference Presentation
This creative presentation uses a bold A–B–C visual structure to highlight key points in a clean, modern layout. Ideal for overviews, comparisons, or step-by-step frameworks. Fully customizable in Canva, it balances design and clarity—perfect for business strategies, education, or visual storytelling with strong alphabetical cues and icon integration.


6 diapositivas
Industry Analysis Porter's 5 Forces Presentation
Analyze industry competition with this Porter's Five Forces template! This structured layout visually breaks down key factors like buyer power, supplier influence, competitive rivalry, new market entrants, and substitution threats, making it ideal for strategic planning and market assessments. Fully customizable and compatible with PowerPoint, Keynote, and Google Slides.


7 diapositivas
Business Puzzle Infographic Presentation
A Puzzle Piece Infographic is great for visualizing and communicating complex topics, such as the order of steps to solve a problem or a methodical process. This template is great if you want to show your audience how different topics relate to each other, or if you want to illustrate how information fits together. This infographic will allow you to showcase your data and information in a fun, visual way. The puzzle design will help you organize information for your audience to easily understand. This template is compatible with Powerpoint, keynote and google slides, making it easy to edit!


5 diapositivas
Flow Chart for Decision Trees
Clarify complex decisions with the Flow Chart for Decision Trees Presentation. This layout uses a vertical tree design with branching logic paths, making it perfect for outlining strategic choices, workflows, or evaluation criteria. Featuring five customizable sections with icon support and placeholder text, this template works seamlessly in PowerPoint, Keynote, and Google Slides.


4 diapositivas
Medical Research and Healthcare Trends Presentation
Stay ahead in the healthcare industry with the Medical Research and Healthcare Trends Presentation template. This structured layout highlights key statistics, research insights, and emerging trends in the medical field. Ideal for healthcare professionals, analysts, and policymakers, this fully customizable template is compatible with PowerPoint, Keynote, and Google Slides.


20 diapositivas
Symphonix Marketing Campaign Presentation
The Marketing Campaign Presentation Template is designed for impactful storytelling and strategy. With 20 vibrant, customizable slides, it covers key topics like consumer behavior, emerging trends, data-driven strategies, and sustainability. Perfect for marketers and agencies, it’s fully compatible with PowerPoint, Keynote, and Google Slides for seamless presentations.


6 diapositivas
Project Summary and Final Thoughts Presentation
Wrap up your presentation with clarity using the Project Summary and Final Thoughts Presentation. This clean, structured layout helps you highlight key milestones, insights, and takeaways across six points—perfect for recapping project goals and outcomes. Fully customizable and compatible with PowerPoint, Keynote, and Google Slides.


20 diapositivas
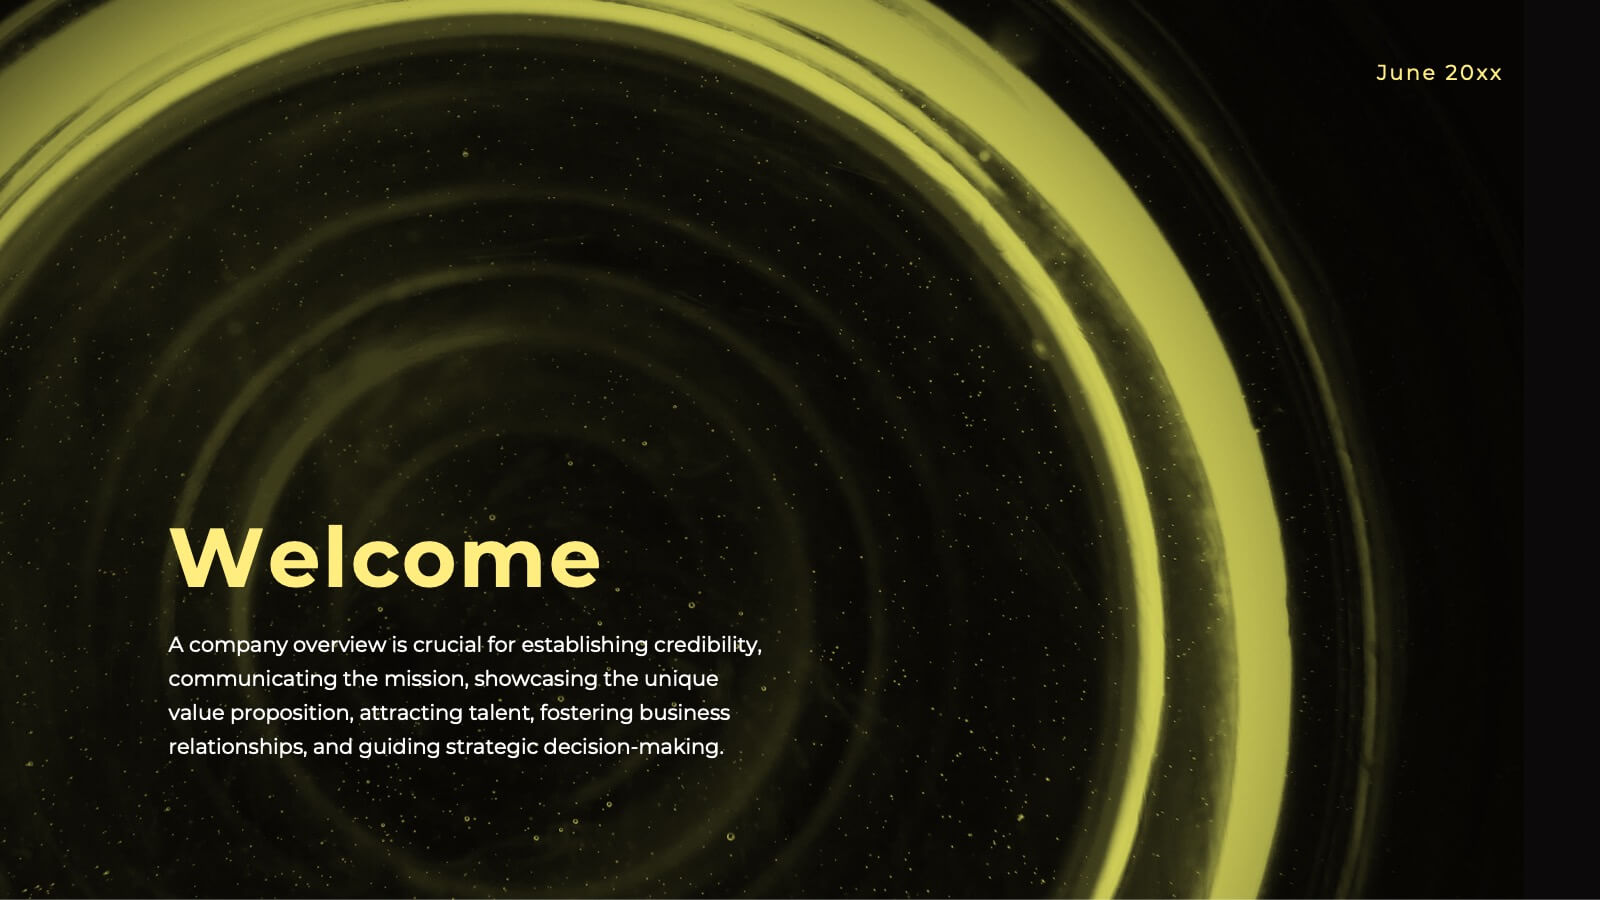
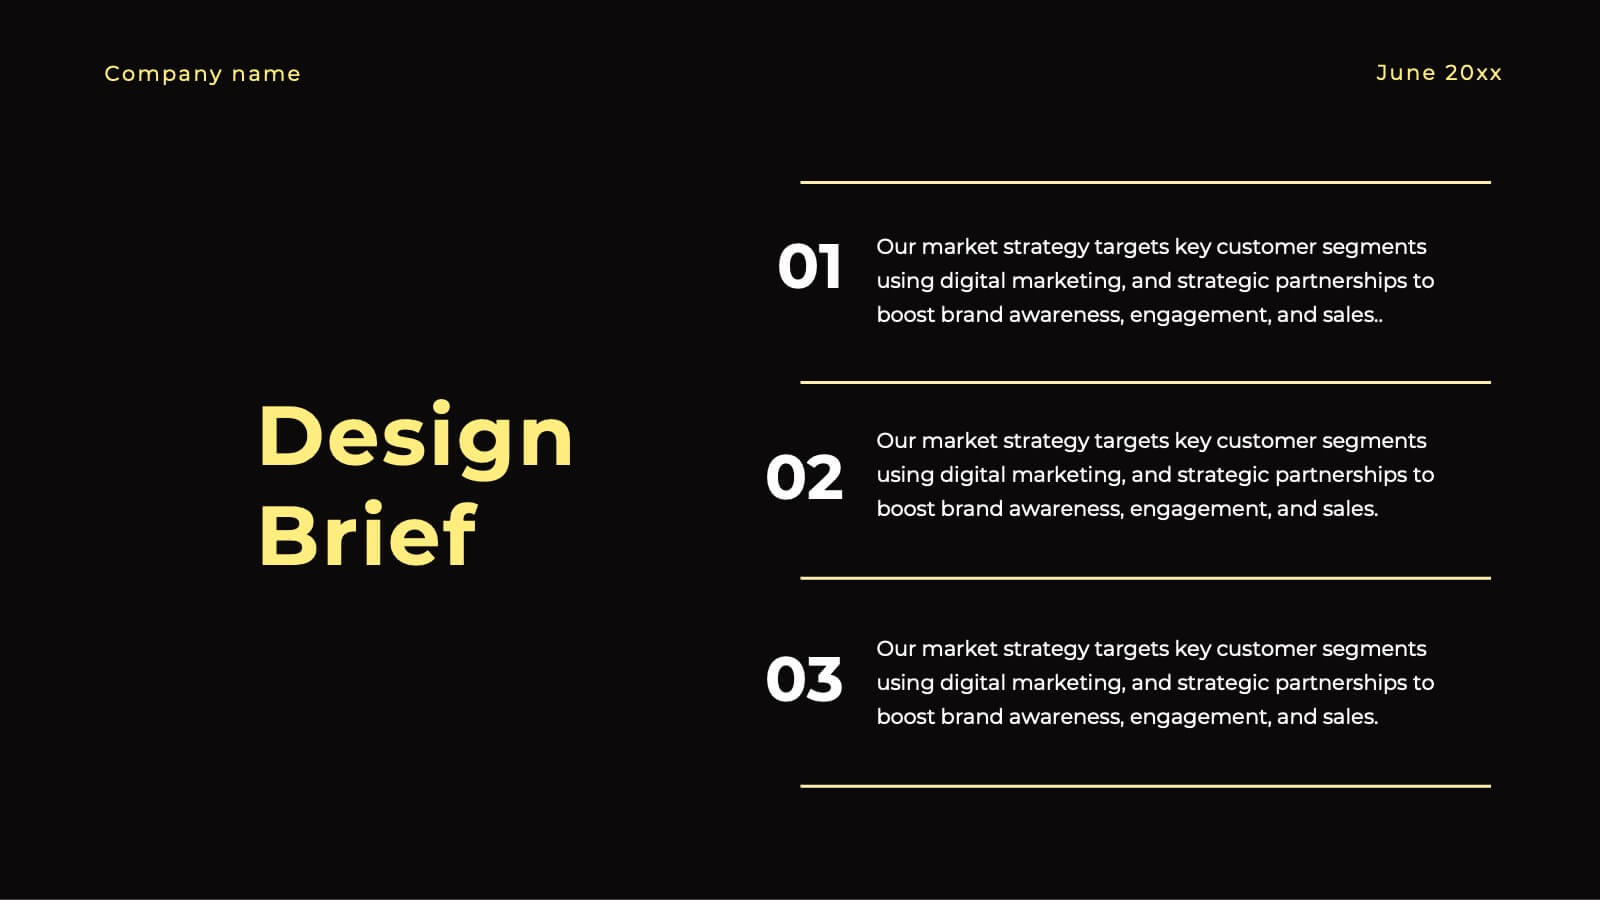
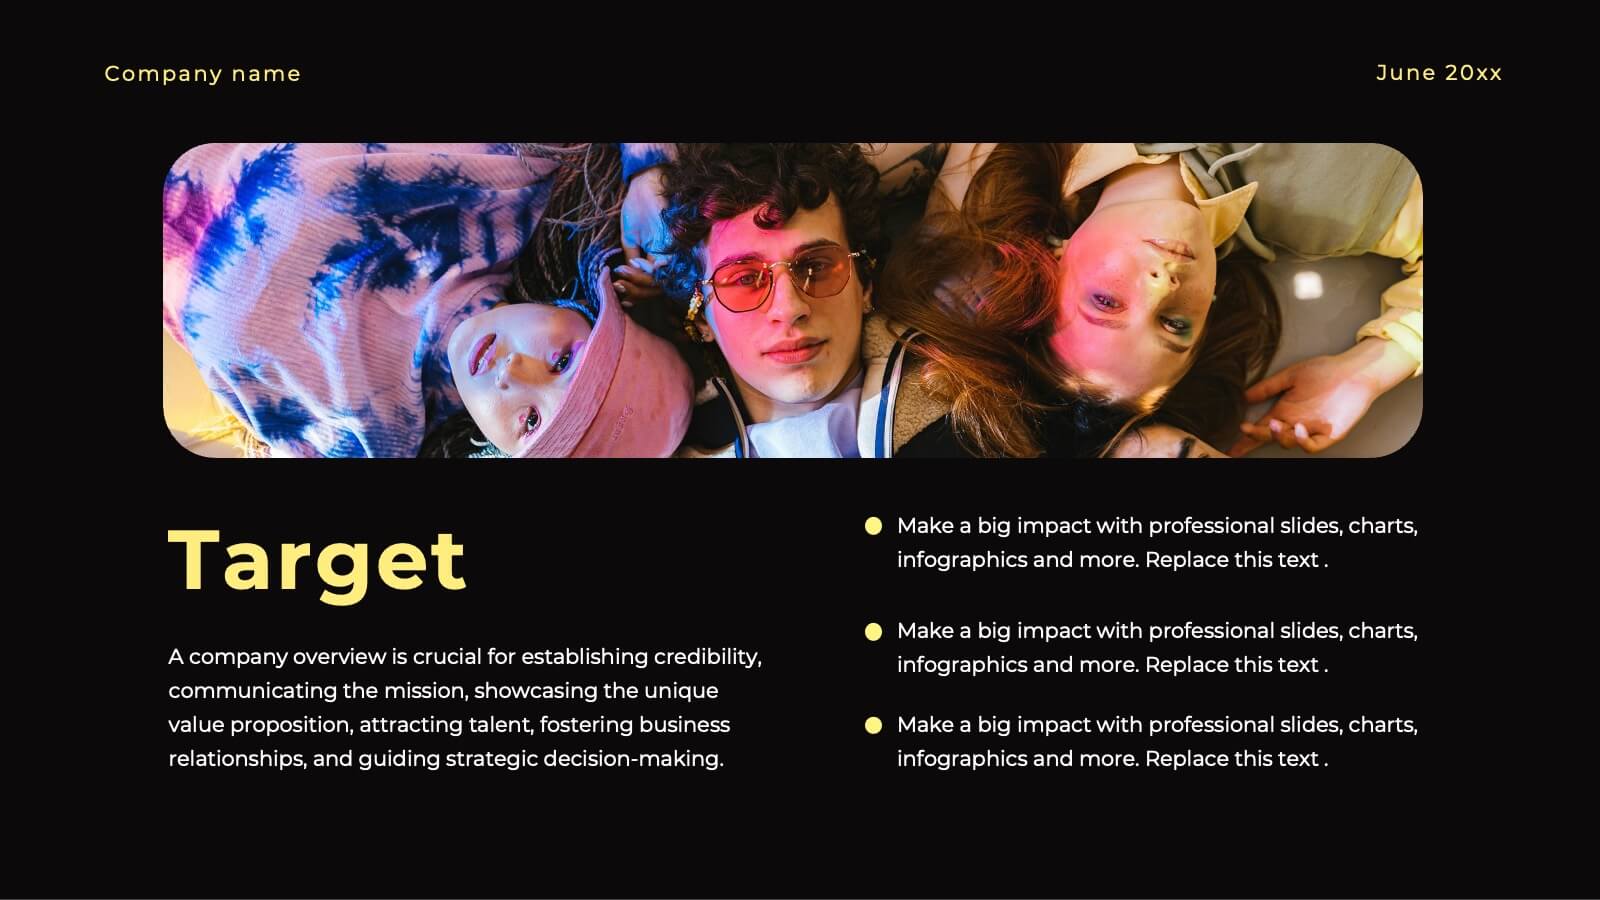
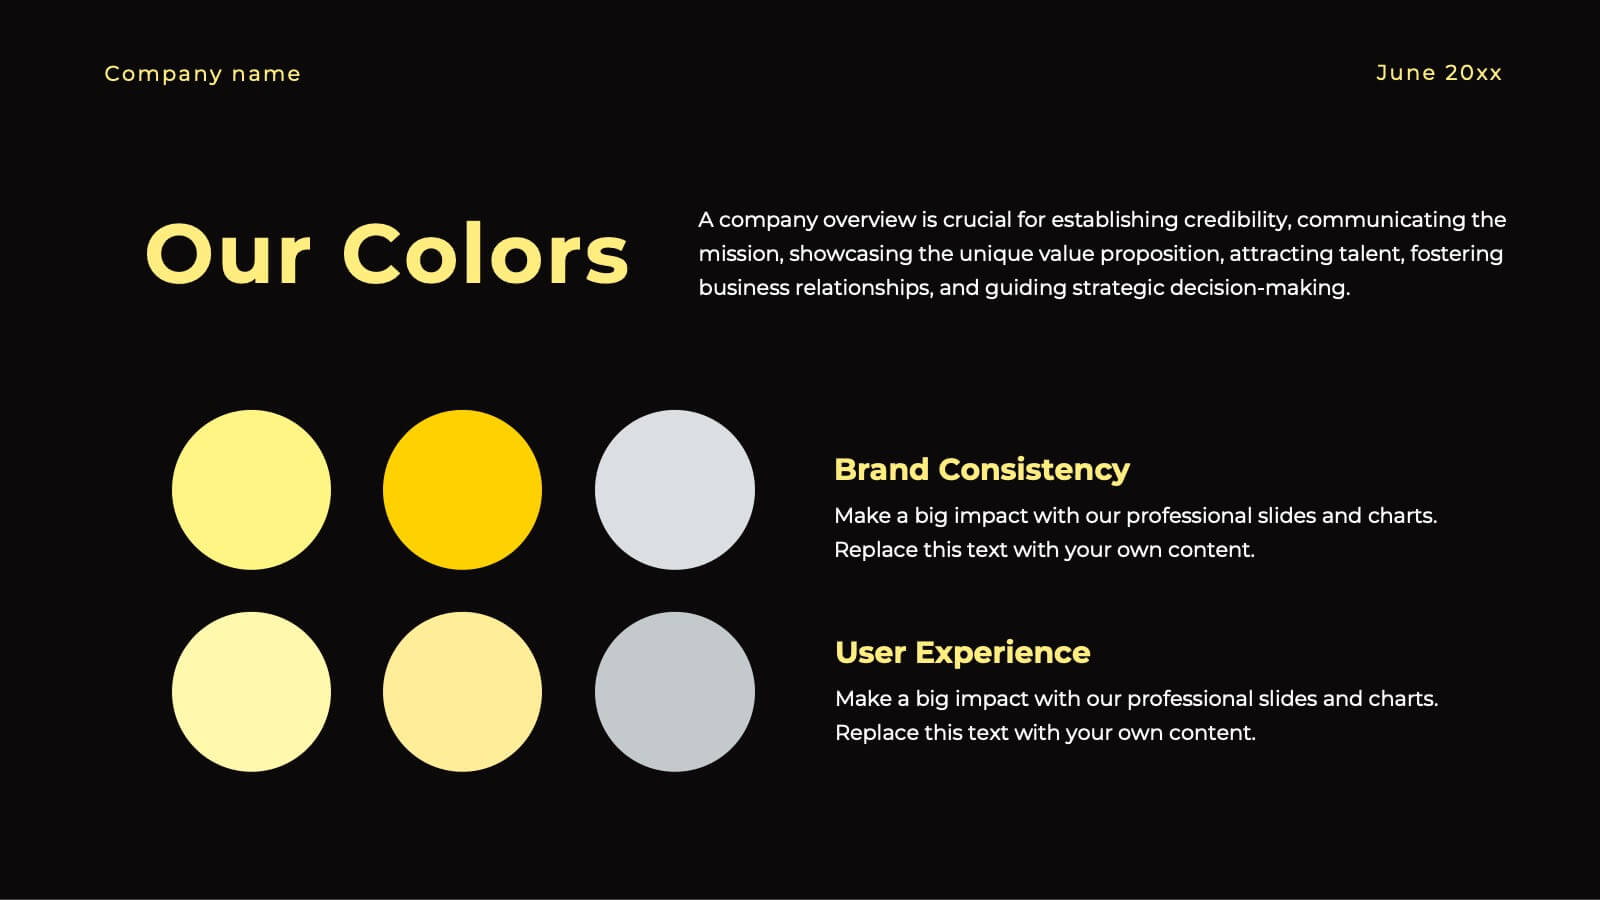
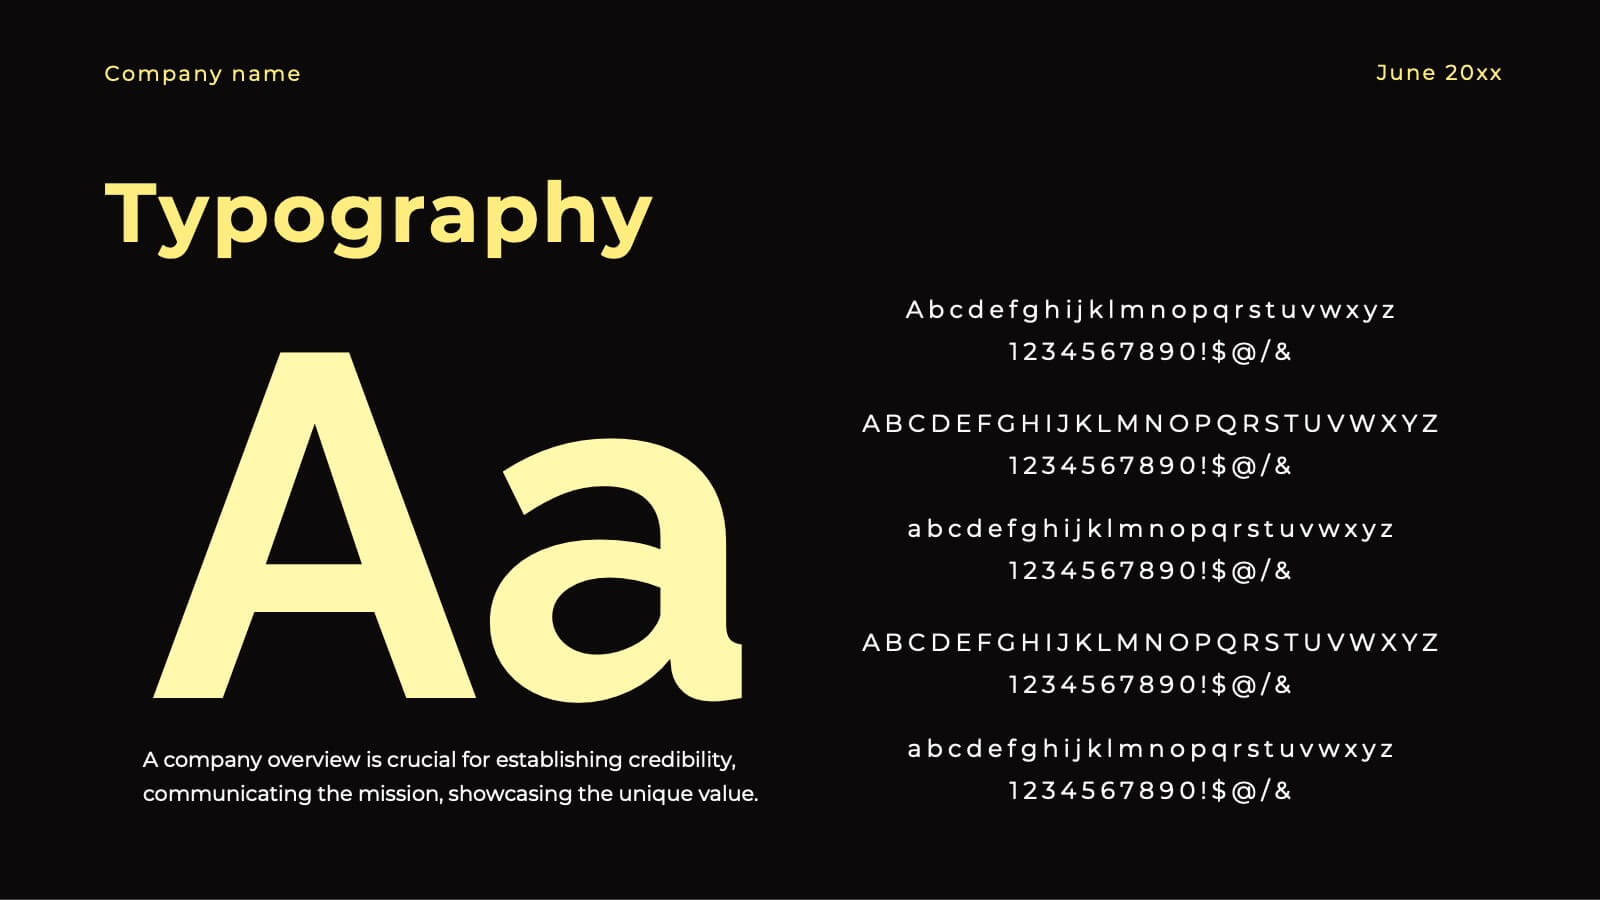
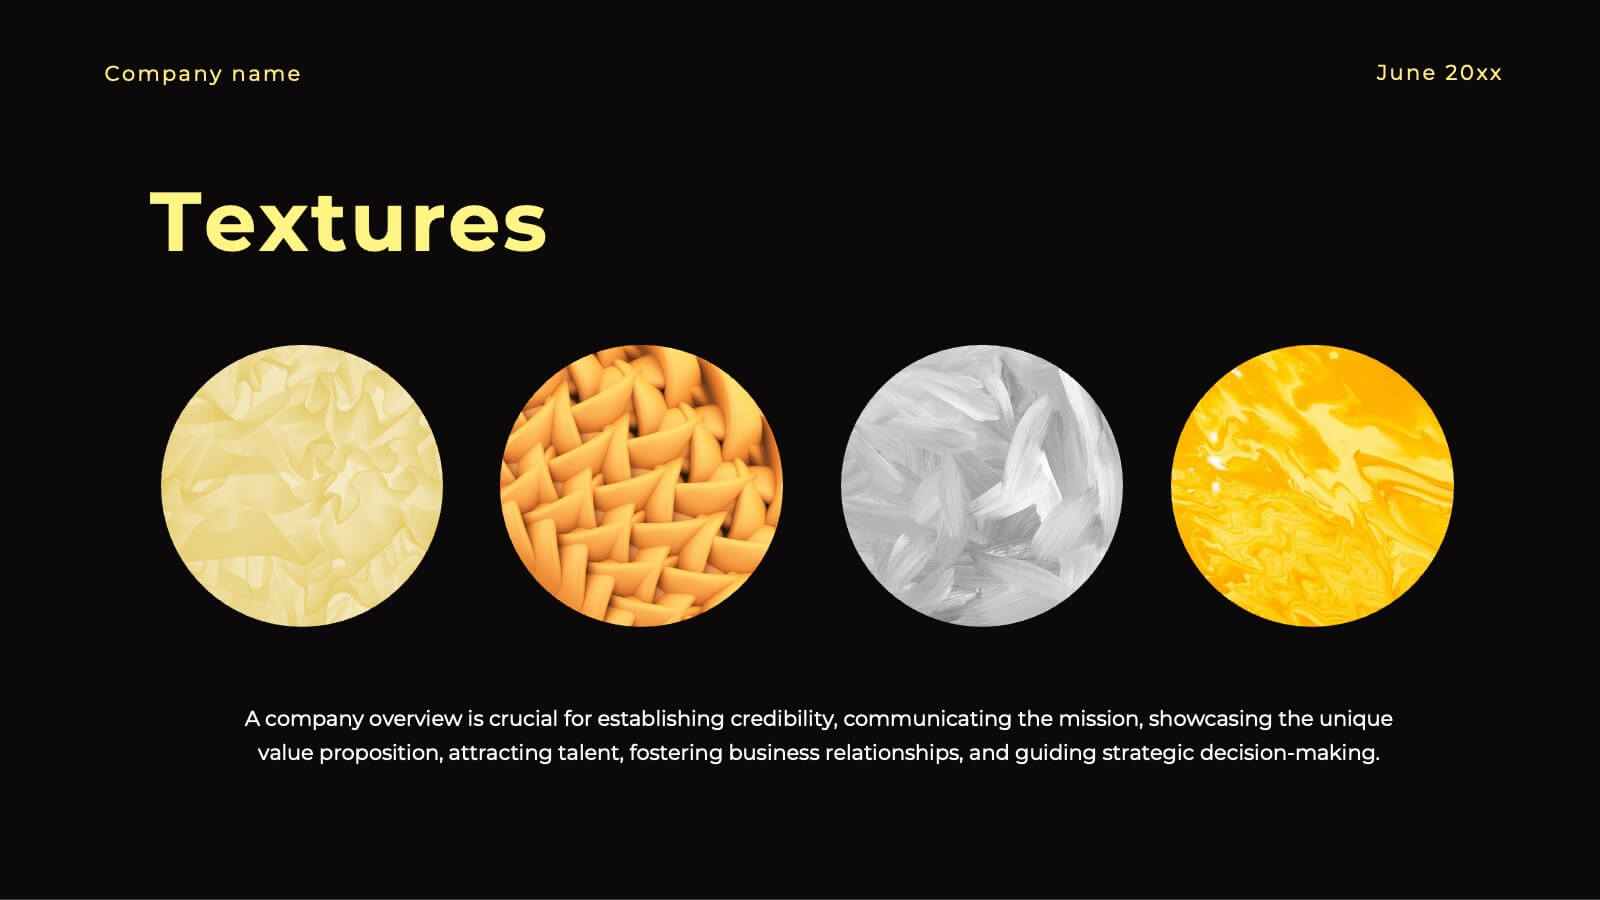
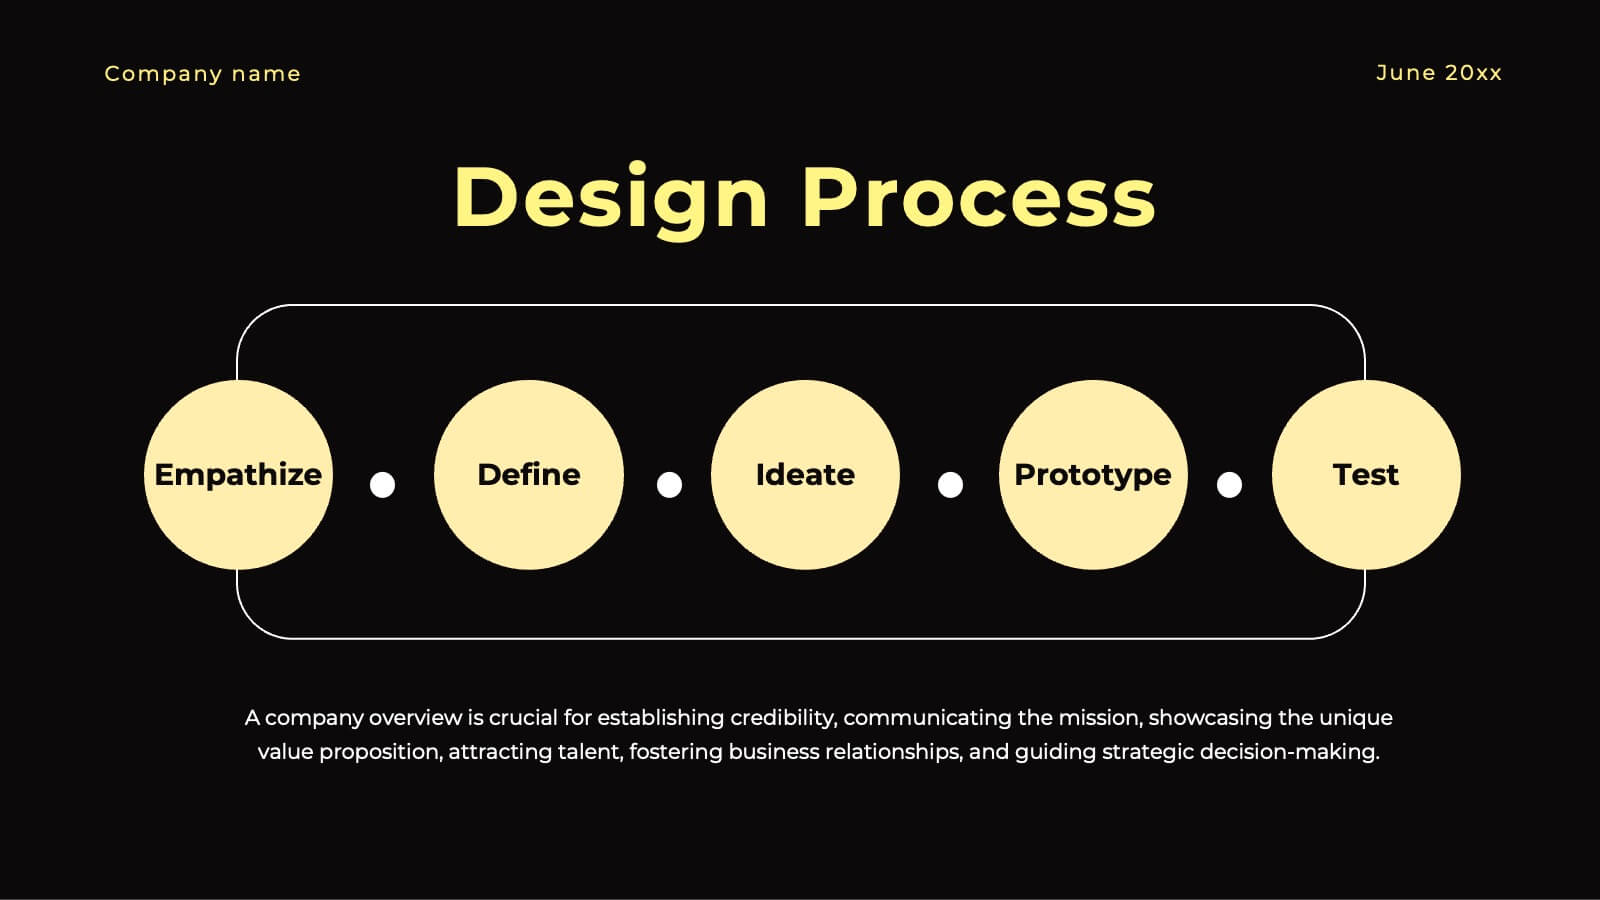
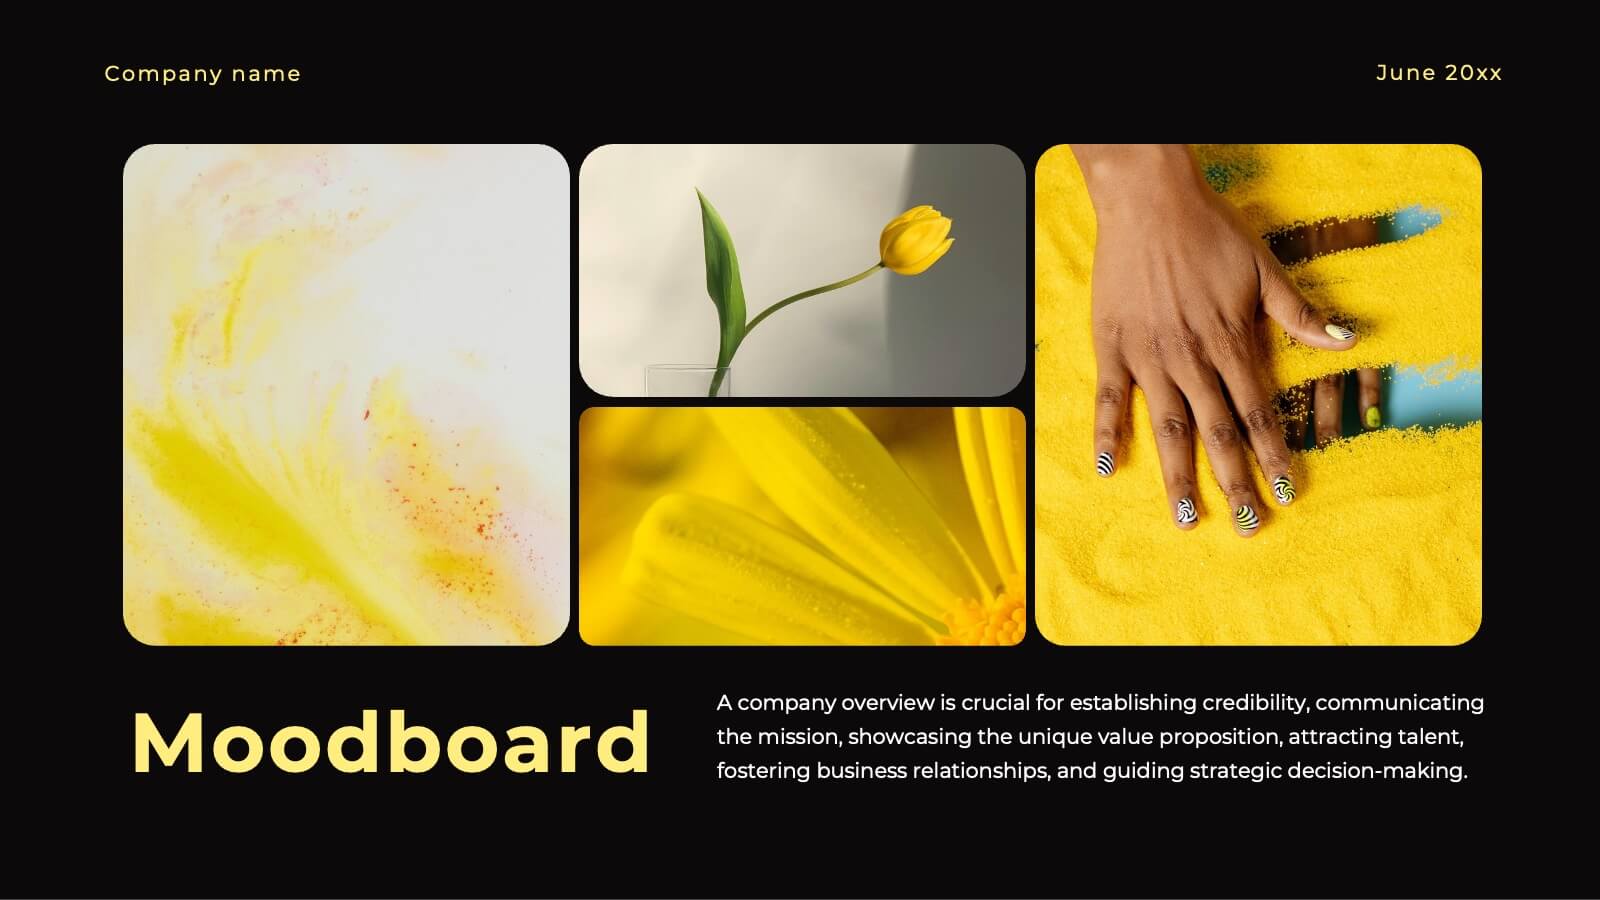
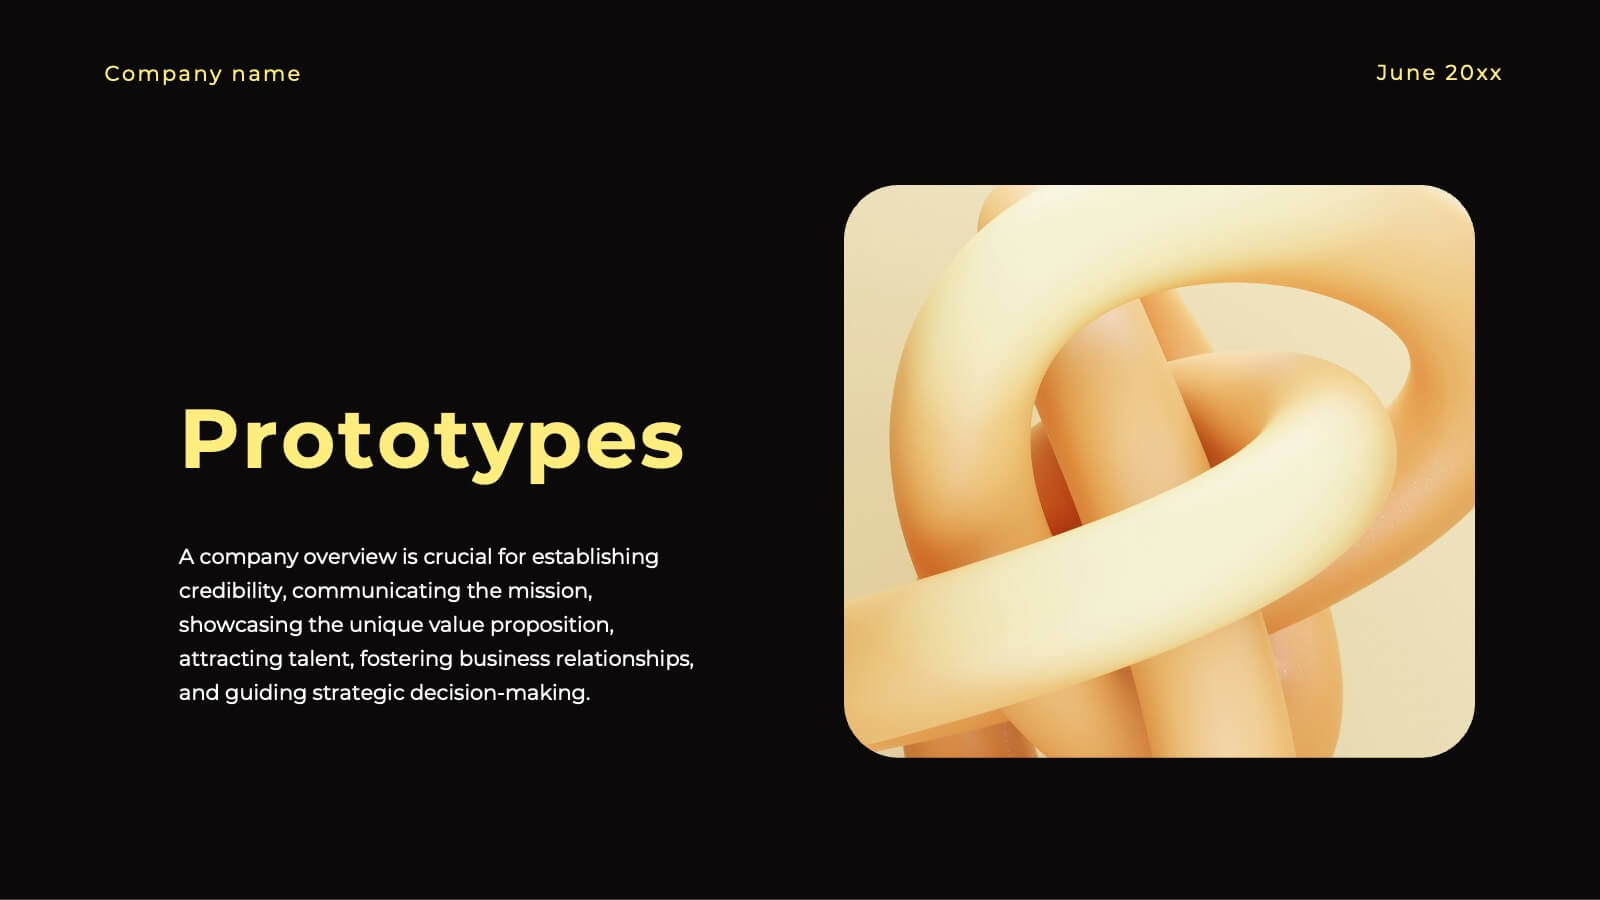
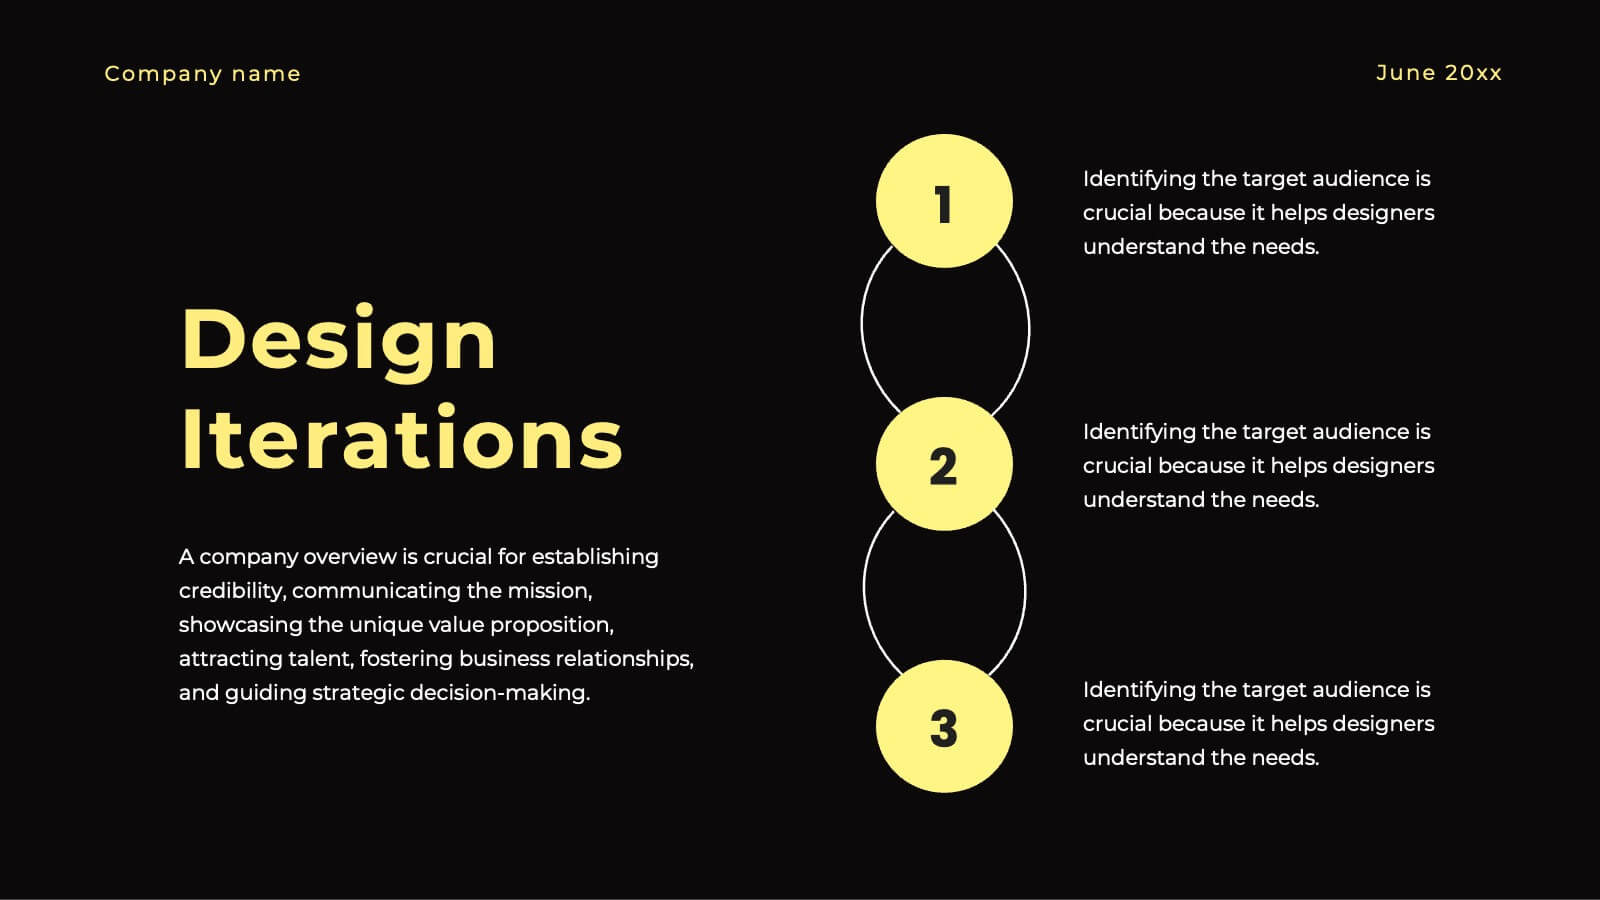
Ignite Creative Design Report Presentation
Unleash your creativity with this stunning design presentation template! Perfect for showcasing concept development, design processes, and final prototypes, it includes slides for typography, color palettes, and project timelines. Captivate your audience with sleek visuals and detailed content. Compatible with PowerPoint, Keynote, and Google Slides for seamless presentations on any platform.


10 diapositivas
Project Launch in 4 Structured Phases Presentation
Present your roadmap with clarity using this four-phase launch diagram. Designed for planning, strategy, or product rollout presentations, each step is illustrated in a 3D layered format with editable text sections. Fully customizable in PowerPoint, Keynote, and Google Slides—ideal for project managers and teams outlining sequential development or launches.


5 diapositivas
Relationship Mapping Diagram Presentation
Bring clarity to complex connections with this clean and modern visual layout designed to map relationships, processes, or ideas effortlessly. Perfect for presentations that require structure and flow, it balances simplicity with professionalism. Fully customizable and compatible with PowerPoint, Keynote, and Google Slides for seamless design flexibility.


5 diapositivas
Banking Services Infographics
Banking Services refer to the financial and investment services provided by banks to individuals, businesses, and other organizations. These Infographics are visual representations of information about different types of banking services provided by various financial institutions. This infographic provides an overview of the key features, benefits, and drawbacks of each service, such as checking/saving accounts, credit cards, and online banking. Included are statistics, charts, and other visual aids to convey data more effectively. The aim is to help individuals make informed decisions about the right banking services for their needs.


7 diapositivas
Responsibility Assignment Matrix Diagram Presentation
A Responsibility Assignment Matrix is a tool used to define and communicate project roles and responsibilities. This template can be used as a valuable tool for any project team. By representing the various assignments and roles, the (RAM) helps to ensure that projects are completed on time, within budget, and to the expected quality standards. Use the tips provided to create a clear and effective matrix for your next project. This template includes helpful illustrations and allows you to add tips and additional details related with the roles and responsibilities in context with the task.


4 diapositivas
Business Growth Strategy Presentation
Visualize strategic priorities with this Business Growth Strategy Presentation. Designed as a 2x2 matrix, this slide showcases market and product positioning across four quadrants: present vs. future and market fit vs. innovation. Each section is color-coded and icon-supported, making it easy to highlight initiatives and growth paths. Fully editable in PowerPoint, Keynote, and Google Slides.


6 diapositivas
Business Advancement Metrics Presentation
Get ready to visualize your wins! This presentation template brings clarity to your metrics, helping you showcase business growth and performance benchmarks with sleek, stacked visuals. Perfect for tracking KPIs, performance analysis, or advancement trends. Fully compatible with PowerPoint, Keynote, and Google Slides for easy editing and seamless presentation delivery.


5 diapositivas
Energy Sources in The United States Infographics
Energy Sources in The United States Infographics is a bold, colorful, and modern presentation


21 diapositivas
Thistledown Marketing Campaign Presentation
Elevate your marketing campaigns with this polished and professional presentation template. Perfectly tailored to showcase key components such as campaign objectives, target audience, and competitive landscape, it provides a cohesive structure for presenting your strategies effectively. The slides also include sections for financial highlights, unique selling proposition, and growth planning, ensuring your goals are communicated with clarity. Whether you're discussing market presence, service offerings, or team leadership, this template helps streamline your content. Fully editable in PowerPoint, Google Slides, and Keynote, it offers flexibility to align with your branding and deliver a compelling campaign presentation.