


Características


¿Tienes alguna pregunta?
Recomendar


4 diapositivas
Budget Projection with Predictive Analysis Presentation
Visualize future financial outcomes with clarity using the Budget Projection with Predictive Analysis Presentation. This modern funnel-style layout helps break down key stages of budget forecasting, making it easy to communicate progressions and data-driven insights. Perfect for financial planning, reporting, or strategic reviews. Fully editable in PowerPoint, Google Slides, Keynote, and Canva.


7 diapositivas
Team Leadership and Management Presentation
Unlock the secrets of effective team leadership and management with our detailed presentation template. Designed for training sessions and workshops, it provides clear guidance on key leadership principles and team management tactics through engaging graphics and strategic layouts. Ideal for enhancing team dynamics and leadership skills.


4 diapositivas
Business Cycle Diagram Overview Presentation
Illustrate your business processes with this modern cycle diagram template. Designed to showcase four interconnected stages, it’s ideal for visualizing workflows, project phases, or continuous improvement models. Fully editable in Canva, PowerPoint, and Google Slides, this template helps you present complex cycles with clarity and visual impact.


4 diapositivas
Feature Comparison Using Harvey Balls Presentation
Easily visualize performance levels with the Feature Comparison Using Harvey Balls Presentation. This slide is perfect for showing side-by-side comparisons across multiple categories, using universally understood Harvey Ball icons to represent completeness or satisfaction. Ideal for product evaluations, vendor selections, or strategic reviews. Fully editable in PowerPoint, Keynote, and Google Slides.


20 diapositivas
Unity Sales Proposal Presentation
Boost your sales strategy with this comprehensive sales proposal template! Perfect for outlining objectives, processes, and customer value propositions. Ideal for sales teams aiming to close deals and impress clients. Compatible with PowerPoint, Keynote, and Google Slides, this template ensures your sales presentations are clear, persuasive, and professional. Drive your sales success today!


8 diapositivas
3D Infographic Design Presentation
Make your data pop—literally—with a stacked design that brings depth and clarity to your message. This 3D infographic template helps break down layered concepts, step-by-step processes, or hierarchical data in a visually striking way. It’s fully customizable and compatible with PowerPoint, Keynote, and Google Slides for easy presentation building.


4 diapositivas
User Experience Flow Presentation
Bring clarity and color to every stage of your user experience process with this clean, structured presentation. It helps you outline steps, explain interactions, and highlight key insights in a visually intuitive flow. Easy to customize and fully compatible with PowerPoint, Keynote, and Google Slides.


5 diapositivas
RACI Role Assignment Matrix Overview Presentation
Clarify team responsibilities with the RACI Role Assignment Matrix Overview Presentation. This professional template helps define who is Responsible, Accountable, Consulted, and Informed across key project tasks. Perfect for streamlining communication, reducing overlap, and improving accountability. Fully editable in PowerPoint, Canva, and Google Slides.


7 diapositivas
Business Strategy Infographic Presentation Template
A business strategy is a detailed plan that lays your goals, accomplishments and direction for the whole organization. A strategic plan will bring stability to your business and make it more profitable. This template can be used to inform your business on how essential a business strategy is. With this template, your business will learn that creating a strategy will help gain a better understanding of their organization's current strengths and weaknesses. This template is easy to use, includes helpful illustrations and allows you to add tips for managing your business more effectively.


12 diapositivas
Business Event Planning Schedule Presentation
Optimize your event planning with the Business Event Planning Schedule template, which streamlines your organization efforts by providing a clear timeline from January to June. It's perfect for entering key business insights or data at various stages. Designed for adaptability, this template ensures your planning remains concise and relevant. Compatible with PowerPoint, Keynote, and Google Slides, it integrates effortlessly into your workflow.

18 diapositivas
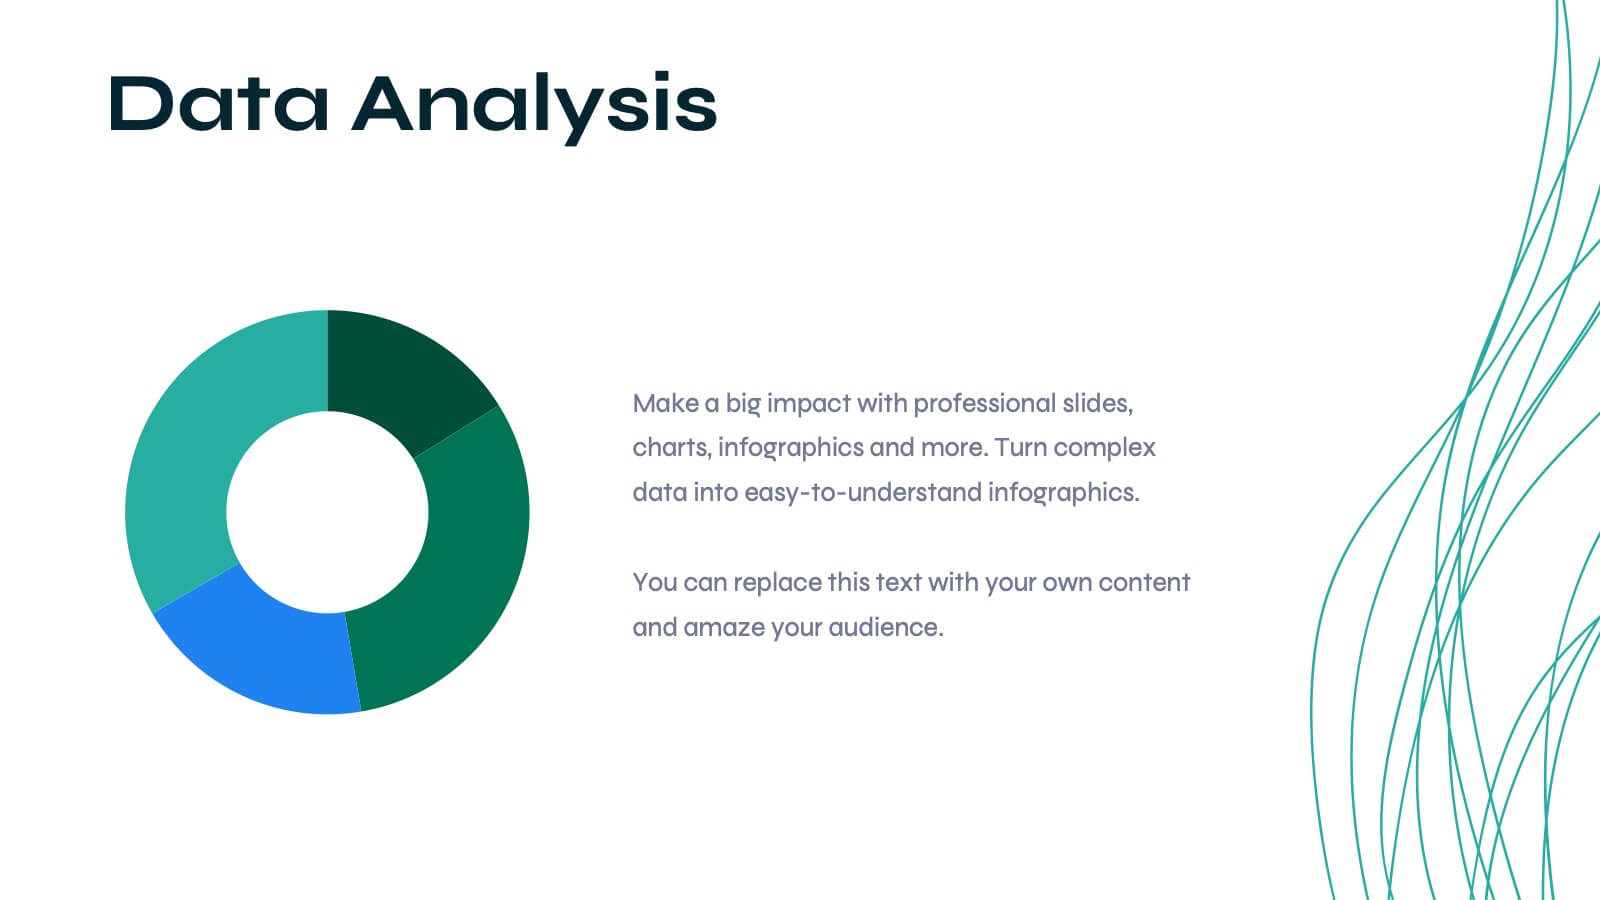
Pinnacle Academic Research Report Presentation
Present your academic research with style and precision using this comprehensive template. It covers everything from research objectives to key findings and recommendations. Perfect for making your data clear and engaging. Compatible with PowerPoint, Keynote, and Google Slides, it ensures your research is presented professionally and effectively.


5 diapositivas
Demographic and Psychographic Segments Presentation
Break down your audience with clarity using the Demographic and Psychographic Segments Presentation. This slide is ideal for showcasing four key consumer dimensions through a centered circular layout and quadrant icons. Perfect for marketing campaigns, branding strategies, and audience targeting. Fully editable in Canva, PowerPoint, Keynote, or Google Slides.


7 diapositivas
RAPID Traceability Matrix Infographic
The RAPID Traceability Matrix infographic template provides a visual tool for mapping out decision-making roles within project management. Compatible with PowerPoint, Google Slides, and Keynote, this template array features various layouts to assign and display the roles of Recommend, Agree, Perform, Input, and Decide across multiple team members and project tasks. Utilizing a clean and organized design, each slide incorporates colored icons and matrix tables to clearly delineate responsibilities. This approach helps in clarifying the decision-making process and ensuring accountability within project teams.


5 diapositivas
Investment and Wealth Planning Presentation
Visualize your financial strategy with this creative piggy bank diagram layout. Each quadrant highlights a different element of your investment plan—from savings and risk management to asset growth and long-term wealth goals. Perfect for financial advisors, business consultants, or educators. Fully editable in PowerPoint, Keynote, and Google Slides for easy customization


21 diapositivas
Inventra Creative Portfolio Presentation
Make a lasting impression with this sleek and modern creative portfolio presentation template. Perfect for showcasing your artistic journey, featured projects, unique style, and client testimonials. Highlight your creative process, pricing, and services with a bold and professional layout. Fully customizable in PowerPoint, Keynote, and Google Slides.


24 diapositivas
Fictara UX Research Report Presentation
Present your UX research findings effectively with this modern and professional template. Covering essential topics such as user personas, wireframes, usability guidelines, and feedback iteration, it’s designed to showcase insights clearly. Fully editable and compatible with PowerPoint, Keynote, and Google Slides.


6 diapositivas
Pattern-Based Layouts Using Geometry
Present your process, timeline, or flow with clarity using the Pattern-Based Layouts Using Geometry Presentation. This clean, step-by-step format uses bold numbered icons and curved geometric blocks to guide viewers through five key stages. Ideal for sequential content, strategies, or workflows. Easily customizable in PowerPoint, Keynote, and Google Slides.