


Características


¿Tienes alguna pregunta?
Recomendar
22 diapositivas
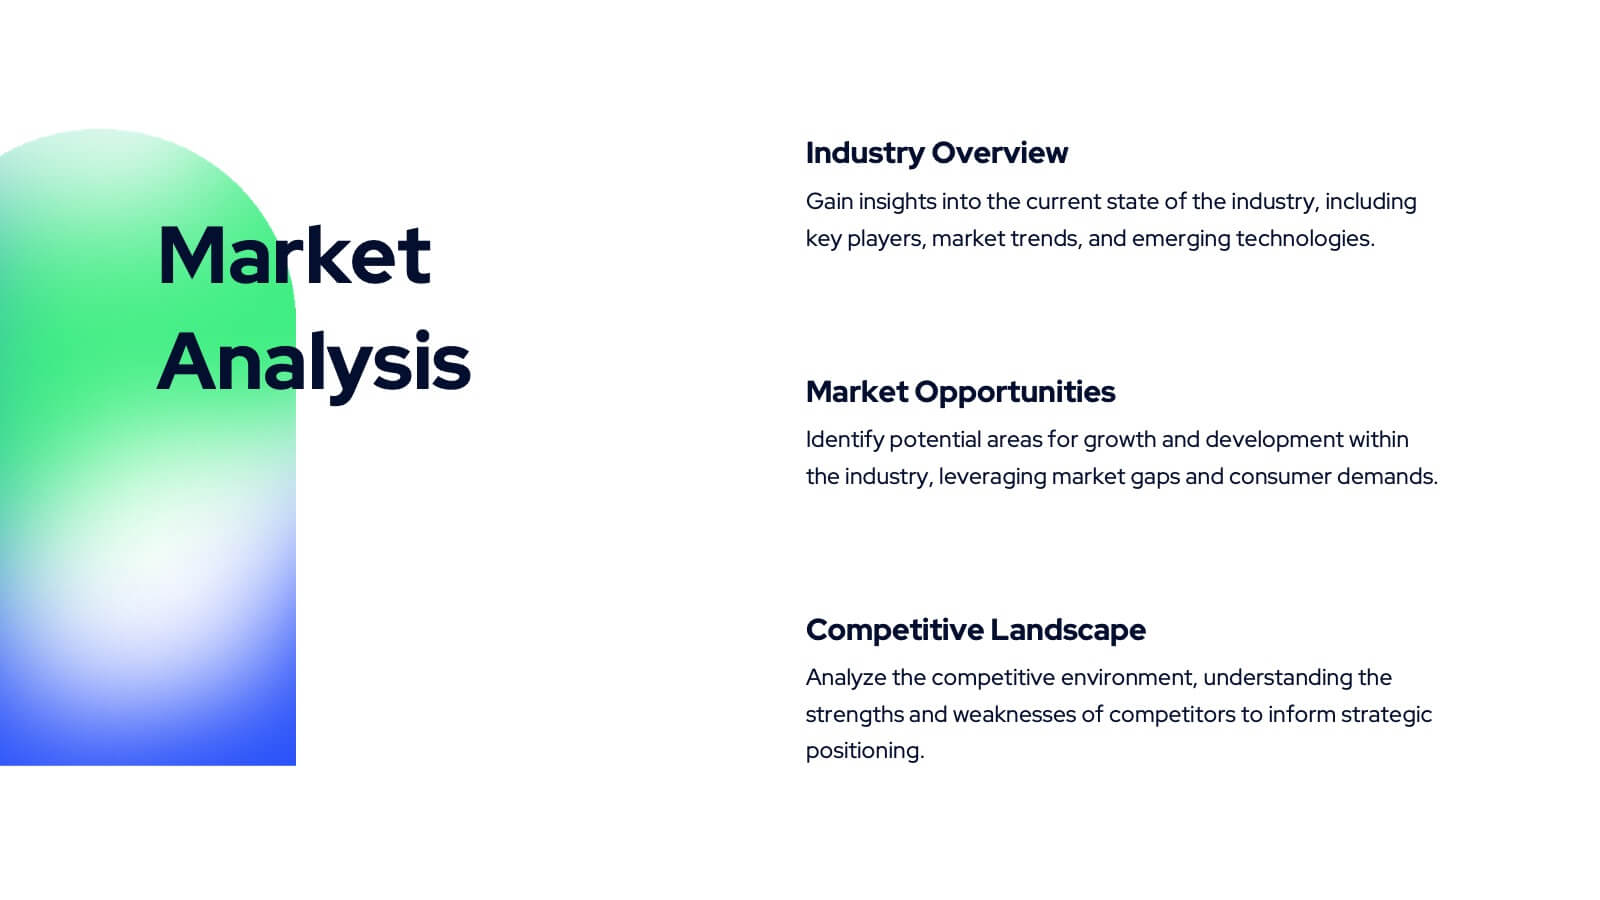
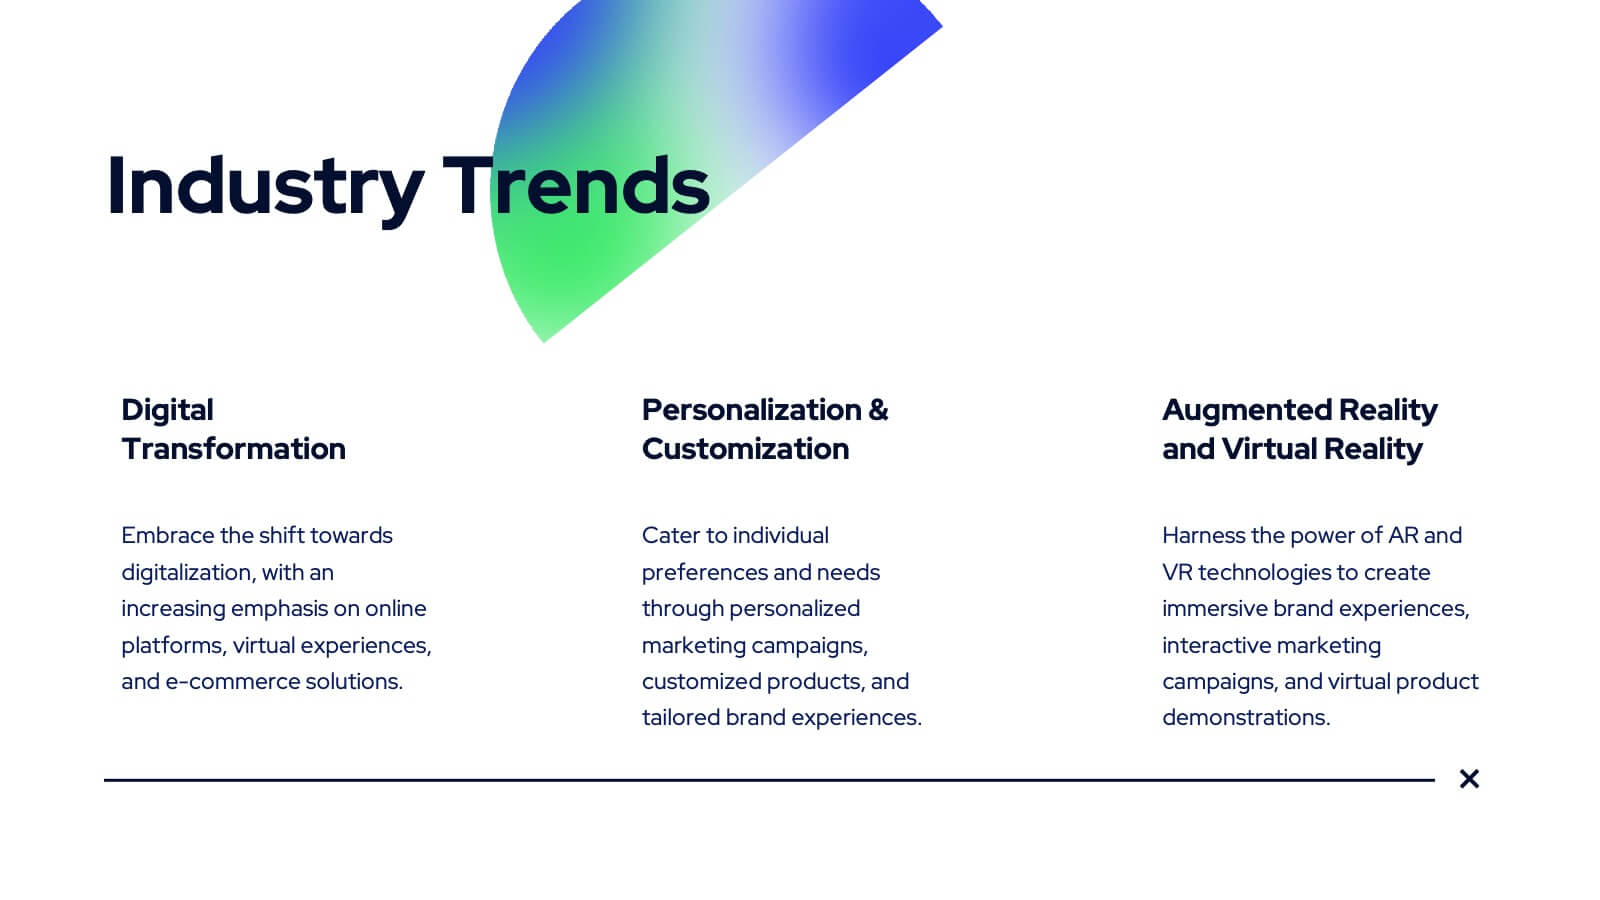
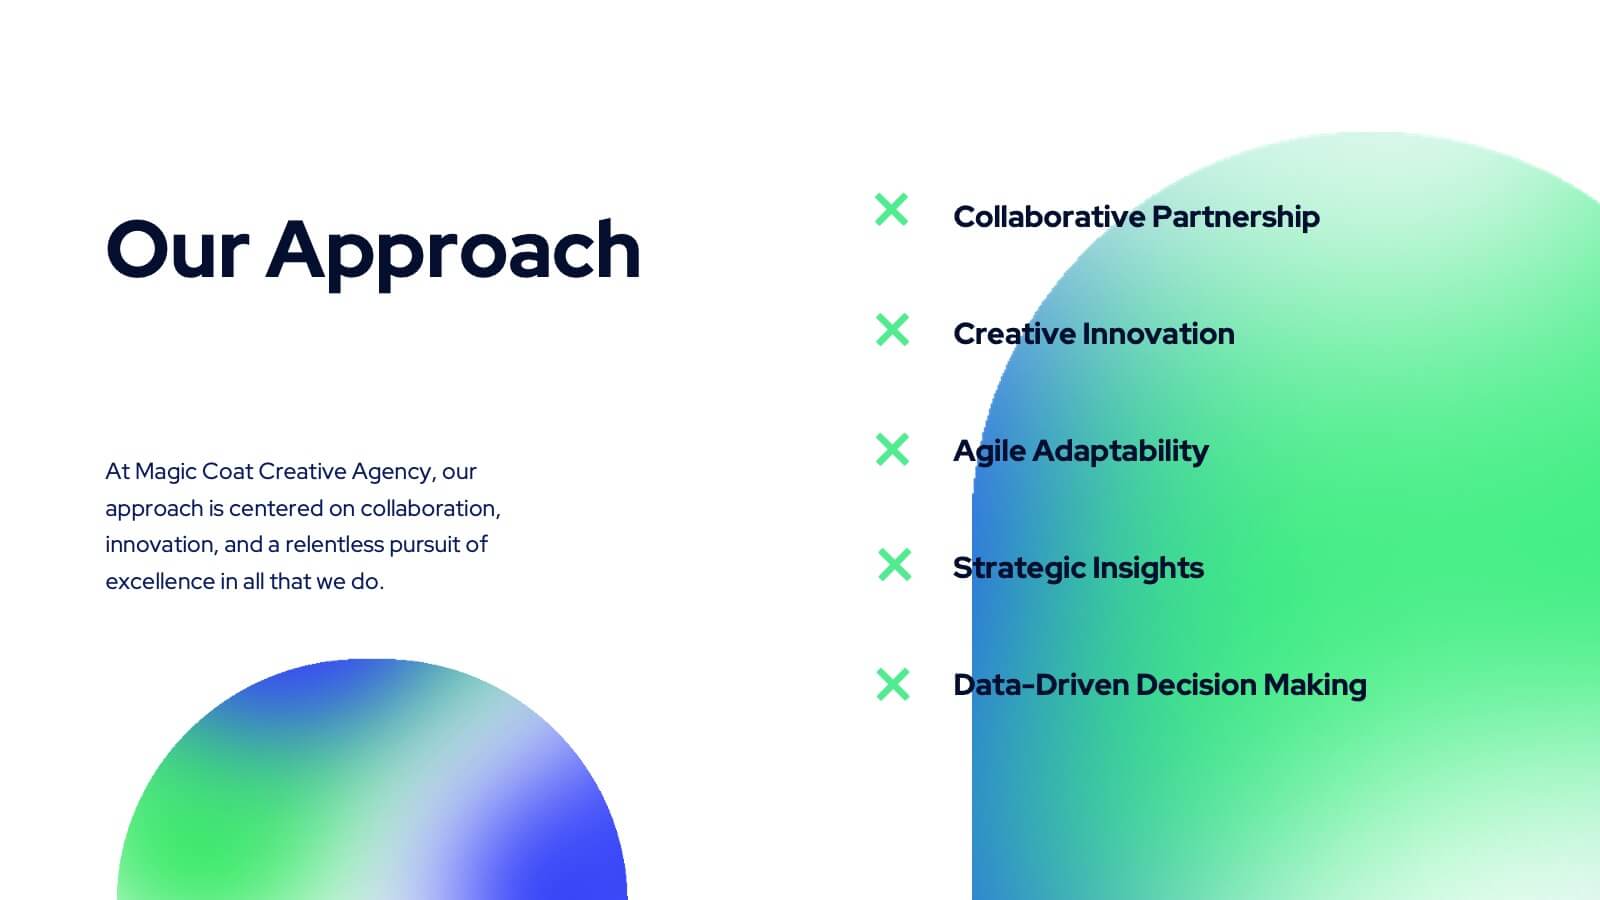
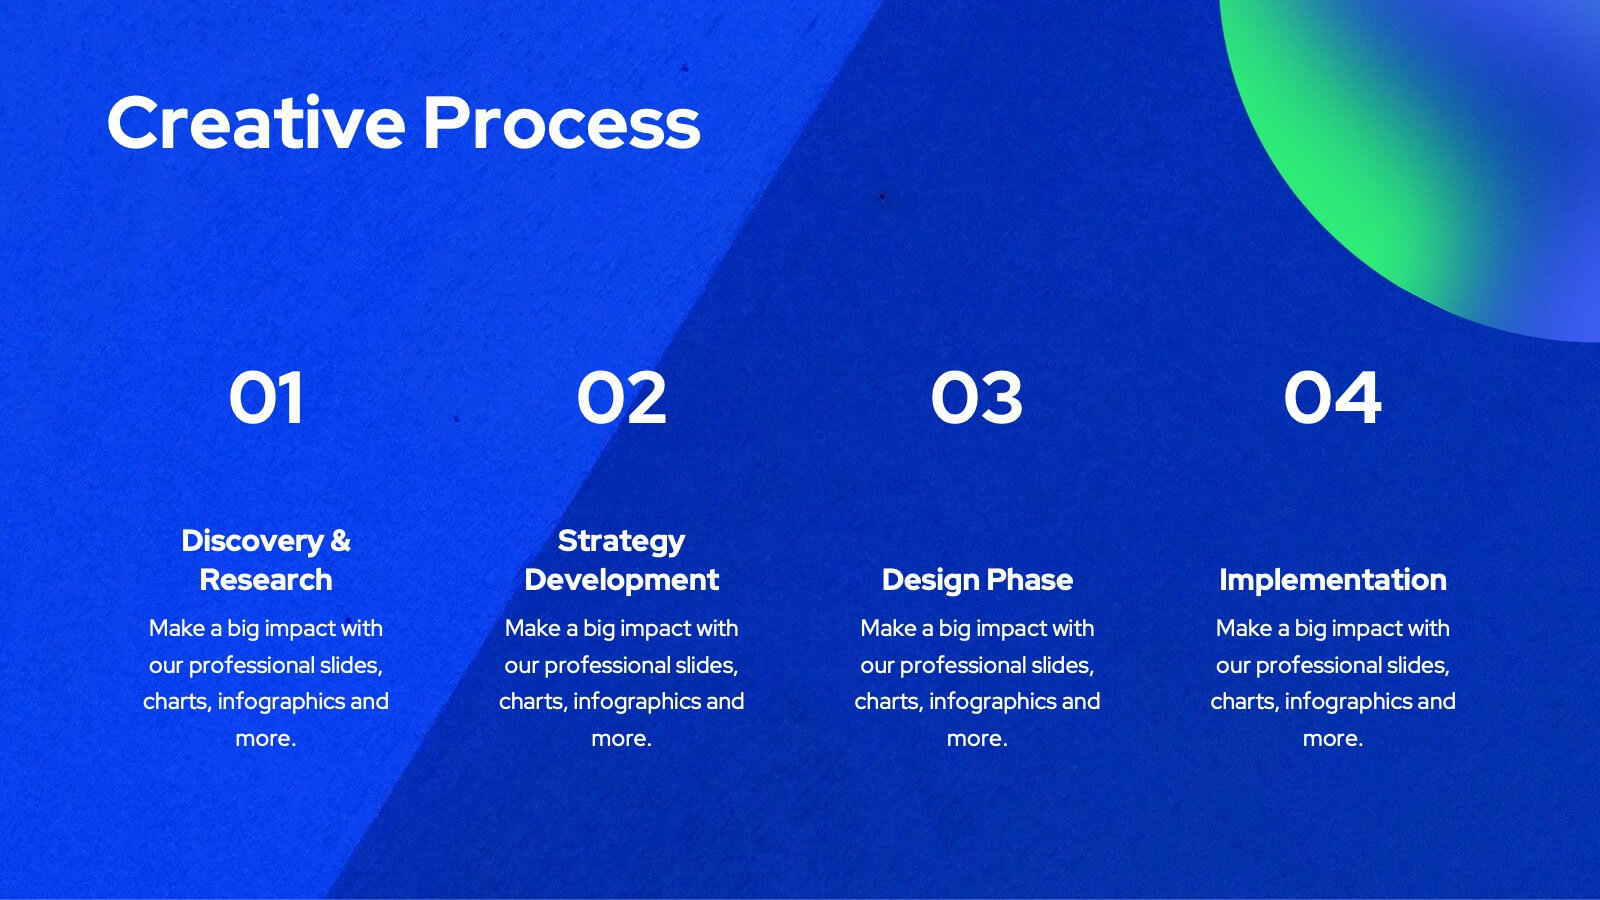
Tanzanite Full-Service Agency Project Plan Presentation
Showcase your agency's strengths with this bold and modern portfolio presentation template! From client success stories and case studies to market analysis and strategy development, this template highlights your expertise and approach. Perfect for agencies looking to present their services, creative processes, and partnerships. Compatible with PowerPoint, Keynote, and Google Slides, making it easy to impress any audience.


26 diapositivas
Fundraising Event Presentation
Inspire generosity and support for your cause with our Fundraising Event presentation template, ideal for PowerPoint, Keynote, and Google Slides. This template is crafted with non-profit organizations, charity foundations, and event coordinators in mind, featuring a heartwarming design that encourages giving and communal effort. The slides are tailored to highlight the importance of philanthropy, with 'big image slides' to tell the stories of those you're helping, 'process infographics' to explain how donations are used, and 'chart slides' to show the impact of collected funds. The soothing color palette and thoughtful graphics create an atmosphere of hope and solidarity. Our Fundraising Event template is more than just a collection of slides; it's a powerful storytelling tool that can galvanize audiences into action. Download it now to create a moving presentation that not only shares the vision of your event but also rallies the community around your noble cause.


20 diapositivas
Aurorium Sales Proposal Presentation
Win over clients with confidence using this sleek and modern sales proposal presentation. Designed to highlight key business strategies, pricing plans, competitive analysis, and future opportunities, this template helps you communicate your value with clarity and impact. Fully customizable and compatible with PowerPoint, Keynote, and Google Slides for seamless presentations.


6 diapositivas
Business Risk Mitigation Framework Presentation
Visualize and communicate your risk management strategies with this two-part puzzle-style framework. Ideal for showcasing problems and solutions, action plans, or risk-response workflows. Clean and modern layout enhances clarity. Fully editable in PowerPoint, Keynote, and Google Slides—perfect for business continuity planning, operational strategy, and stakeholder presentations.


26 diapositivas
Emery Presentation Template
Ready to make an impression? Style and professionalism are all wrapped up in Emery. New businesses and startups will find it useful - from real estate to travel agencies and everything in-between. Emery is a bold, colorful minimalistic aesthetic template. It's easy to customize, clean and bold template for you to use for your company website. It's flexible and makes an easy quick start. Fill in your details with our easy to edit text, pictures, timelines, charts and we'll set you up for success. Use this fantastic template to promote your business or project and create the perfect document.


6 diapositivas
Quarterly Sales Overview Presentation
Bring your numbers to life with a clear, colorful layout that makes quarterly progress instantly easy to understand. This presentation helps you break down trends, compare performance across quarters, and highlight key insights with simple bar visuals. Perfect for reports and meetings, and fully compatible with PowerPoint, Keynote, and Google Slides.


6 diapositivas
Product Launch Milestone Plan Presentation
Turn your big idea into a successful launch with this bold and structured presentation design. Perfect for outlining goals, tracking phases, and measuring progress, it keeps your product roadmap clear and engaging. Easily editable and compatible with PowerPoint, Keynote, and Google Slides for seamless presentation creation.


6 diapositivas
Environmental Scanning with PESTEL Model Presentation
Spot risks and opportunities early with the Environmental Scanning with PESTEL Model Presentation. Visually break down Political, Economic, Social, Technological, Environmental, and Legal factors using a modern, tree-style layout. Ideal for business forecasting, competitive analysis, or market entry reports. Easily customizable in PowerPoint, Canva, and Google Slides.


20 diapositivas
Blaze UX UI Design Pitch Deck Presentation
Craft a visually stunning pitch that brings your UX/UI design process to life with this sleek and modern presentation template. From concept development to final prototypes, each slide is designed to showcase research, wireframes, typography, and more with a seamless, professional aesthetic. Fully compatible with PowerPoint, Keynote, and Google Slides.


23 diapositivas
Staccato Business Plan Presentation
Present your business plan with this elegant and structured template, designed for clarity and professionalism. This presentation layout provides all the essential elements for showcasing your strategy, goals, and objectives, ideal for entrepreneurs, startups, and established businesses alike. Featuring dedicated sections for company overview, panel discussions, workshop sessions, and closing remarks, the slides are organized for seamless storytelling. Highlight your team, workshop takeaways, and key resources with polished visuals and easy-to-follow layouts. The Q&A and networking break slides allow you to engage your audience effectively while maintaining a professional tone. Fully compatible with PowerPoint, Google Slides, and Keynote, this template is fully editable, allowing you to customize colors, text, and images to reflect your brand. Deliver your business ideas confidently with a presentation template that ensures a strong, lasting impression.


23 diapositivas
Skycrest Business Idea Pitch Deck Presentation
Present your innovative business idea with this bold pitch deck, featuring sections for problem statement, solution, business model, and financial projections. Ideal for capturing investor attention, this template supports PowerPoint, Keynote, and Google Slides, making it perfect for impactful presentations across multiple platforms.


21 diapositivas
Company Overview Presentation
Deliver a comprehensive company overview with this Company Overview presentation template. It includes structured slides covering the introduction, history, mission, team, market presence, and competitive landscape. Ideal for engaging stakeholders, this template also features sections on financial highlights and corporate social responsibility. Compatible with PowerPoint, Keynote, and Google Slides, it's perfect for detailed corporate presentations.


20 diapositivas
Dreamlet Marketing Proposal Presentation
Deliver a persuasive marketing proposal with this sleek and modern presentation template. It covers essential topics such as industry trends, social media strategies, influencer marketing, and customer experience, helping you make a strong impact. Perfect for agencies and businesses alike. Compatible with PowerPoint, Keynote, and Google Slides for easy customization.


5 diapositivas
Building Timeline Presentation
Bring structure and progress to your ideas with this visually engaging presentation design. Ideal for showcasing project milestones, construction phases, or business growth timelines, it helps you communicate progress clearly and professionally. Fully customizable and compatible with PowerPoint, Keynote, and Google Slides for seamless presentation editing and delivery.


26 diapositivas
Navigating Freelance and Flexible Work Presentation
Take control of your career with this insightful presentation on navigating freelance and flexible work. Covering key topics like client management, productivity strategies, income stability, and remote work tools, this template helps you present a clear roadmap to success. Fully customizable and compatible with PowerPoint, Keynote, and Google Slides for a seamless experience.


8 diapositivas
4-Quadrant Matrix Presentation
The "4-Quadrant Matrix Presentation" template is meticulously designed for strategic analysis and planning, perfect for visualizing business data across four key areas. Each quadrant highlights a distinct category, allowing for a comprehensive breakdown of information such as performance metrics, risk assessments, market trends, or operational efficiency. The template is color-coded to distinguish between the quadrants, making it visually engaging and easy to understand. Icons within each quadrant can be customized to symbolize different business functions or data points, enhancing the clarity and effectiveness of the presentation. This tool is ideal for executives, managers, and analysts who need to present complex data in a structured and insightful way, enabling informed decision-making and strategic planning in corporate settings.


4 diapositivas
UX Empathy Map Design Presentation
Spark deeper user understanding with a layout that turns thoughts, feelings, and behaviors into clear visual insights. This presentation helps teams explore customer motivation and improve product decisions through a simple, structured empathy-mapping framework. Fully compatible with PowerPoint, Keynote, and Google Slides.