


Características


¿Tienes alguna pregunta?
Recomendar


7 diapositivas
Data Analysis Research Infographic
A Data Analysis Research infographic is a visual representation of the key findings of a research study that used data analysis techniques. The purpose of this template is to provide a clear summary of the research study's most important results, making it easier for your viewers to understand and interpret the findings. This infographic include visualizations such as charts, graphs, icons, and tables that present key data points in a visually compelling way. This template is designed to highlight differences between groups or subgroups, or show how various factors are related to one another.


6 diapositivas
Break Even Options Infographic
Break-even analysis is a financial calculation that helps businesses determine the point at which their total revenue equals their total costs, resulting in neither a profit nor a loss. This infographic template provides a clear visual representation of the concept of breakeven in options trading, helping traders understand the point at which profits and losses balance out. This template is a valuable tool for businesses to assess the level of sales needed to cover their costs and begin making a profit. Use this template to provide your viewers insights and help make informed decisions to optimize operations.


6 diapositivas
Transportation and Logistics Jobs Infographic
Transportation and logistics jobs involve managing the movement of goods, materials, and people from one location to another. This infographic template is essential in ensuring the efficient and smooth operation of supply chains, distribution networks, and transportation systems. This infographic is an informative representation of the various job roles and career opportunities available within the transportation and logistics industry. This template is designed to provide valuable insights to individuals seeking careers in this field, as well as professionals looking to explore different career paths within transportation and logistics.


7 diapositivas
Performance Improvement Infographics
A Performance Improvement infographic is a visual representation of the key elements of a plan to enhance the performance of an individual, team, or organization. The purpose of this template is to communicate the plan's objectives, strategies, and metrics in an informative and engaging way. This infographic contains graphs, and diagrams to illustrate key performance indicators and other measures of success. This performance template can help motivate and engage stakeholders, highlight the benefits of performance improvement, and facilitate communication and collaboration among team members.


7 diapositivas
Big Data Tools Infographic
Big Data refers to large volumes of data, both structured and unstructured, that inundate a business or organization on a day-to-day basis. This infographic template is designed to captivate, educate, and empower, providing a bold and clear representation of the sheer magnitude and impact of big data. Compatible with Powerpoint, Keynote, and Google Slides. This template involves processing and analyzing Big Data to extract meaningful insights, patterns, and trends. These insights can be used for business intelligence, decision-making, research, and various other applications across different domains and industries.


6 diapositivas
Multiple Business Solutions Options Slide Presentation
Explore diverse strategies with the Multiple Business Solutions Options Slide Presentation. Featuring a vertical stack of labeled briefcases (A–F), this slide is designed to compare and communicate multiple business ideas, solutions, or pathways in a clear, structured layout. Ideal for pitching product variations, workflow choices, or market entry tactics. Each option is paired with customizable text fields for added clarity. Compatible with PowerPoint, Keynote, and Google Slides for easy editing and integration into your existing decks.


22 diapositivas
Sublimix Business Operations Plan Presentation
Streamline your company’s workflow with this bold and modern business operations plan presentation. Covering key areas like performance metrics, resource allocation, process improvements, and collaboration opportunities, this template helps you optimize efficiency and strategy. Fully customizable and compatible with PowerPoint, Keynote, and Google Slides for a seamless, professional presentation experience.


4 diapositivas
Risk and Reality Iceberg Diagram Presentation
Reveal underlying threats with this Risk and Reality Iceberg Diagram presentation. Ideal for risk analysis, strategic planning, or operations mapping, this slide visualizes visible vs. hidden challenges in a business or project. Fully editable in Canva, PowerPoint, and Google Slides—perfect for impactful and professional presentations.


5 diapositivas
Global Market Trends World Map Presentation
Visualize your market insights with this sleek and professional Global Market Trends World Map slide. Designed to highlight key regional data with pinpoint accuracy, it’s ideal for presenting statistics, regional performance, or global expansion strategies. The sidebar gradient layout offers space for five categories, each linked to map locations. Fully customizable and compatible with PowerPoint, Keynote, and Google Slides.


8 diapositivas
Building Planning and Architecture Strategy Presentation
Bring structure and vision to your development plans with the Building Planning and Architecture Strategy Presentation. This visual template showcases an illustrated construction scene paired with four key planning pillars—ideal for presenting design phases, zoning steps, or project milestones. Fully customizable in PowerPoint, Keynote, and Google Slides.


5 diapositivas
Hydrological Cycle Explained Presentation
Break down complex water systems with ease using the Hydrological Cycle Explained Presentation. This clean and modern slide illustrates each phase of the cycle—from precipitation to collection—with intuitive icons and a pipeline layout. Ideal for educational, environmental, or sustainability content. Fully editable in Canva, PowerPoint, Keynote, and Google Slides.


7 diapositivas
Pyramid Scheme Infographic Presentation
A Pyramid Infographic is a great way to organize, highlight, and illustrate your ideas and content. This design uses visual hierarchy and colors to convey key information in an attractive way. The Pyramid incorporates colorful diagrams to allows your text to stand out while it is set against a white background. This is a simple, engaging design that can be easily edited. This is great for analyzing data and it is the perfect choice to impress the audience. It will surely help you convey your message in a much better way. It's a great way to communicate the key points of your Infographic.


20 diapositivas
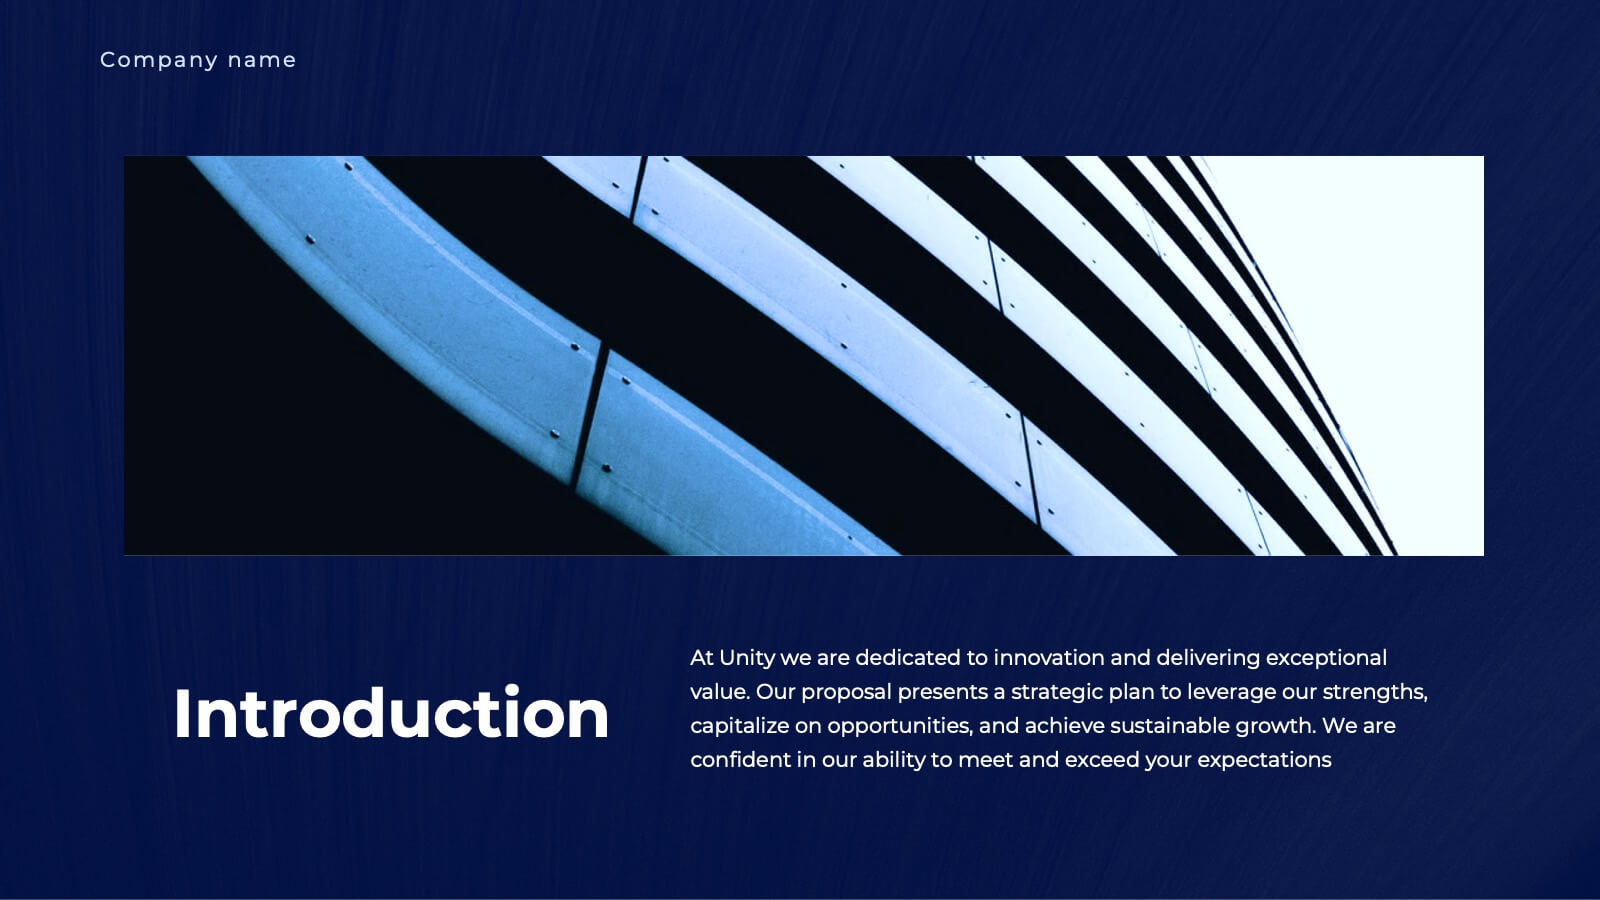
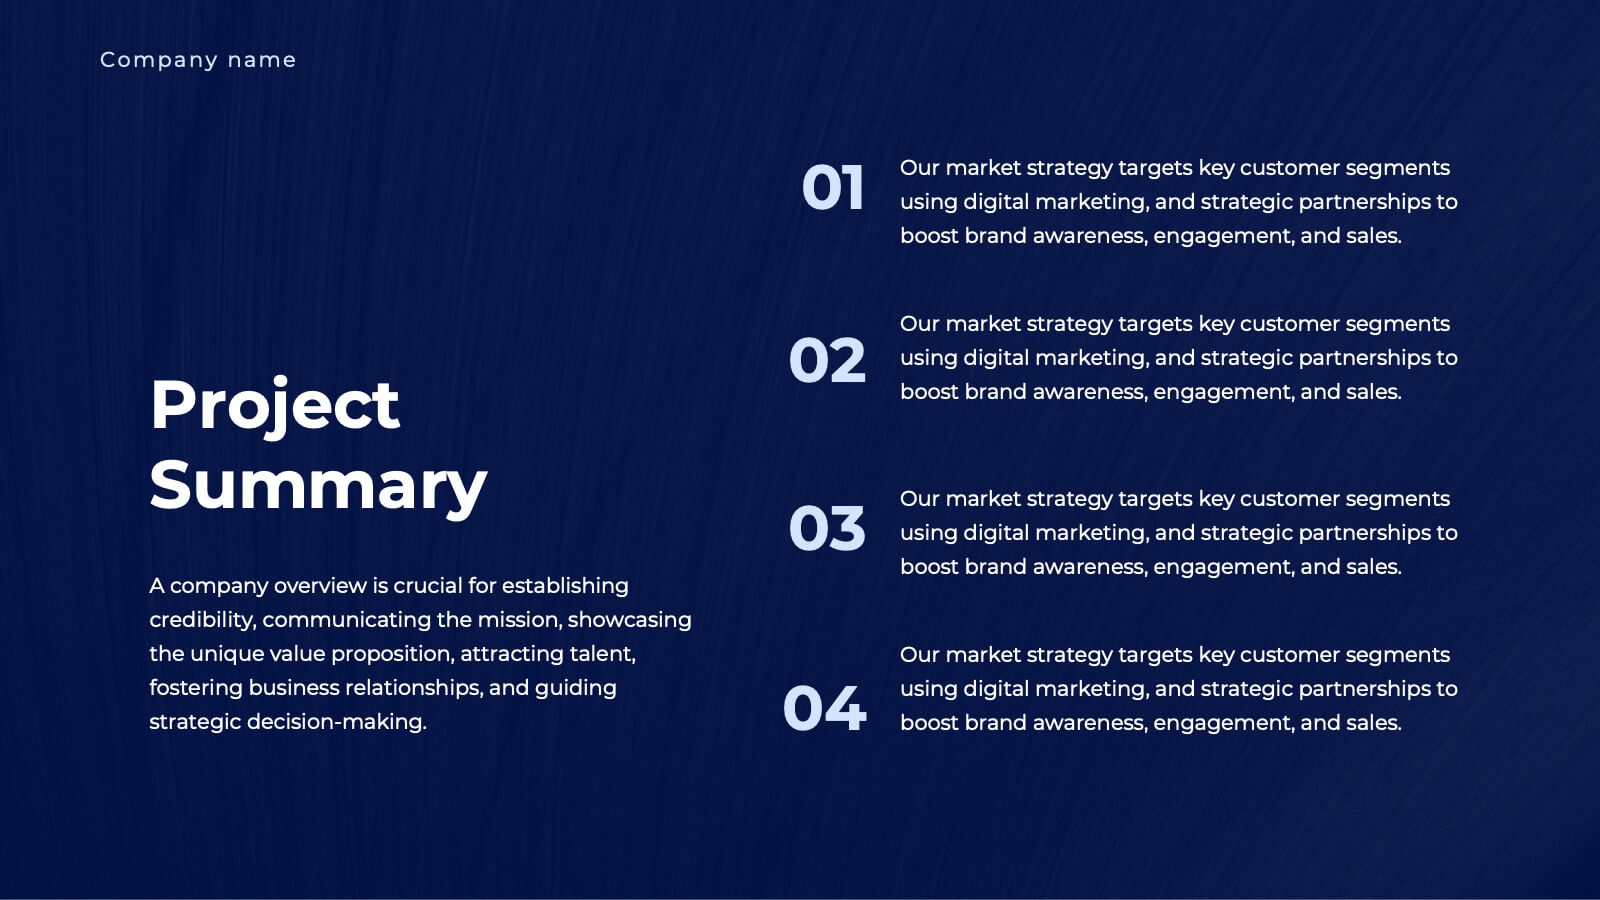
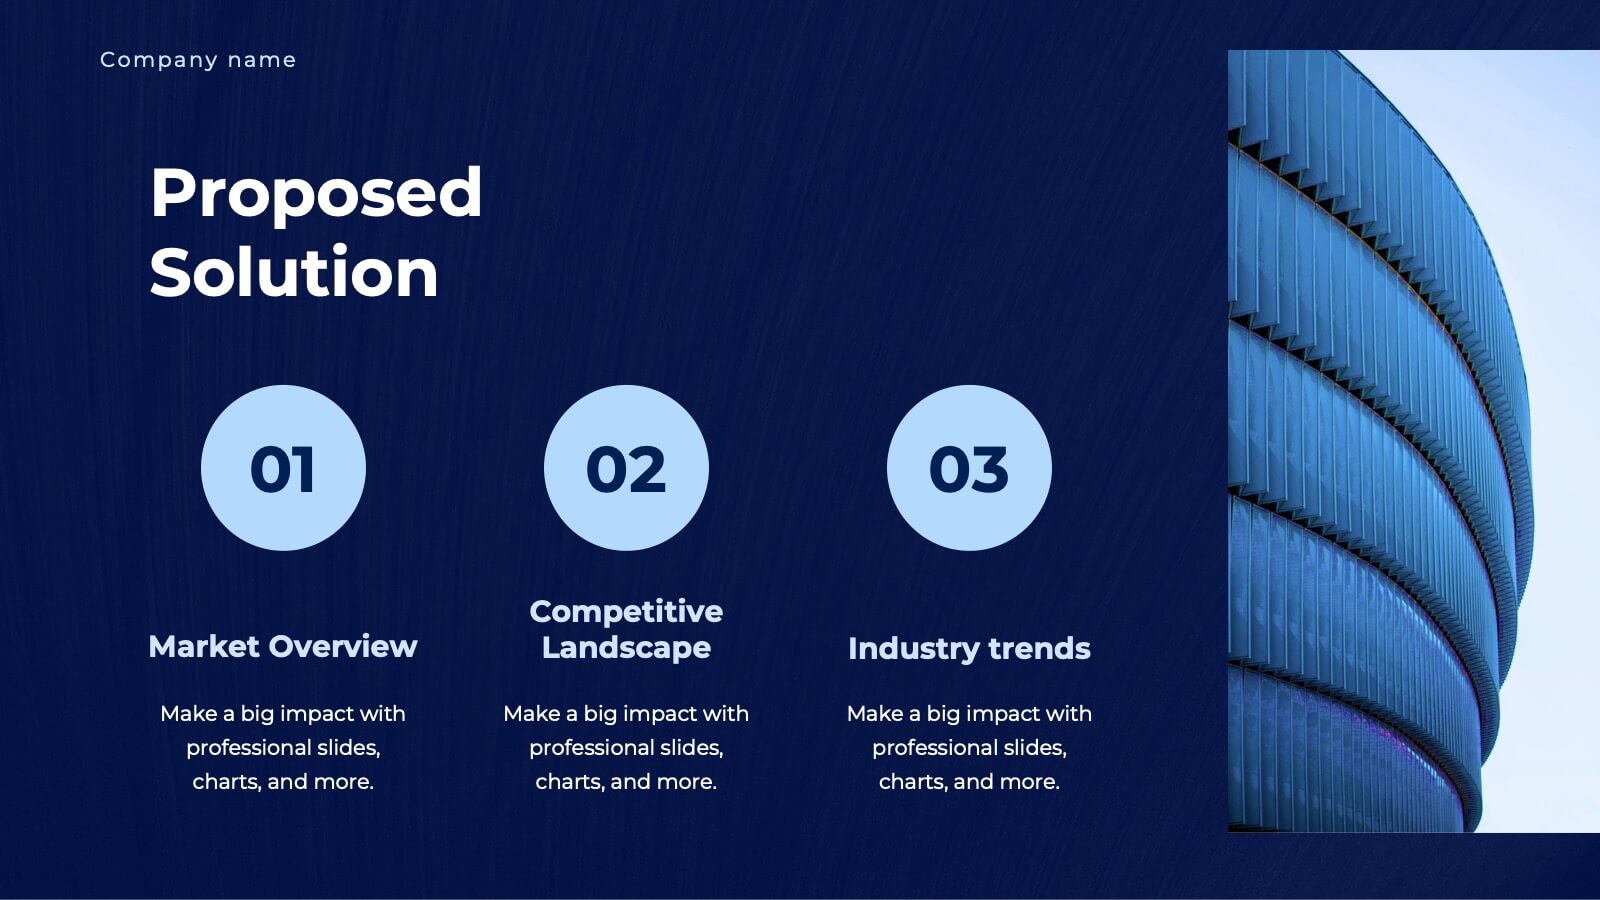
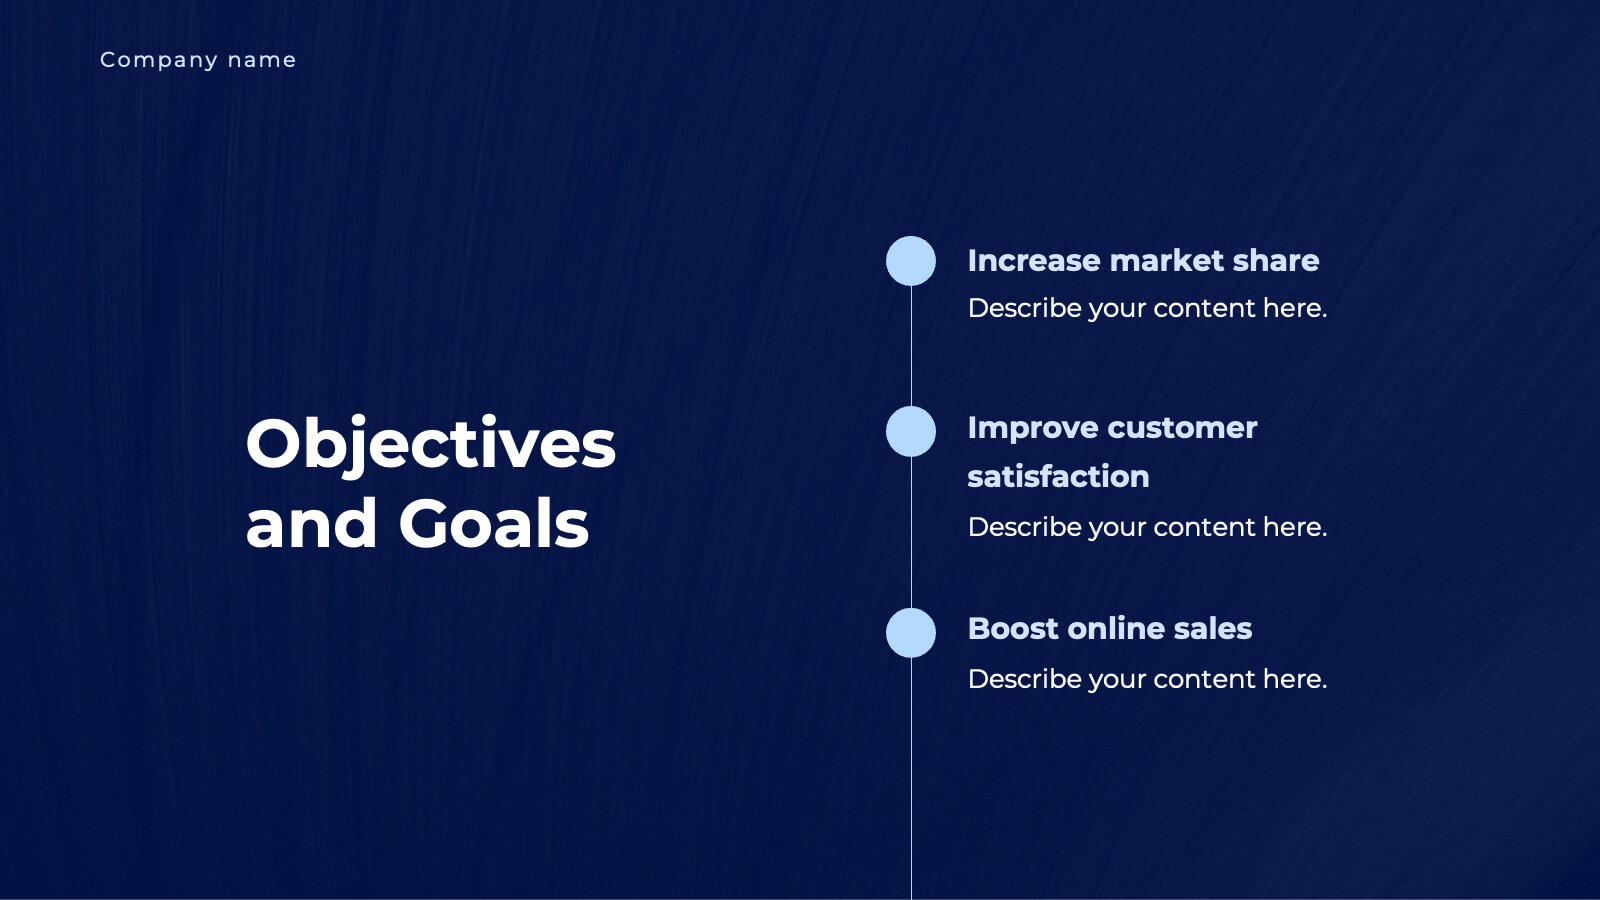
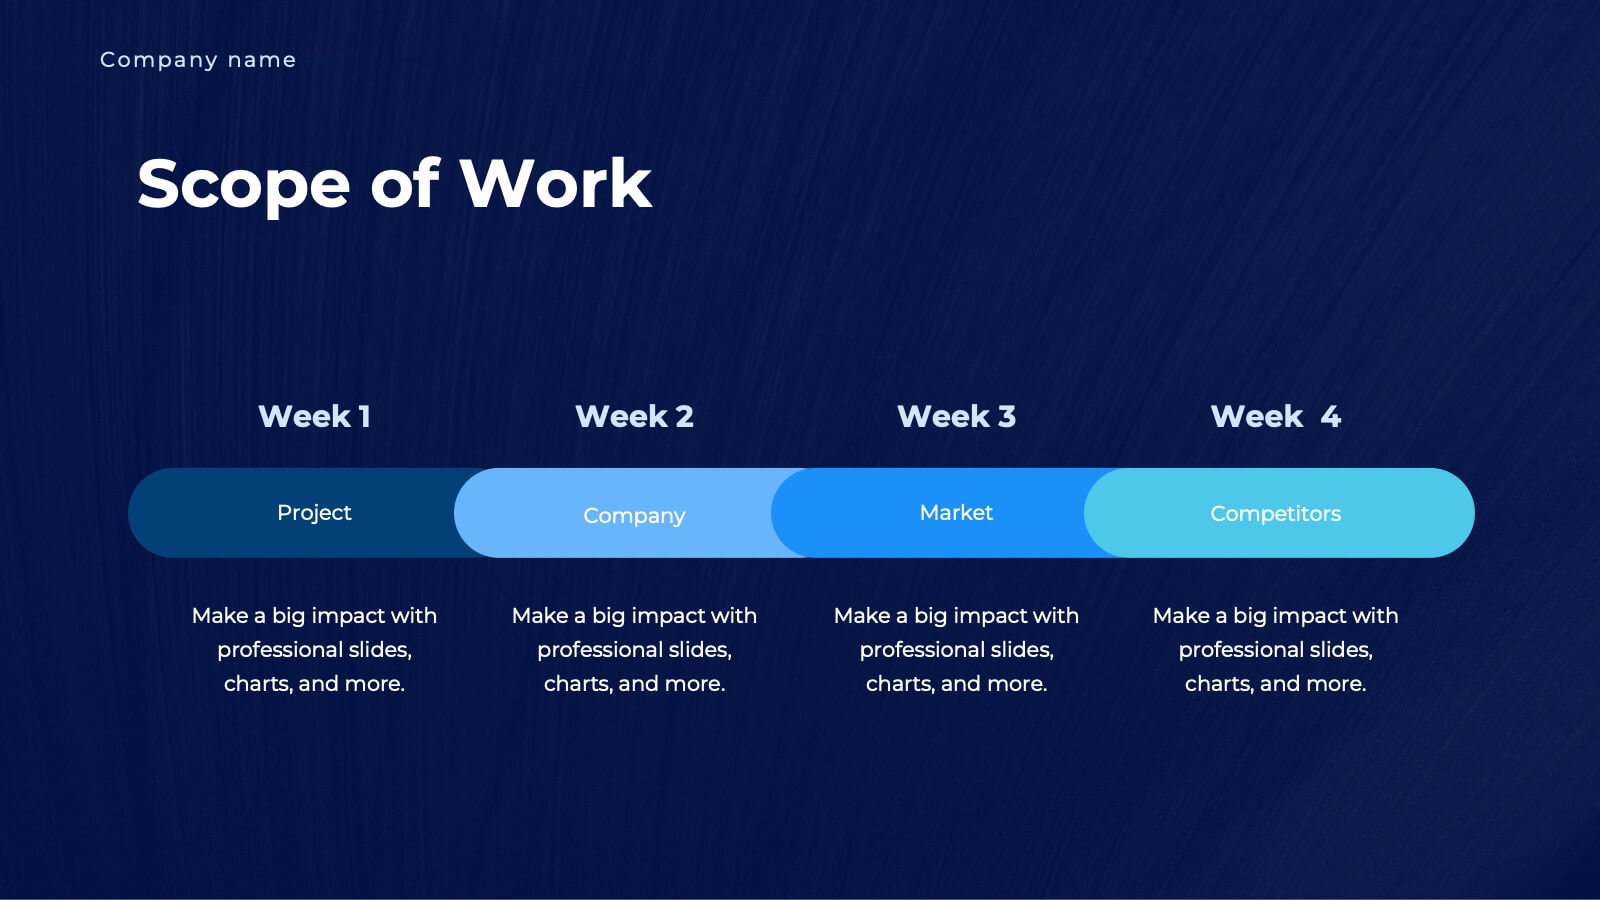
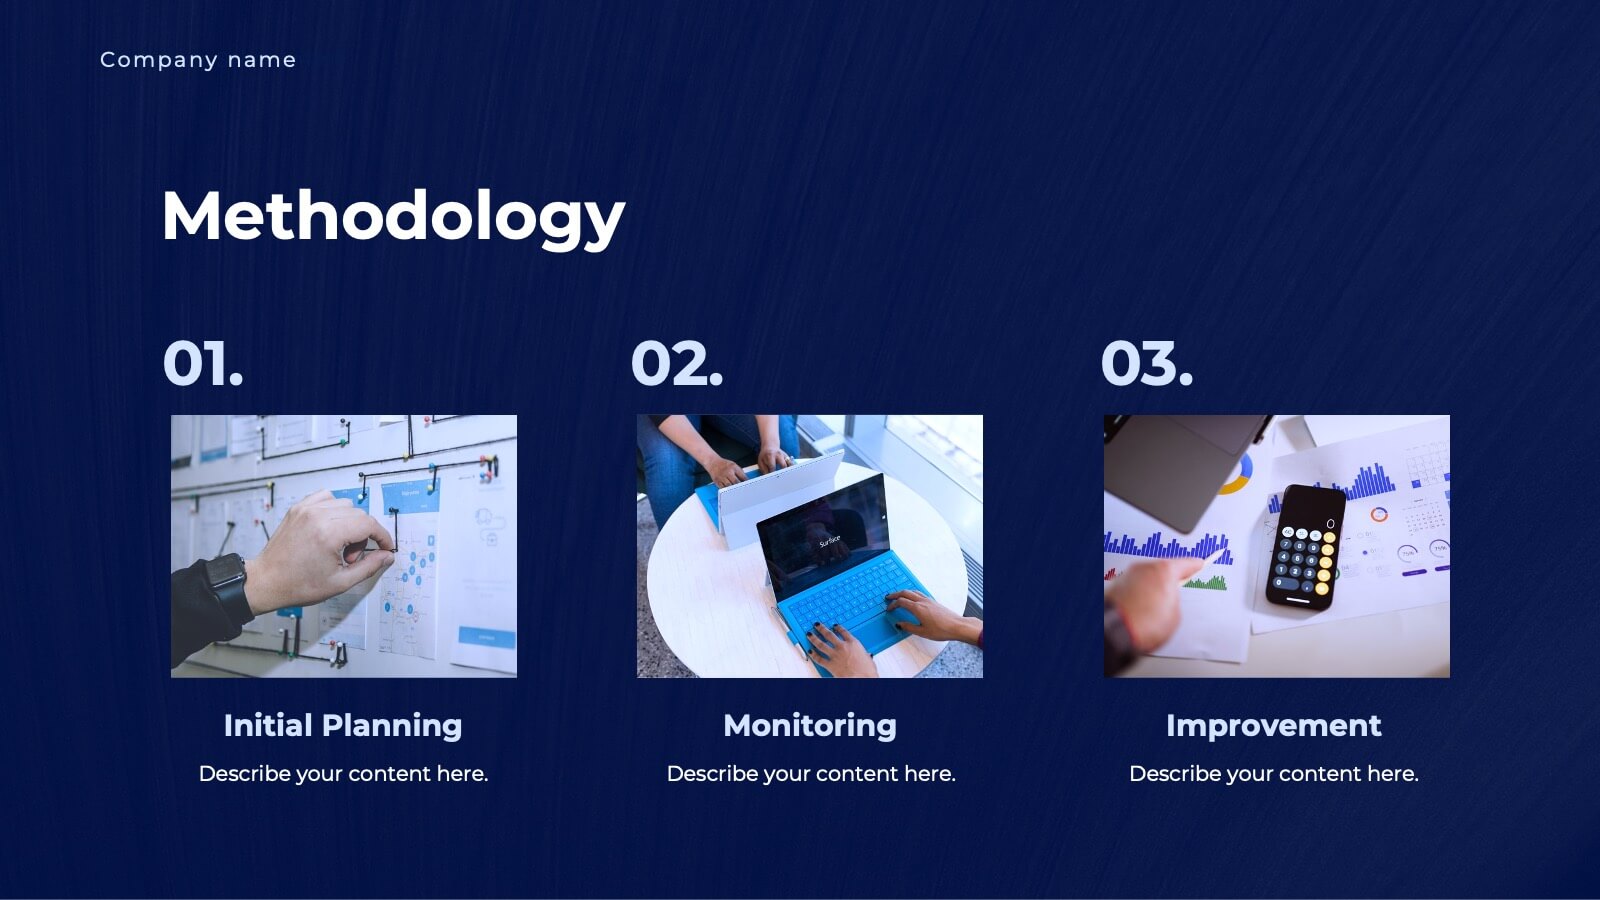
Unity Business Proposal Presentation
Take your business proposals to the next level with this elegant and comprehensive template! Perfect for presenting company overviews, project summaries, and detailed solutions. Ideal for business professionals looking to impress clients and stakeholders. Compatible with PowerPoint, Keynote, and Google Slides, this template ensures your proposals are impactful and professional.


6 diapositivas
Information Security Risk Analysis Presentation
Identify weak points before they become real threats. This information security risk analysis template makes it easy to present cybersecurity vulnerabilities, data protection gaps, and action plans in a visual and professional way. Ideal for IT audits or strategy meetings. Fully editable in PowerPoint, Keynote, and Google Slides.


4 diapositivas
Organizational Hierarchy Diagram Presentation
Clearly map out your company’s structure with this modern organizational hierarchy slide. Designed for clarity, it displays multiple team roles and reporting lines using intuitive icons and connector lines. Ideal for onboarding, strategy, or HR decks. Fully customizable in Canva, PowerPoint, or Google Slides for seamless integration into any presentation.


6 diapositivas
Organizational Structure Overview Presentation
Map out your team’s structure with clarity using this simple organizational chart template. Ideal for showcasing departments, reporting lines, or team roles, it helps stakeholders quickly understand who’s who and how responsibilities are divided. Perfect for internal meetings, onboarding decks, or company overviews. Works with PowerPoint, Keynote, and Google Slides.
20 diapositivas
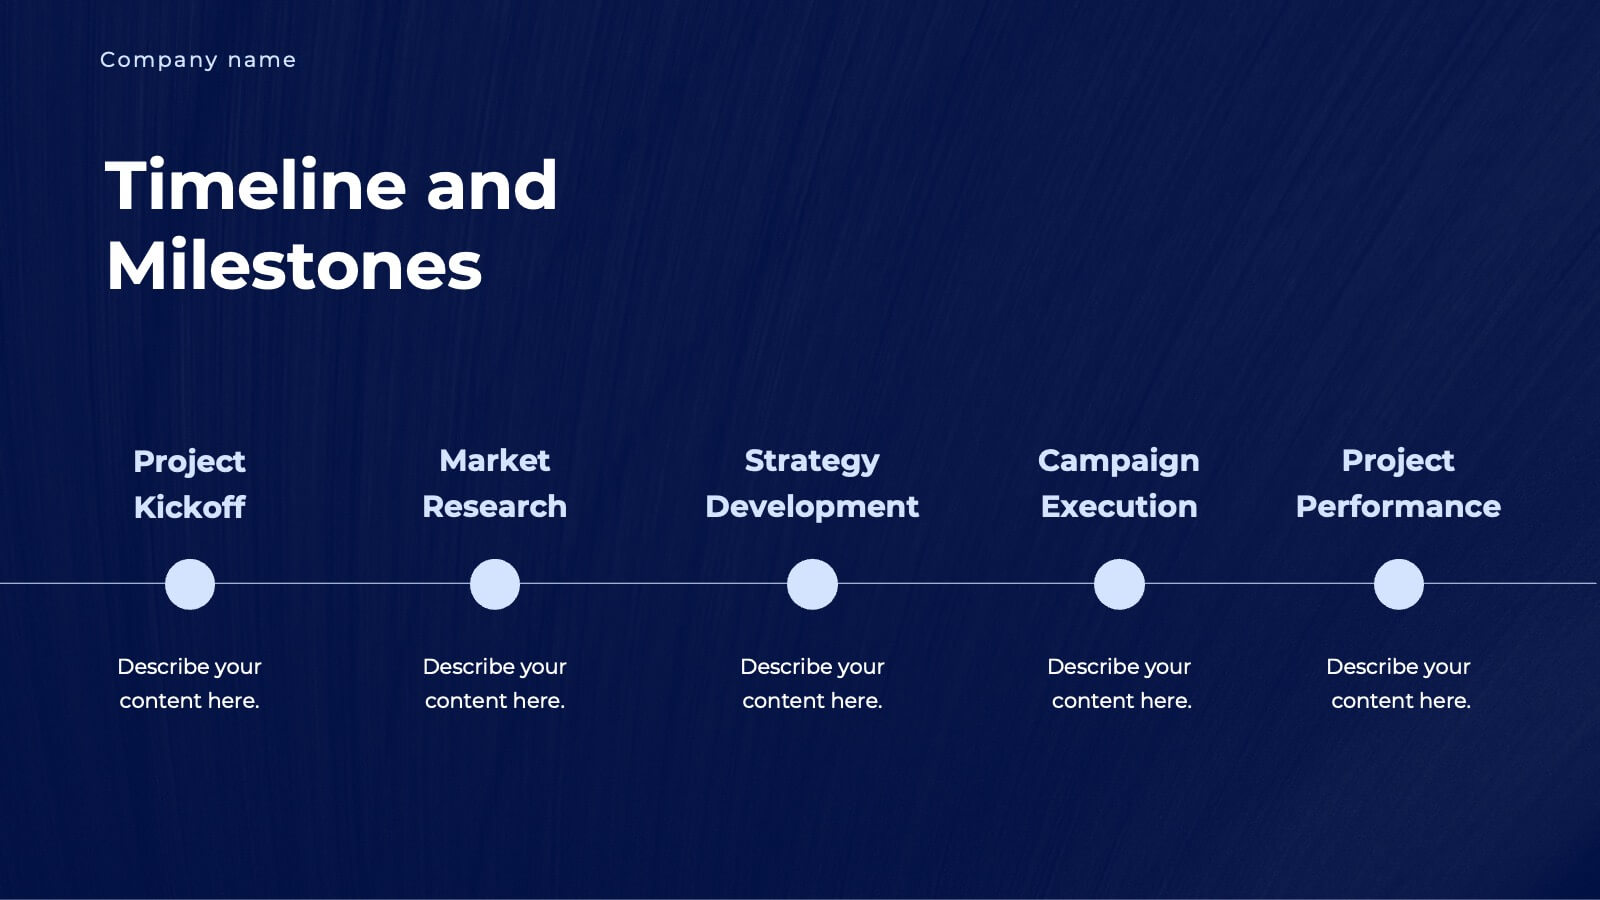
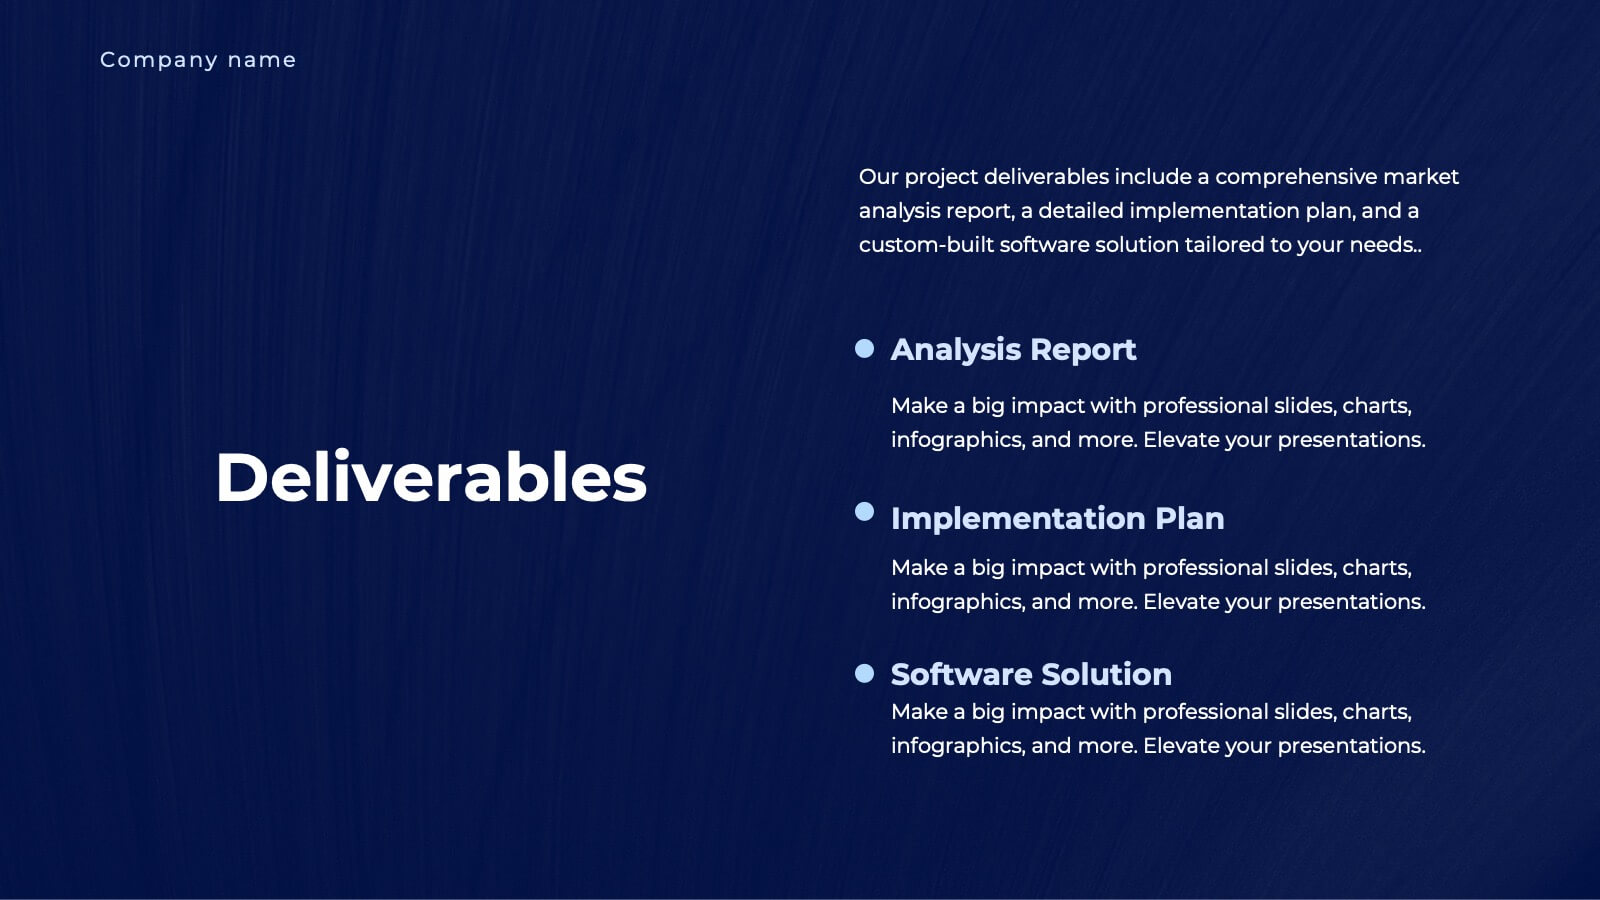
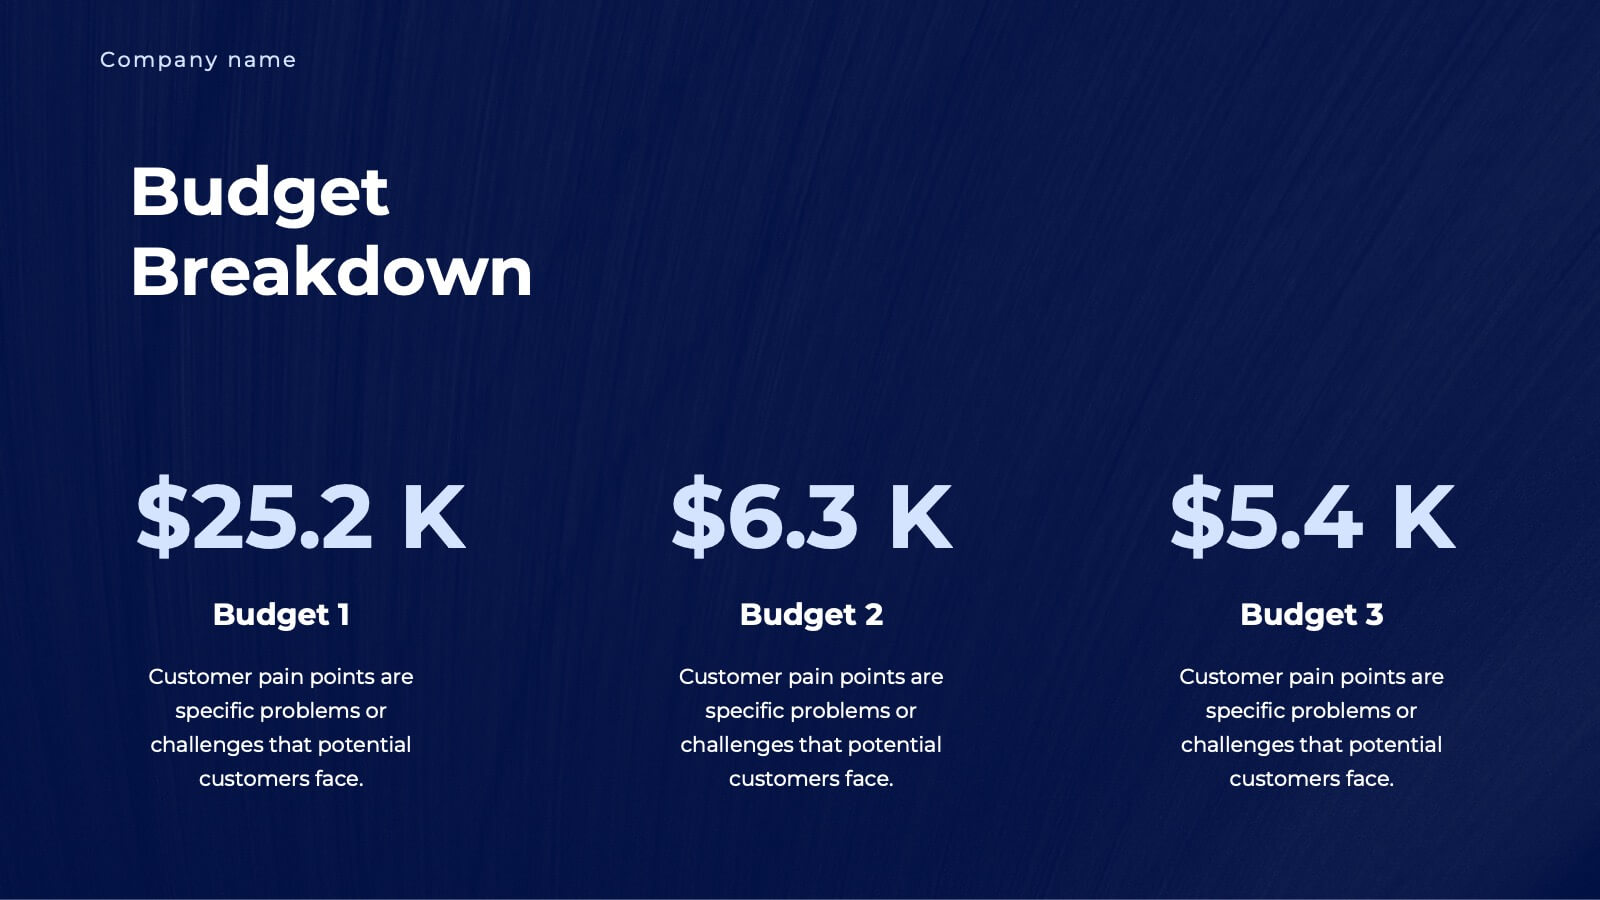
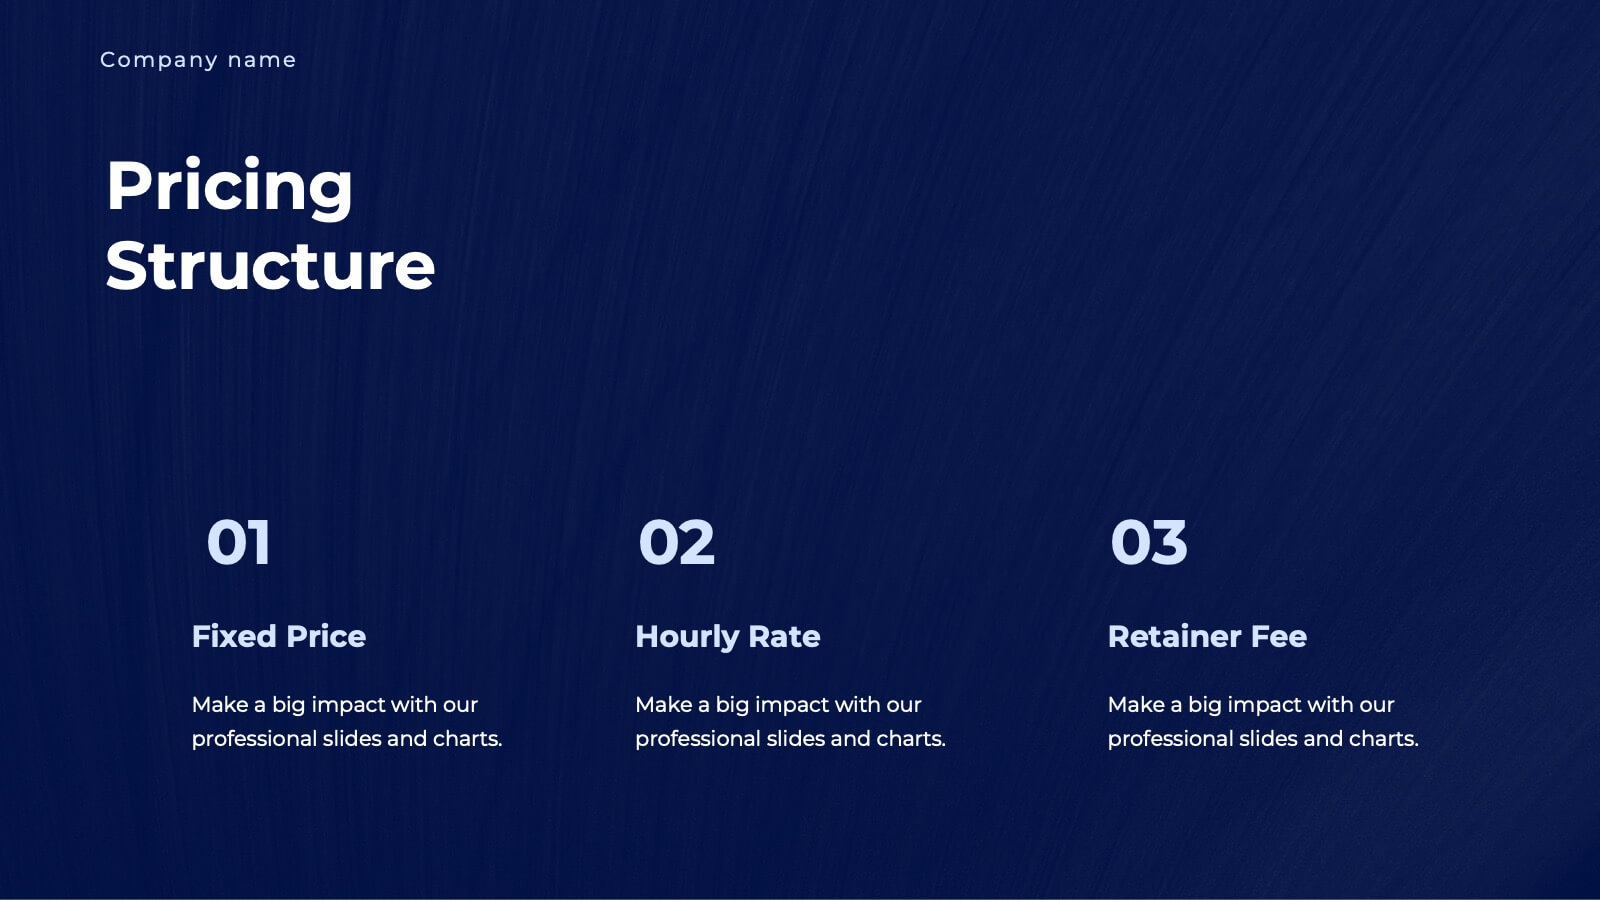
Beacon Content Marketing Pitch Deck Presentation
Ignite your marketing strategies with this dynamic and sleek content marketing pitch deck! Filled with modern design and comprehensive insights, this template is perfect for showcasing trends, influencer marketing, and emerging technologies. Make your brand's story stand out while captivating your audience. Fully compatible with PowerPoint, Keynote, and Google Slides!