


Características


¿Tienes alguna pregunta?
Recomendar


10 diapositivas
Customer Conversion Funnel Presentation
Optimize your customer journey presentations with our "Customer Conversion Funnel Presentation" template. This infographic elegantly depicts the conversion process across distinct stages, using a funnel design that visually narrows from awareness to action. Each segment is clearly labeled, simplifying the task of presenting strategies to enhance each phase of the customer experience. Ideal for marketers, sales teams, and strategists, this template helps clarify customer behavior and improve conversion rates. It’s a vital tool for any business focused on customer engagement and optimization. Fully compatible with PowerPoint, Keynote, and Google Slides, this template is crucial for effective communication and strategic planning.


7 diapositivas
Science Research Infographic
Science research, is a systematic and organized inquiry that aims to generate new knowledge, validate existing knowledge, or solve specific problems using scientific methods and principles. This infographic template aims to present your science research initiatives, achievements, and vision to the audience in an engaging and informative way. This is essential to convey complex scientific data and discoveries in a visually appealing manner. Fully customizable and compatible with Powerpoint, Keynote, and Google Slides. Adapt and personalize the content to align with your specific research center's focus and mission.


8 diapositivas
Data Analytics Dashboard Slide Presentation
Turn raw data into visual insights with this clean and modern layout designed to simplify analytics reporting. Perfect for tracking performance metrics, KPIs, and progress updates, it helps make numbers easy to understand at a glance. Fully customizable and compatible with PowerPoint, Keynote, and Google Slides for effortless editing.


5 diapositivas
Space Science Infographics
Space science, also known as astronomy, is the scientific study of celestial objects, phenomena, and the physical universe beyond Earth. These infographic templates explore various aspects of space science and astronomy. They are designed to present complex concepts and data in a visually engaging format, making it accessible to a wide range of audiences. These infographics incorporate stunning cosmic illustrations and visuals to represent celestial bodies, space phenomena, and scientific concepts related to space science. They covers a range of key topics in space science, such as black holes, the solar system, space exploration, and more.


5 diapositivas
3-Level Concentric Diagram Presentation
Bring clarity and structure to your ideas with a clean, layered diagram design that simplifies complex concepts. Perfect for showcasing stages, hierarchies, or interconnected systems, it keeps your audience engaged with visual balance and flow. Fully compatible with PowerPoint, Keynote, and Google Slides for effortless customization and presentation flexibility.


7 diapositivas
Thank You Message Infographic
Express gratitude with flair using this vibrant template, perfect for crafting messages that leave a lasting impression. Each slide is designed with a combination of bold colors, modern typography, and creative layouts, ensuring your thanks stands out. Tailor these slides to any occasion by adjusting the design to suit your unique style or corporate branding. This template is ideal for expressing appreciation in various contexts—whether thanking a team for their hard work, acknowledging a client's loyalty, or showing gratitude to participants at an event. Its versatility makes it suitable for digital or print formats, from email campaigns to thank you cards. Enhance your messages of thanks with a personal touch, ensuring they resonate more deeply with recipients. This approach not only communicates gratitude but also strengthens relationships with a professional and polished presentation.


27 diapositivas
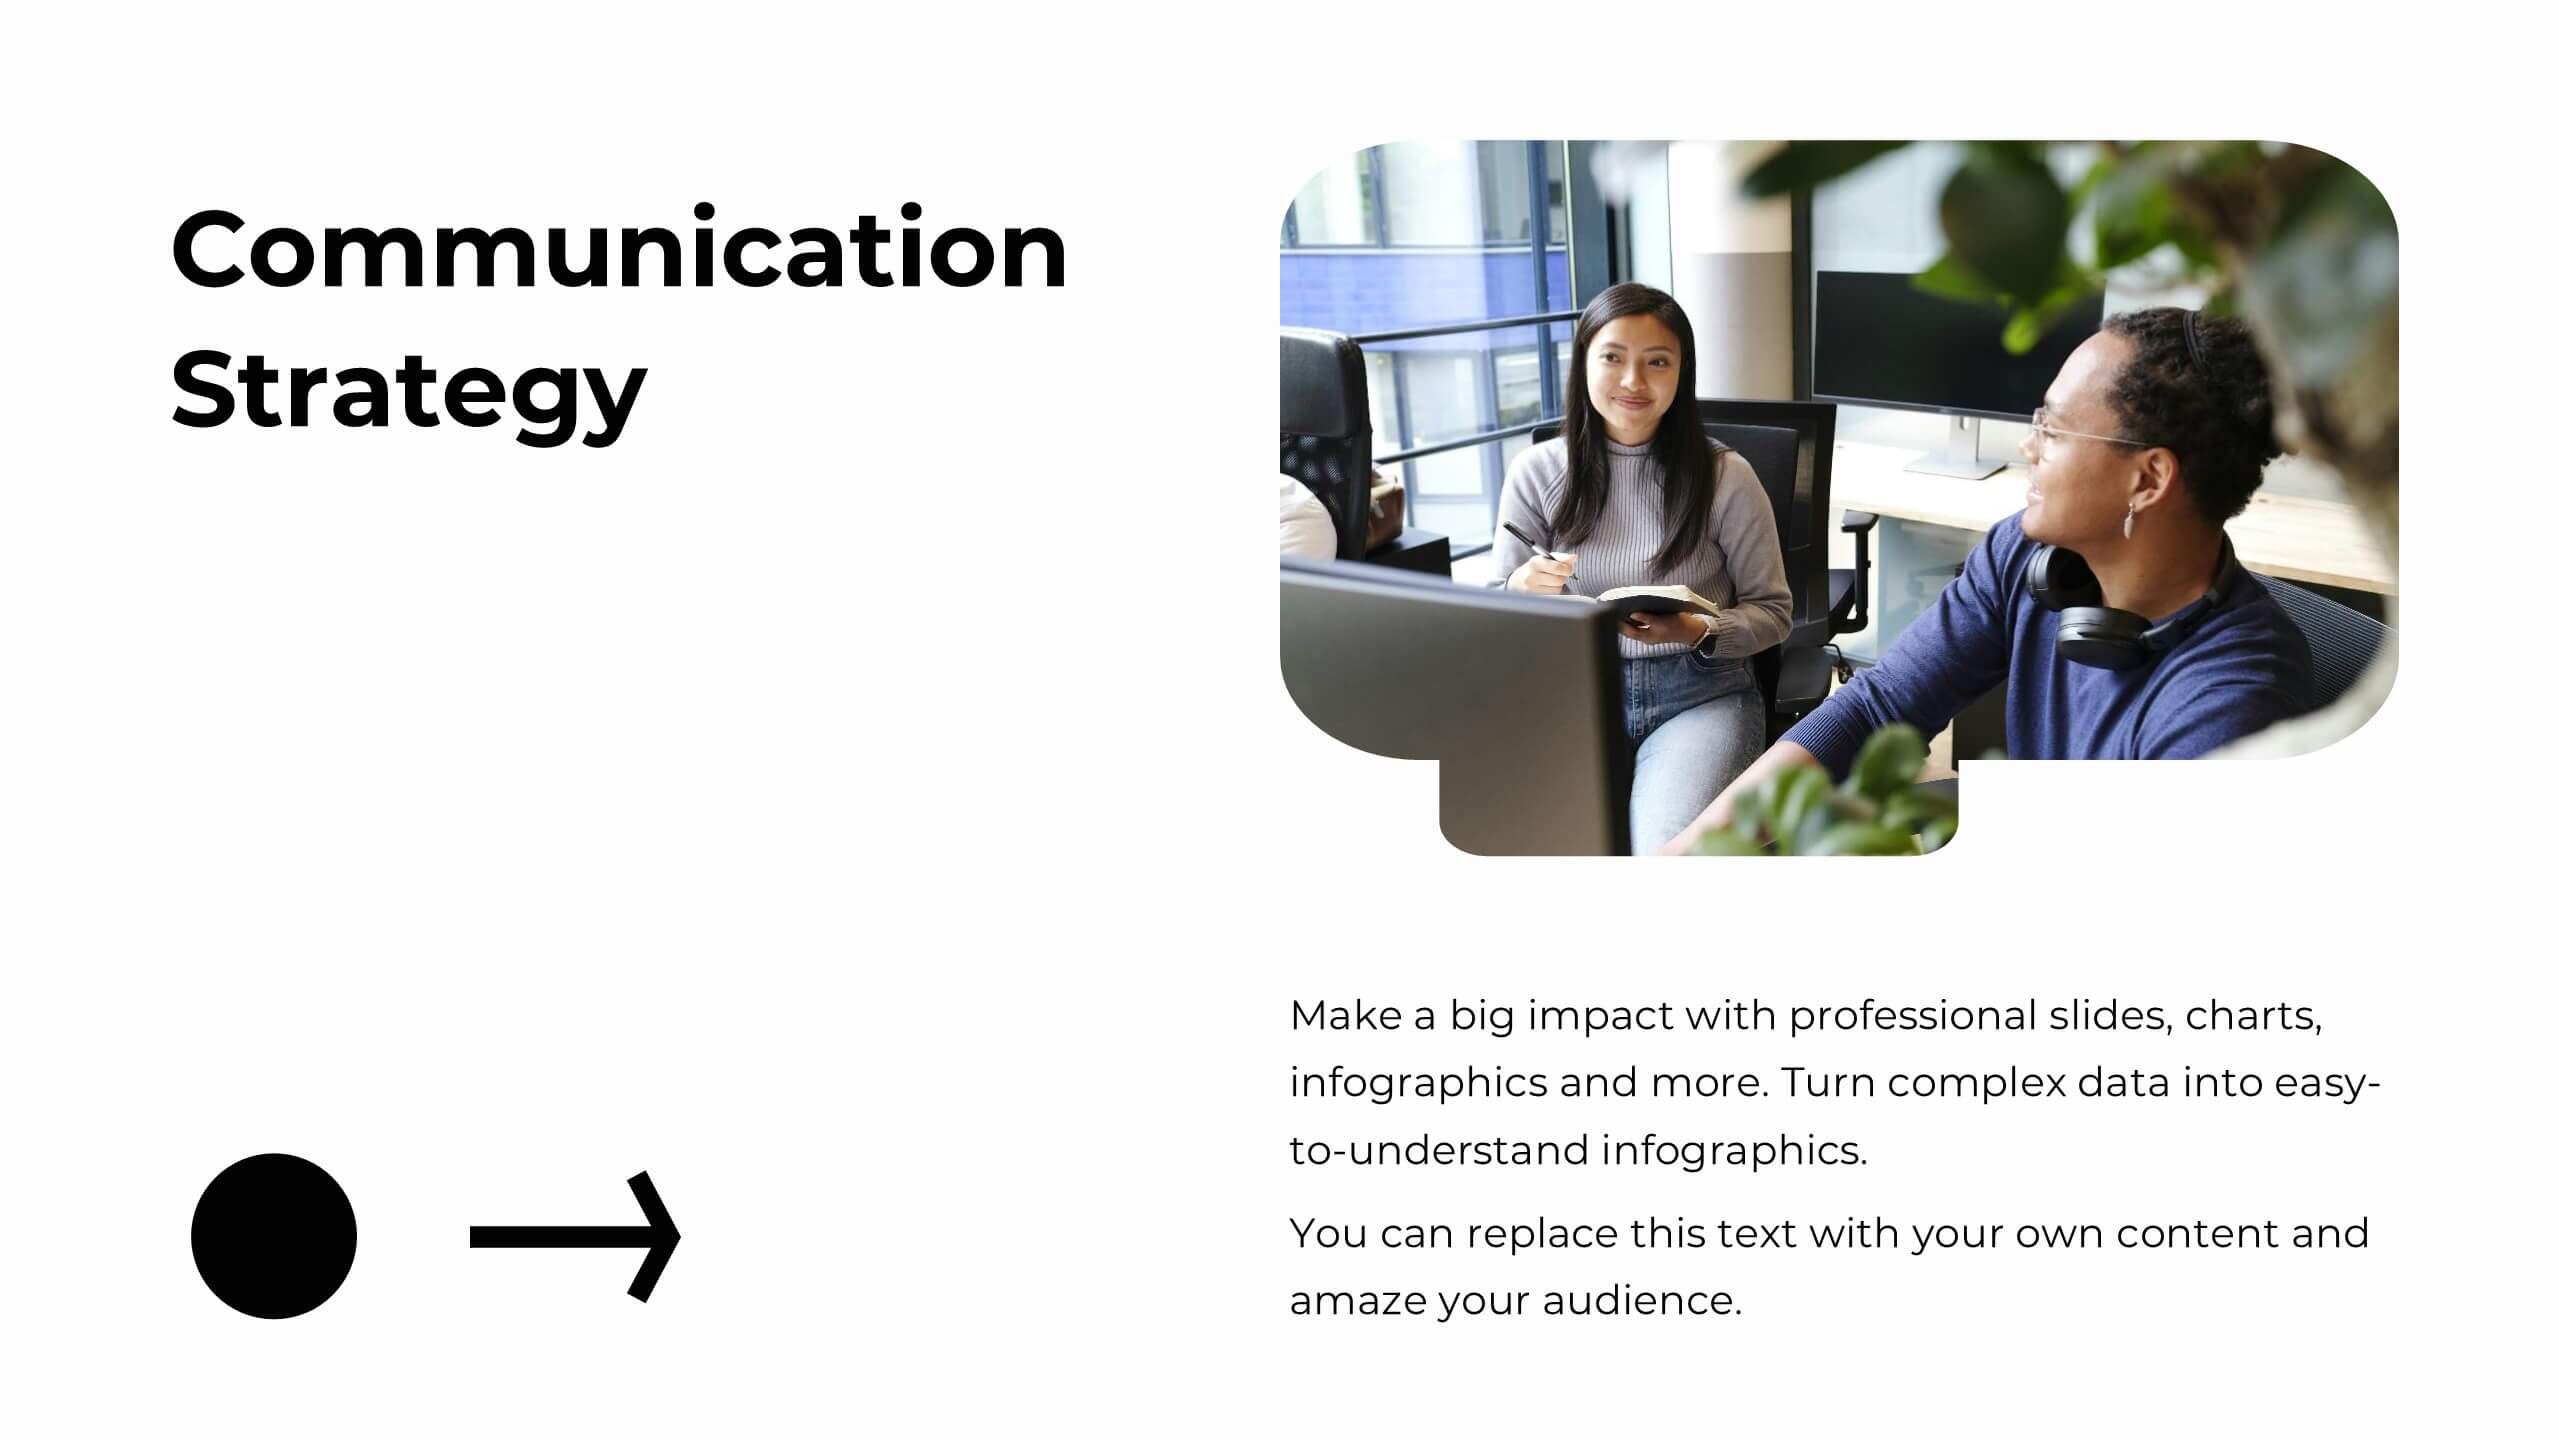
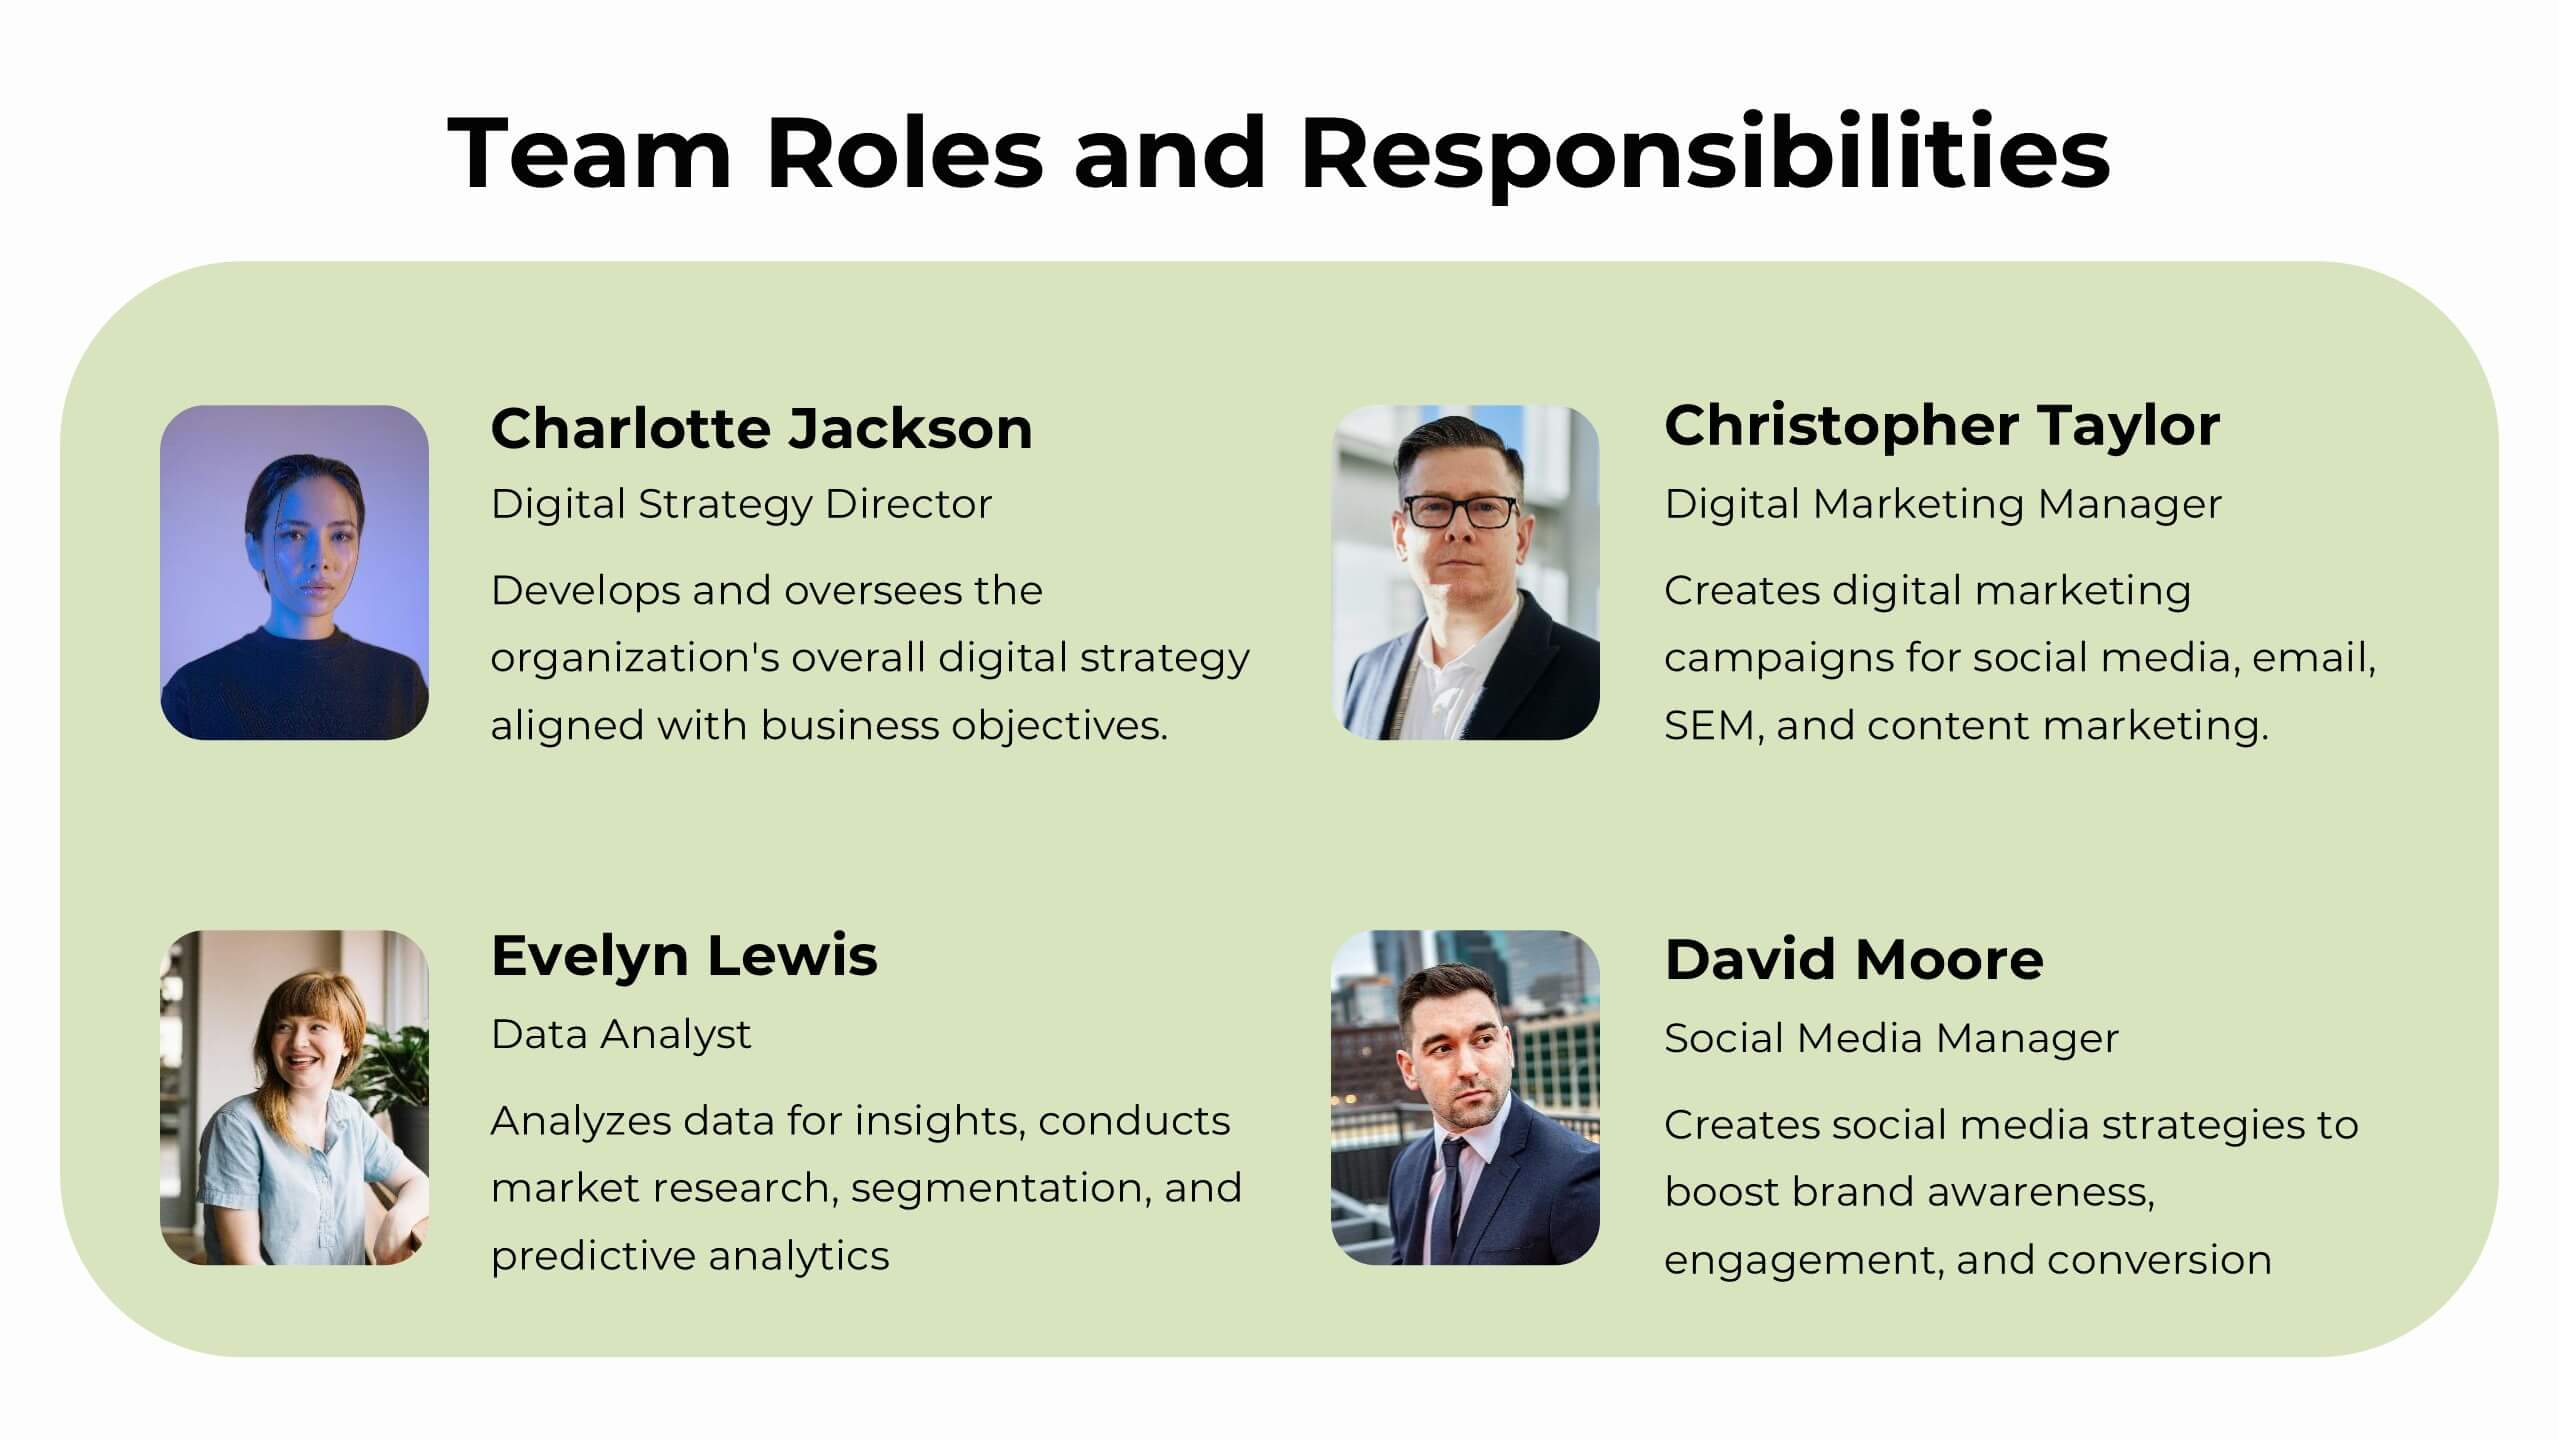
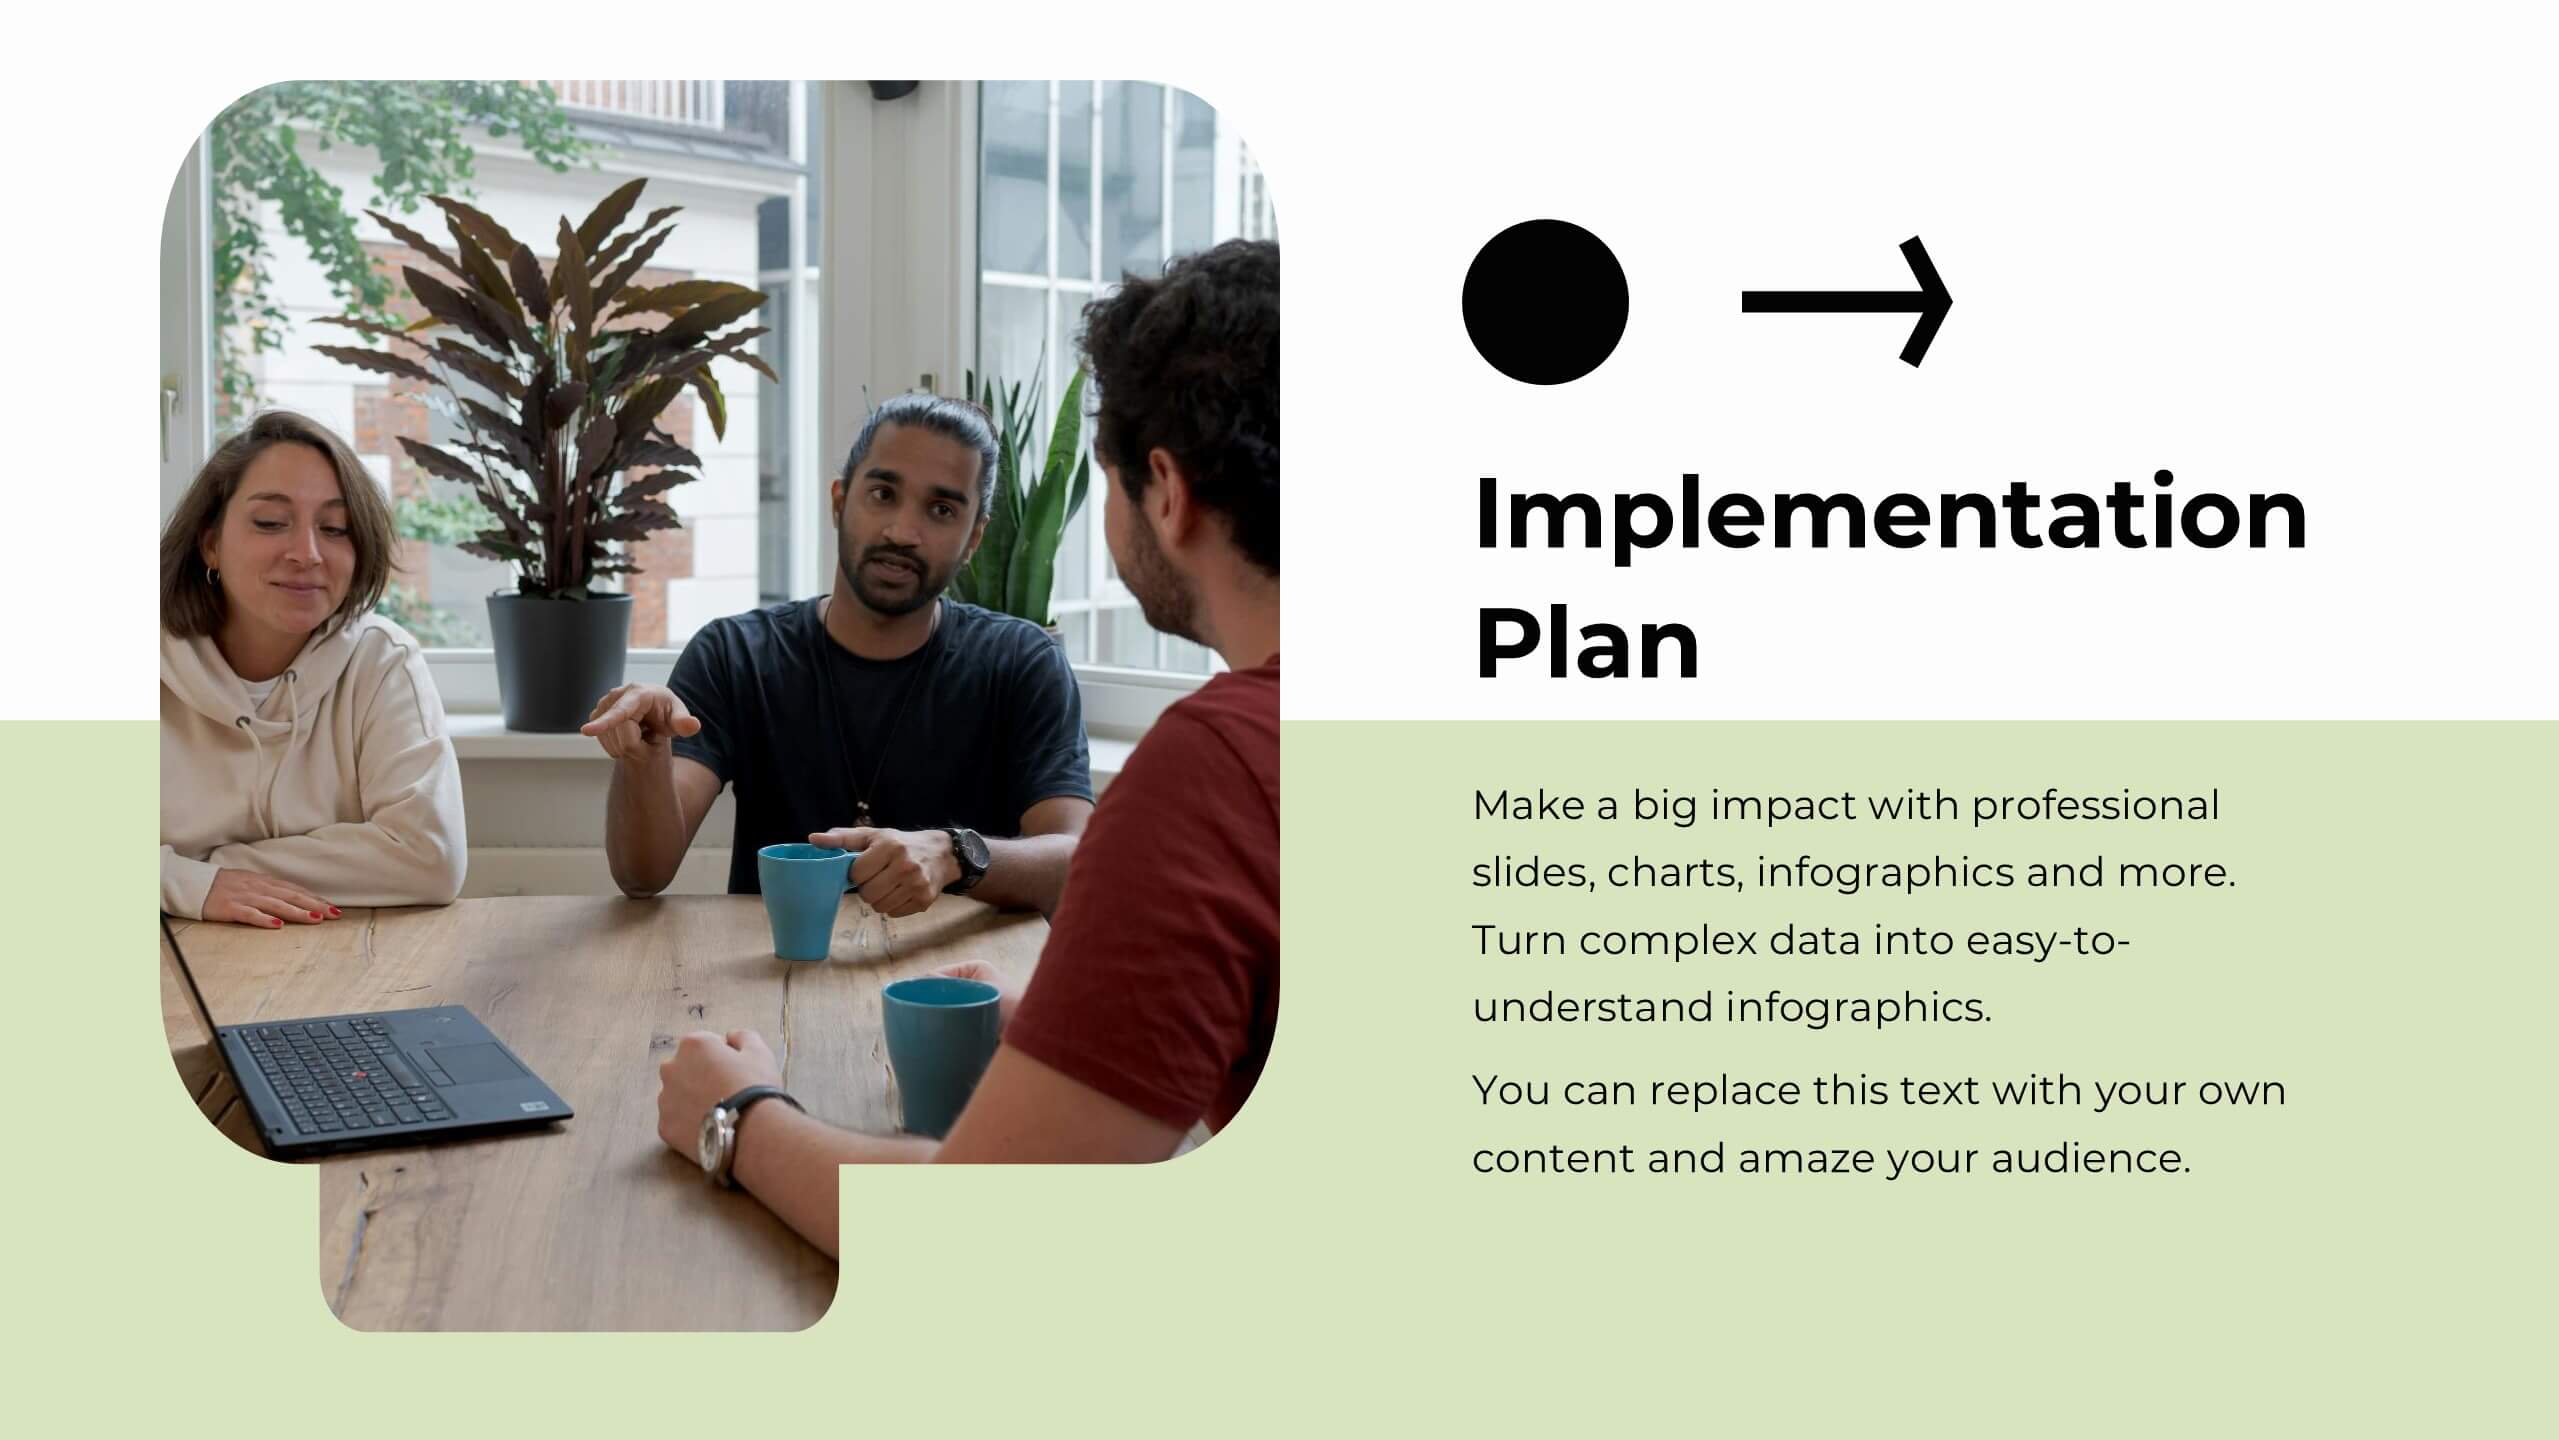
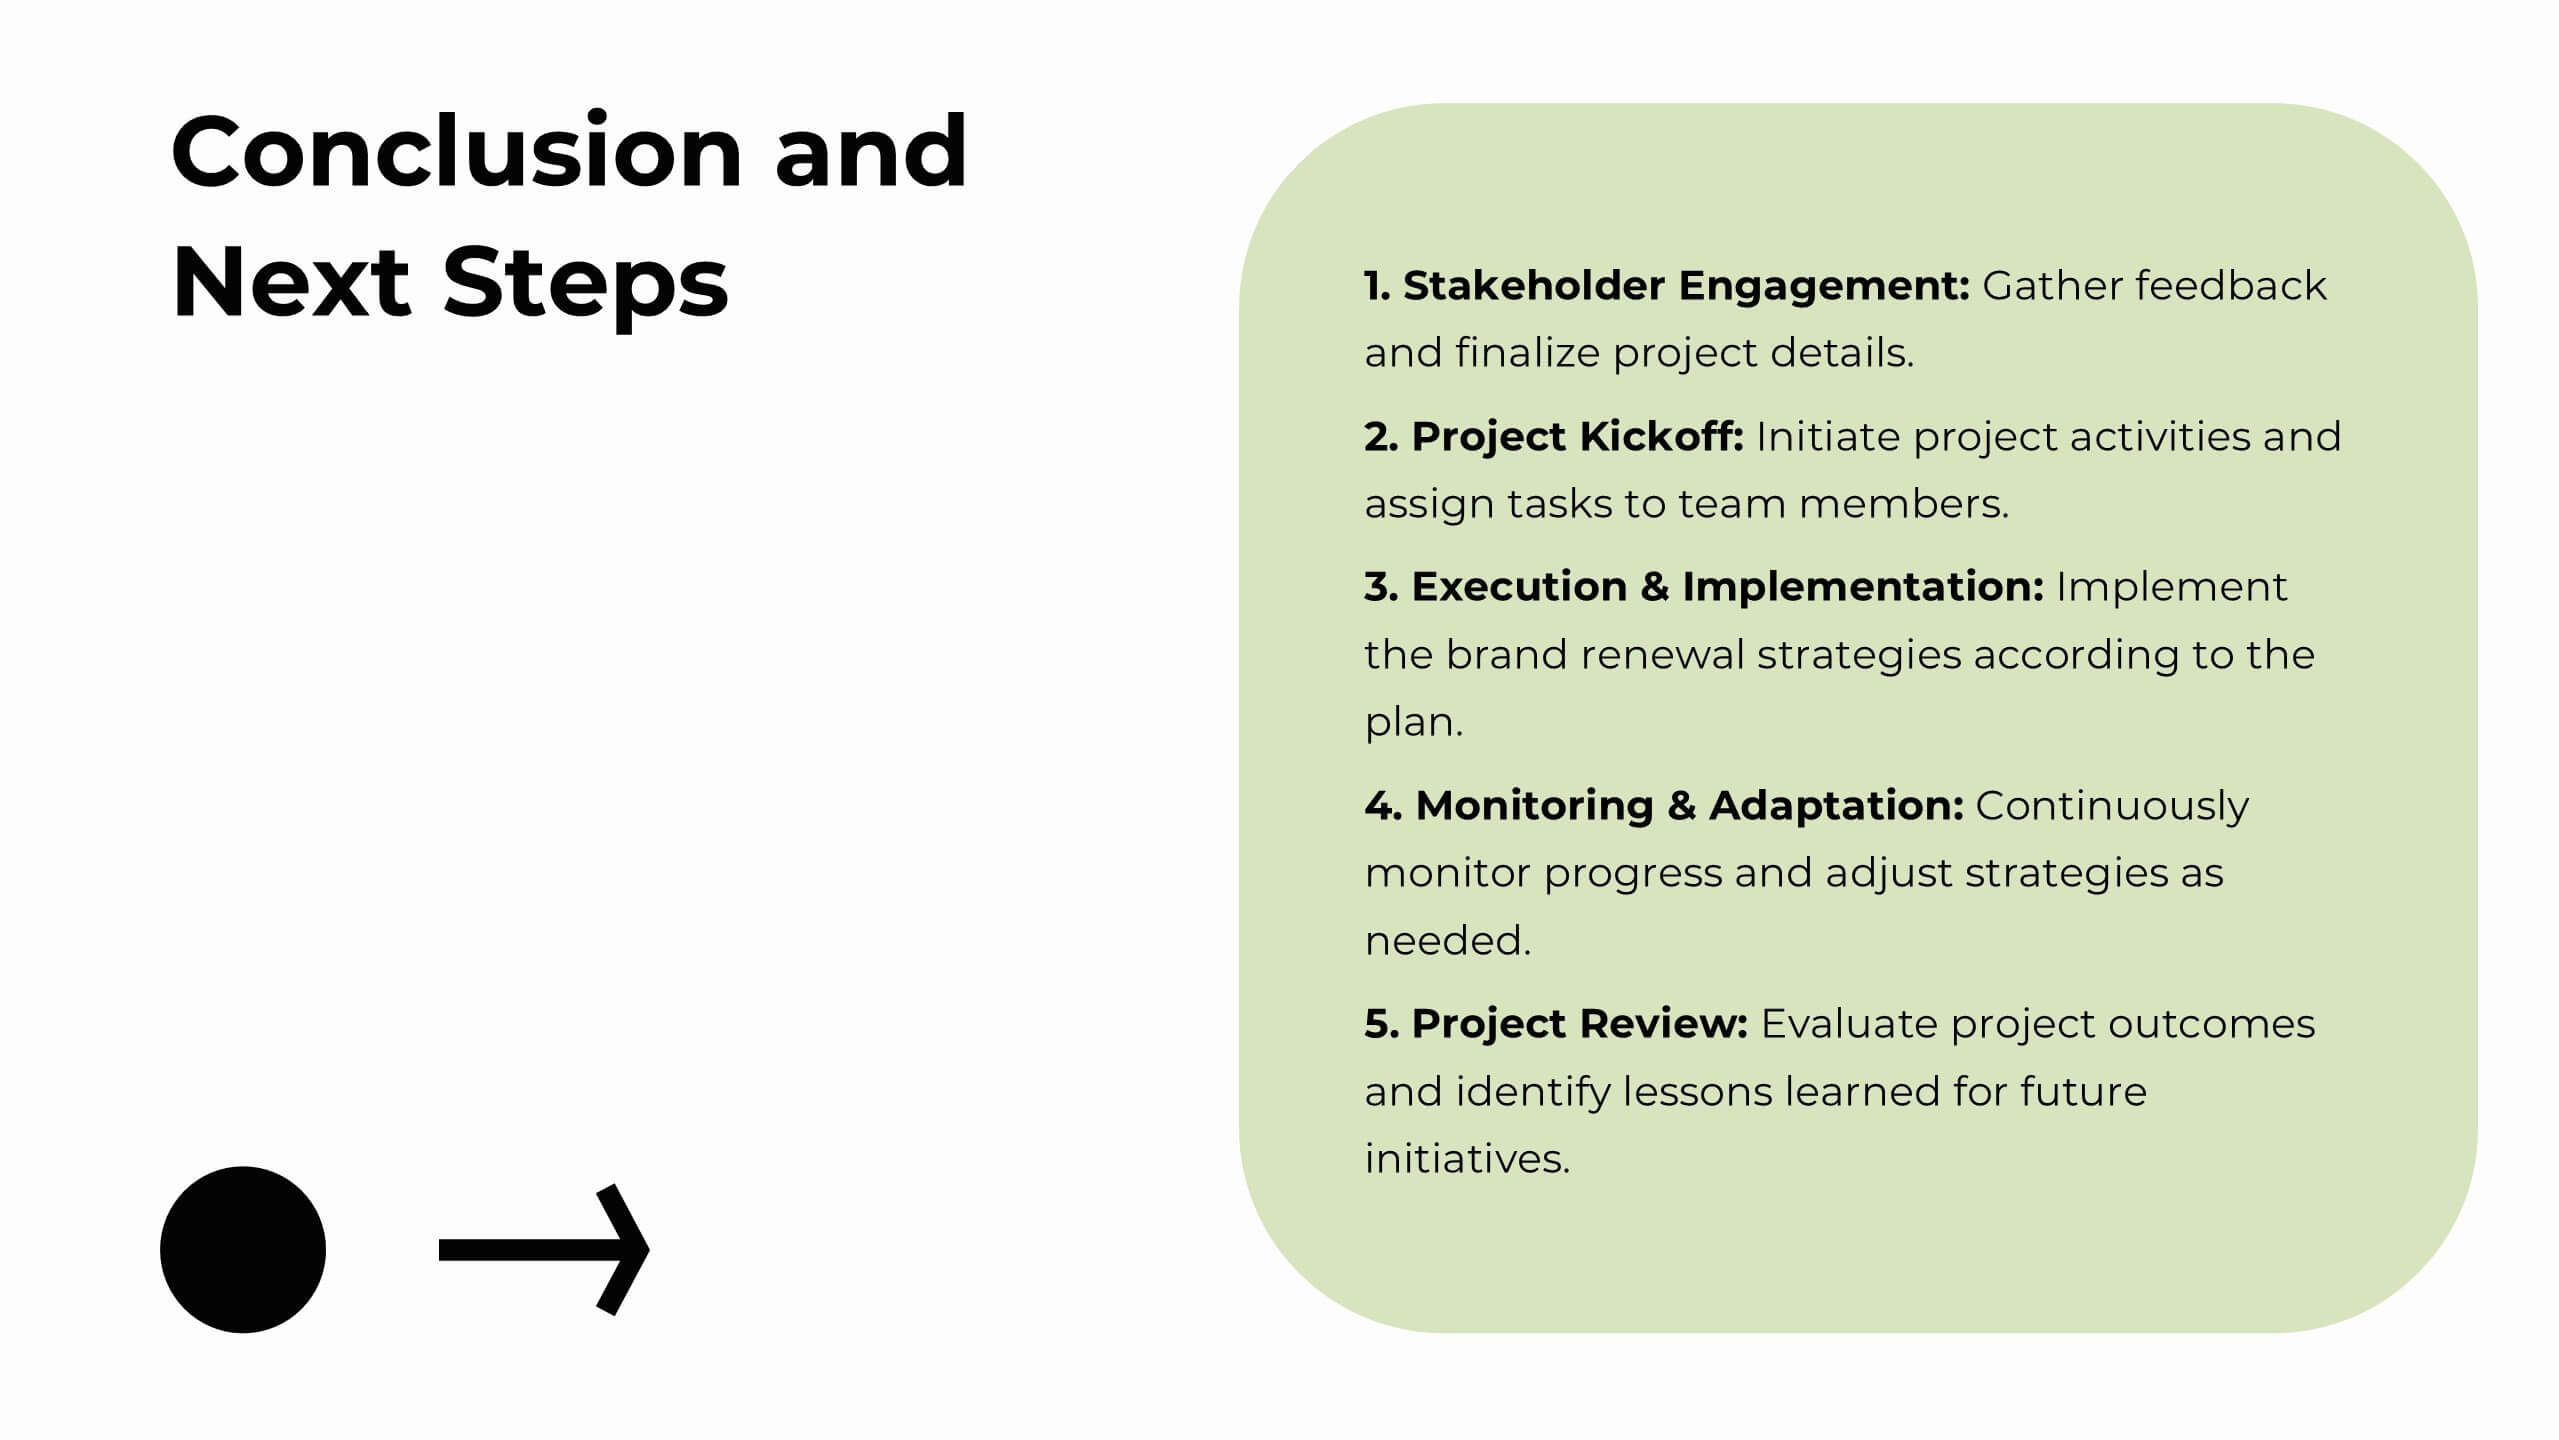
Drift Rebranding Project Plan Presentation
Transform your brand with this comprehensive rebranding project template! Perfect for presenting brand identity, market analysis, and strategic positioning, it includes slides for logos, color palettes, and brand guidelines. Engage your audience with visually striking designs and detailed content. Compatible with PowerPoint, Keynote, and Google Slides for easy, professional presentations on any platform.


6 diapositivas
Startup Investors Pitch Deck Presentation
Inspire confidence and spark investor interest with the Startup Investor Pitch Deck Presentation. Featuring a creative visual of a rocket launching from a piggy bank, this slide is ideal for illustrating funding momentum, business growth, or financial milestones. Each section allows space to highlight critical investment points such as traction, market opportunity, financials, and team highlights. Fully customizable in PowerPoint, Keynote, or Google Slides, this pitch-ready layout is perfect for entrepreneurs, startup founders, and innovation teams aiming to deliver a memorable and professional presentation.


5 diapositivas
Editable Asia Region Map Slide Presentation
Explore data across countries with a sleek regional map designed to visualize insights and connections in a clear, professional way. Perfect for presenting market trends, business reach, or project highlights across Asia, this editable layout is fully compatible with PowerPoint, Keynote, and Google Slides for easy customization.

23 diapositivas
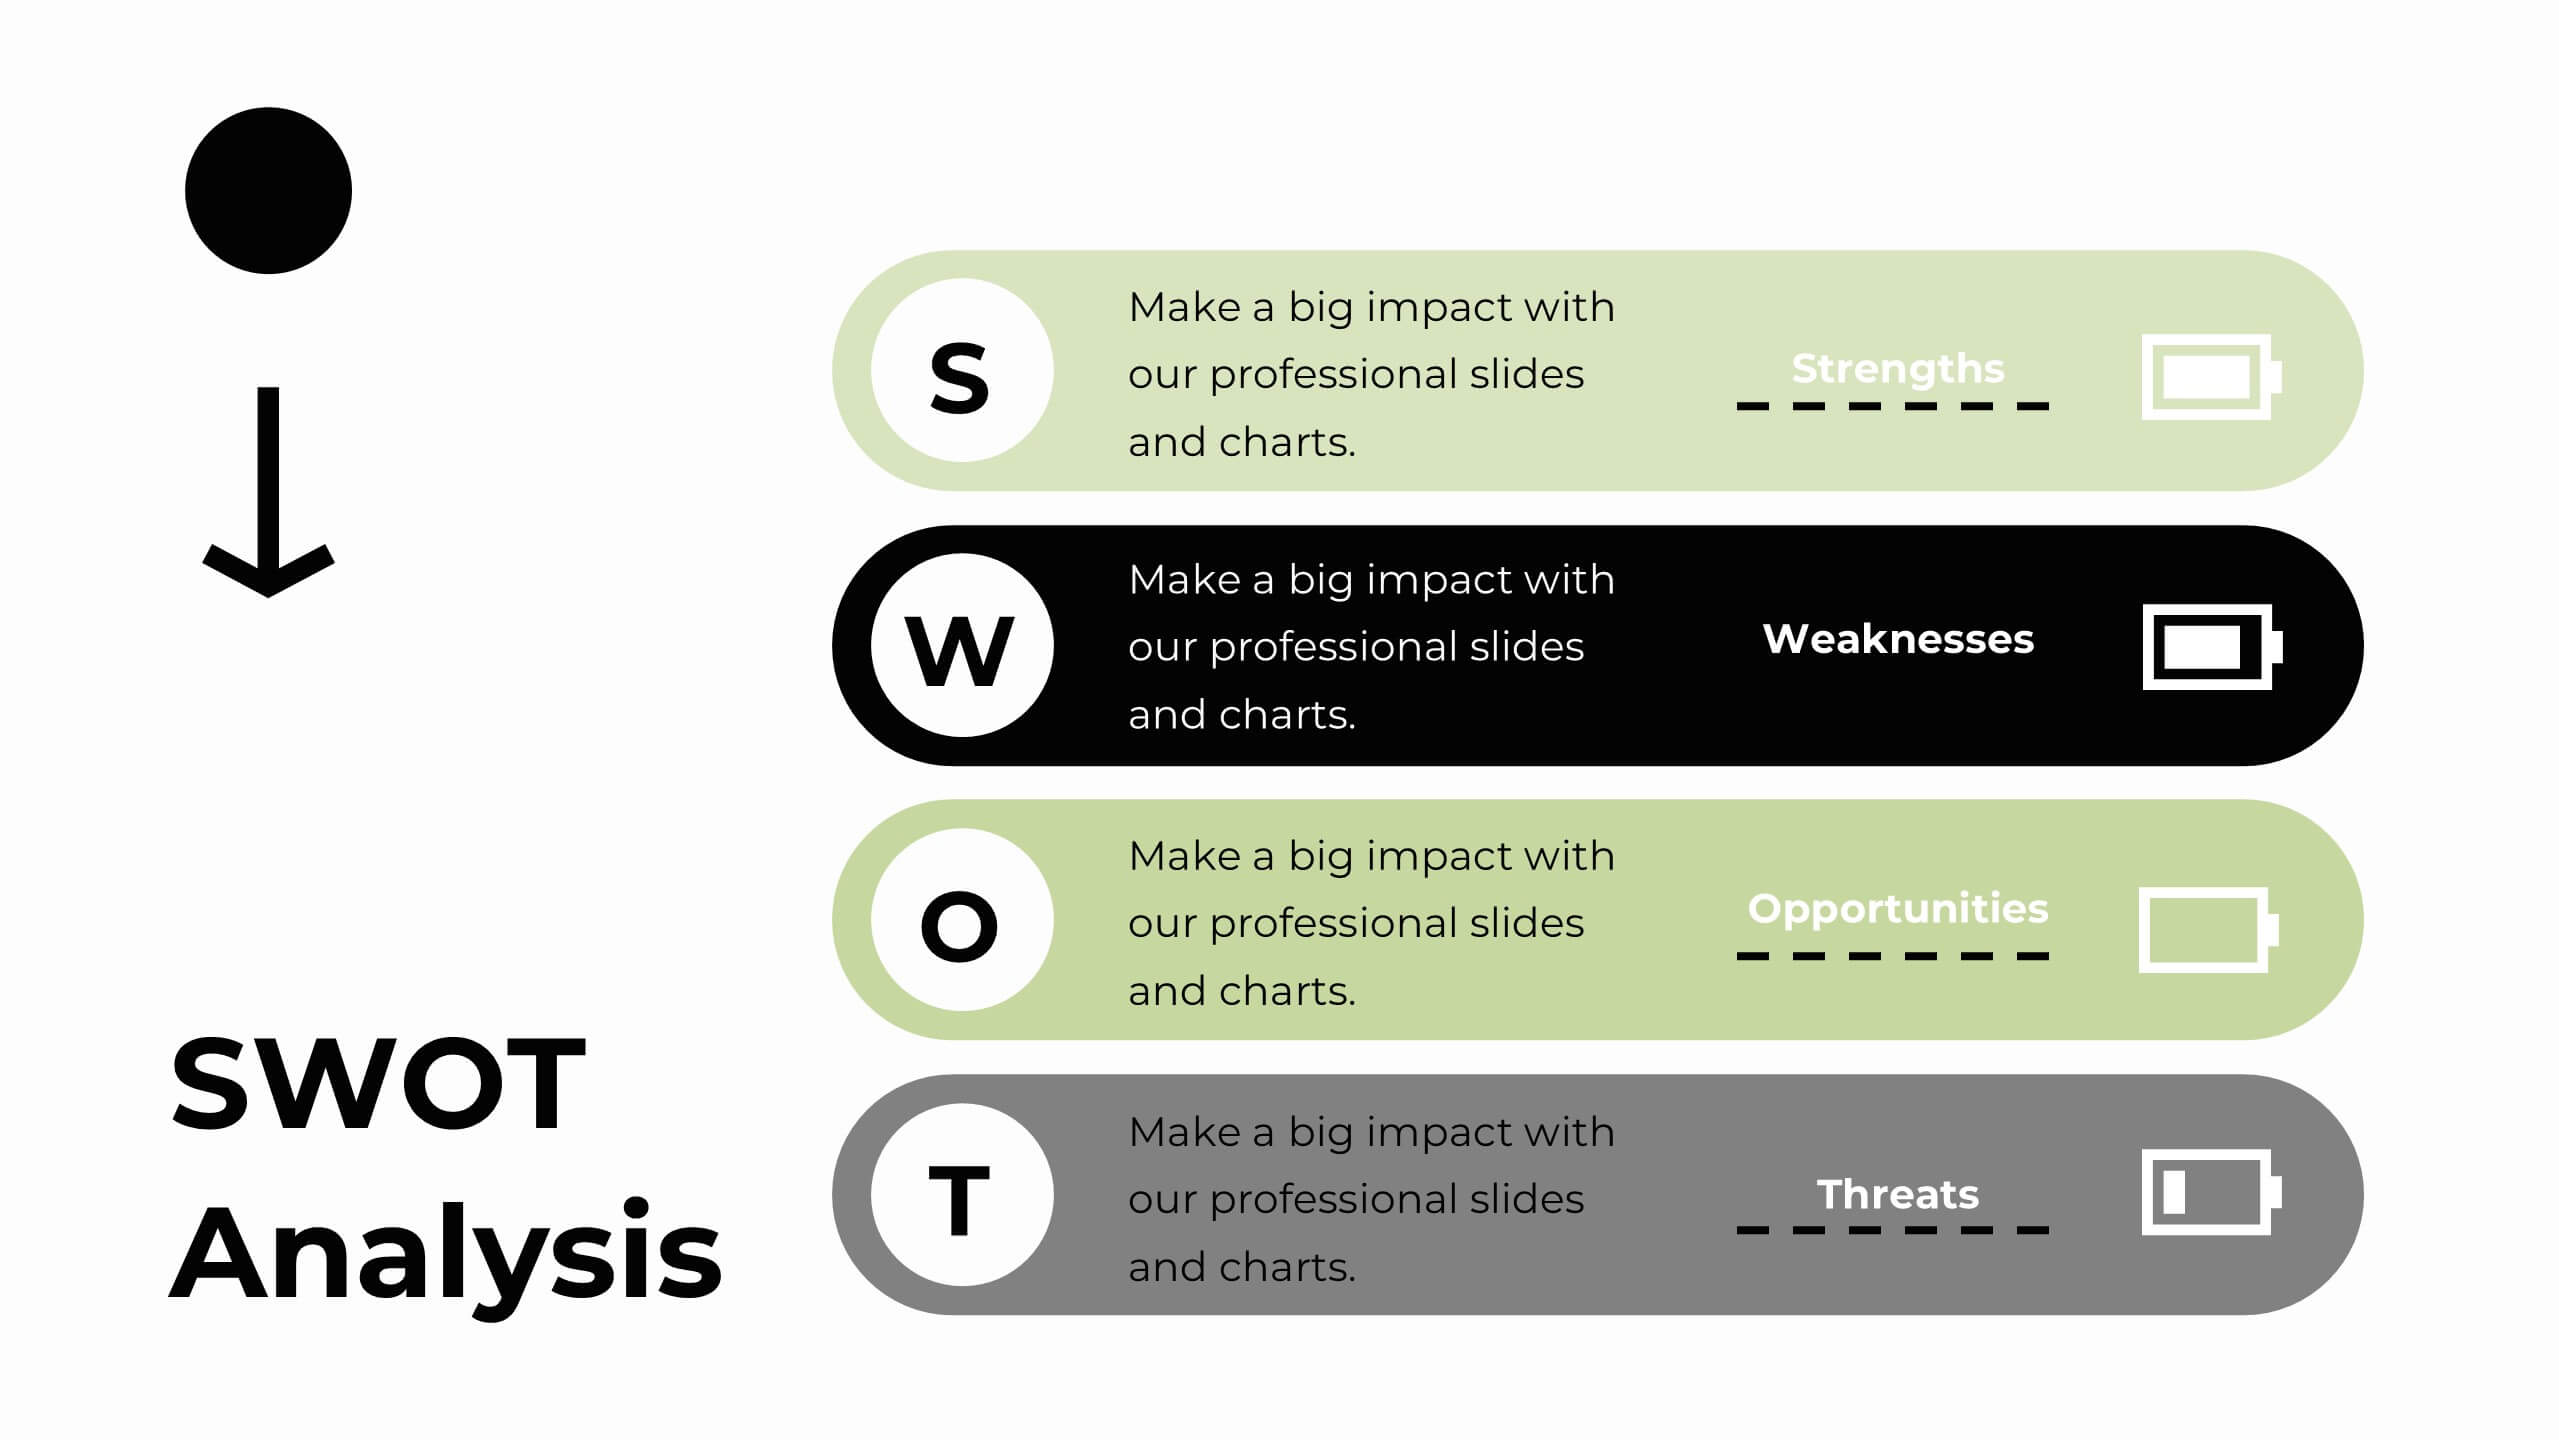
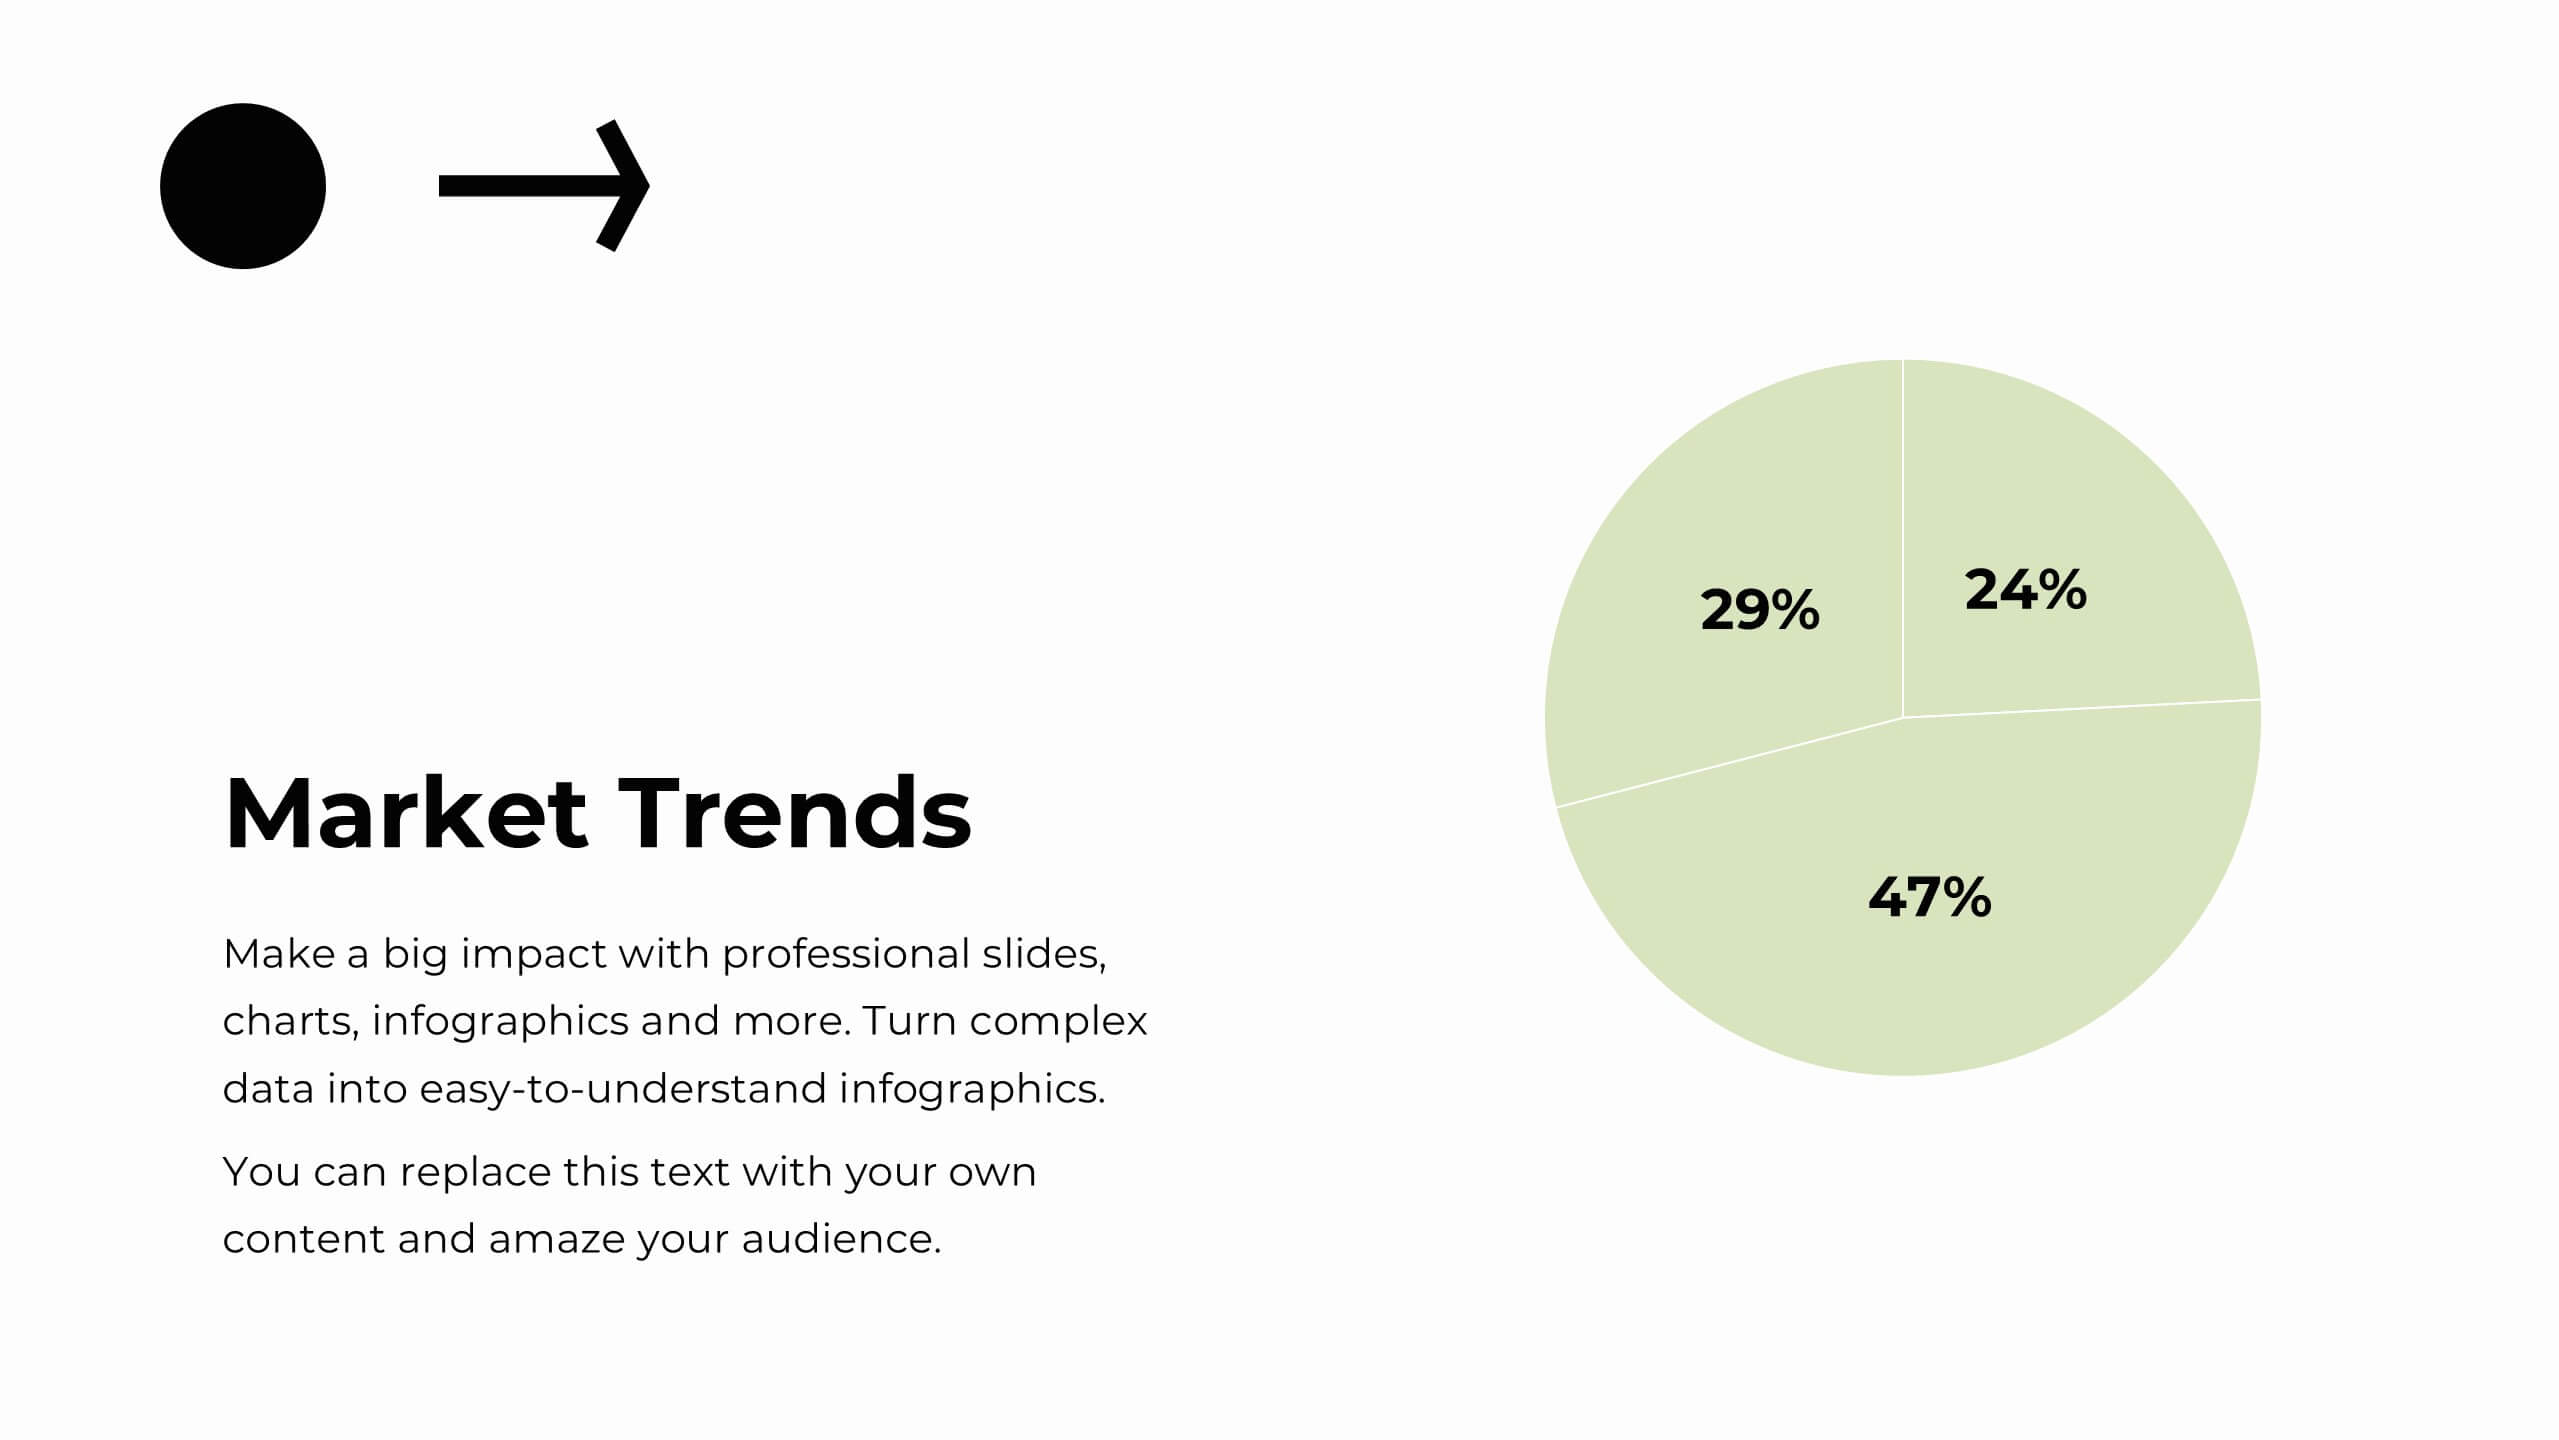
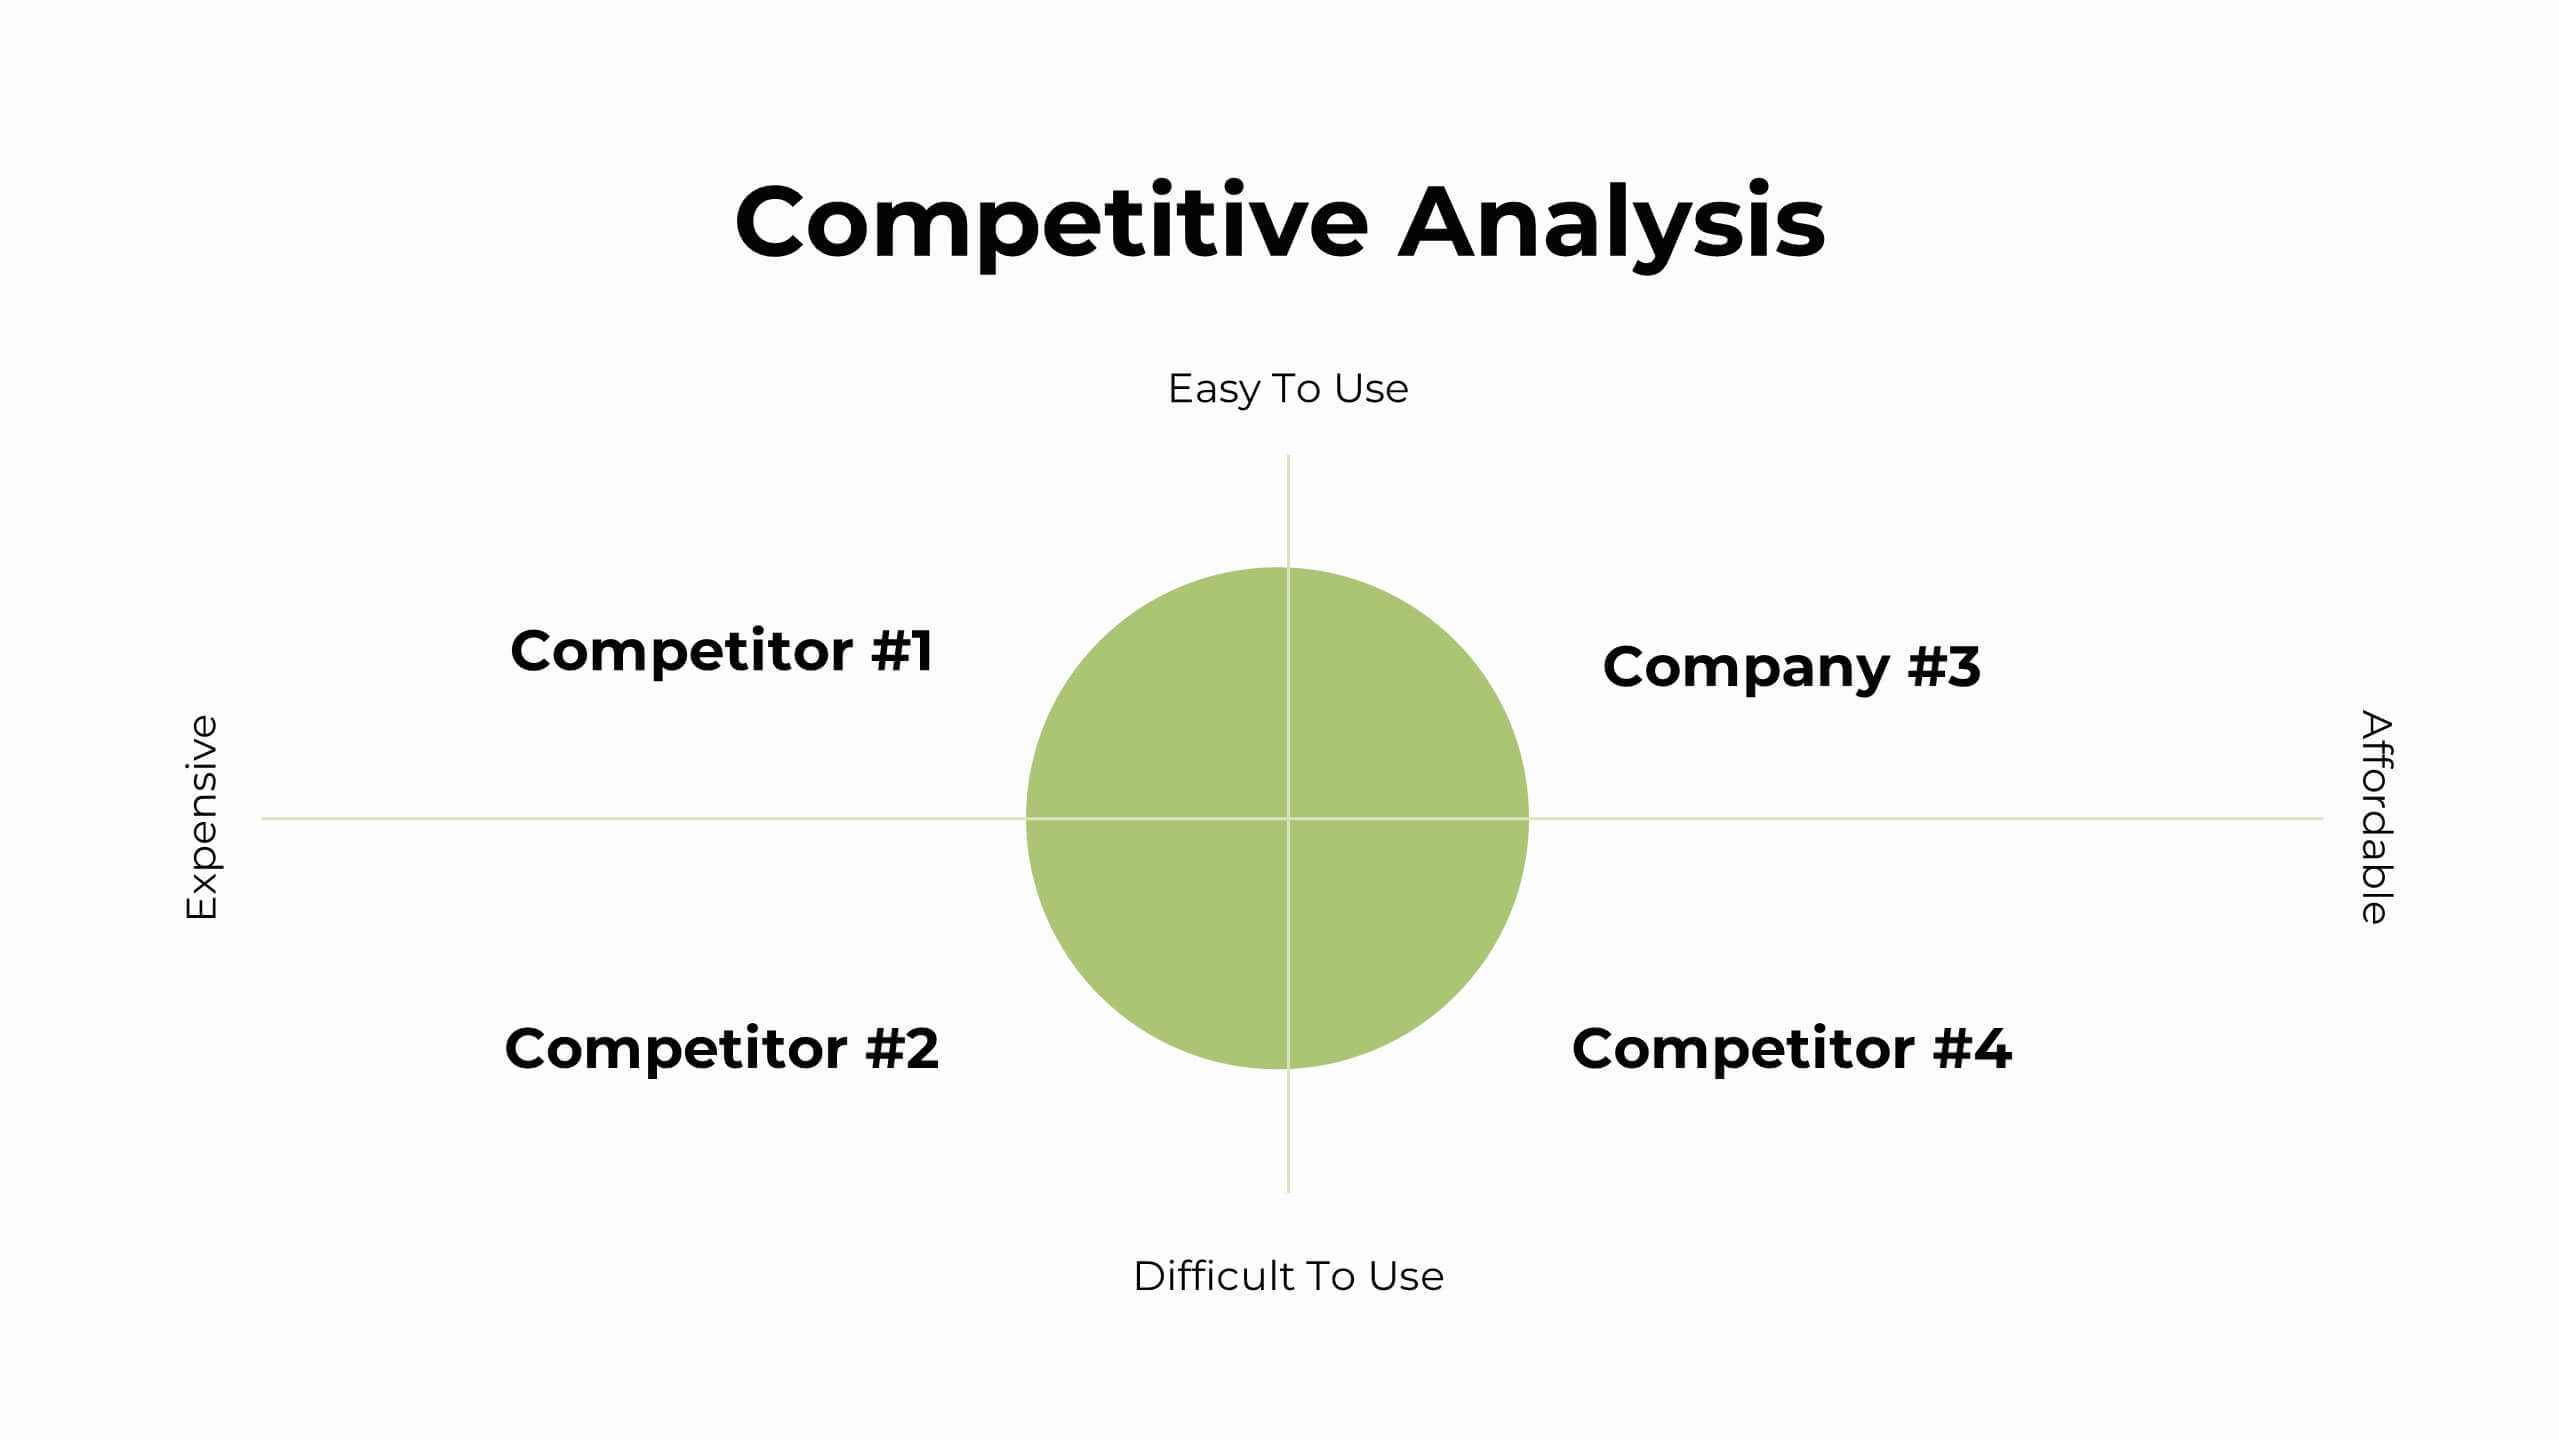
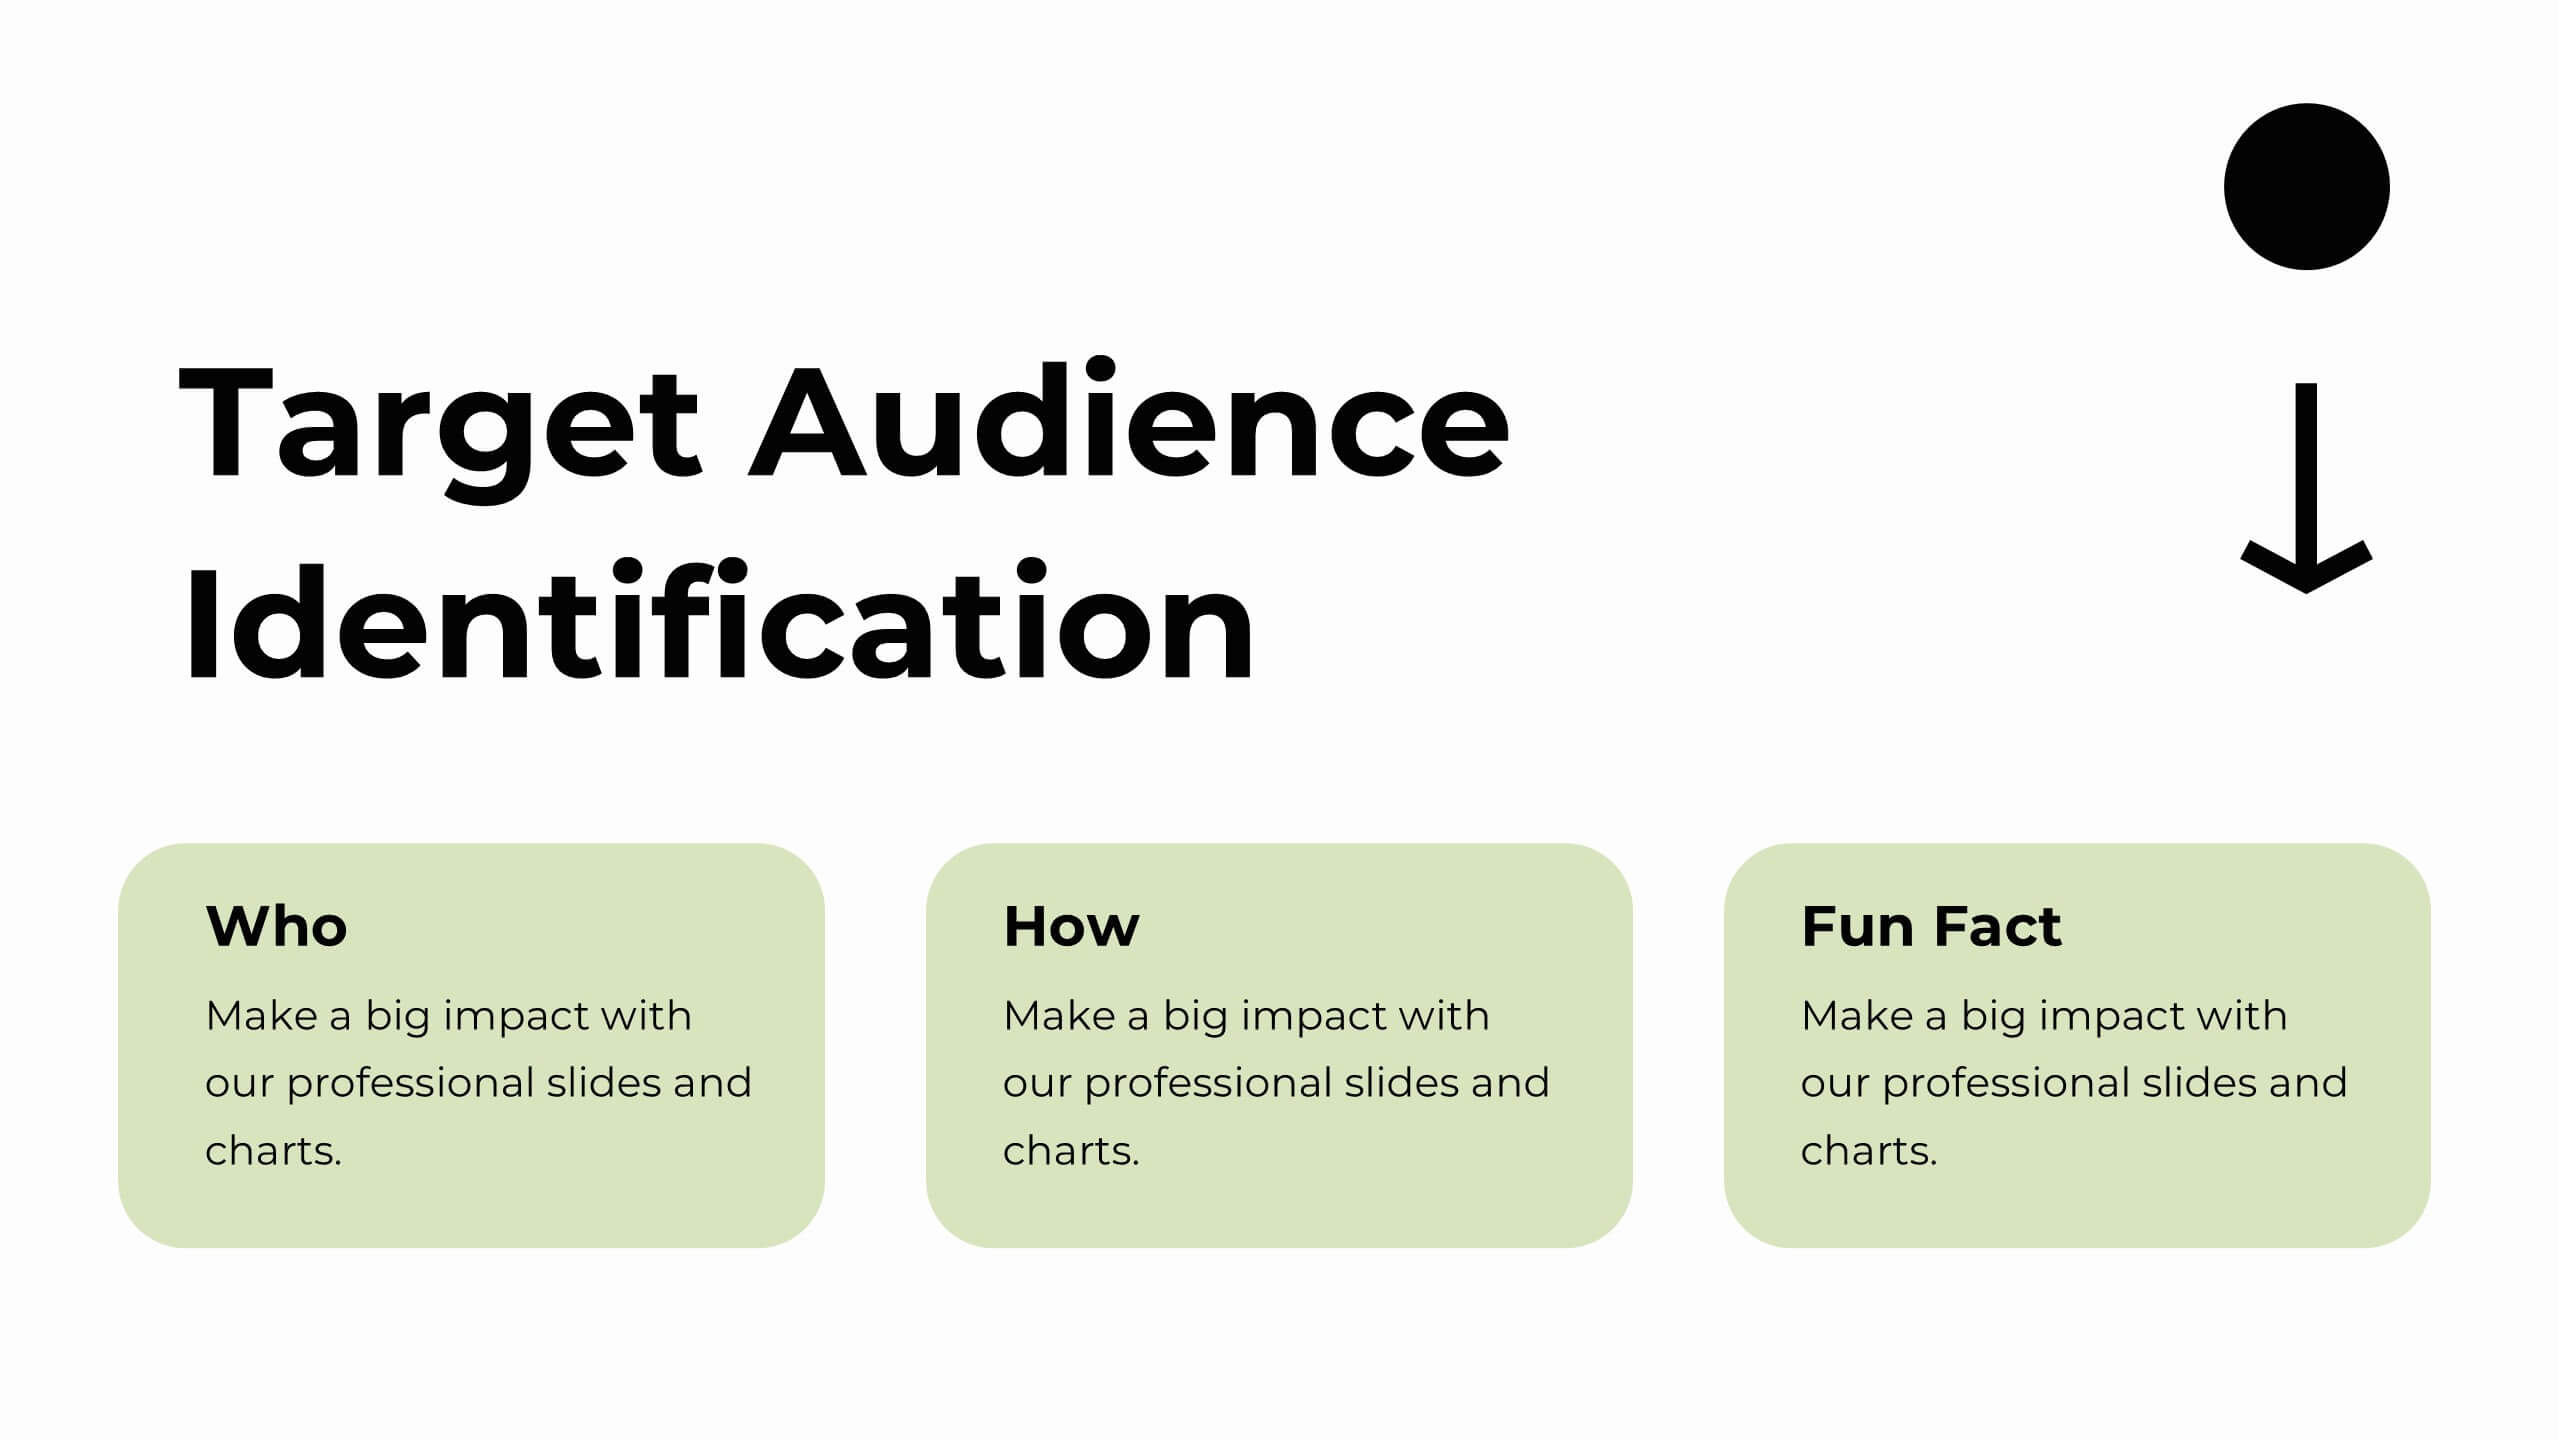
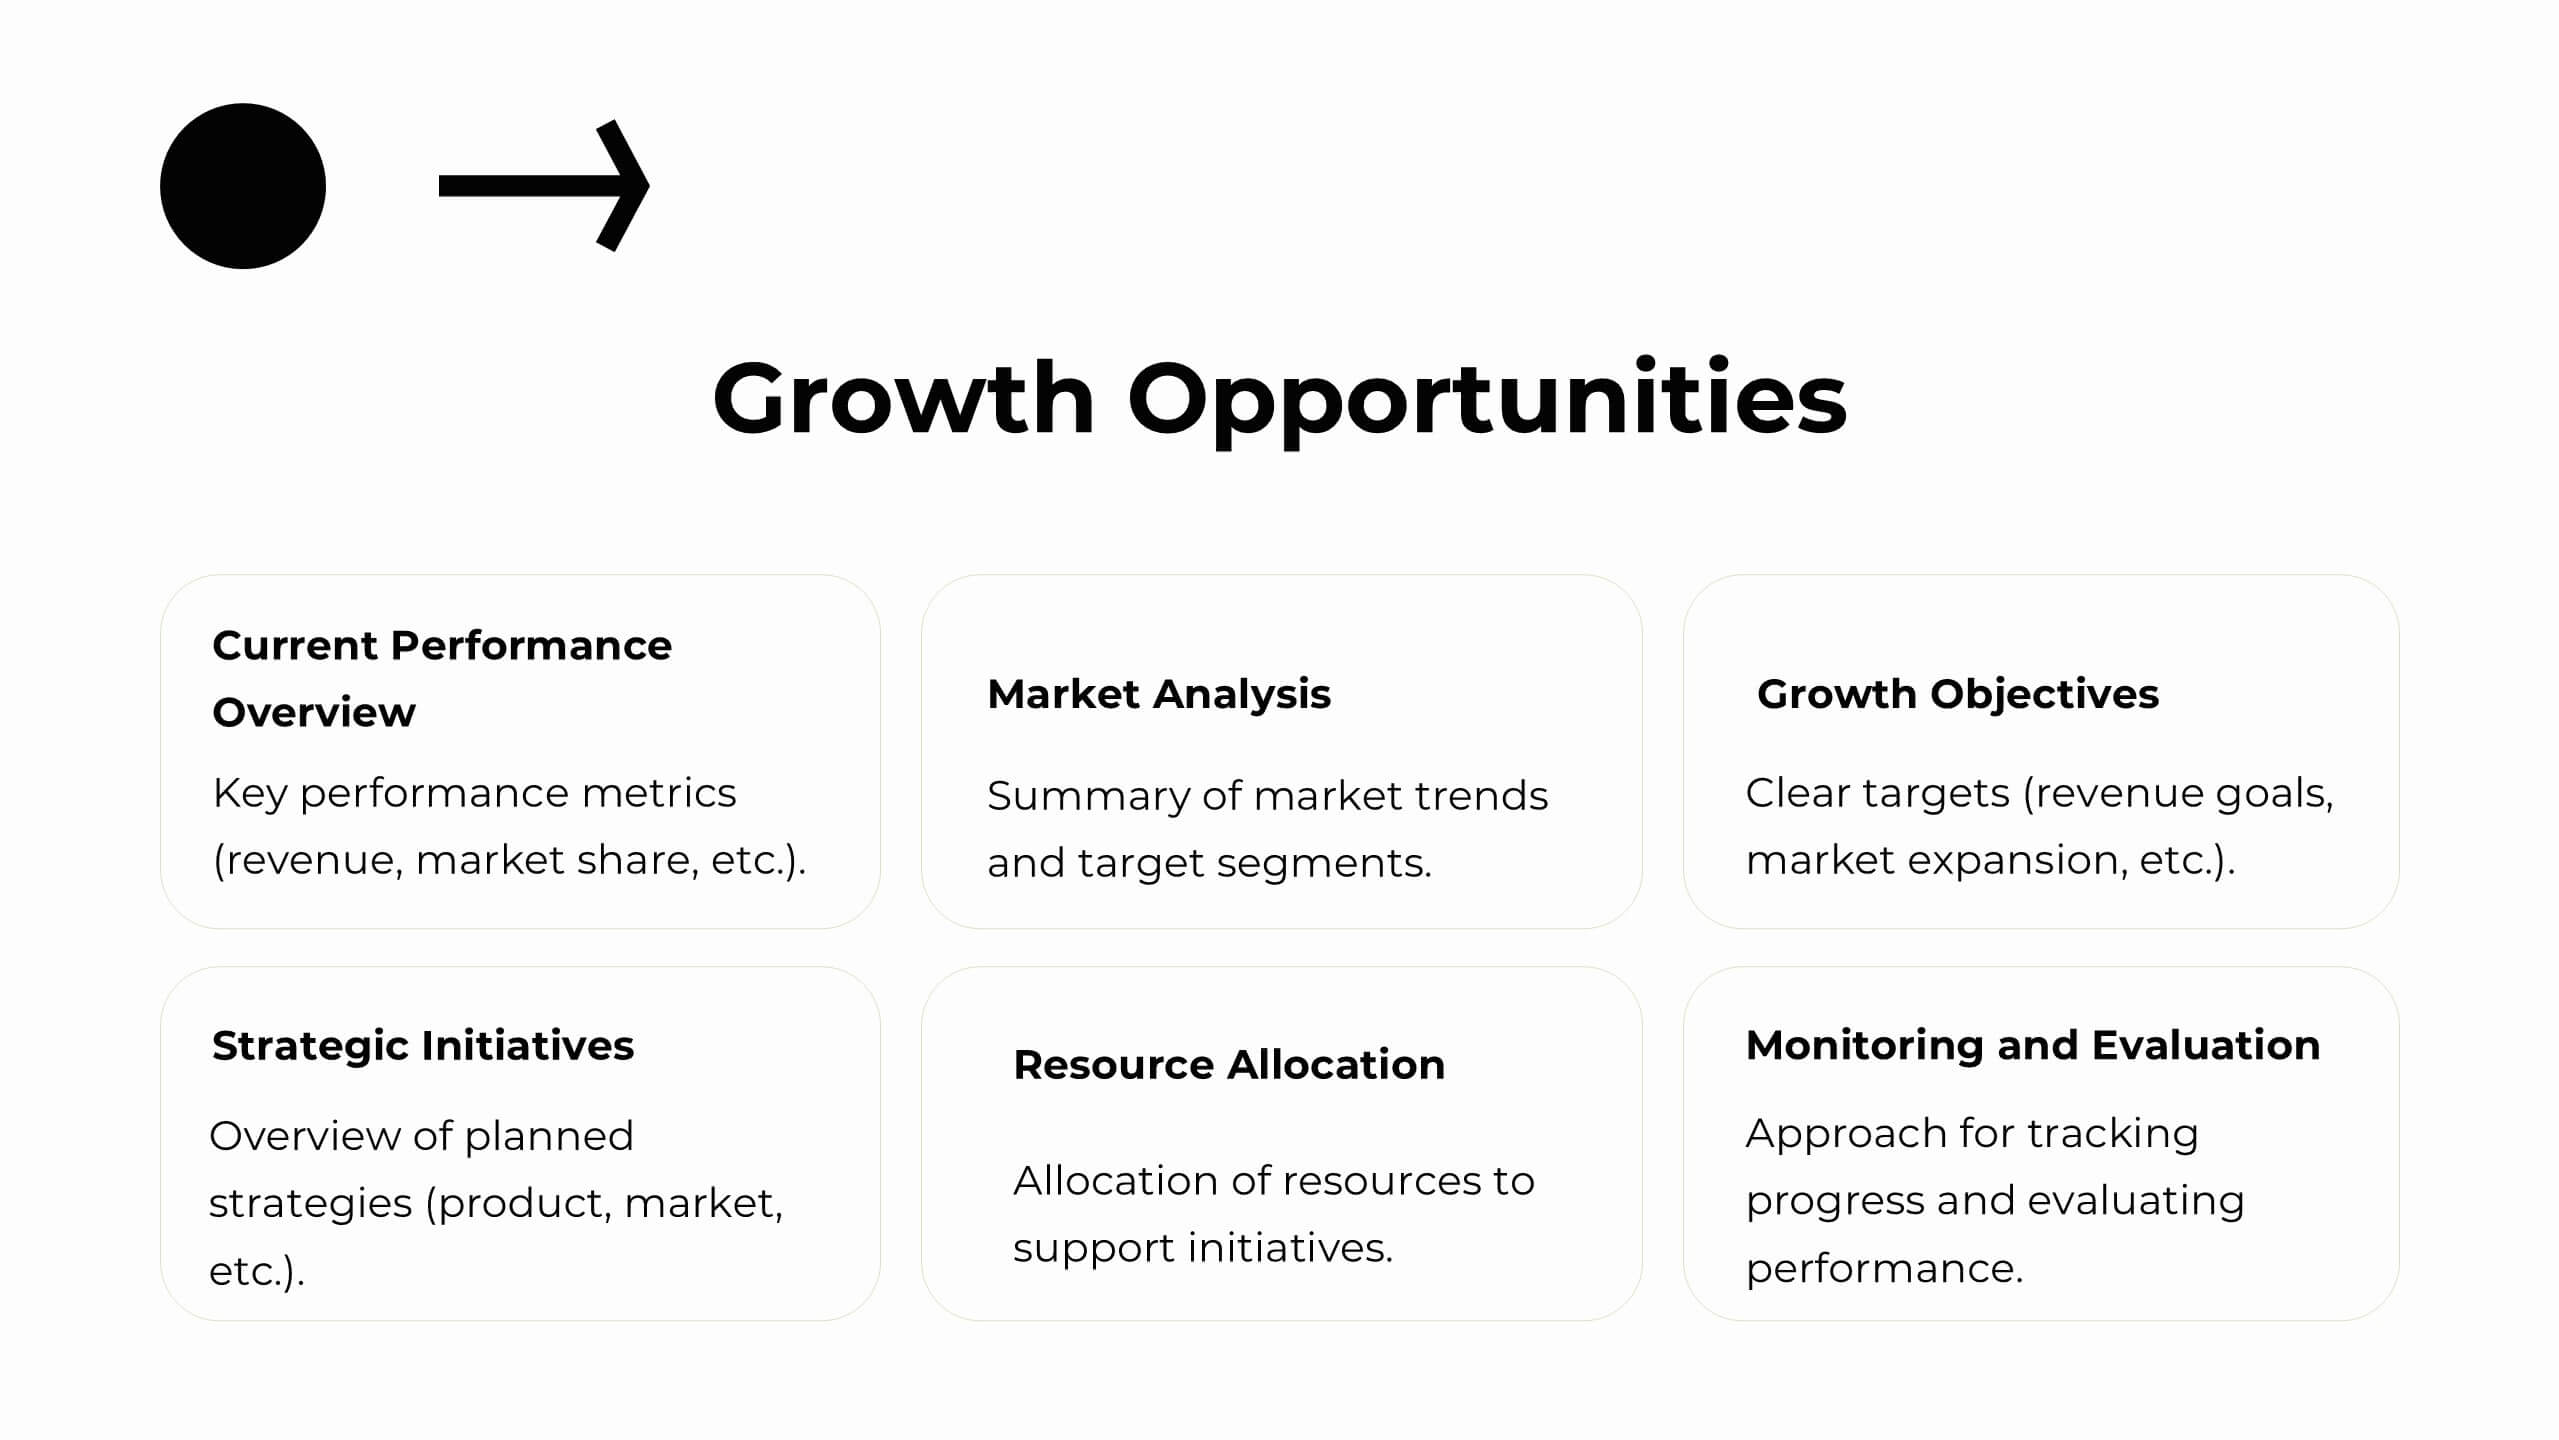
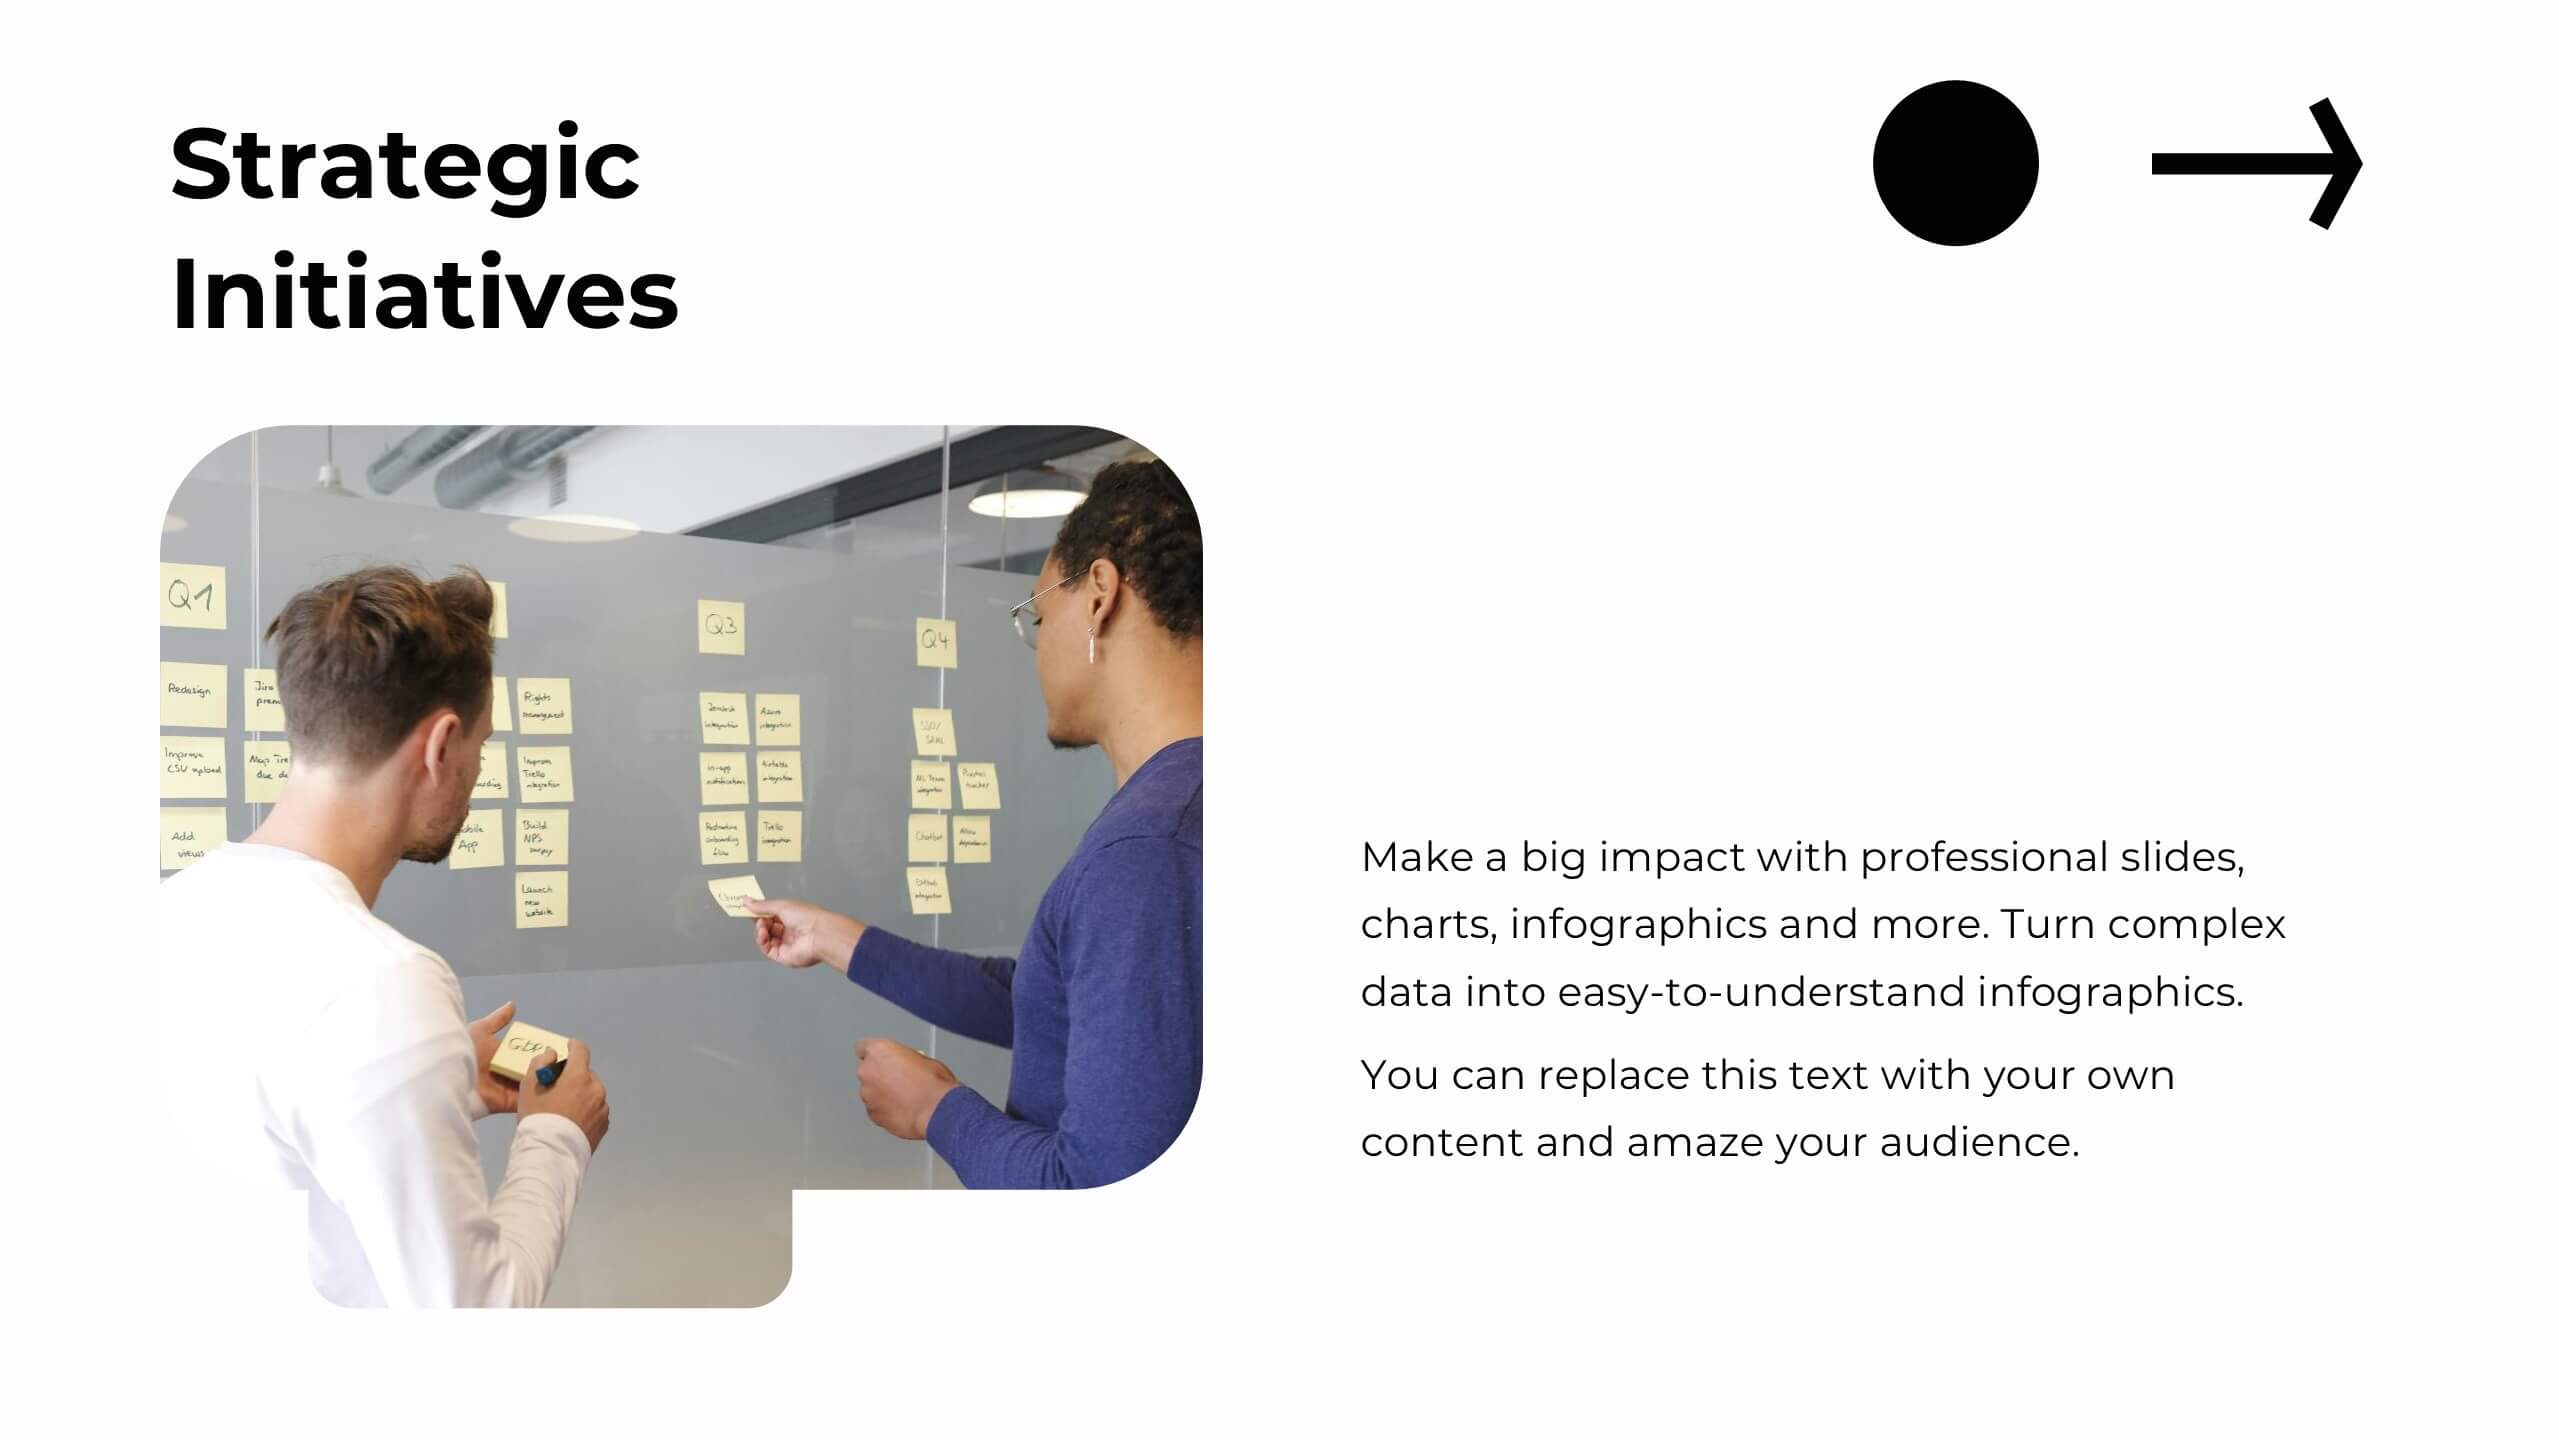
Zirconium Strategic Planning Report Presentation
Plan and present your strategies with precision using this comprehensive strategic planning report template! Designed for clear communication of goals, market trends, SWOT analysis, and growth opportunities, it’s perfect for aligning team objectives and driving success. Fully customizable and compatible with PowerPoint, Keynote, and Google Slides, this template is ideal for strategic initiatives and performance reviews.
6 diapositivas
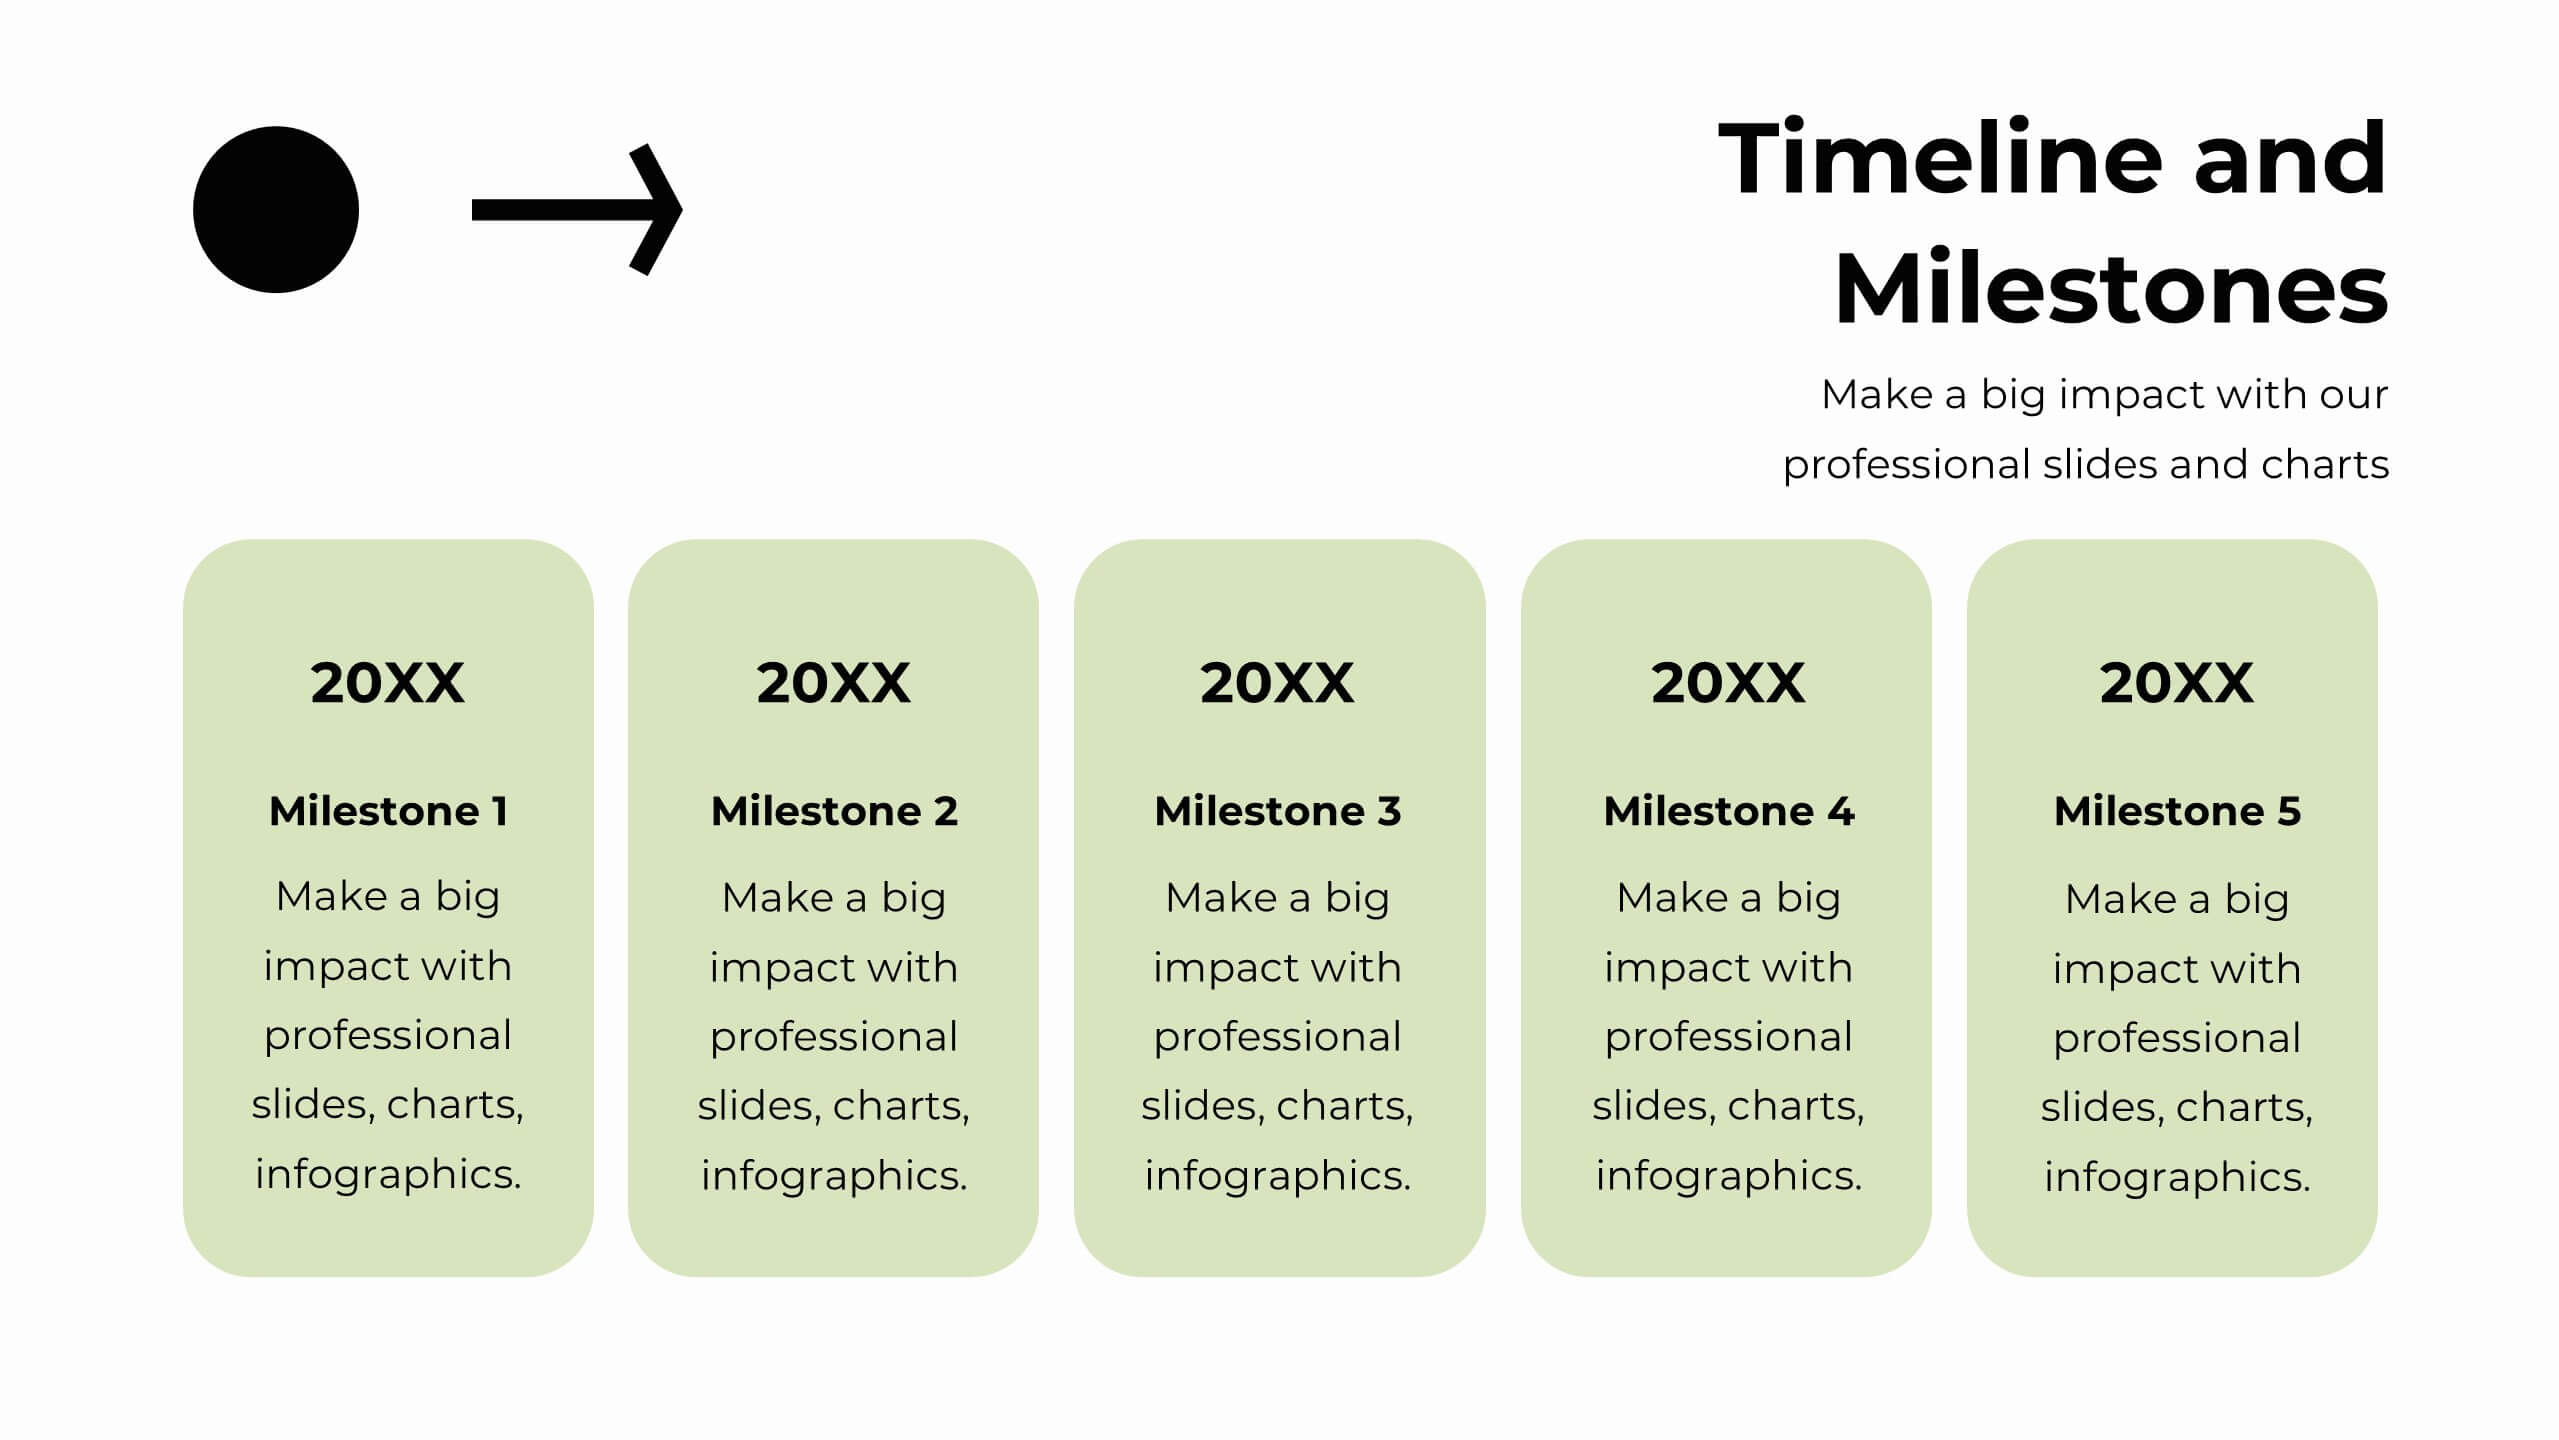
Arrow Mapping for Growth Journey
Showcase progress and strategic development using the Arrow Mapping for Growth Journey Presentation. This vibrant arrow-style roadmap is designed to highlight five key stages—perfect for illustrating phases of growth, milestones, or business transformations. Use it to map out project timelines, organizational development, or customer onboarding flows. Fully editable in PowerPoint, Keynote, and Google Slides, it’s ideal for business strategists, consultants, and marketing teams.


21 diapositivas
Oslo Design Strategy Proposal Presentation
This design strategy proposal template is tailored to present your creative process with bold colors and clean layouts. It includes sections like overview, design brief, concept development, design process, mood board, and project timeline, giving you a comprehensive structure for showcasing your approach. Compatible with PowerPoint, Keynote, and Google Slides, it ensures seamless presentations.


5 diapositivas
Product Development and Market Growth
Showcase each stage of your product’s journey with this 5-step column chart—from idea to market expansion. Perfect for product managers, startups, and marketing teams. Fully customizable in PowerPoint, Keynote, or Google Slides to match your brand and message effortlessly.


21 diapositivas
Apollo Sales Pitch Deck Template Presentation
Create an impressive sales pitch with this sophisticated template. Highlight your company overview, problem statement, solutions, and market opportunities. Showcase your unique selling proposition and marketing strategy. Ideal for PowerPoint, Keynote, and Google Slides.


3 diapositivas
Risk Assessment Spider Chart
Evaluate risks across key criteria with the Risk Assessment Spider Chart Presentation. This template showcases a multi-dimensional radar chart, ideal for comparing variables like probability, impact, and preparedness. Use this to present security assessments, project vulnerabilities, or business exposure insights. Fully editable in PowerPoint, Keynote, and Google Slides.


5 diapositivas
Fishbone Diagram for Root Cause Analysis Presentation
Identify and Solve Business Problems with Precision using this Fishbone Diagram for Root Cause Analysis presentation template. Designed to visually map out potential causes, this template enhances problem-solving, decision-making, and process improvement. Featuring a clear fishbone structure, customizable icons, and text placeholders, this template is perfect for business analysts, strategists, and operations teams. Fully editable and compatible with PowerPoint, Keynote, and Google Slides, ensuring a seamless and professional presentation experience.


6 diapositivas
Eco-Initiatives and Sustainability Efforts Presentation
Highlight your green strategy with the Eco-Initiatives and Sustainability Efforts Presentation. This template features a clean, icon-based layout to showcase up to six key eco-friendly actions or goals. Ideal for CSR reports, environmental planning, or internal sustainability updates. Fully editable in PowerPoint, Google Slides, and Canva.