


Características


¿Tienes alguna pregunta?
Recomendar


5 diapositivas
Target Audience Demographics
Present gender-based audience insights with this clean, dual-bar infographic slide. Ideal for showing comparative statistics between men and women across five demographic categories. Use this layout to support marketing analysis, campaign targeting, or consumer behavior reports. Editable in PowerPoint, Keynote, and Google Slides.


5 diapositivas
Business Annual Report Summary Presentation
Clear, Concise, and Impactful! The Business Annual Report Summary Presentation template helps you present key performance indicators, financial metrics, and company growth in a professional and visually engaging way. Fully customizable and compatible with PowerPoint, Keynote, and Google Slides, it’s ideal for executives and analysts aiming for a compelling data-driven presentation.


6 diapositivas
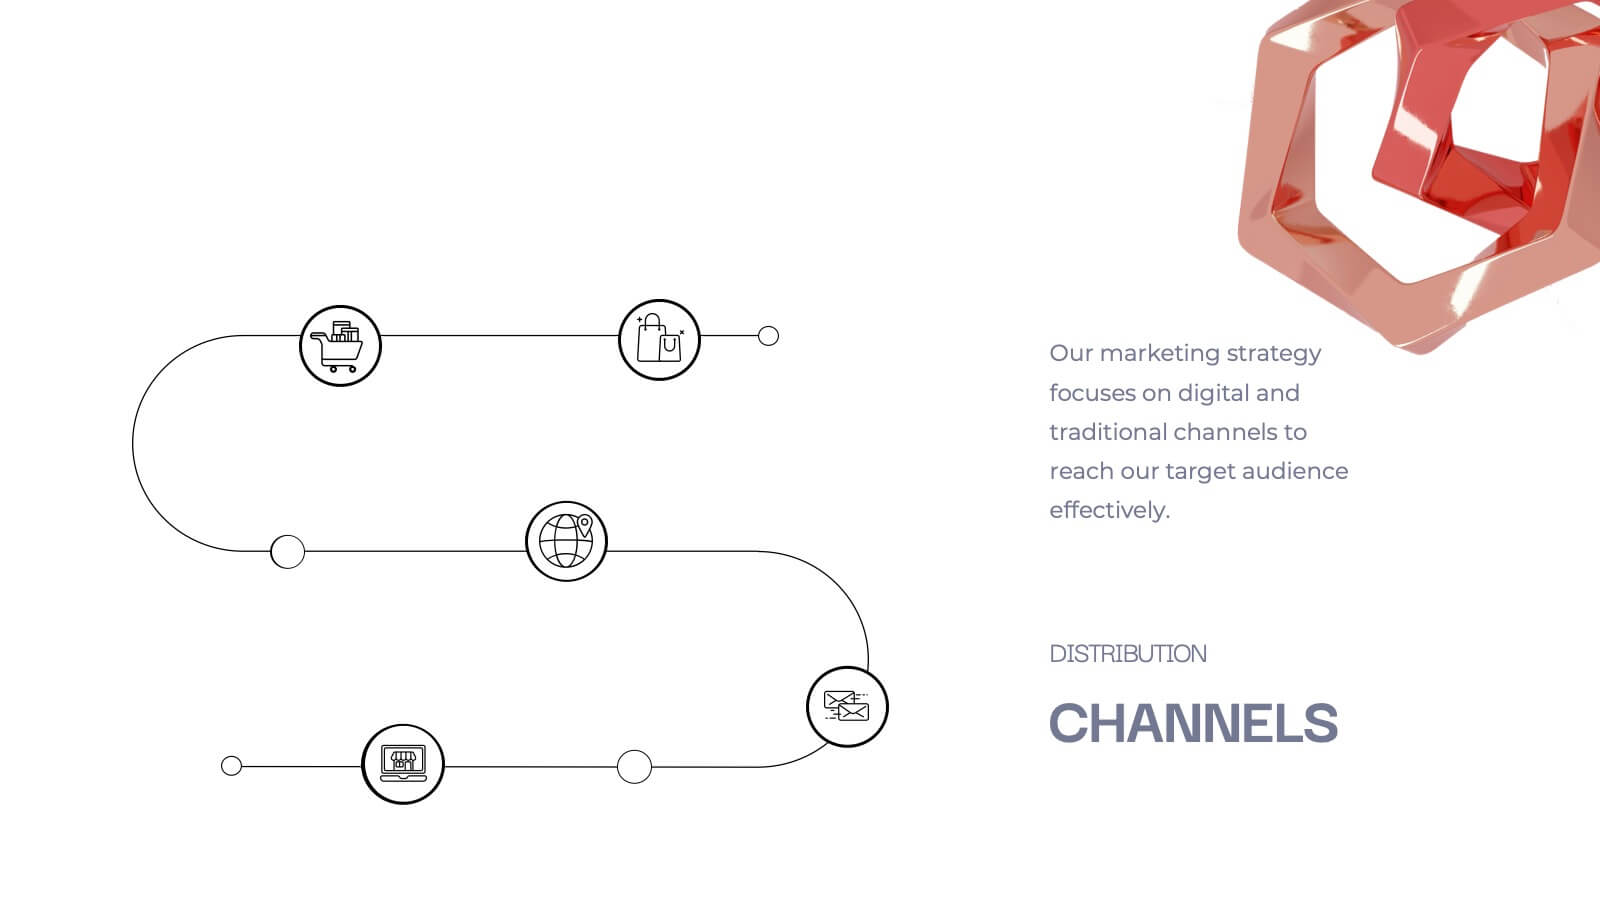
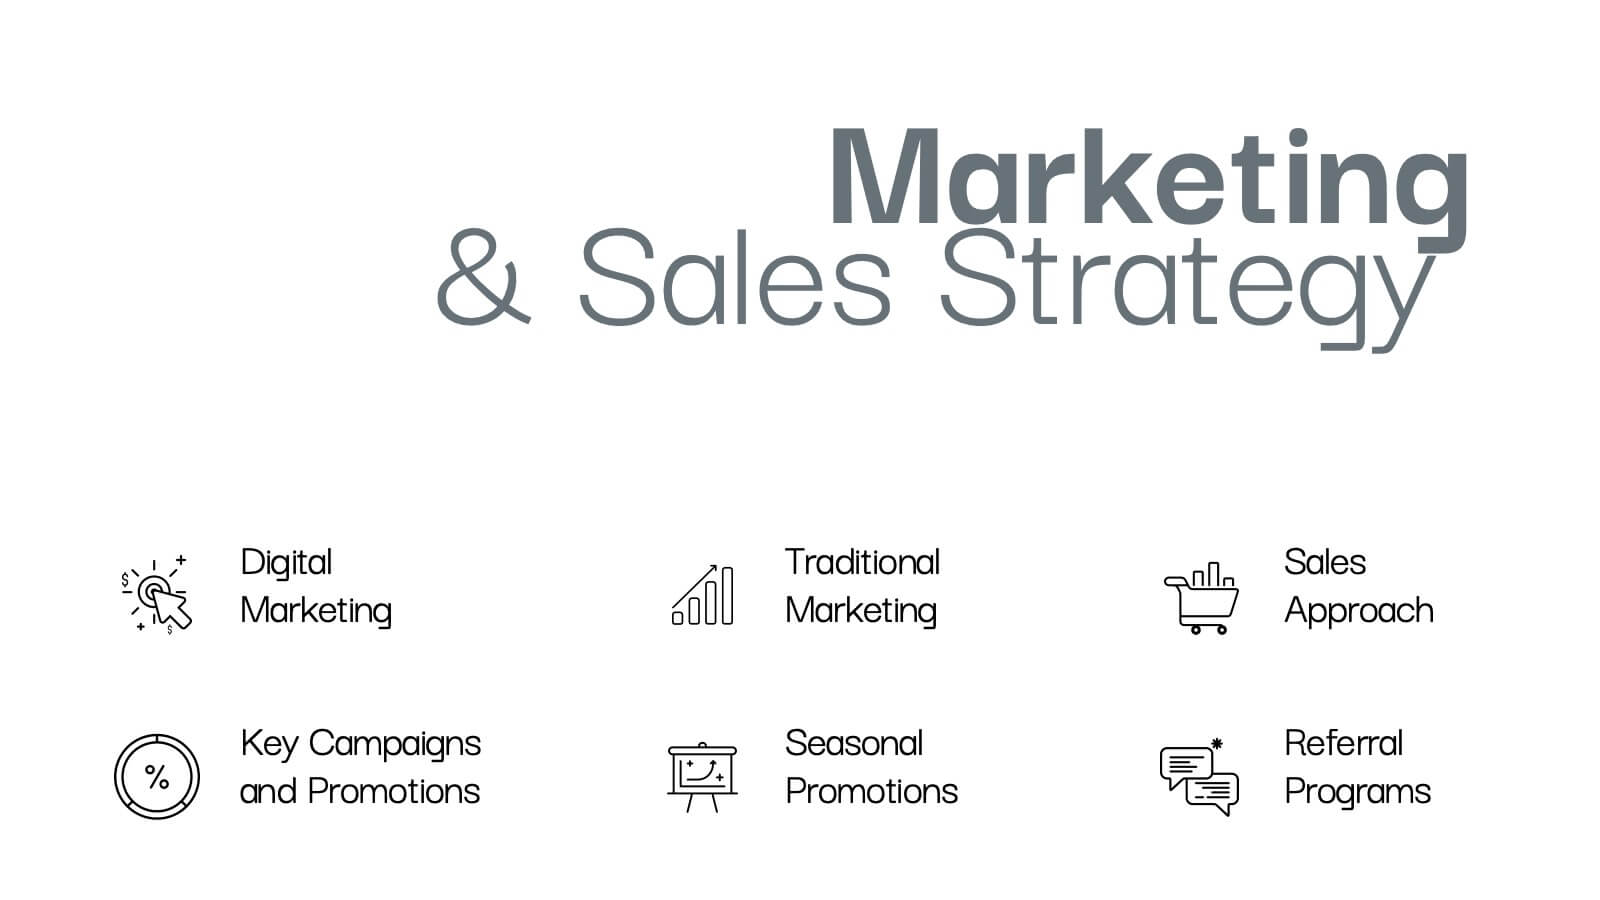
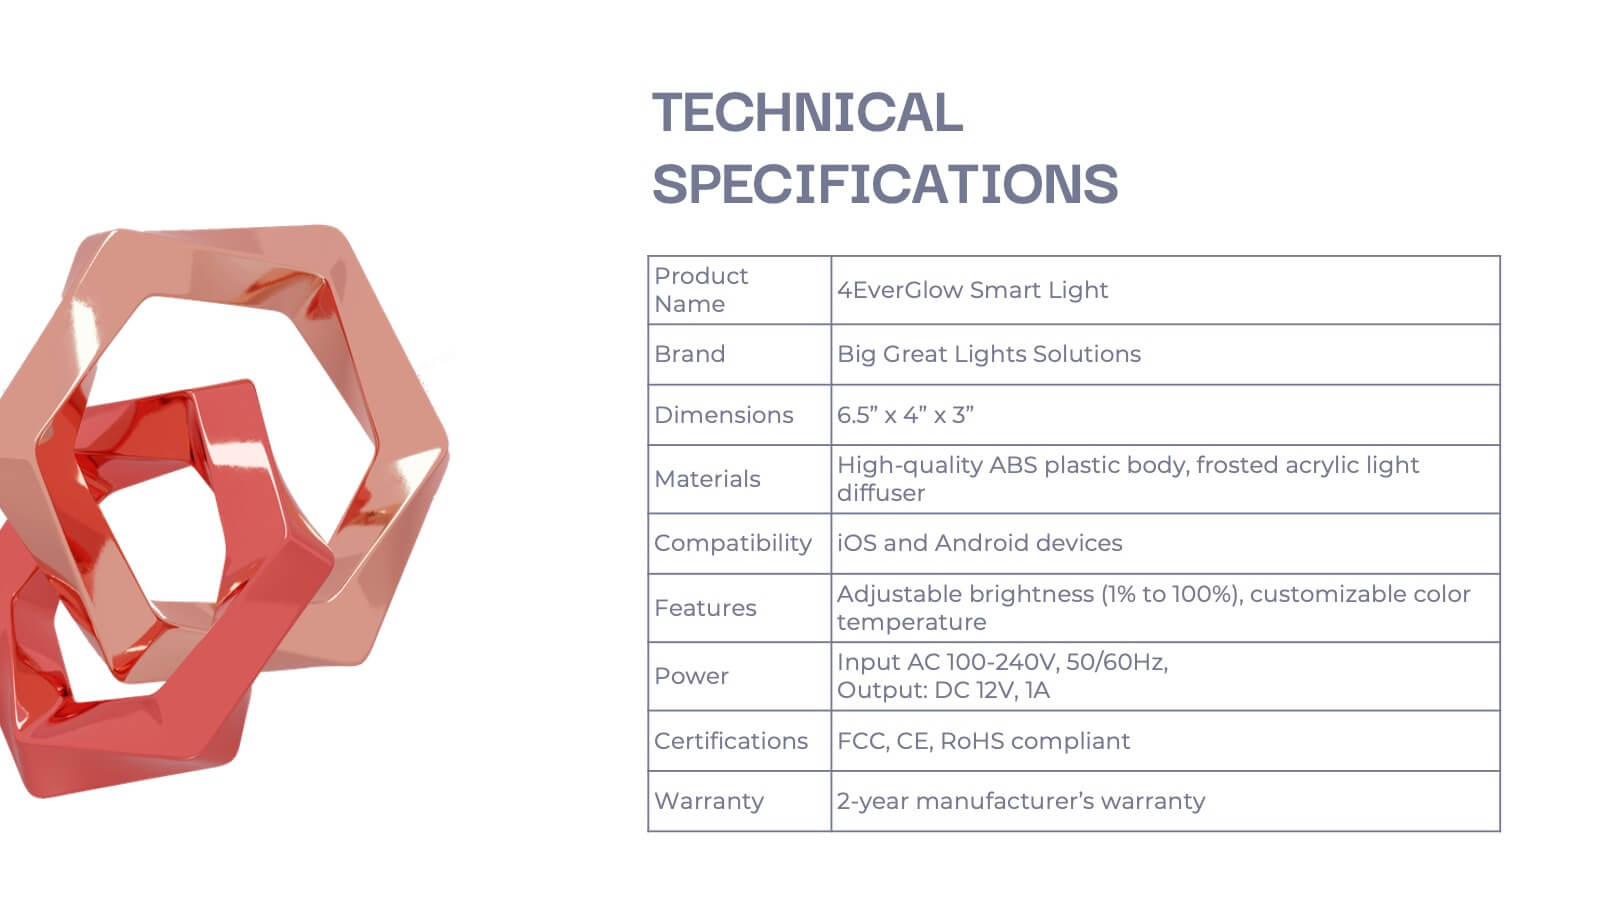
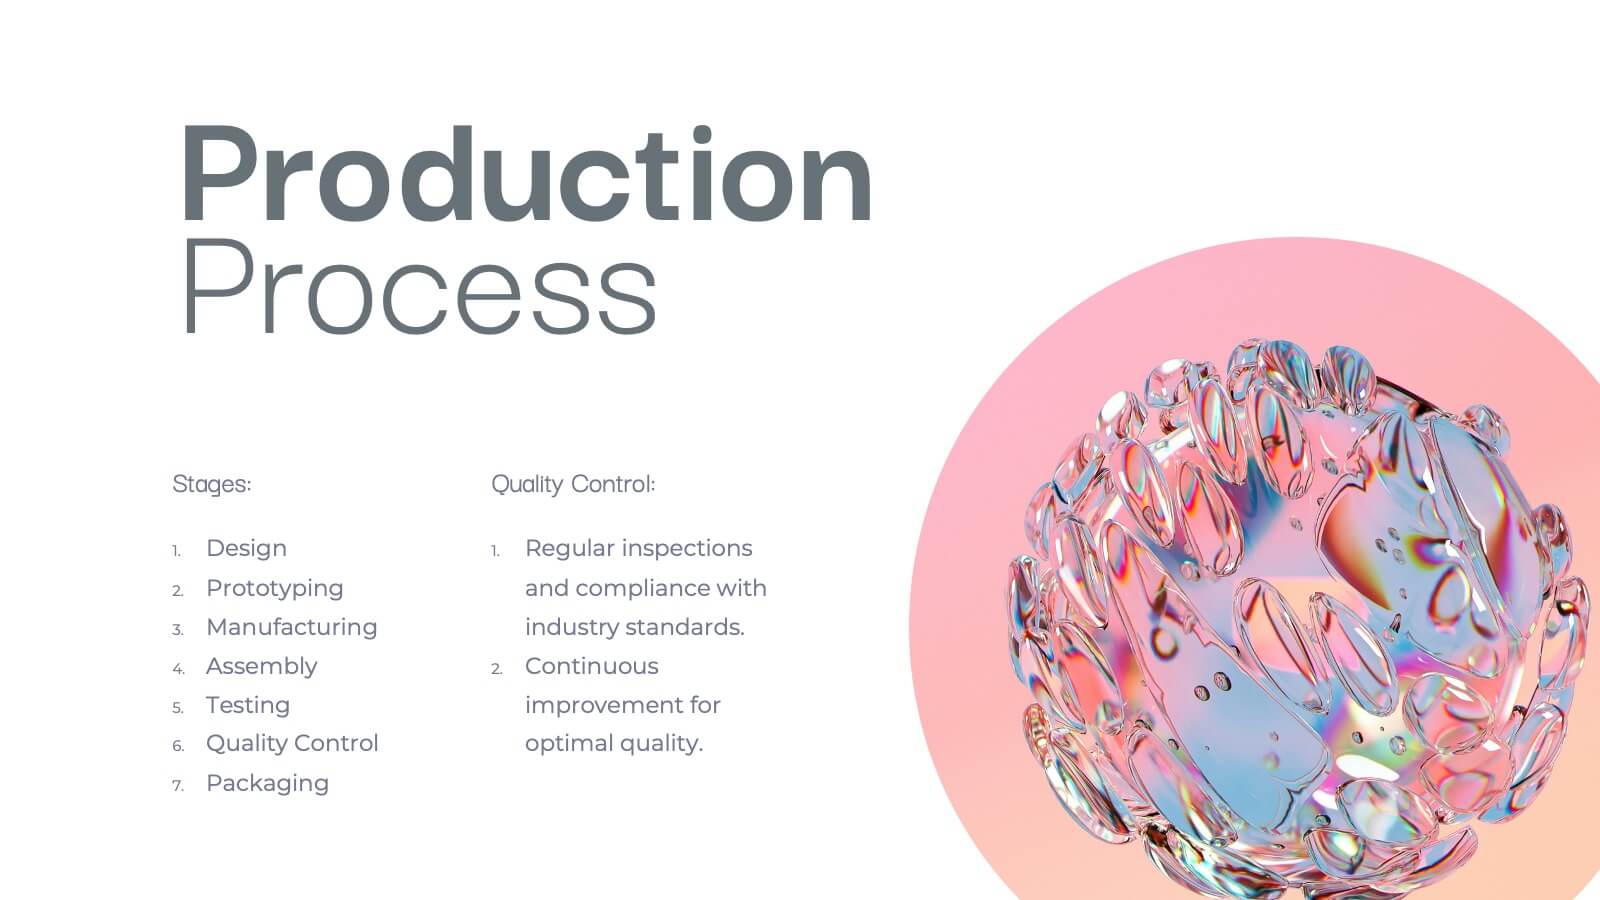
Business Marketing Strategy Infographic
Enhance your business presentations with our Business Marketing Strategy Infographic, tailored for PowerPoint, Google Slides, and Keynote. This comprehensive template is designed to help you effectively communicate complex marketing strategies in a visually engaging manner. Each slide offers a unique layout to present your marketing plans, from analysis to execution. Highlight key components like market research, goals, target audiences, and planned actions. With its customizable features, it's perfect for marketers aiming to outline strategies, set objectives, and convey tactics in a clear, concise way to team members and stakeholders alike.


7 diapositivas
SCRUM Infographic Presentation Template
A SCRUM infographic is an Agile methodology for software development. The goal of this infographic template is to provide a clear and easy-to-understand overview of the key principles and practices of scrum, such as the roles, events, and artifacts used in the process. This template can be used as a reference for team members, as a teaching tool for new scrum practitioners, or as a way to communicate scrum to stakeholders. Our well-designed scrum infographic can help you and your audience quickly understand the basics of the framework, as well as its benefits, applications, and best practices.


4 diapositivas
Empathy Mapping for Product Development Presentation
Strengthen user understanding with the Empathy Mapping for Product Development Presentation. This template helps teams visualize what users think, feel, say, and do—essential for creating intuitive products and experiences. Ideal for design sprints, UX workshops, and product planning sessions. Fully editable in PowerPoint, Keynote, Canva, and Google Slides.


5 diapositivas
Dual Axis Butterfly Diagram Presentation
Give your data the spotlight it deserves with a modern layout designed for clarity and balance. This presentation is perfect for comparing two perspectives, processes, or variables side by side in a visually appealing way. Fully customizable and compatible with PowerPoint, Keynote, and Google Slides.

21 diapositivas
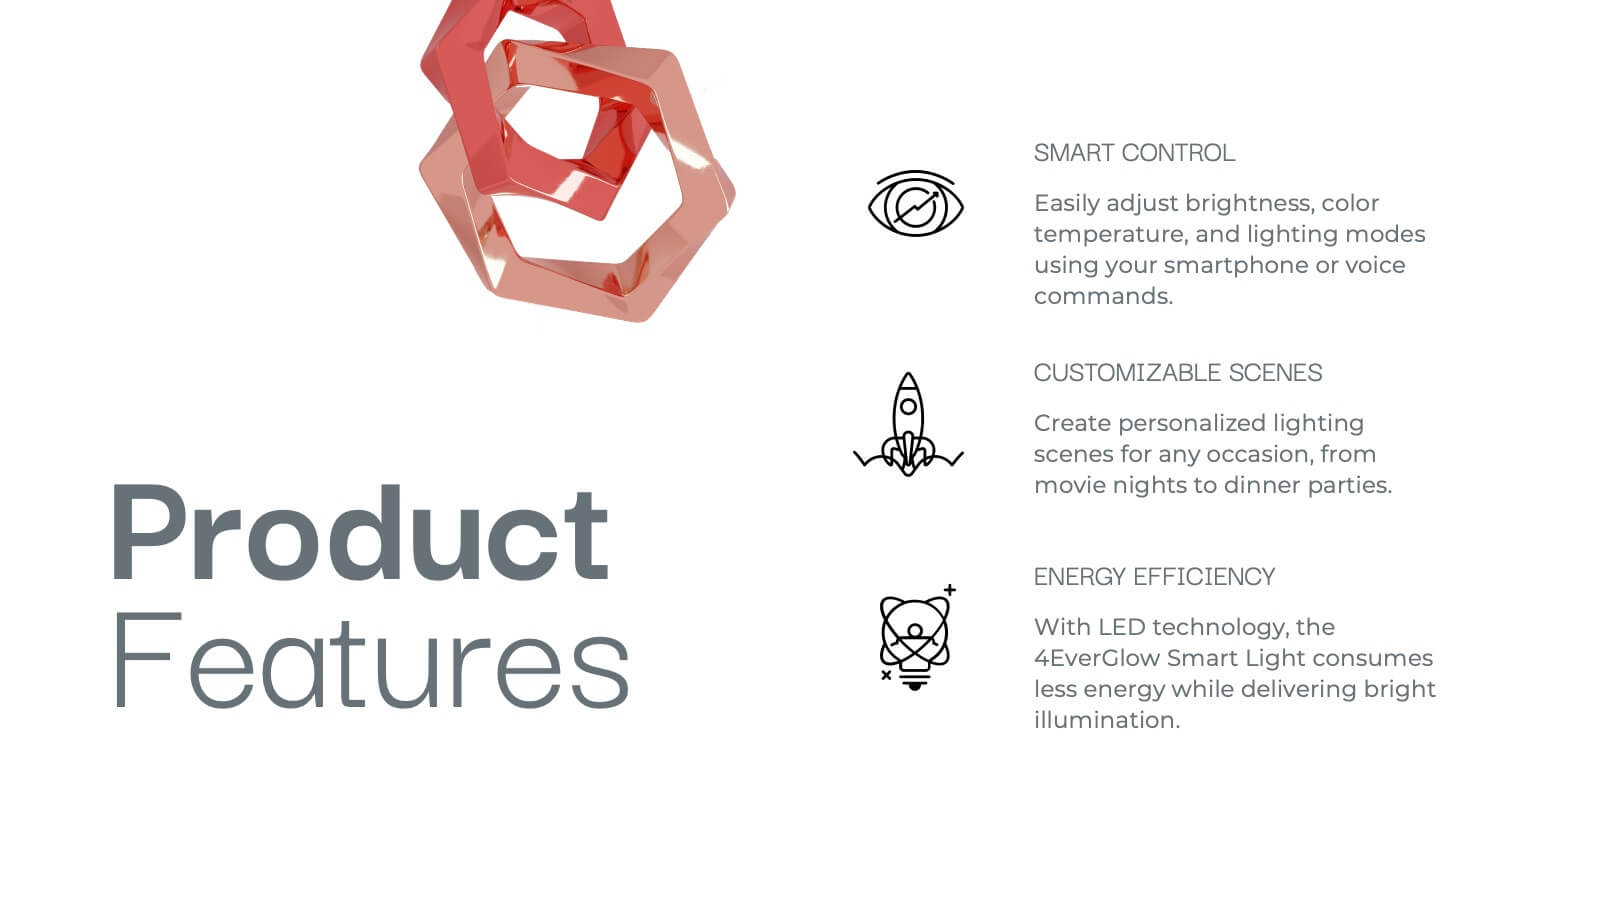
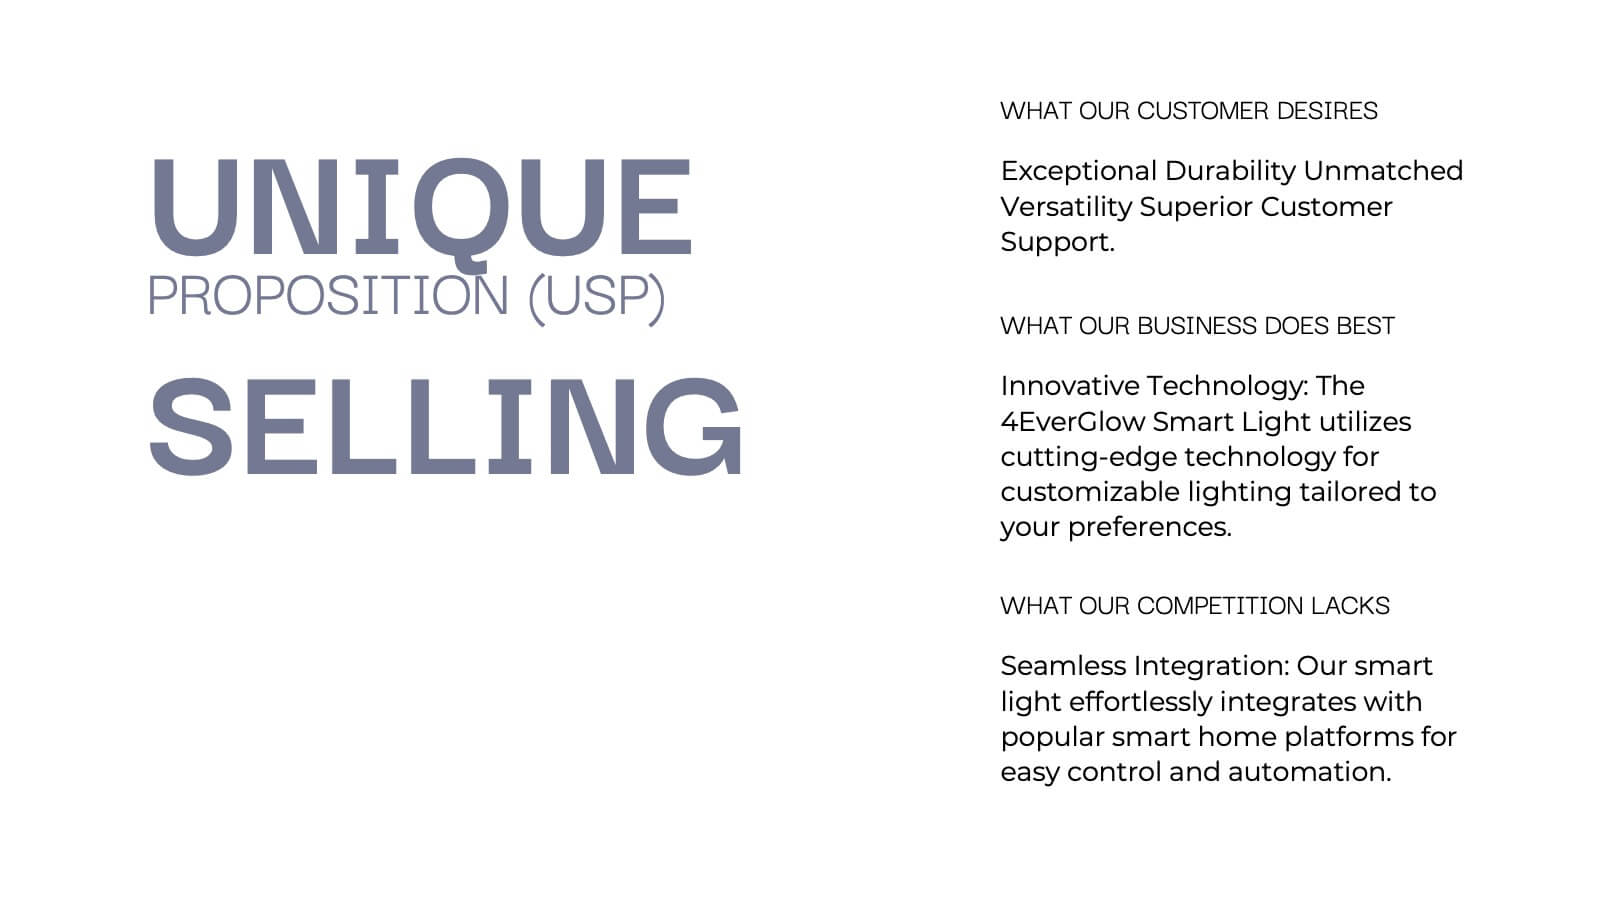
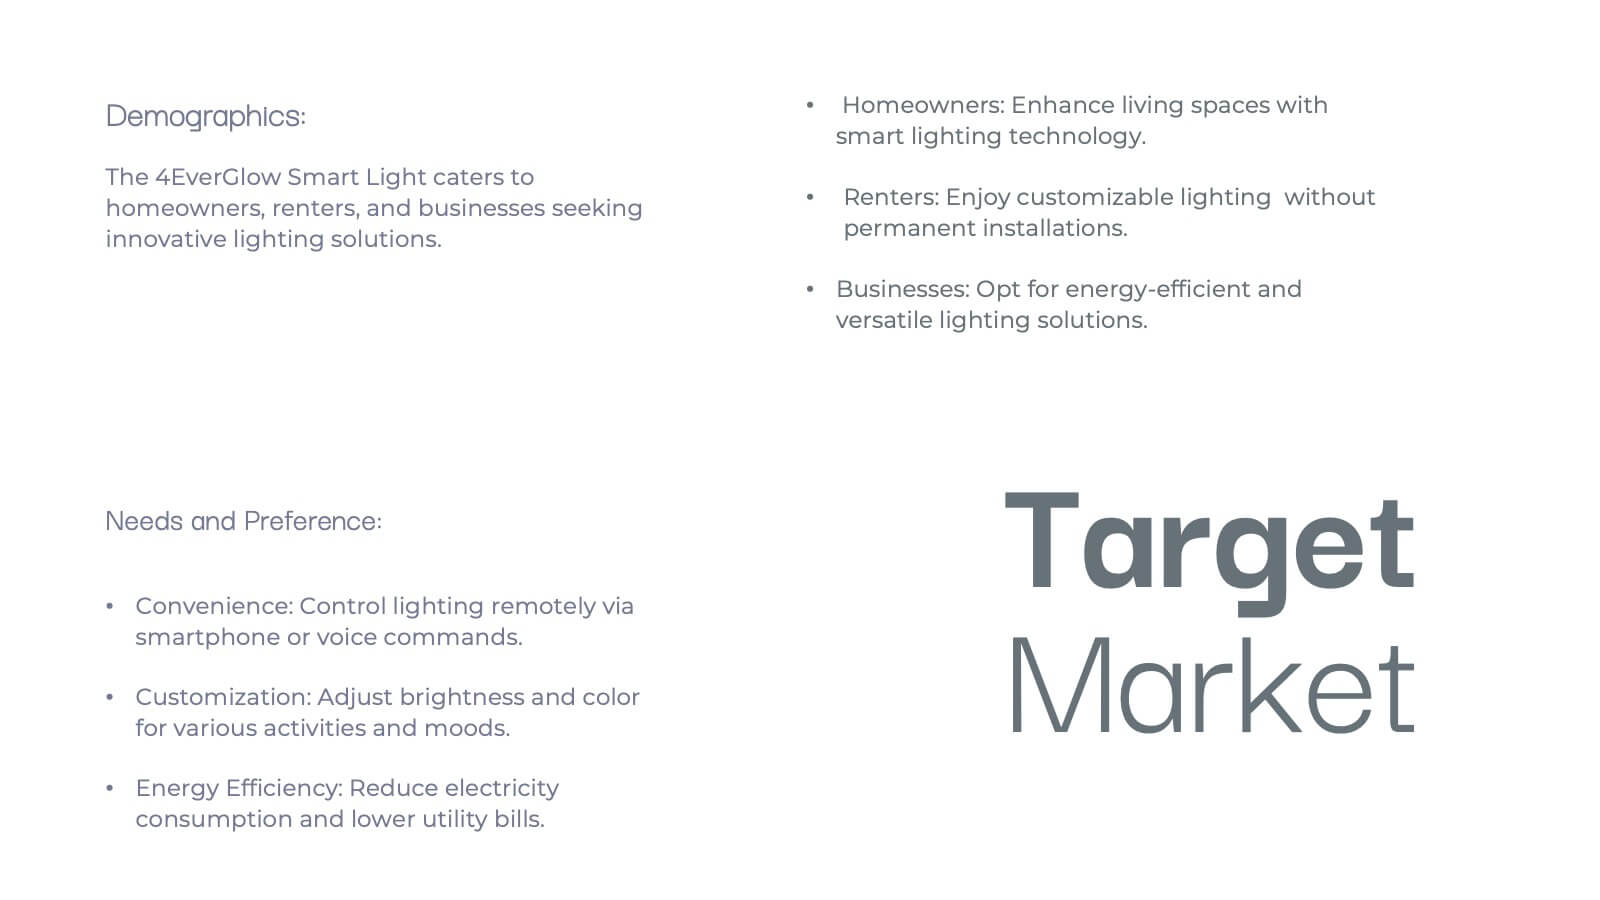
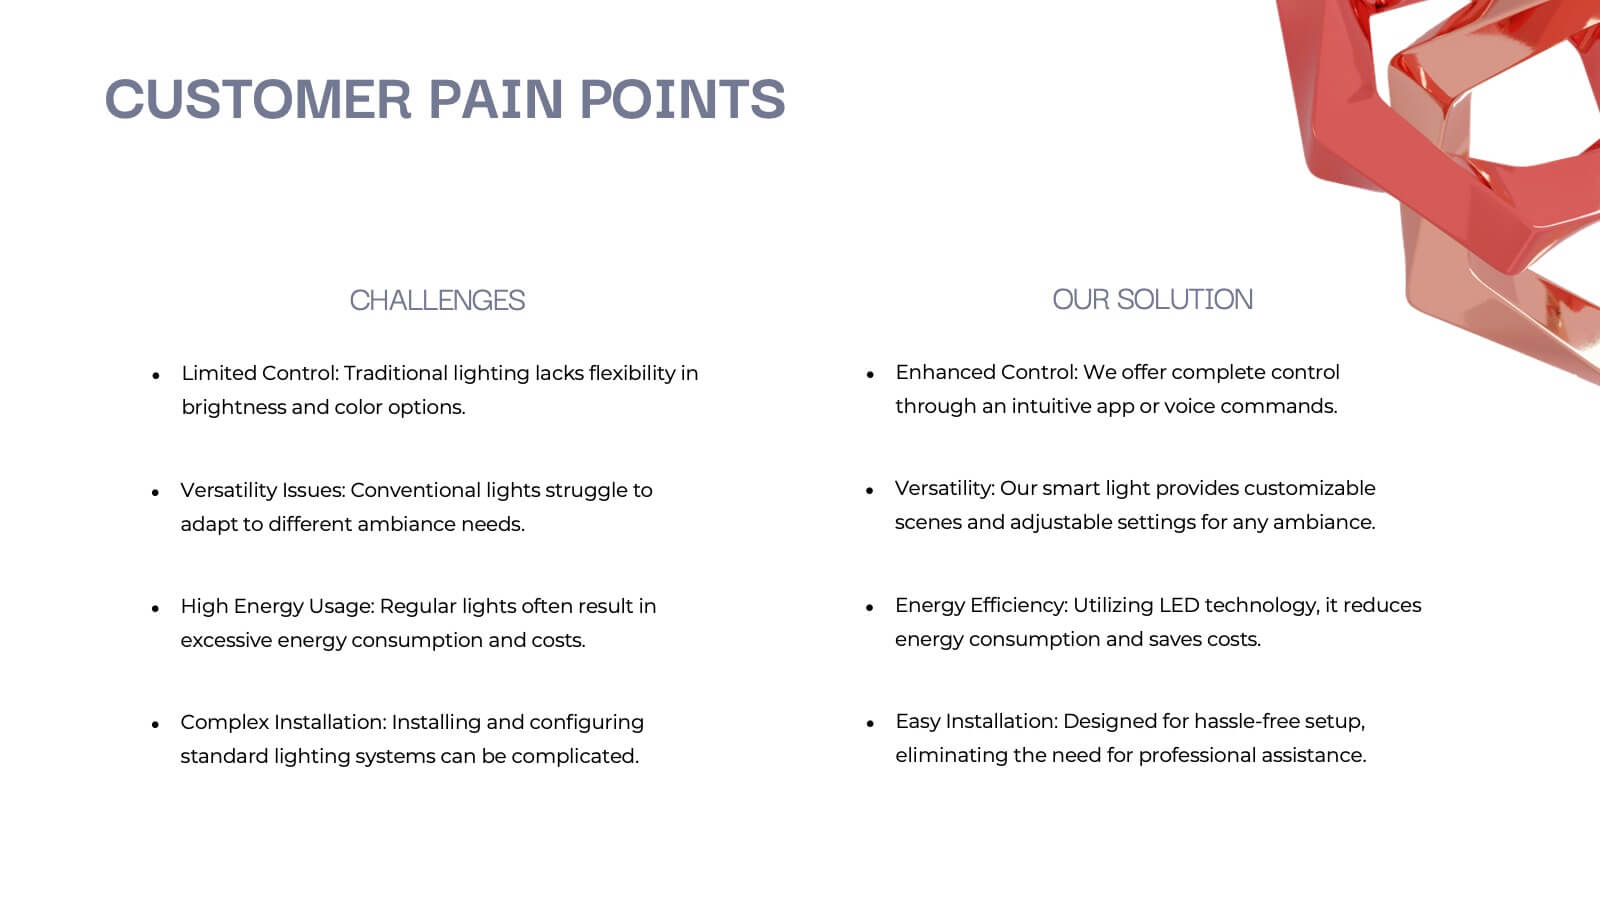
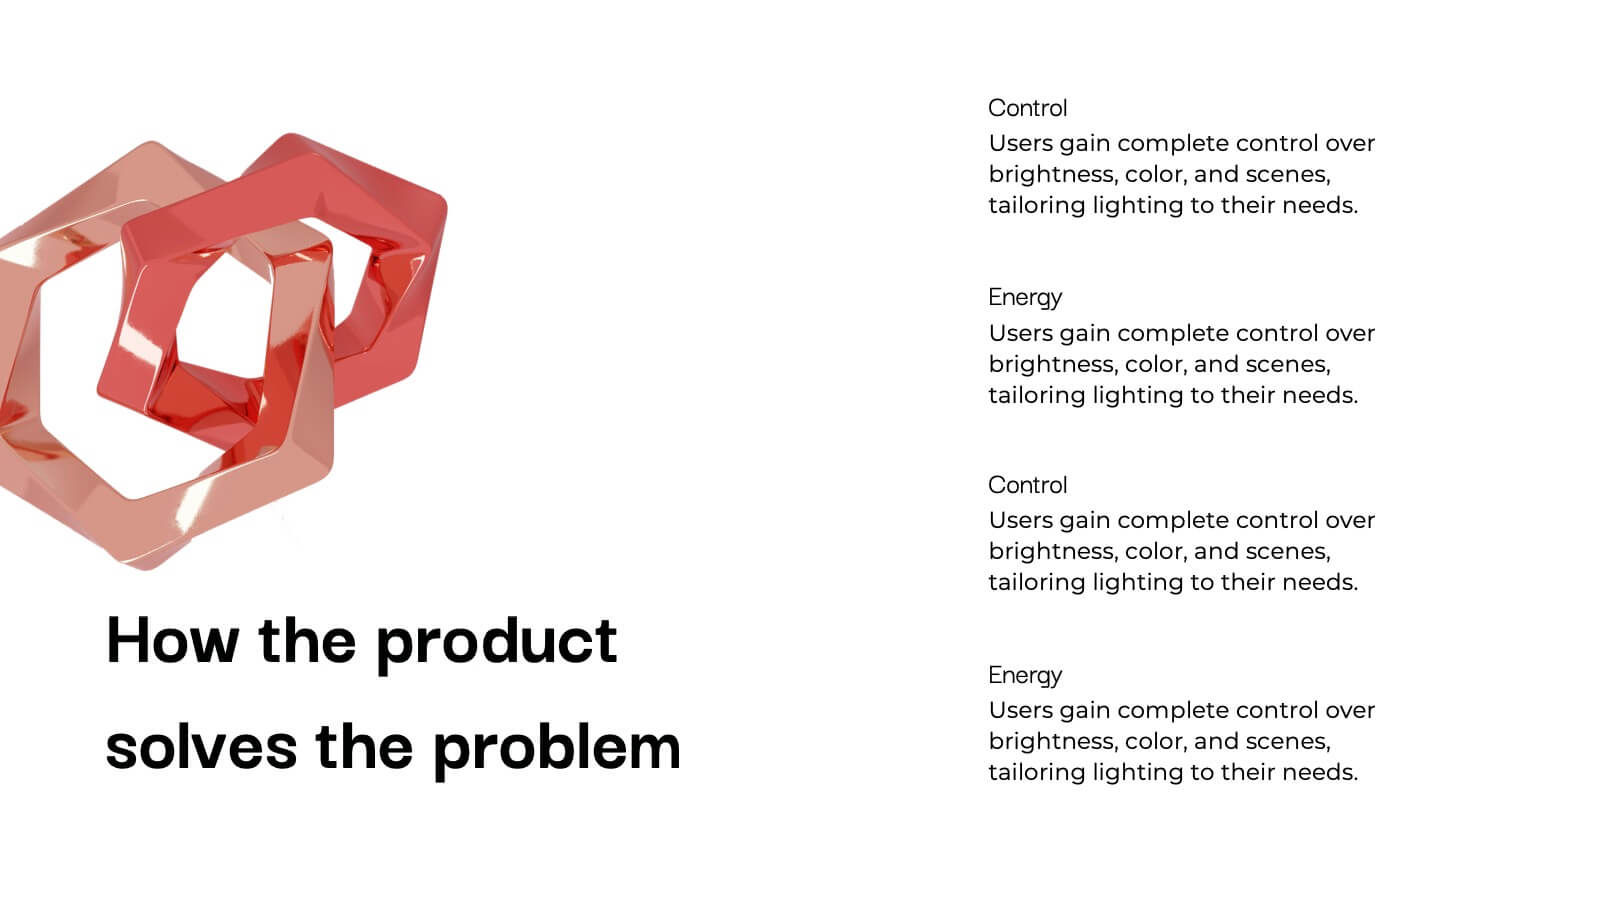
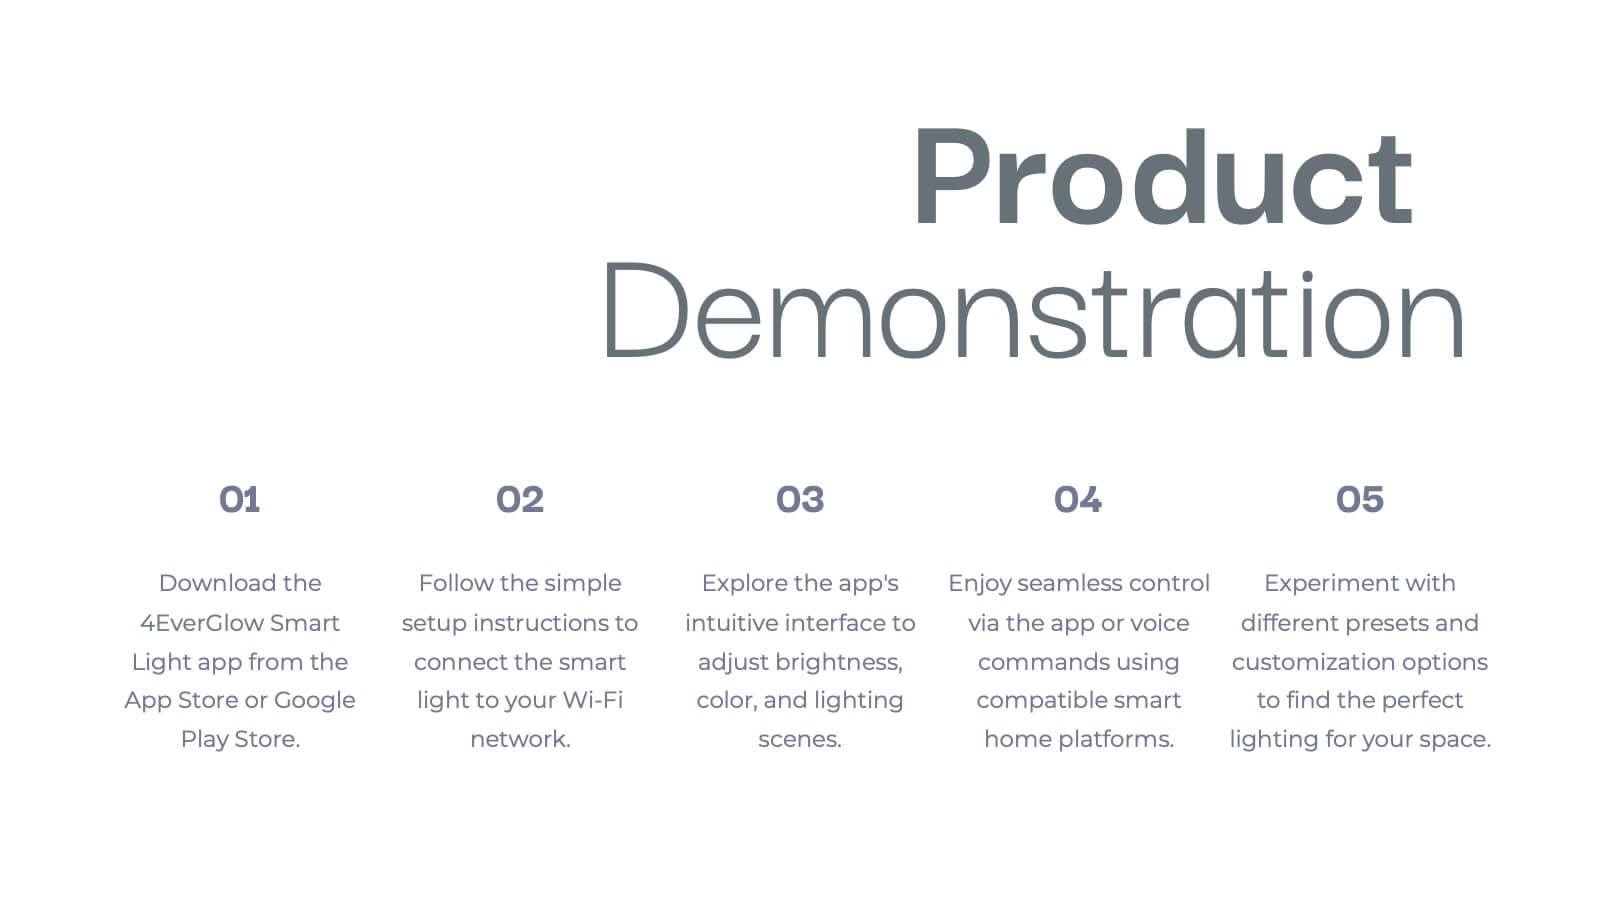
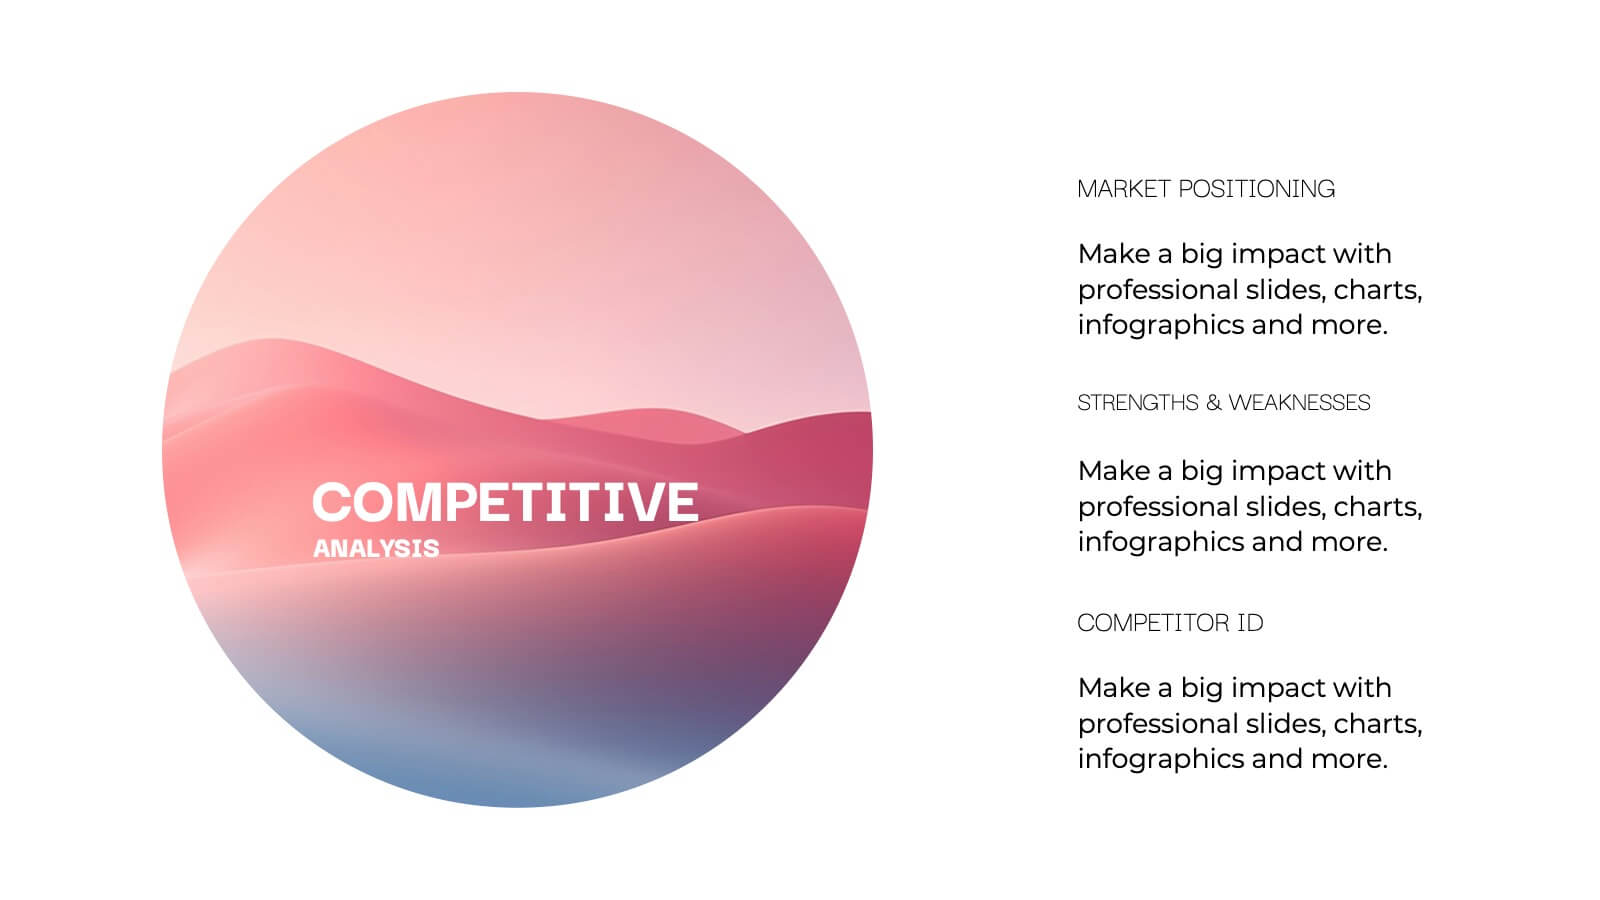
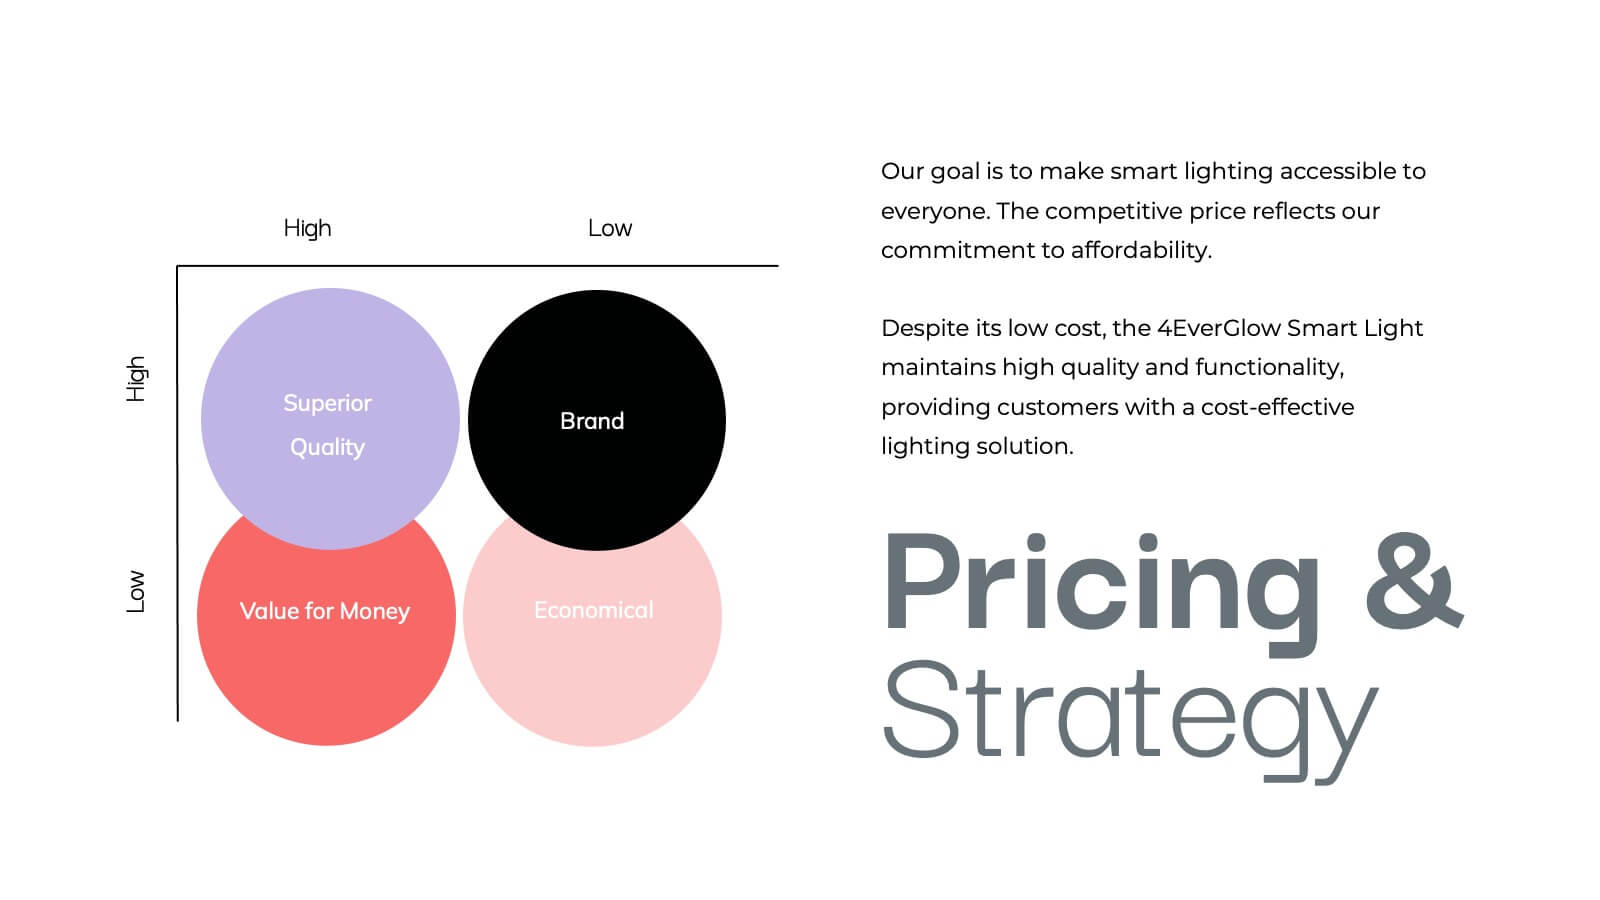
Vulcan New Product Proposal Presentation
Launch your next product with confidence using this comprehensive presentation template! Covering everything from product features and target market to pricing strategy and customer pain points, this template ensures a smooth and engaging flow for your audience. It’s ideal for product proposals, demonstrations, and marketing strategies. Compatible with PowerPoint, Keynote, and Google Slides for seamless presentations.


12 diapositivas
Market Research Data Insights Presentation
Gain Valuable Market Insights! The Market Research Data Insights Presentation is designed to help businesses analyze trends, customer behavior, and competitive landscapes. Featuring a structured circular layout, this template ensures data is easy to interpret and present. Fully customizable and compatible with PowerPoint, Keynote, and Google Slides for seamless editing.


5 diapositivas
Multi-Level Concentric Circles Framework Presentation
Visualize relationships and layered strategies with the Multi-Level Concentric Circles Framework Presentation. This template uses interlinked circular nodes to represent multi-tier systems, process flows, or strategic components in an intuitive layout. Easily editable in PowerPoint, Keynote, and Google Slides for seamless integration into your presentations.


6 diapositivas
Team Vision Infographic
Explore our collection of Slide Templates tailored to showcase your team's vision and future ambitions. These templates offer a blend of modern and professional designs that are perfect for laying out your team's objectives and strategies. Each slide is crafted to facilitate clear communication of your vision, ensuring every team member is aligned and motivated. These visually appealing templates are ideal for team meetings, strategic planning sessions, and leadership presentations. They are fully customizable, allowing you to adapt the colors, text, and graphics to match your team's identity and goals. Optimize your team's presentations with these versatile templates, designed to promote understanding and enthusiasm for your collective vision.


5 diapositivas
Studio Photography Infographics
Studio Photography is the practice of capturing photographs in a controlled environment, typically a dedicated photography studio. These infographic templates highlight the key aspects of studio photography with examples of fashion photography, photojournalism, and photography terminology. These are designed to assist photographers, photography studios, and enthusiasts in showcasing the essential elements and techniques involved in capturing stunning images in a studio setting. Use these to provides valuable insights and techniques to help your audience create stunning images in a studio environment. Compatible with Powerpoint, Keynote, and Google Slides.


5 diapositivas
Investment Portfolio & Stock Forecast Presentation
Present key investment insights with clarity using the Investment Portfolio & Stock Forecast presentation template. Featuring a central briefcase visual and surrounding data points, this layout is perfect for showcasing portfolio allocation, stock predictions, market movements, or financial planning elements. Designed for finance professionals, analysts, and advisors, it simplifies complex data into digestible visuals. Fully editable and compatible with PowerPoint, Keynote, and Google Slides.


8 diapositivas
Business Challenge & Solution Presentation
Address complex issues with clarity using this business challenges and solutions presentation. Featuring a chess knight visual, it helps outline problems and corresponding strategies. Ideal for strategic planning, risk management, and executive briefings. Fully customizable in PowerPoint, Keynote, and Google Slides to fit your corporate or consulting presentation needs.


7 diapositivas
Daily Puzzle Infographics
Engage and entertain your audience with our daily puzzle infographic. This template is a dynamic and interactive way to present puzzles diagrams to captivate your audience. This template is designed to add an element of fun and engagement to your presentations. The design immediately grabs attention and sparks curiosity. Compatible with Powerpoint, Keynote, and Google Slides. The well-organized layout enables smooth navigation through the infographic. This is perfect for educators, game designers, content creators, or anyone seeking to add an interactive and entertaining element to their presentations.


6 diapositivas
Value Delivery Framework Presentation
Turn your strategy into action with a clear, layered design that highlights how value flows through every stage of your process. Perfect for explaining organizational efficiency, performance models, or delivery systems. Fully editable and compatible with PowerPoint, Keynote, and Google Slides for easy, professional customization.


4 diapositivas
Team Relationship Structure Presentation
Show your organization’s hierarchy with clarity and style using this modern visual layout. Ideal for illustrating team dynamics, reporting lines, or company roles, it helps simplify complex structures into easy-to-follow visuals. Fully customizable and compatible with PowerPoint, Keynote, and Google Slides for seamless editing and professional presentation design.


10 diapositivas
Leadership and Organizational Vision Presentation
Showcase your company’s path to growth and alignment with this sleek Leadership and Organizational Vision slide. The diamond-shaped infographic flow is perfect for outlining mission pillars, executive strategies, or value-driven goals across five stages. Each section includes icons and editable descriptions for clarity and engagement. Ideal for strategic planning sessions, team briefings, or executive reports. Fully customizable in PowerPoint, Keynote, and Google Slides for seamless integration into your presentation.