


Características


¿Tienes alguna pregunta?
Recomendar


6 diapositivas
Business Organizational Structure
Present your company's hierarchy with clarity using this modern organizational chart slide. Ideal for outlining team leadership, department roles, or executive structure. Fully editable in PowerPoint, Keynote, and Google Slides for easy customization.


26 diapositivas
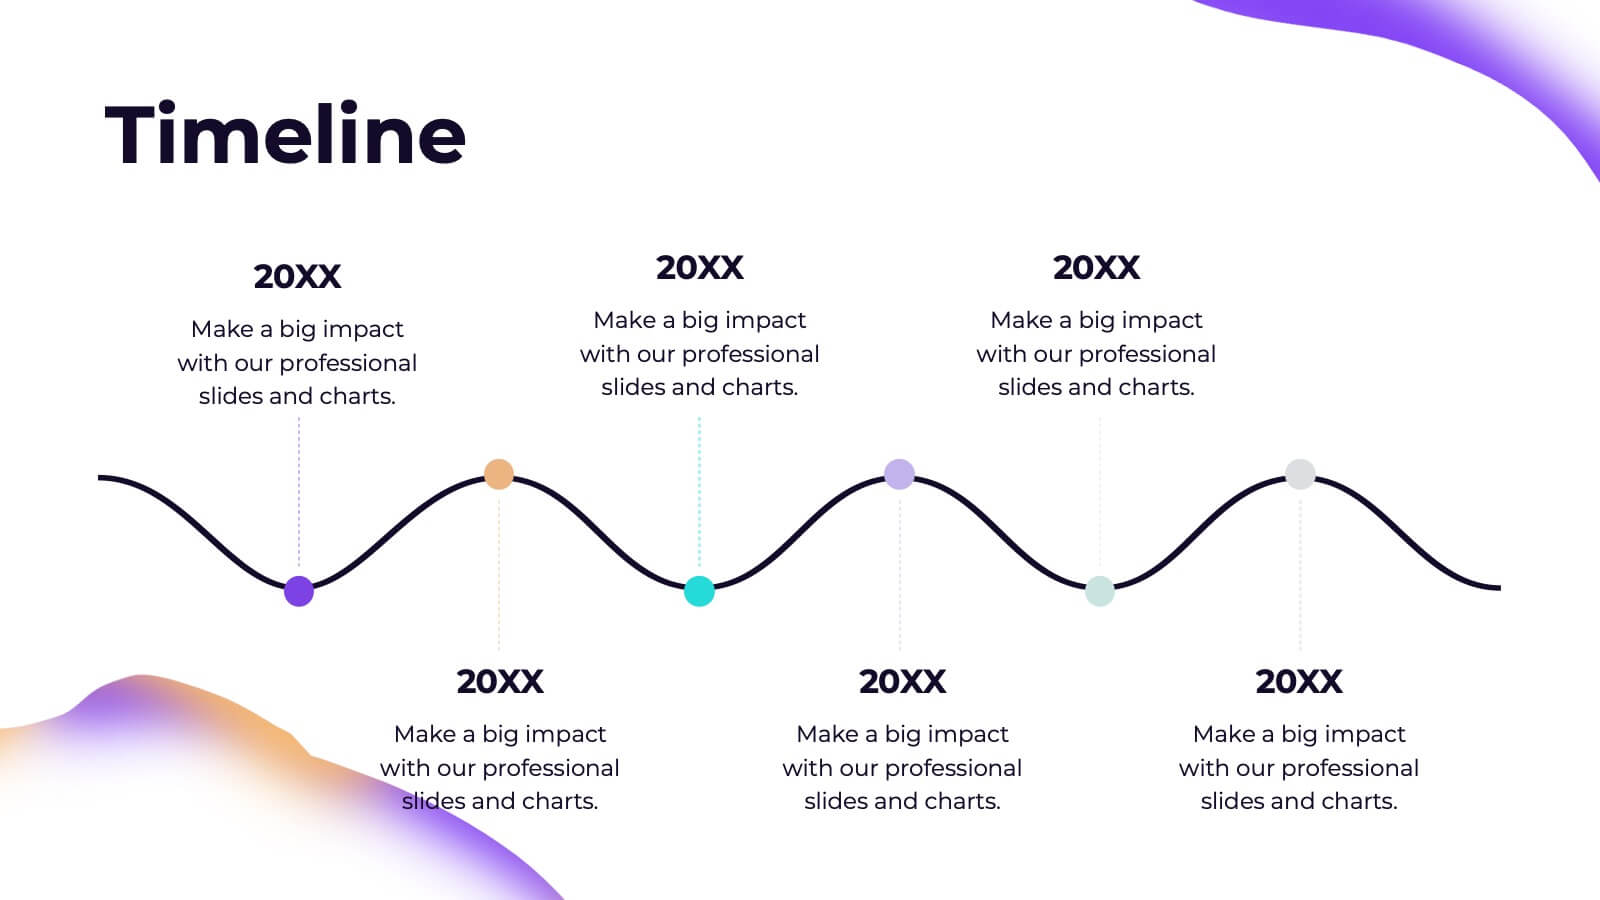
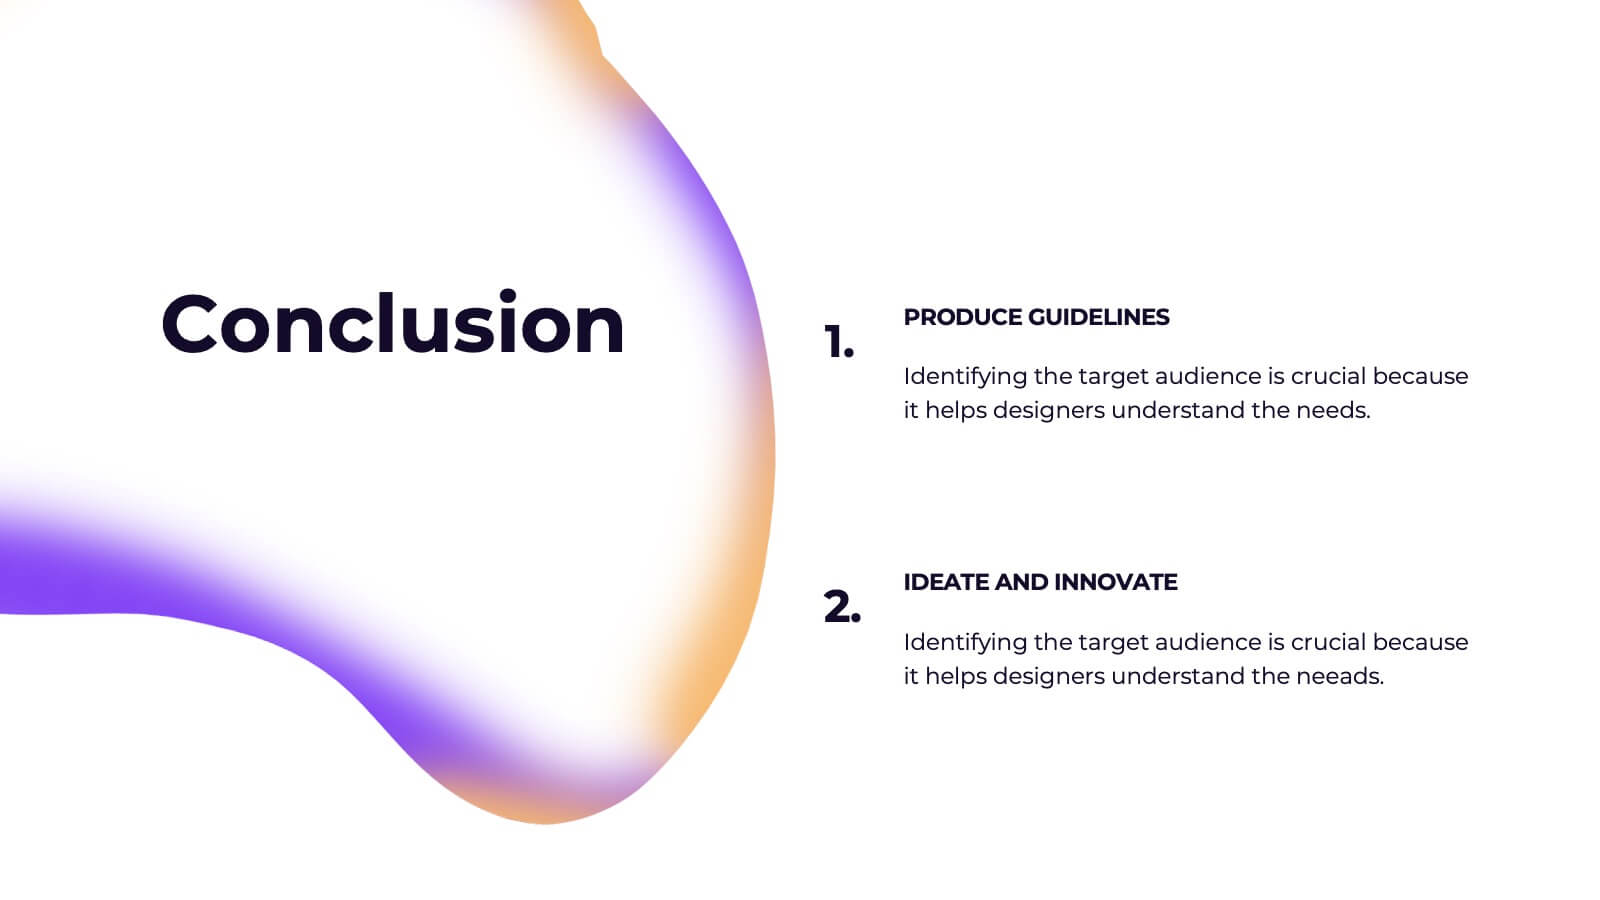
Shadowyn Brand Guidelines Proposal Presentation
Present your branding vision with a polished and professional template designed to capture the essence of your identity. This comprehensive set includes sections for brand values, identity components, and voice and tone, ensuring your message is consistent and memorable. Showcase essential details like color palettes, typography, and imagery with visually engaging slides. Communicate your market position, unique selling proposition, and brand strategy clearly to stakeholders. Dive into consumer personas and brand touchpoints for a deeper connection with your audience. Tailor each slide to align with your branding requirements. Perfect for use in PowerPoint, Google Slides, and Keynote, this template is ideal for creative professionals, marketing agencies, and business leaders aiming to make a lasting impression.


5 diapositivas
Online Video Games Infographics
Dive into the digital realm with our online video games infographics template, tailored in striking shades of purple, blue, pink, and black that echo the electric ambiance of the gaming world. This dynamic ensemble, perfect for game developers, and gaming communities, brings to life the universe of online gaming. Compatible with Powerpoint, Keynote, and Google Slides. It features creative graphics and gaming icons, capturing everything from player statistics to game mechanics. Whether you're spotlighting trends or unveiling a revolutionary game, this template levels up your presentation, engaging your audience right from the start screen.


6 diapositivas
Visual Resource Allocation Gantt
Easily map out team workload over time with the Visual Resource Allocation Gantt Presentation. This slide helps you assign tasks across monthly intervals, track resource distribution, and identify scheduling conflicts. Perfect for project managers, department heads, and HR planners aiming to balance capacity and timelines. Fully editable in PowerPoint, Keynote, and Google Slides.


6 diapositivas
Population Pyramid Infographic
A population pyramid, also known as an age-gender pyramid, is a graphical representation of the distribution of a population by age and gender. This infographic is a visually captivating presentation designed to illustrate the age and gender distribution of a population. It provides an easy-to-understand representation of the population structure, allowing viewers to grasp demographic patterns at a glance. Present your population data and demographic trends with this template. This enables viewers to grasp demographic patterns quickly and facilitates the key insights about a population's composition and changes over time.

20 diapositivas
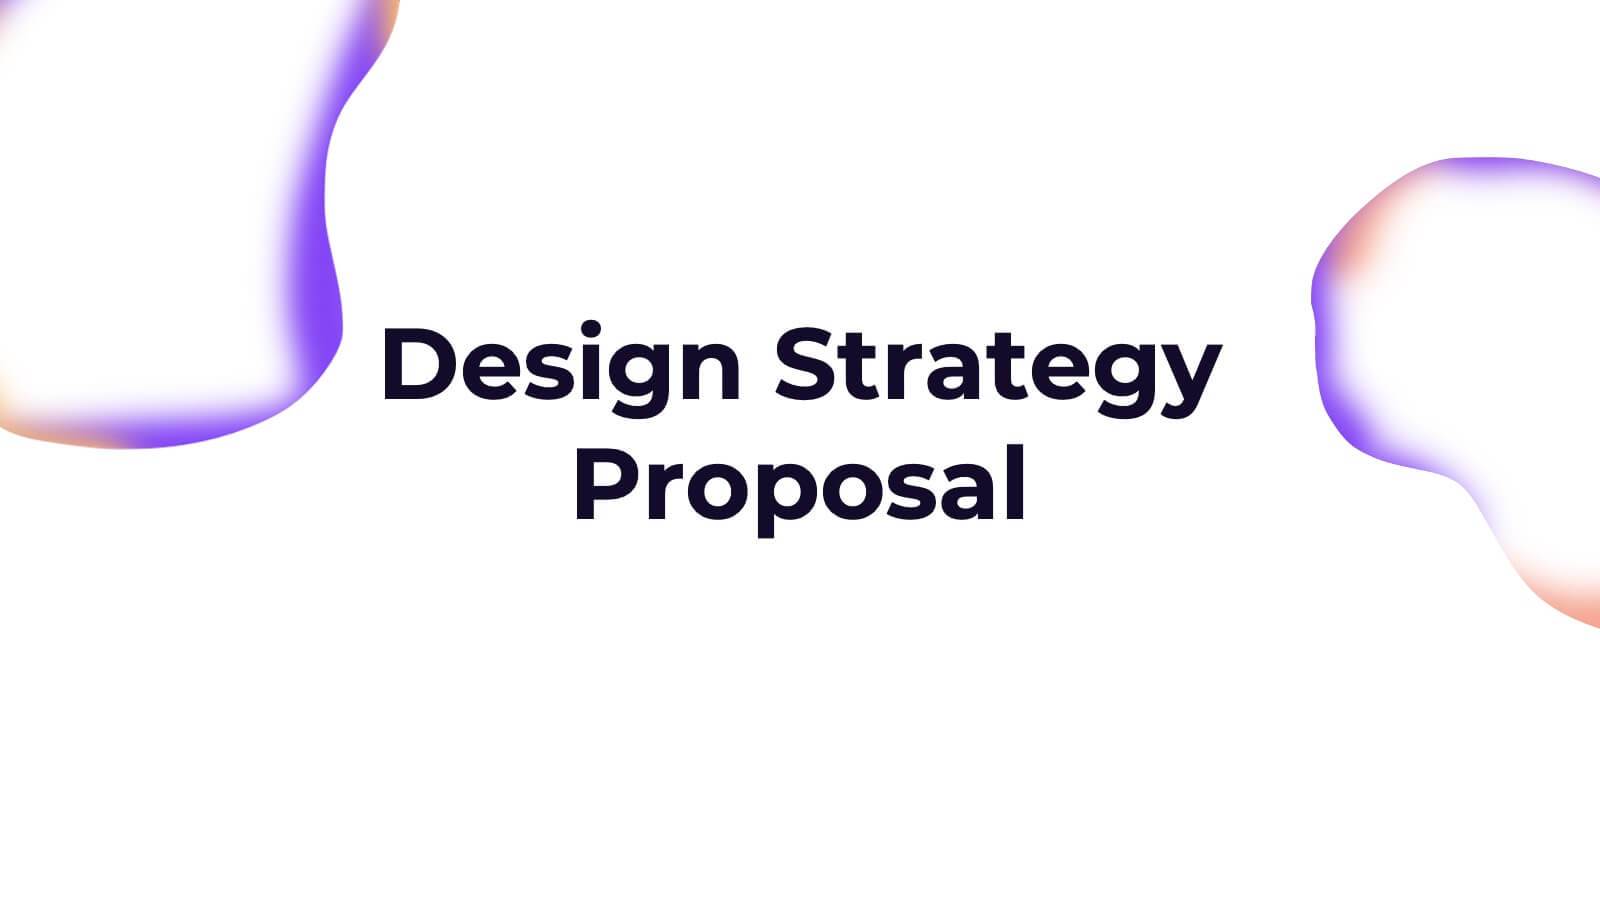
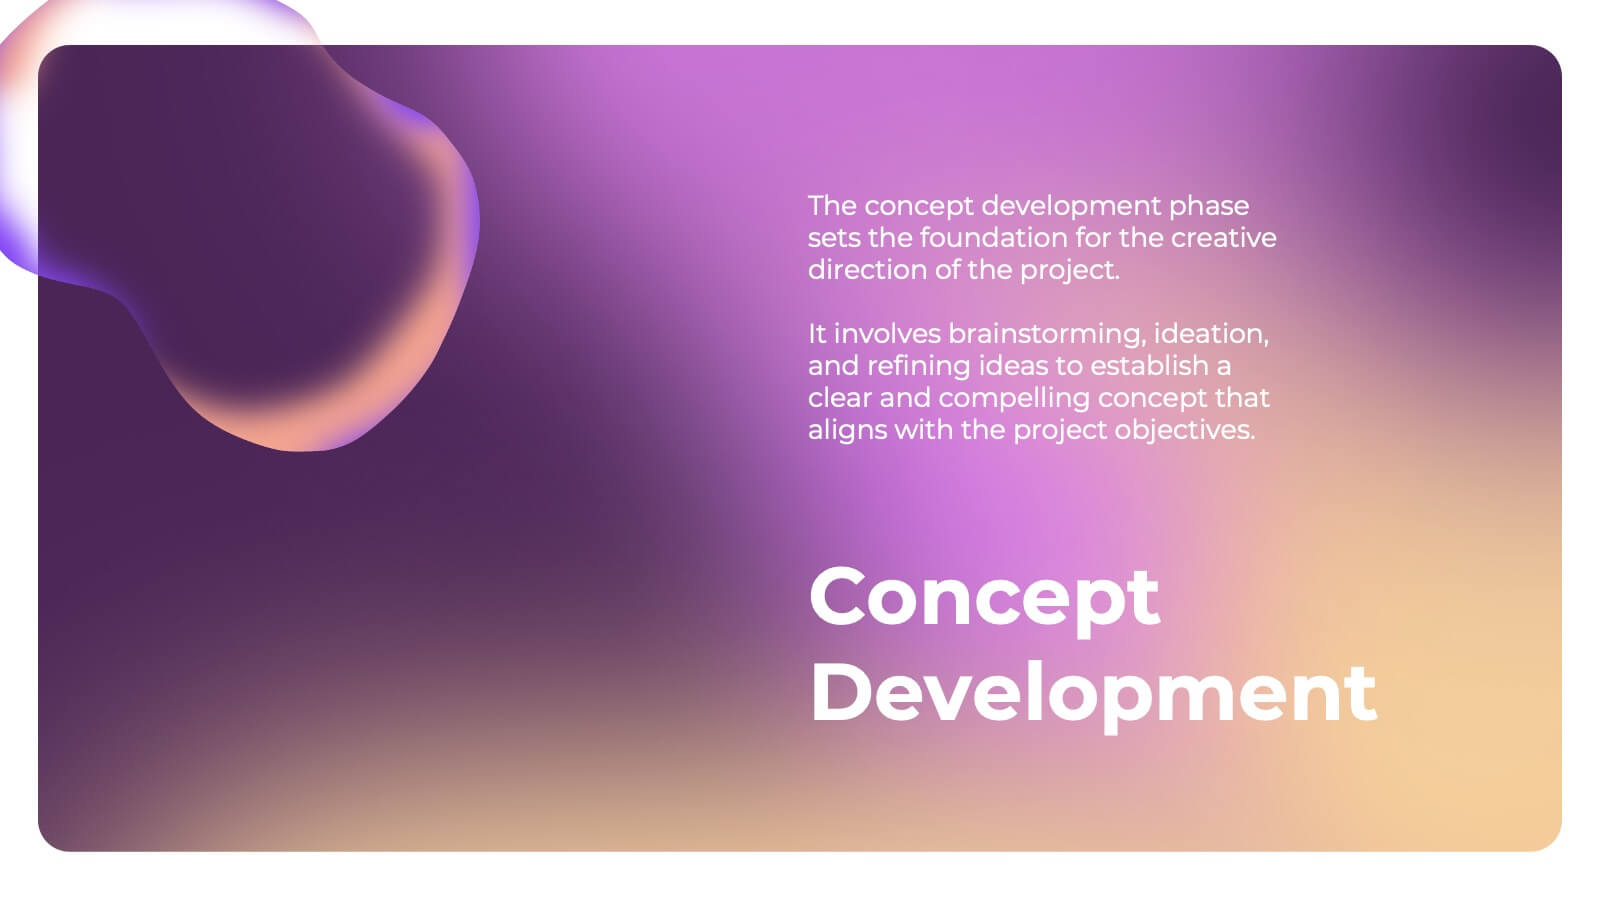
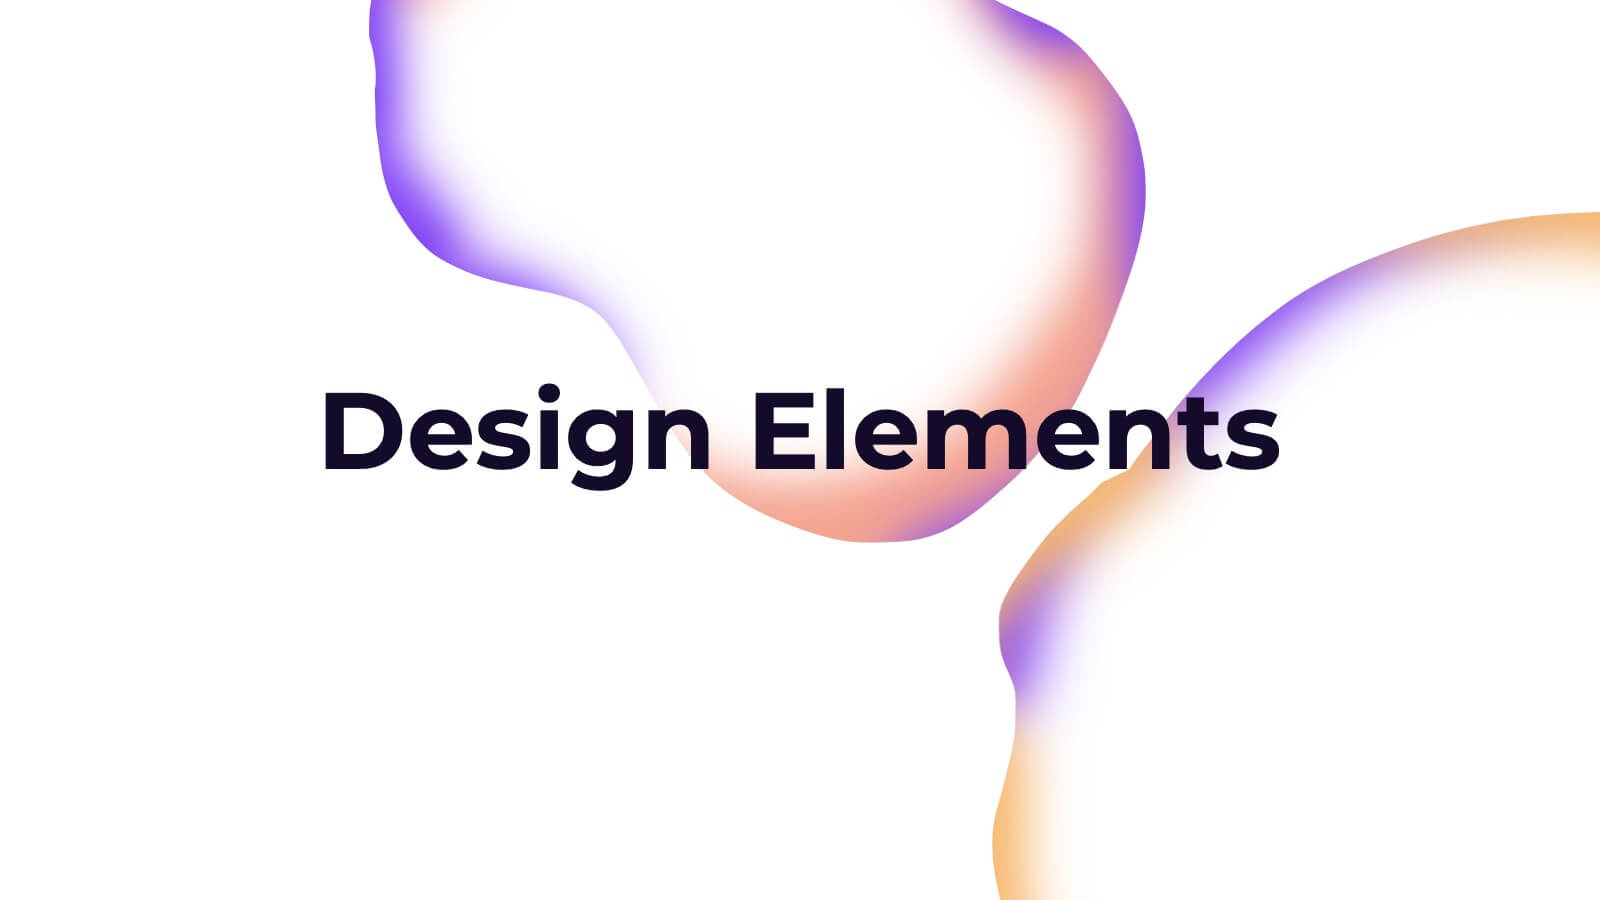
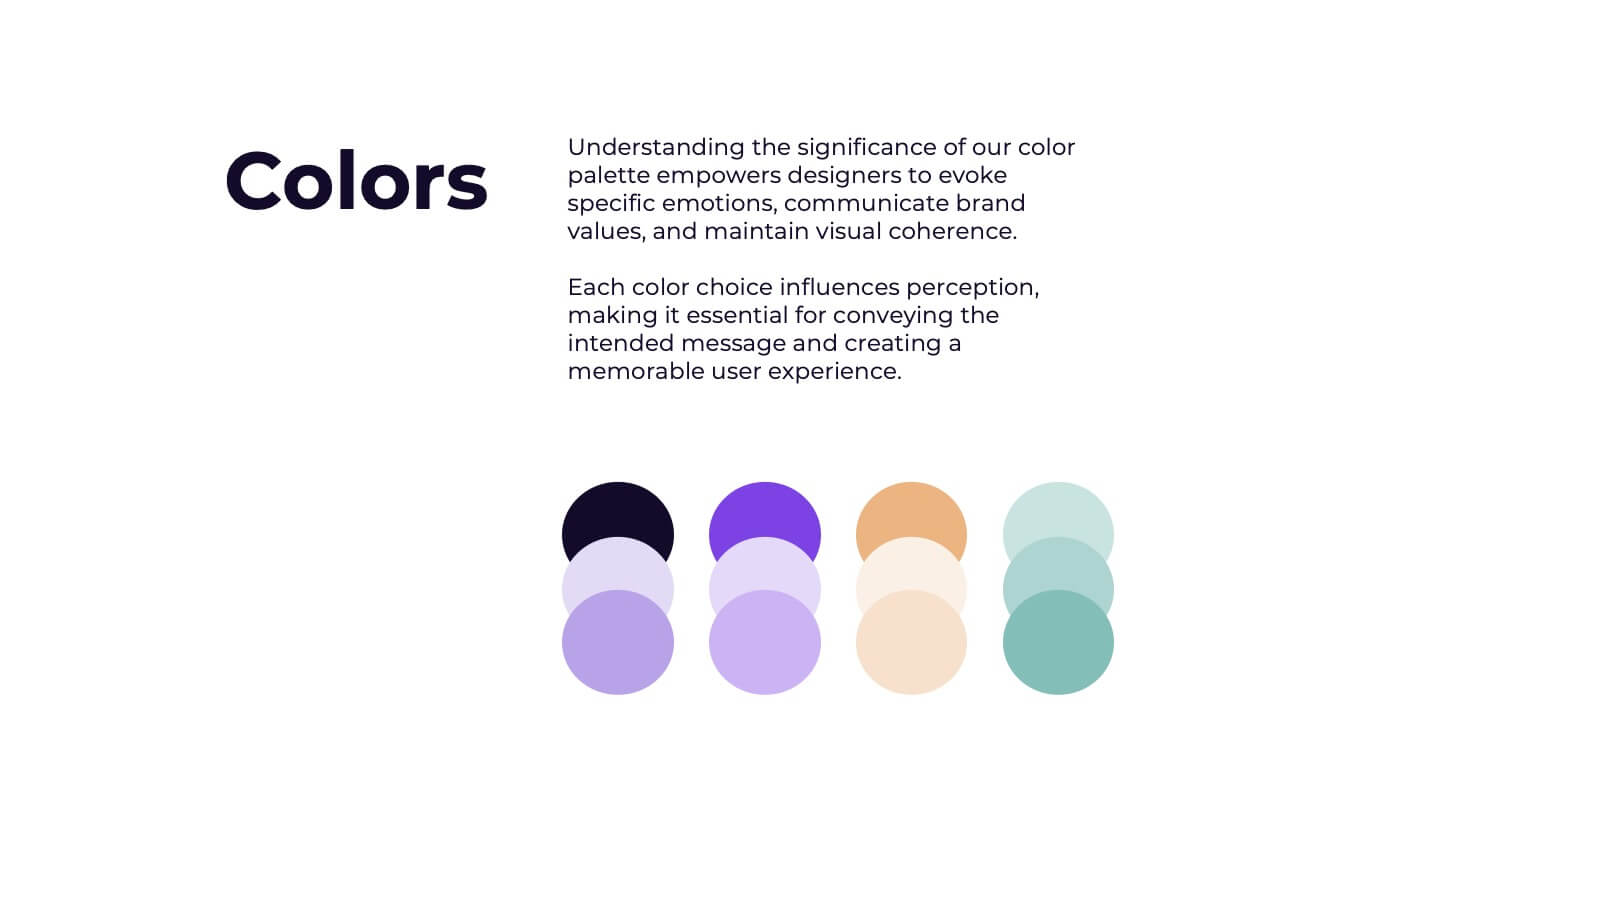
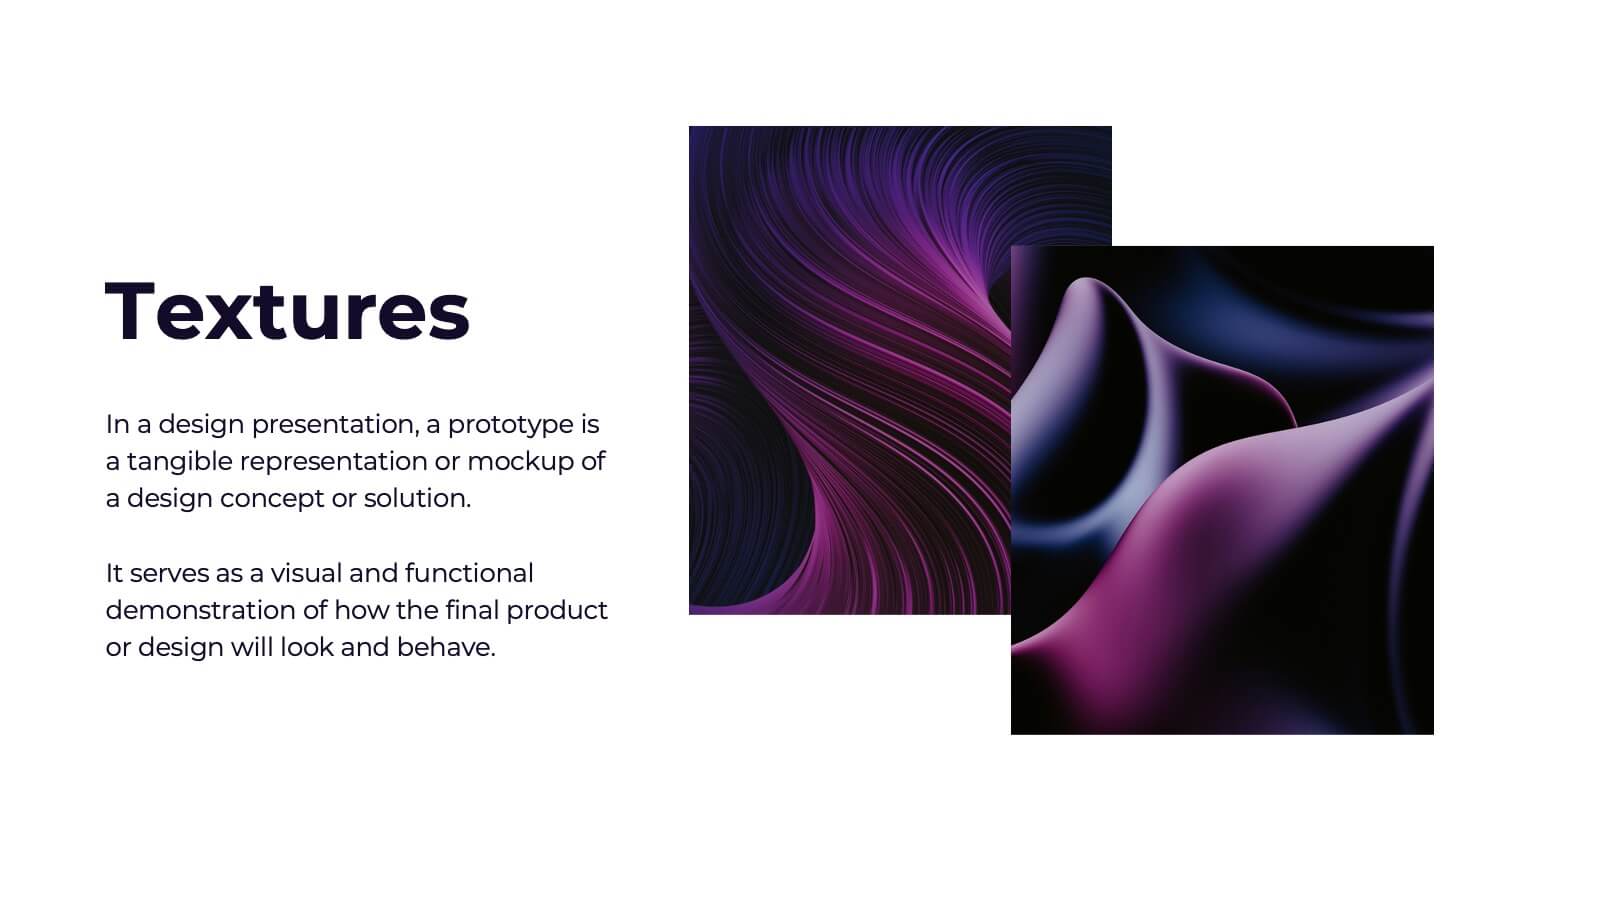
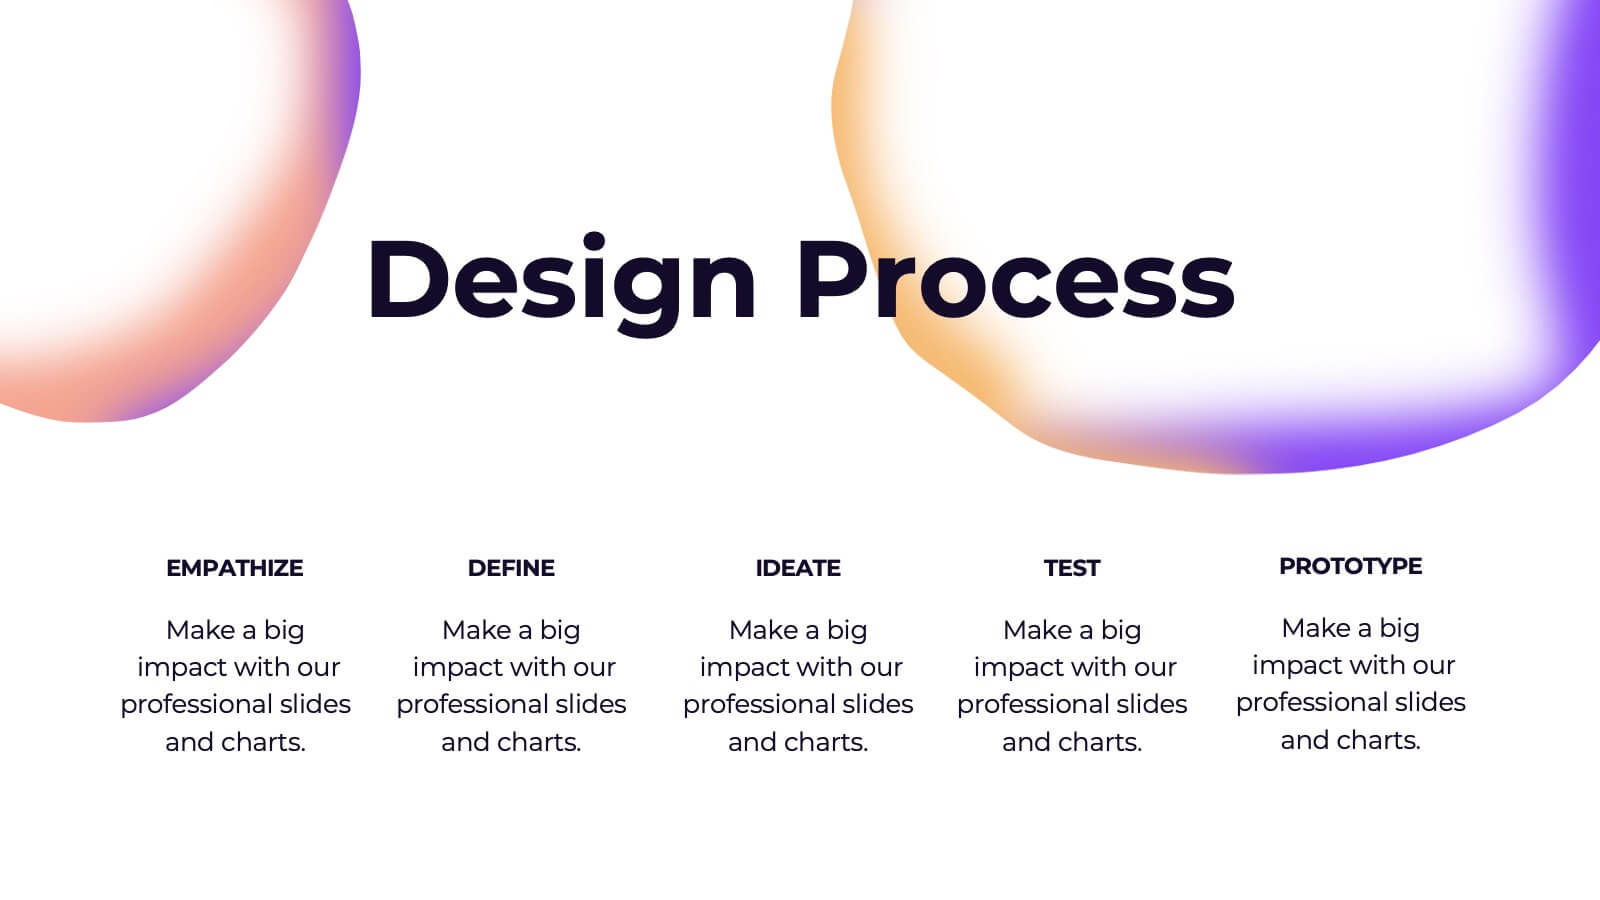
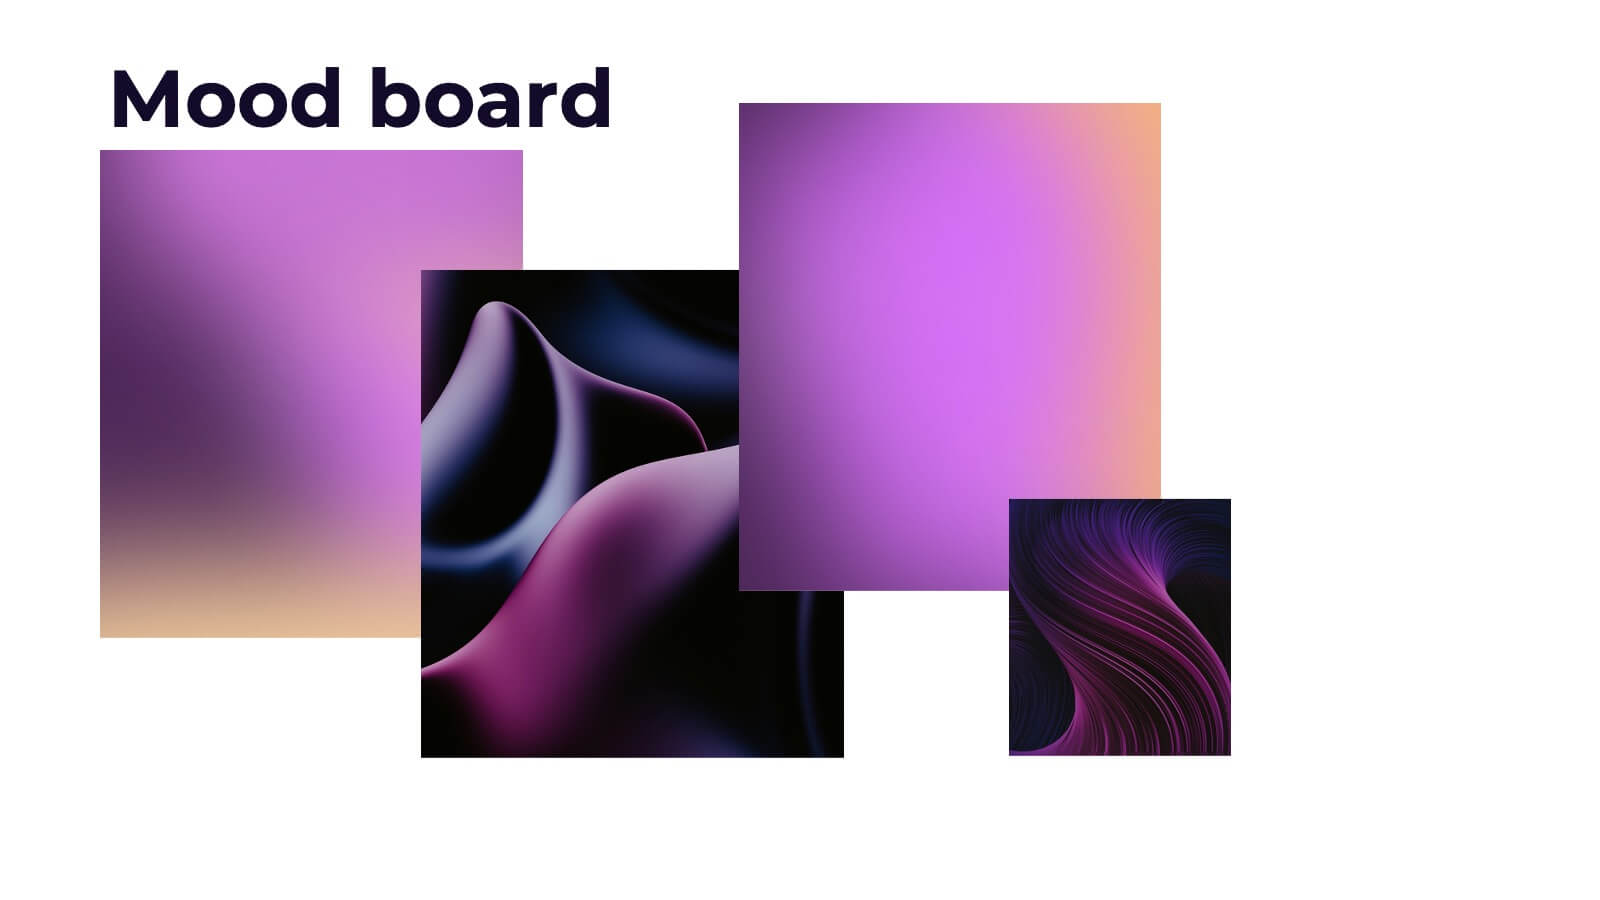
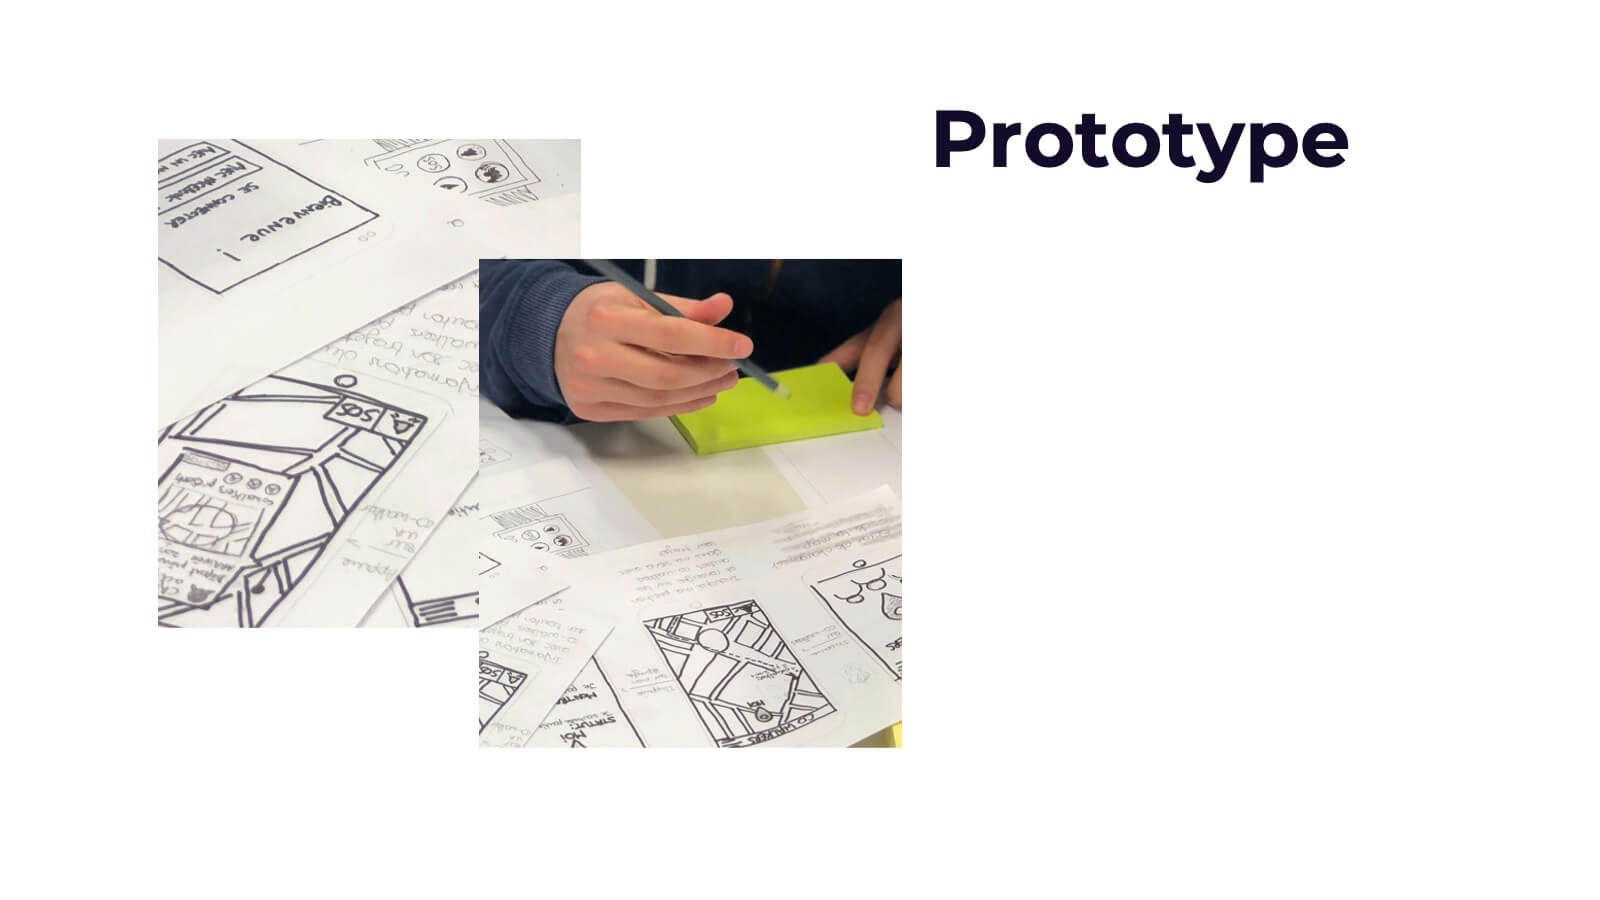
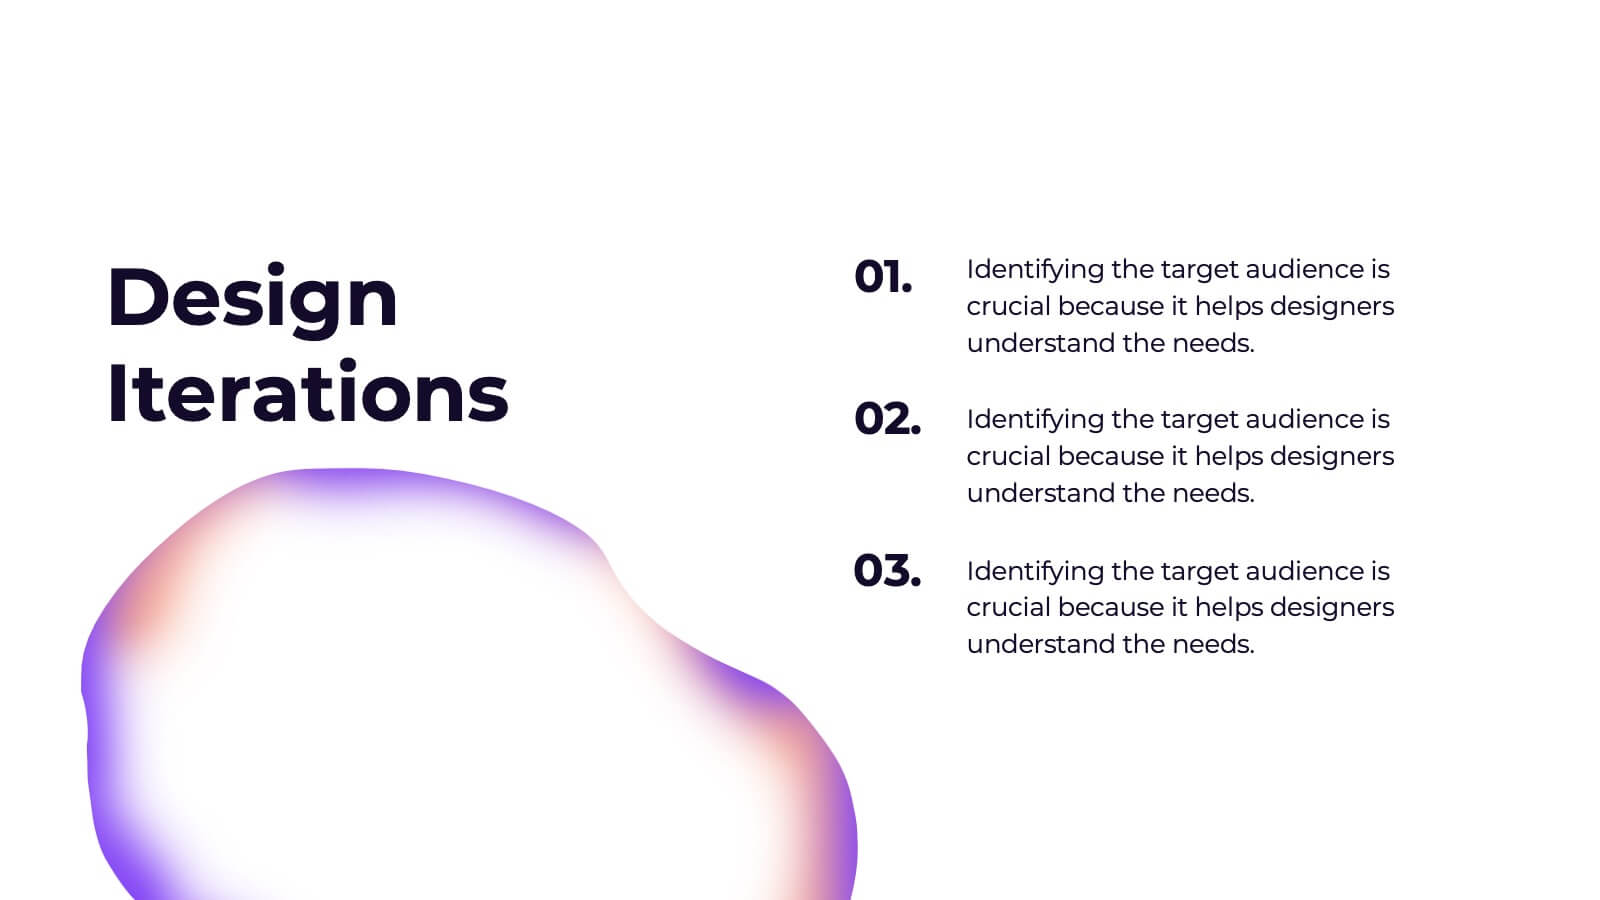
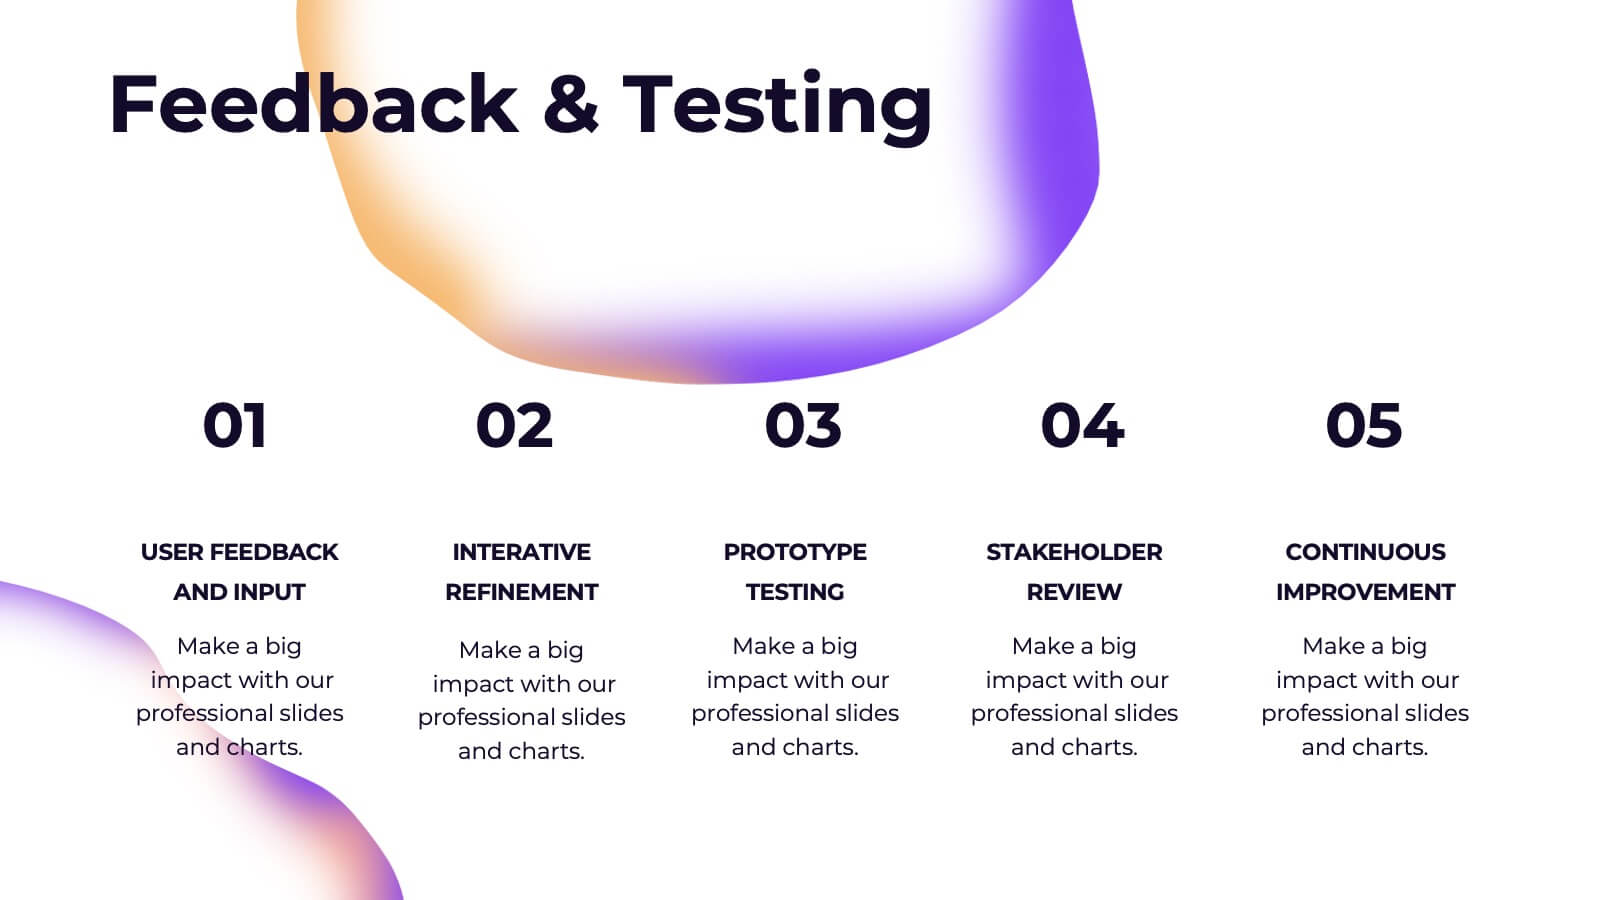
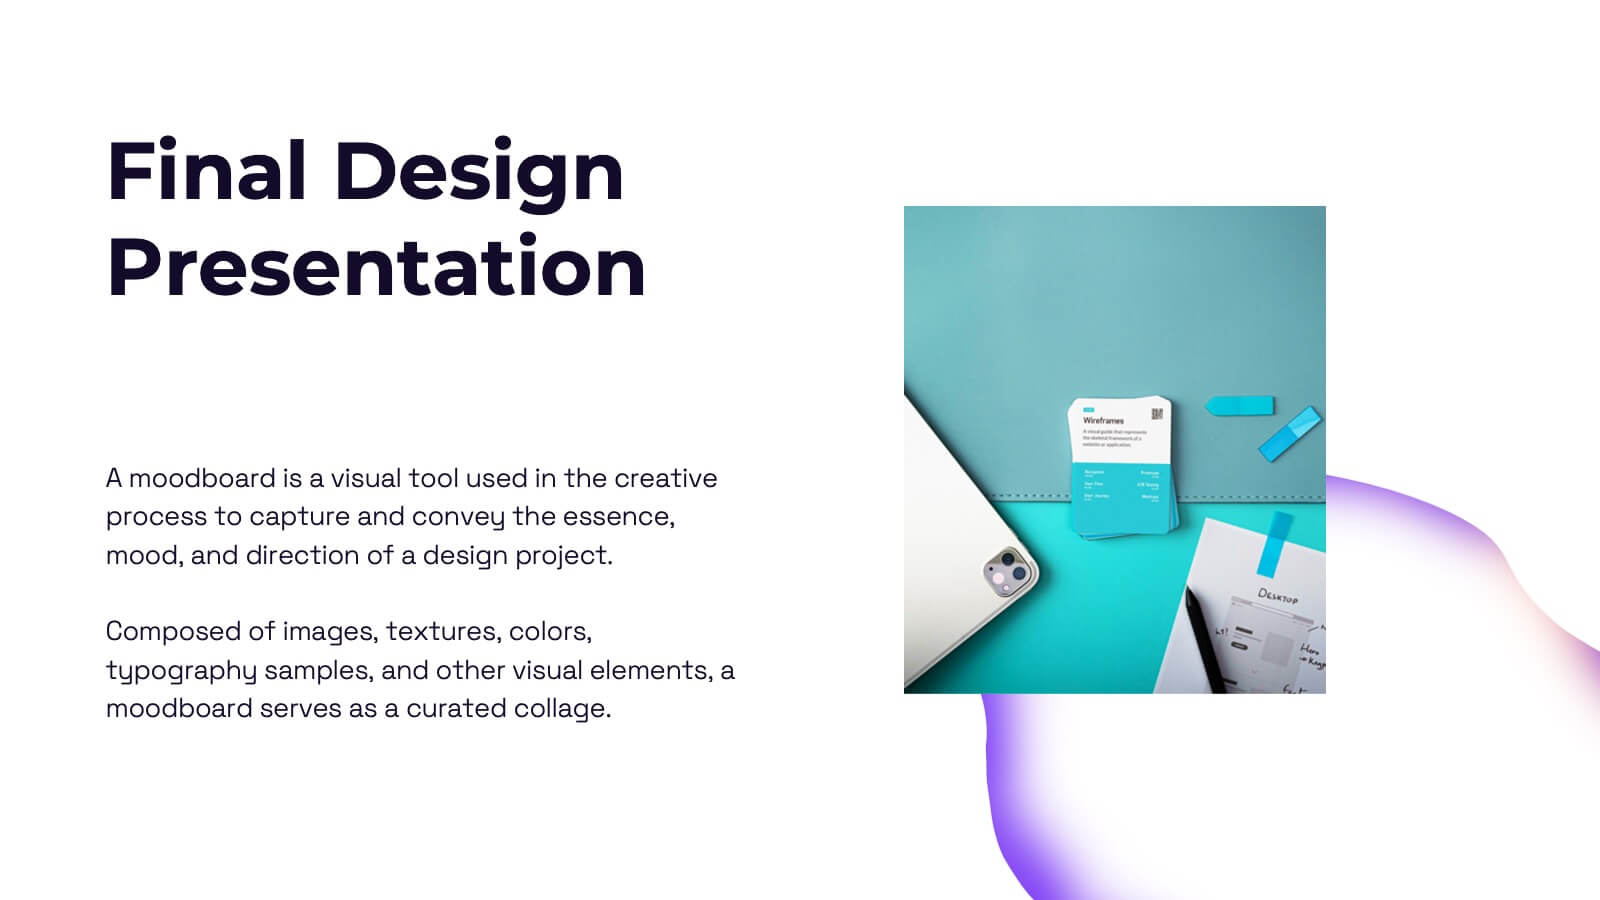
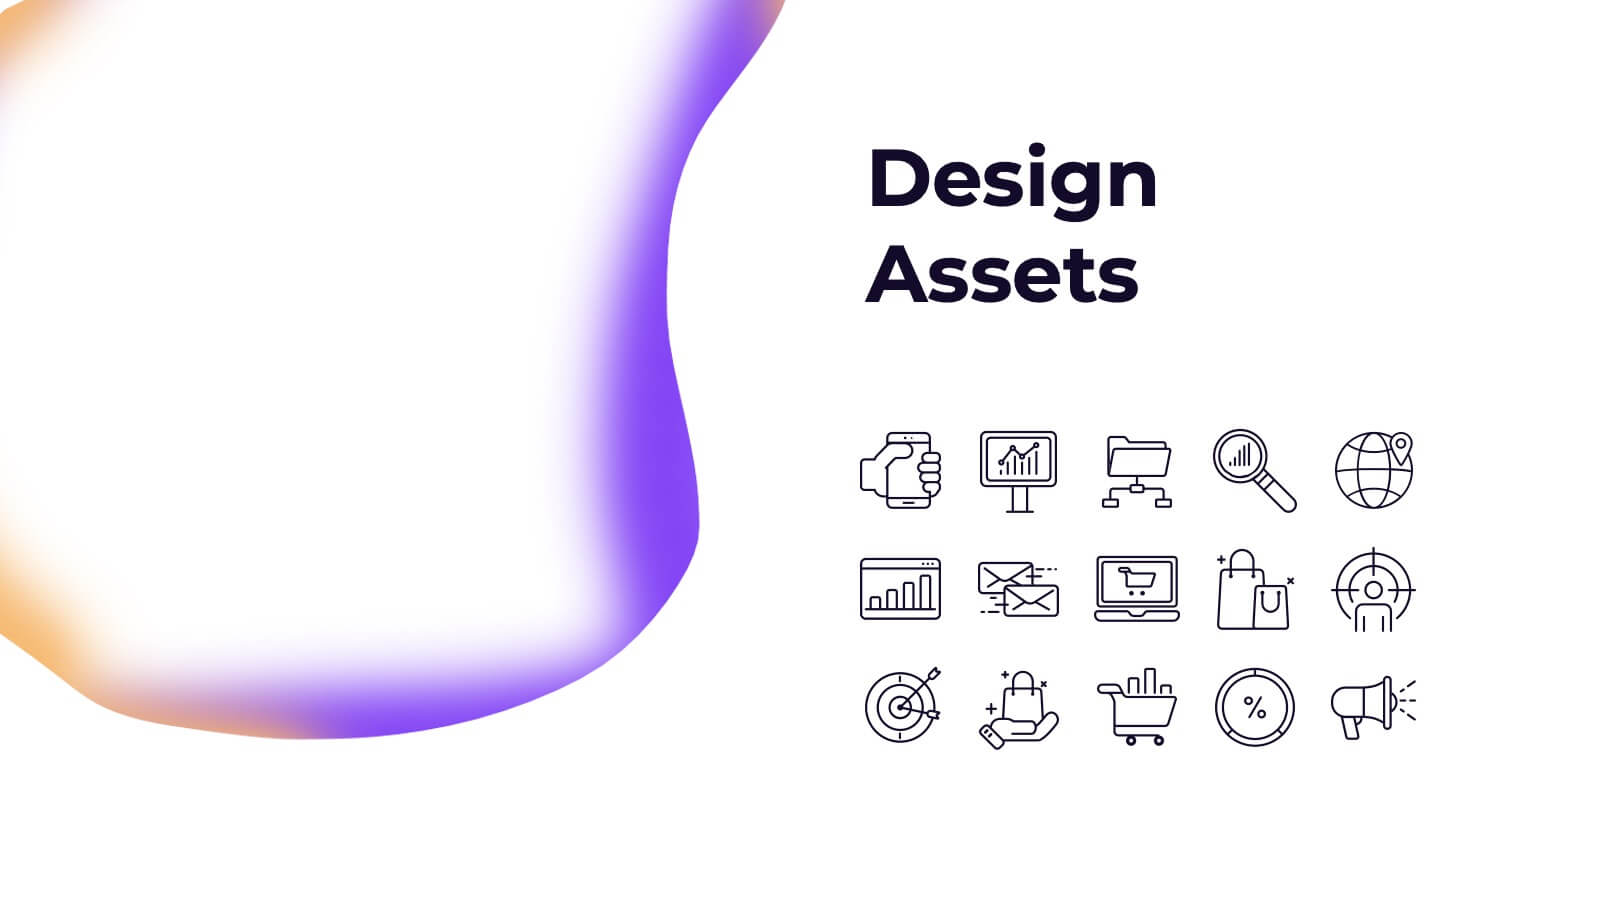
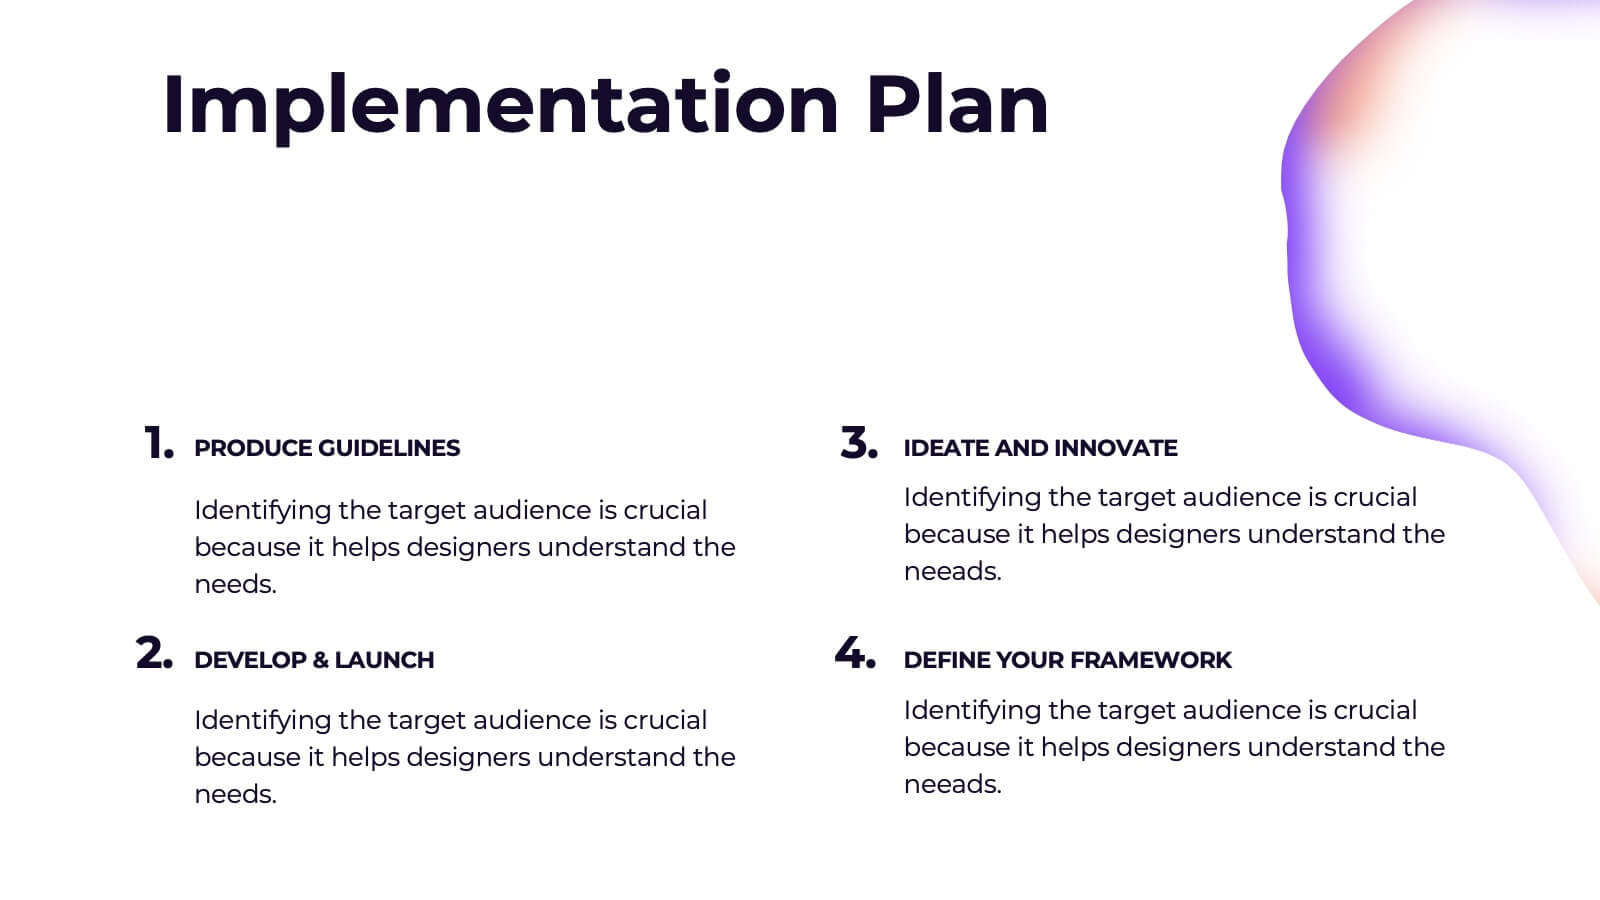
Valkyrie Design Strategy Proposal Presentation
Elevate your design strategy presentations with this visually captivating and modern template! It covers every step of the design process, from concept development and mood boards to prototype iterations and feedback. Ideal for showcasing design elements, textures, and assets, this template is perfect for creative professionals. Compatible with PowerPoint, Keynote, and Google Slides for easy, polished presentations.


5 diapositivas
Business Revenue and Expense Analysis Presentation
Present your financial growth and cost breakdowns with this 3D bar chart layout. Each bar is paired with clearly labeled sections to explain key revenue sources, expense categories, or profit margins. Ideal for business reviews, financial proposals, or investor reports. Fully editable in PowerPoint, Keynote, and Google Slides.


23 diapositivas
Fantara Product Launch Pitch Deck Presentation
Launch your product with confidence using this bold and engaging pitch deck presentation template. Featuring key slides such as problem statement, market opportunity, revenue model, and growth projections, it helps you effectively present your business idea. Ideal for startups and entrepreneurs. Compatible with PowerPoint, Keynote, and Google Slides for easy customization.


5 diapositivas
Business Workflow Process Presentation
Optimize your operations with the Business Workflow Process template, designed to visually map out tasks and streamline workflows. Perfect for project managers and teams, this template enhances clarity and collaboration. Fully customizable and compatible with PowerPoint, Keynote, and Google Slides, making professional workflow presentations seamless and efficient.


5 diapositivas
HIV Treatment & Awareness Infographics
Explore the critical realms of healthcare with our HIV treatment & awareness infographics. Rendered in striking shades of red and blue, this vertical, informative, and creatively designed template serves as a profound educational tool. It's intricately crafted for healthcare professionals, awareness campaign coordinators, and community health educators, providing a visual journey through the complexities of HIV understanding. This infographic includes compelling graphics and relevant icons, making it indispensable for those seeking to inform, prevent, and empower communities about HIV. Elevate awareness with clarity and a deep sense of humanity, one fact at a time.


5 diapositivas
IT Infrastructure and Support Presentation
Optimize your IT presentations with the IT Infrastructure and Support Presentation template. Featuring a structured, step-by-step layout, this slide design visually conveys IT infrastructure processes, system support workflows, and key technology elements. Ideal for IT teams, tech consultants, and business professionals looking to illustrate complex IT strategies effectively. Fully editable in PowerPoint, Keynote, and Google Slides for seamless customization.


20 diapositivas
Pegasus Sales Forecast Presentation
This bold sales forecast template combines powerful visuals with a sleek design to highlight key performance metrics, competitive analysis, and pricing strategy. With sections for service overview, testimonials, promotions, and next steps, it’s ideal for impactful presentations. Compatible with PowerPoint, Keynote, and Google Slides, delivering your message has never been easier.


7 diapositivas
Oceania Political Map Infographic
This Oceania Political Map infographic template is a multifaceted tool designed for detailed geographic presentations. Fully compatible with PowerPoint, Google Slides, and Keynote, it offers various map designs and data visualization options like pie charts, bar graphs, and icons. This template allows presenters to highlight key statistics such as population distribution, economic data, or social demographics of the region. It features a subtle color palette that differentiates each section without overwhelming the viewer, making it ideal for educators, policy makers, and business professionals who need to present complex data related to Oceania in a visually engaging format.


34 diapositivas
Accelerator Pitch Deck
Welcome to our Accelerator Pitch Deck presentation! This template is designed to help you create a captivating pitch deck for your startup or business to showcase your venture to potential programs or investors. With its sleek and modern design, this template will help you effectively communicate your business idea, market opportunity, growth plans, and financial projections to capture the attention of programs and investors. This template can also cover other various aspects of your business, including your problem and solution, market validation, customer acquisition, competitor analysis, milestones, team introduction, and more.


4 diapositivas
Survey Response Data Visuals Presentation
Present your survey data clearly with this radial icon-based layout. Show response percentages alongside descriptive titles and modern visuals. Ideal for feedback analysis or research summaries. Fully editable in Canva, PowerPoint, or Google Slides, this template offers a clean, professional look to highlight key insights with ease.


4 diapositivas
Operational KPI Monitoring Dashboard
Stay on top of business performance with the Operational KPI Monitoring Dashboard Presentation. This slide is designed to visually communicate key operational metrics using gradient-filled progress bars, percentage indicators, and area charts. Perfect for status updates, executive reporting, or performance reviews, it enables quick analysis of KPIs at a glance. Fully customizable in PowerPoint, Keynote, and Google Slides.


5 diapositivas
Beer Drinking Infographics
The art of beer encompasses the brewing process, the craftsmanship of creating unique flavors and styles, and the enjoyment of this ancient beverage. These infographics are perfect for showcasing key facts, statistics, and interesting information related to the world of beer. This template is ideal for breweries, beer enthusiasts, bartenders, or anyone interested in sharing knowledge about different beer types, brewing processes, or beer culture. The template offers a variety of slide layouts to cover different aspects of beer drinking. The template provides sections for discussing different beer styles, brewing processes, and beer tasting.