


Características


¿Tienes alguna pregunta?
Recomendar


5 diapositivas
Long-Term Business Strategy Framework
Outline your roadmap to sustainable growth with the Long-Term Business Strategy Framework Presentation. This slide features a bold, horizontal arrow layout divided into four segments—each representing a core phase of your strategic plan. It includes icons and space for key insights under each step, making it perfect for visualizing vision alignment, operational planning, or organizational milestones. Fully customizable in PowerPoint, Keynote, and Google Slides.


5 diapositivas
Problem-Solving and Business Solutions
Simplify complex challenges with this dynamic problem-solving and business solutions slide. Designed with a clear, step-by-step layout, this template helps outline problems, strategies, solutions, and outcomes in a visually engaging way. Ideal for workshops, strategic planning sessions, consulting proposals, and team brainstorming. Fully editable and compatible with PowerPoint, Keynote, and Google Slides.


4 diapositivas
Data Analytics Heat Map Presentation
Turn complex data into clear insights with this dynamic heat map template! Ideal for visualizing trends, risks, or performance metrics, this design enhances decision-making at a glance. With fully customizable elements, it simplifies data analysis for business, finance, or research. Compatible with PowerPoint, Keynote, and Google Slides for seamless use.


5 diapositivas
Big Data Analytics Process Presentation
Visualize your data journey with this clean and professional slide layout. Featuring four circular icons around a central cloud graphic, it’s ideal for showcasing data collection, processing, analysis, and storage. Perfect for tech briefings or analytics teams. Fully editable and compatible with PowerPoint, Keynote, and Google Slides.


26 diapositivas
Creative Programming Presentation
The process of Developing Software involves the development of everything from a simple application or web page to complex enterprise systems. Software development is a collaborative effort between developers, designers, and other stakeholders. This Creative Template is perfect for delivering presentations about the latest projects, apps and ideas. The simple layout allows you to focus on what matters most, your idea. Make your most important presentation spectacular with this template. With high-powered visual content and a smooth flow, you’ll keep your audience engaged from beginning to end!


5 diapositivas
Risk and Obstacle Mapping Presentation
Turn up the heat on problem-solving with this vibrant template designed to visualize risks and roadblocks clearly. Use this layout to assess, categorize, and communicate potential business obstacles with precision. It's ideal for risk analysis presentations and strategy meetings. Fully compatible with PowerPoint, Keynote, and Google Slides for easy editing.


5 diapositivas
North America Business Landscape Map Presentation
Explore the business terrain with the "North America Business Landscape Map" template, which delivers a comprehensive visualization of business data across various regions. Designed for strategic presentations, it enables clear communication of market insights and data points, crucial for decision-making. This template is compatible with PowerPoint, Keynote, and Google Slides, enhancing its utility for professionals in diverse fields.


4 diapositivas
Strategic SWOT Matrix Overview Presentation
Present your strategic insights with clarity using the Strategic SWOT Matrix Overview Presentation. This modern slide layout features a sleek horizontal design that separates Strengths, Weaknesses, Opportunities, and Threats into visually distinct segments. Ideal for business planning, strategy reviews, or team discussions. Fully editable in PowerPoint, Canva, and Google Slides.


6 diapositivas
Scope Planning Template for Project Teams Presentation
Turn teamwork into strategy with a clear, circular layout that maps every phase of your project plan. This modern presentation helps teams define objectives, assign roles, and visualize scope effortlessly. Easy to edit and fully compatible with PowerPoint, Keynote, and Google Slides for seamless collaboration and customization.

20 diapositivas
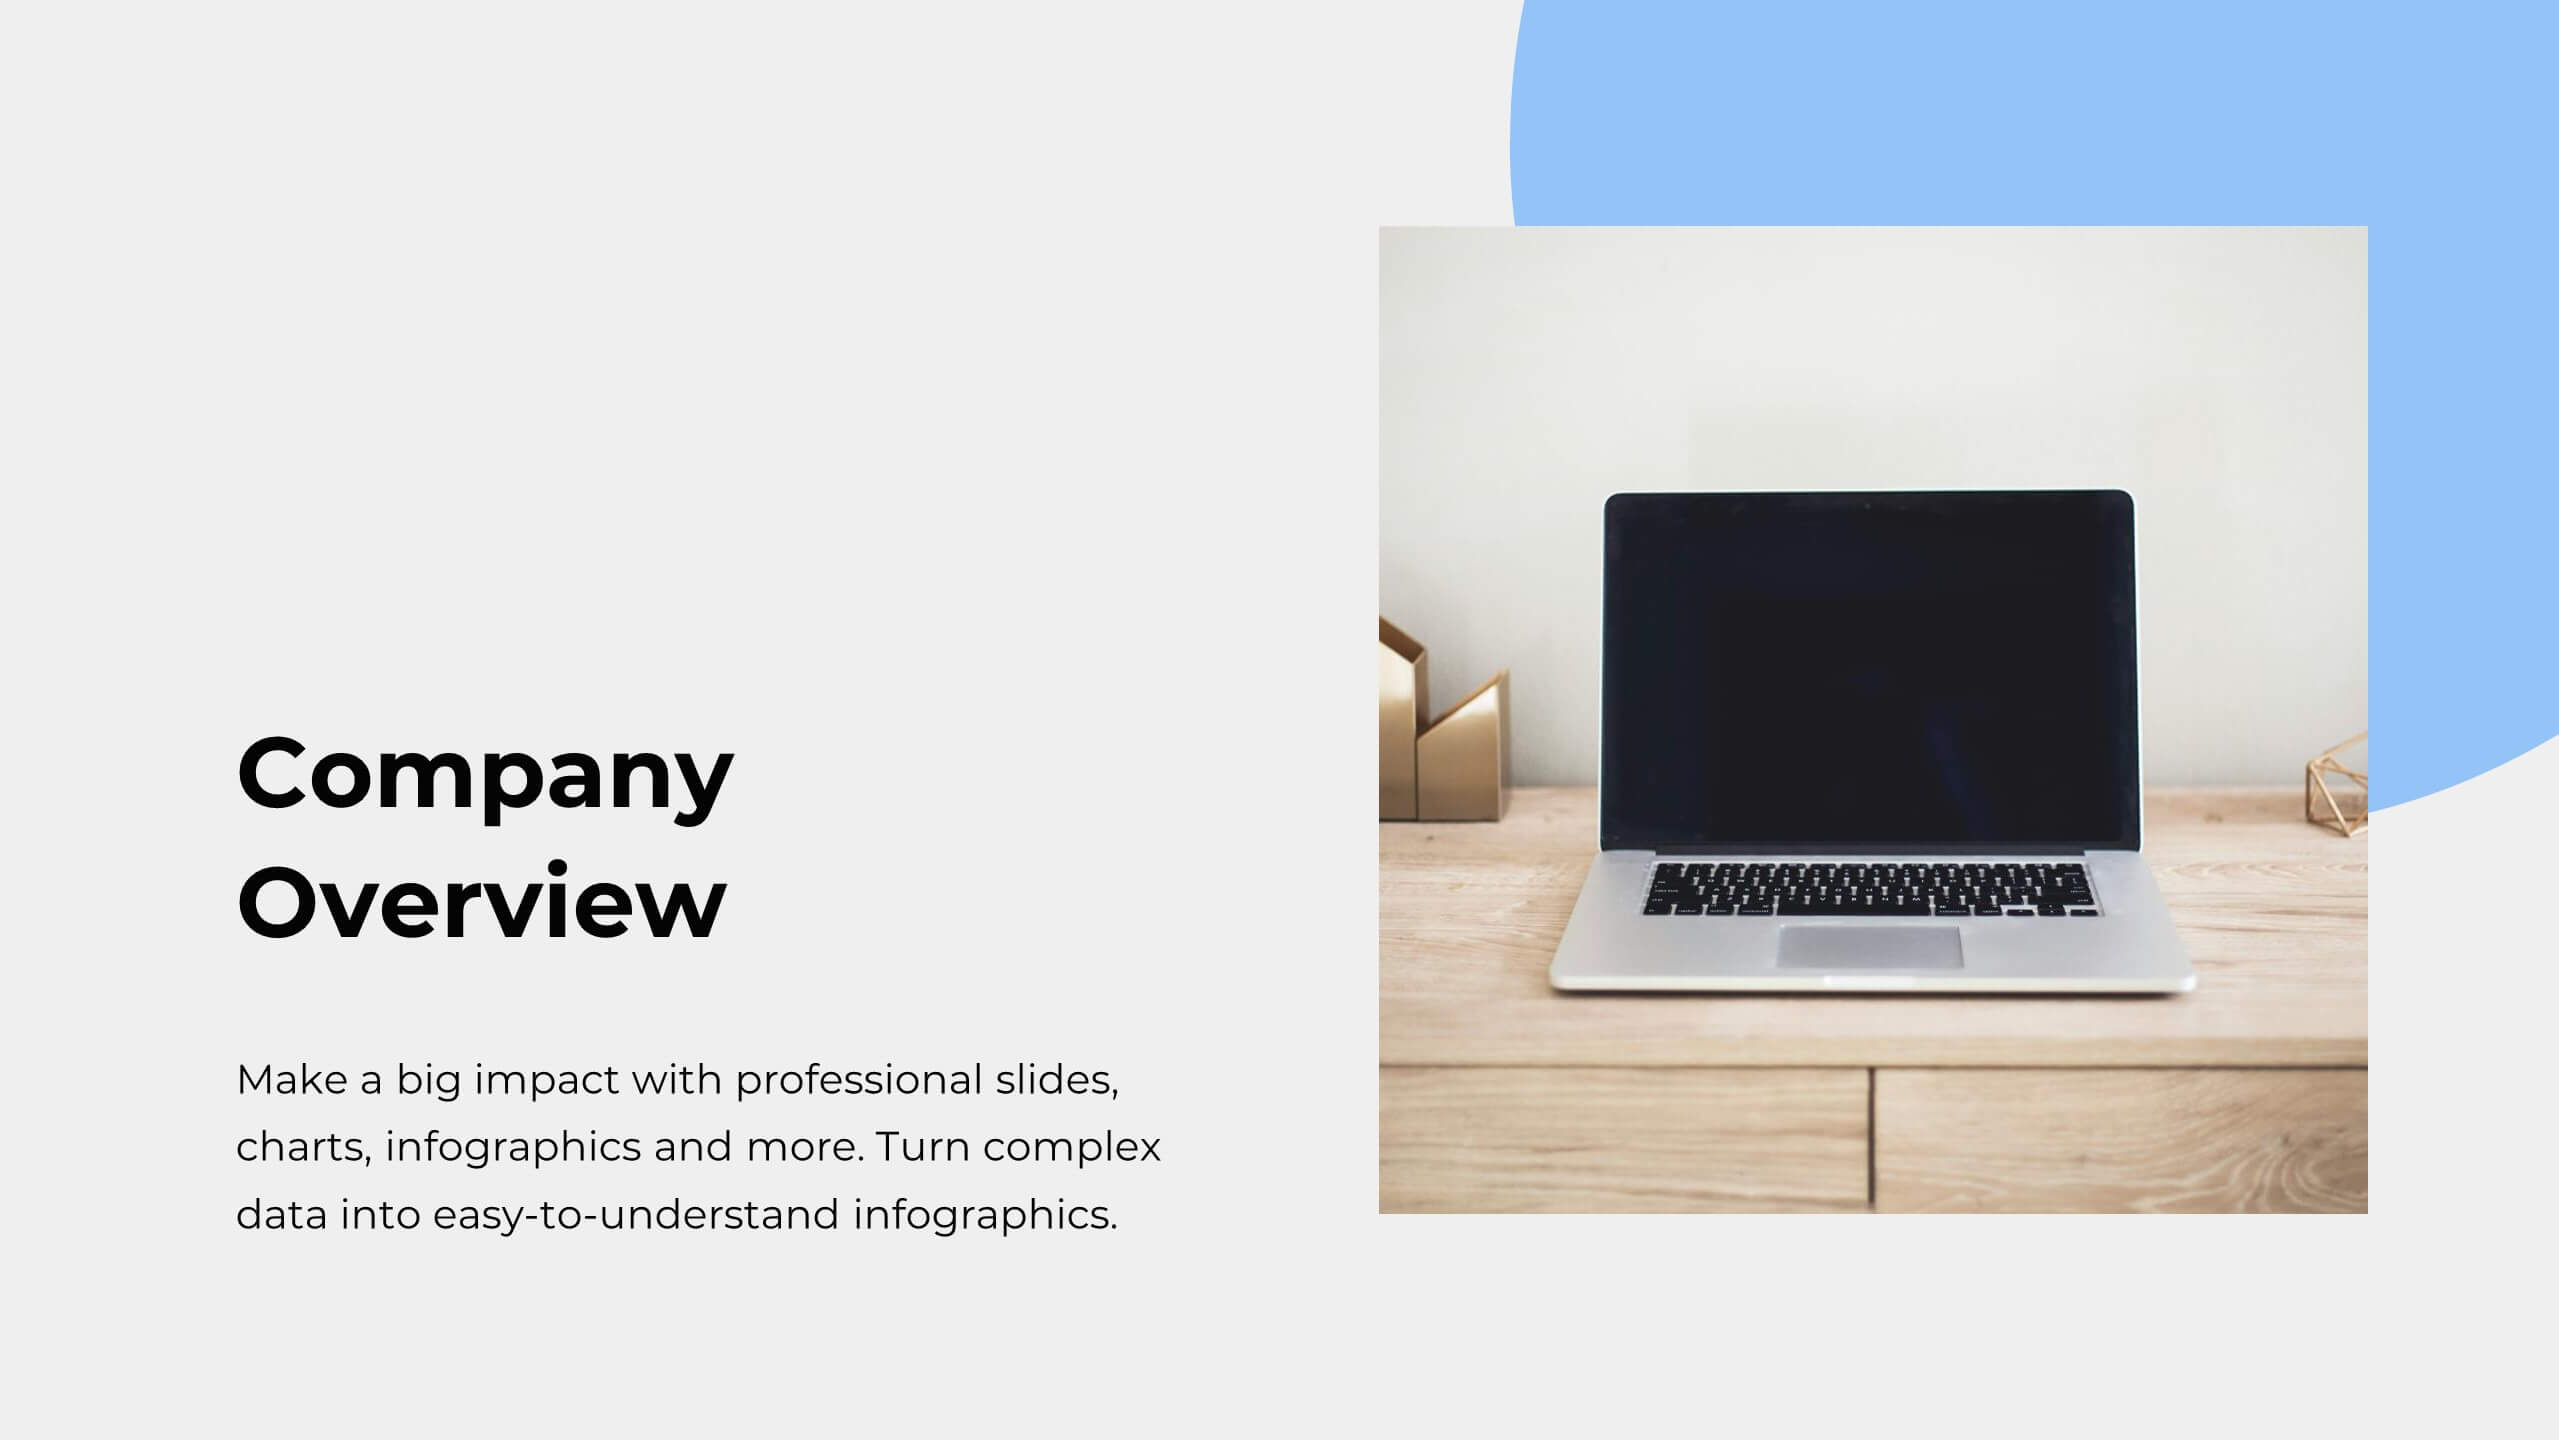
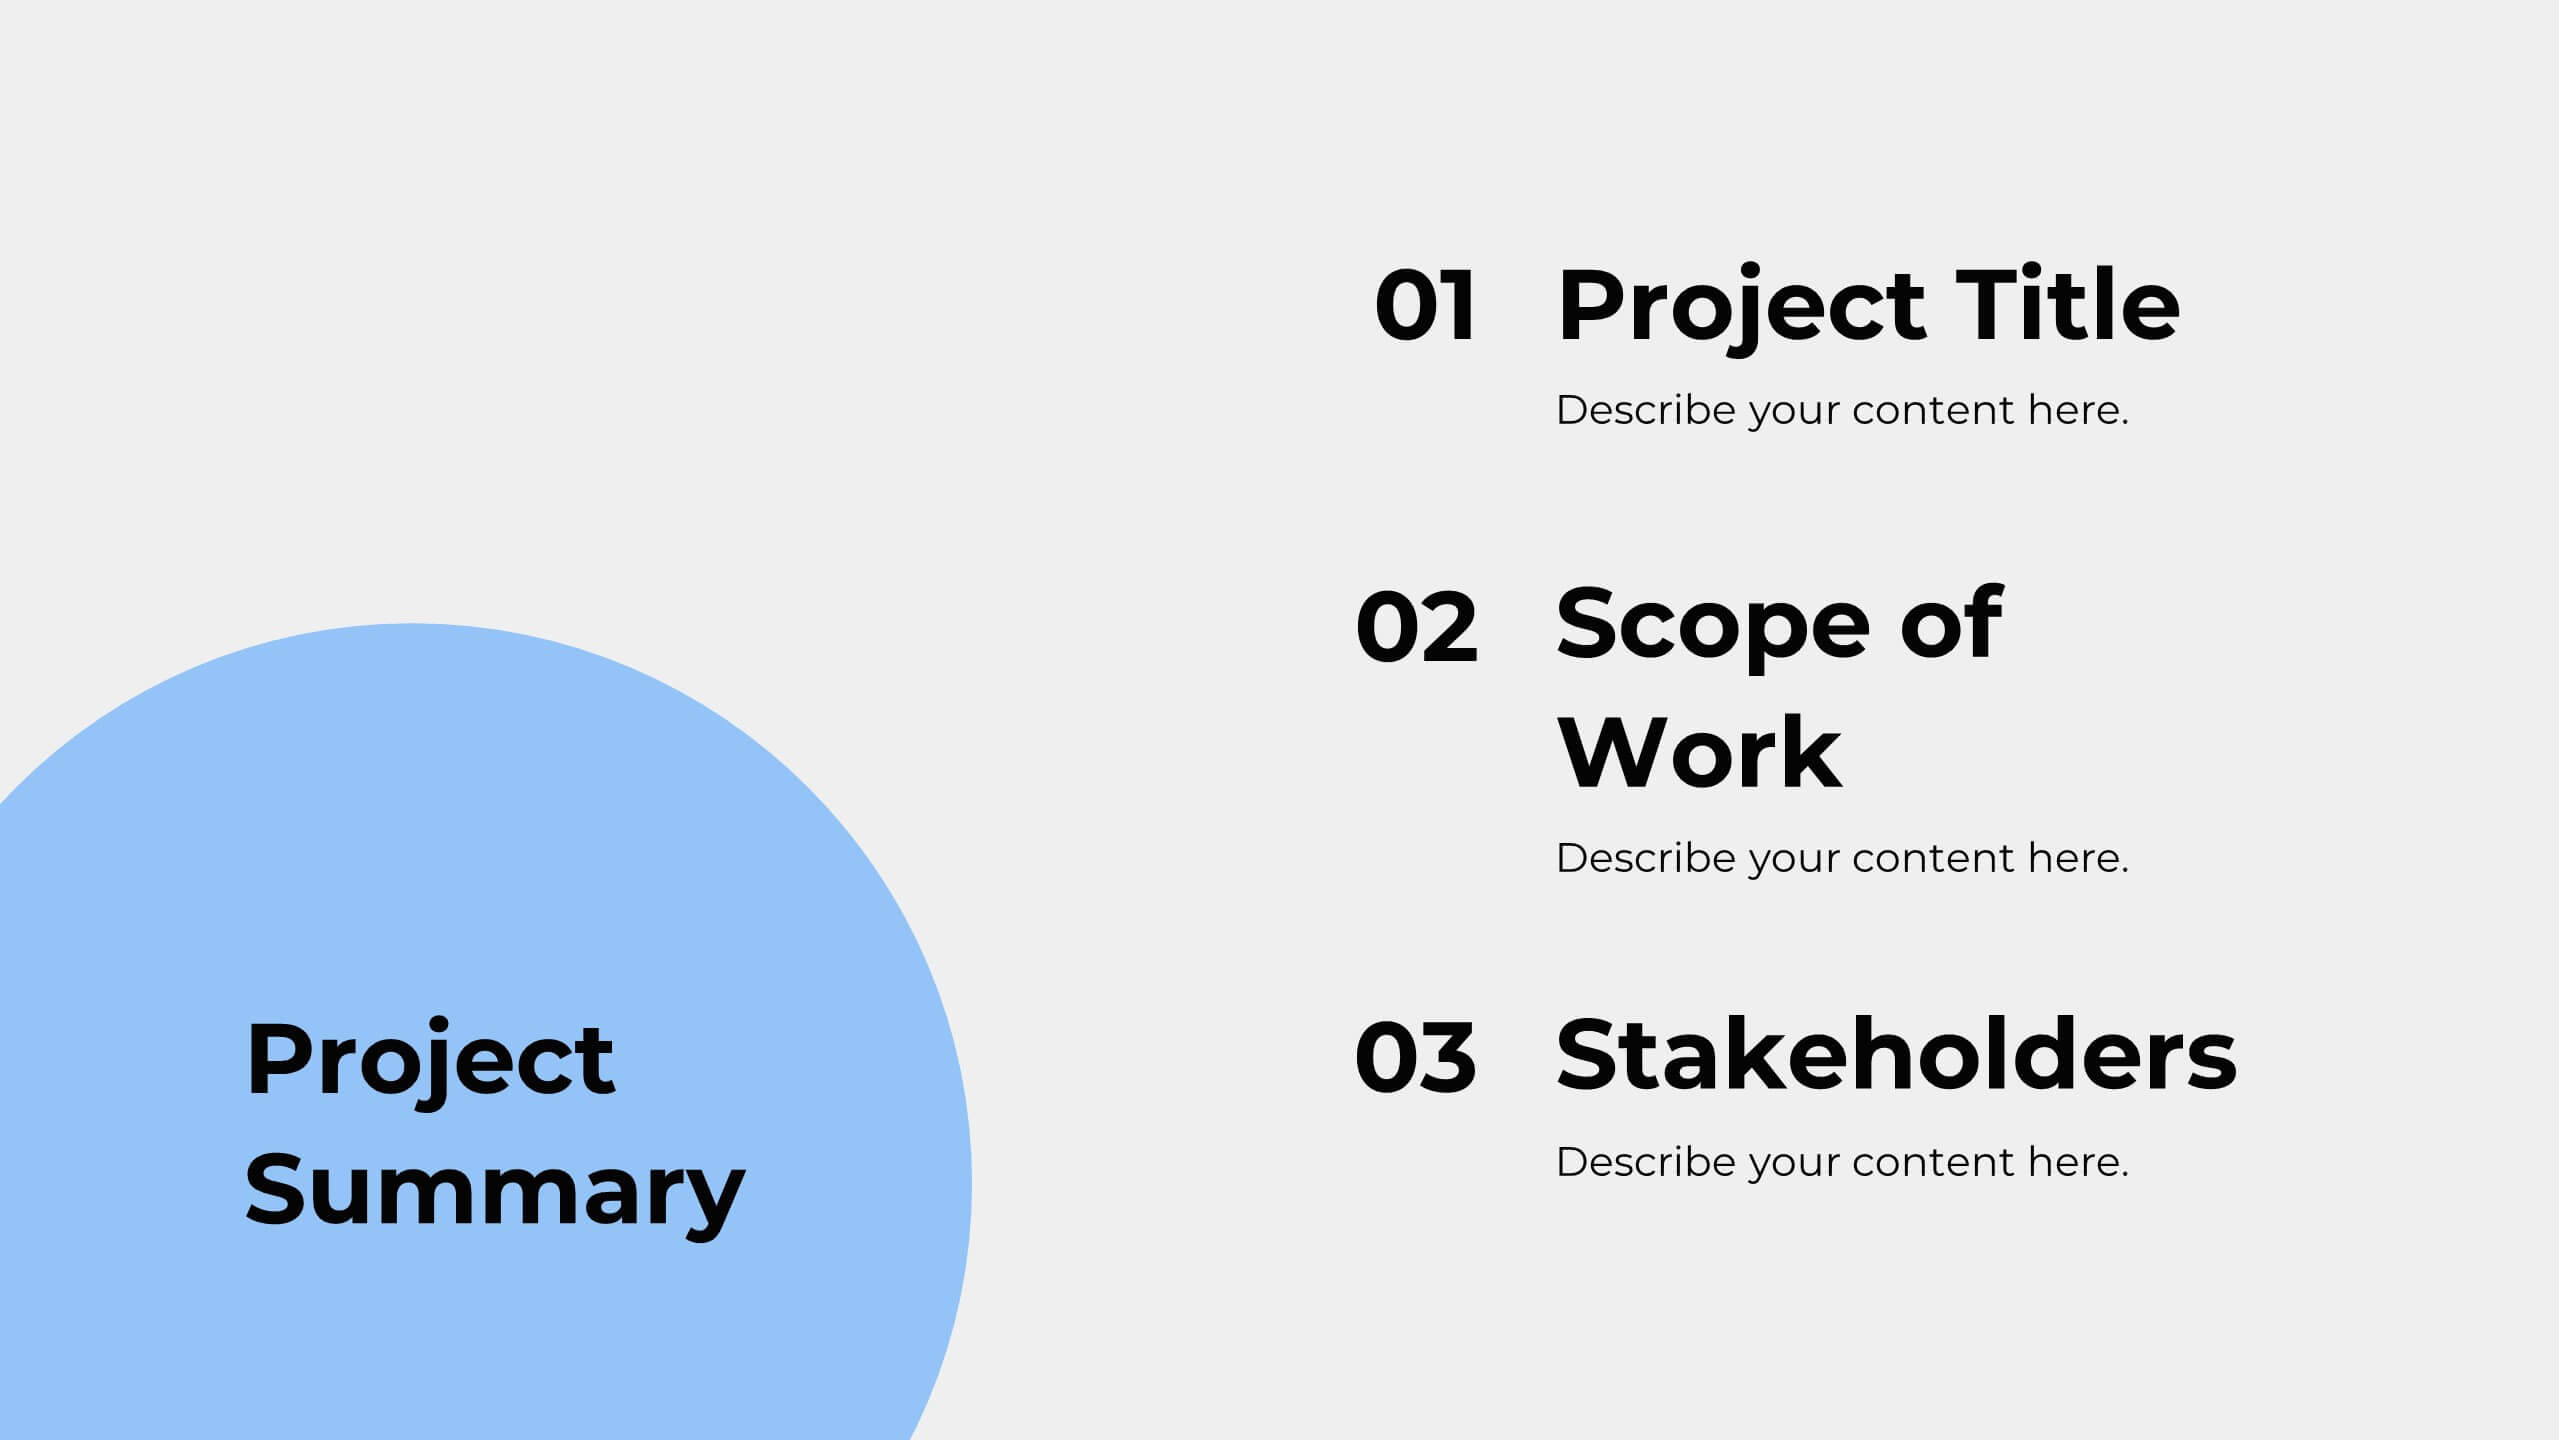
Inspire Business Proposal Presentation
Excite your audience with a compelling business proposal! This template includes sections for objectives, scope of work, timeline, budget, and more. Present your business plan clearly and effectively. Compatible with PowerPoint, Keynote, and Google Slides, it’s designed to impress stakeholders and secure approval for your project. Transform ideas into reality today!


10 diapositivas
Corporate Growth Strategy Presentation
Elevate your corporate presentations with our "Corporate Growth Strategy Presentation" template. Designed to visually represent key growth strategies, this infographic uses a wrench graphic to symbolize the tools necessary for business expansion. Each segment of the wrench is color-coded, highlighting different strategic elements clearly and effectively. This format aids in discussing business objectives systematically, from foundational practices to advanced goals. Ideal for executives, strategists, and business analysts, this template ensures professional and coherent delivery of complex strategies. Compatible with PowerPoint, Keynote, and Google Slides, it is an indispensable tool for articulating and presenting sophisticated corporate strategies.


4 diapositivas
Creative Brush Stroke Theme Design Presentation
Bring a bold, artistic flair to your presentation with this Creative Brush Stroke Theme Design. Featuring layered paint-like strokes in vibrant tones, this layout blends creativity with clarity—perfect for design pitches, brainstorming sessions, or visual storytelling. Fully customizable in PowerPoint, Google Slides, and Canva for seamless editing.


20 diapositivas
Visionix Project Management Plan Presentation
Streamline your project planning with this clean and modern presentation template. Covering key aspects such as objectives, timeline, budget breakdown, and risk management, it helps you organize and communicate your project strategy effectively. Ideal for business teams and project managers. Compatible with PowerPoint, Keynote, and Google Slides for easy customization.


8 diapositivas
Asia Geographics and Business Analysis Map Presentation
Visualize regional insights with this Asia map template. Highlight business data, performance indicators, or strategic regions using callouts and color-coded zones. Perfect for market analysis, logistics, or geographic reporting. Fully customizable in PowerPoint, Keynote, or Google Slides to match your branding and presentation goals with clear, location-based storytelling.


5 diapositivas
North American Business Overview and Map Presentation
Showcase regional performance data across North America with this clean, data-driven map slide. Highlight four key statistics using pinpoint markers and modern percentage indicators. Ideal for market overview, financial reporting, or strategic insights. Fully customizable and compatible with PowerPoint, Keynote, and Google Slides for seamless business presentations.


20 diapositivas
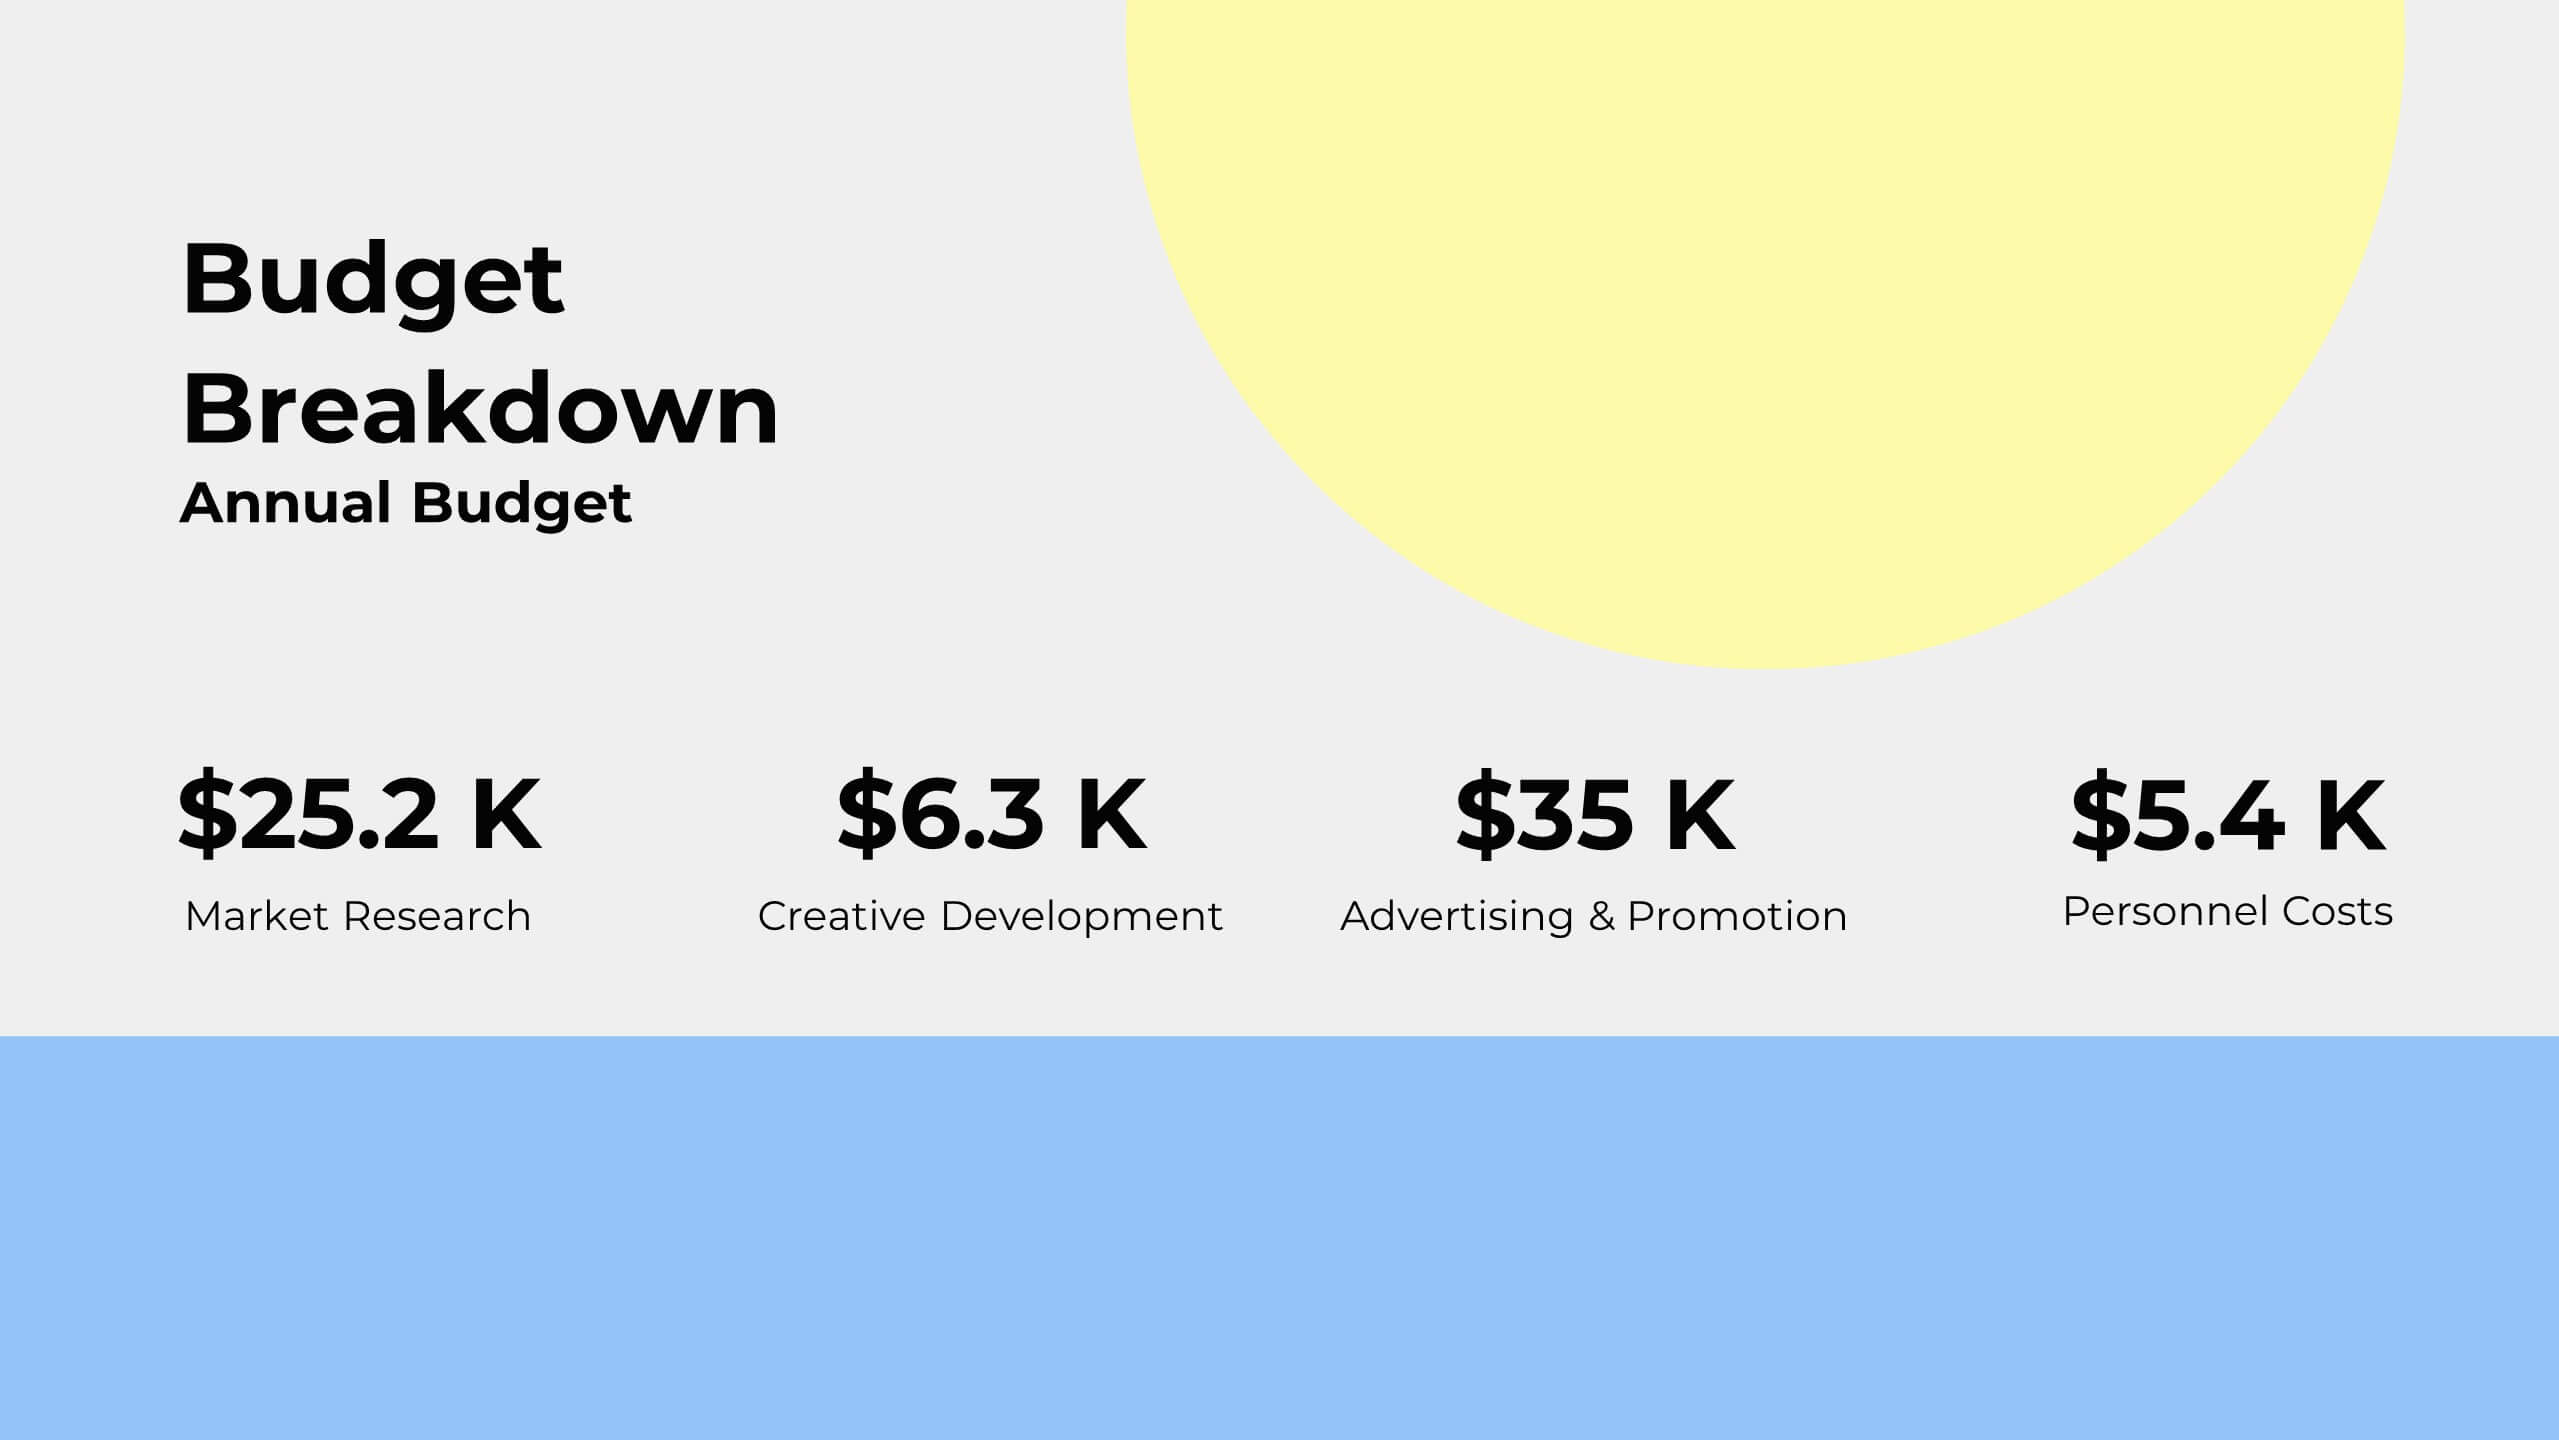
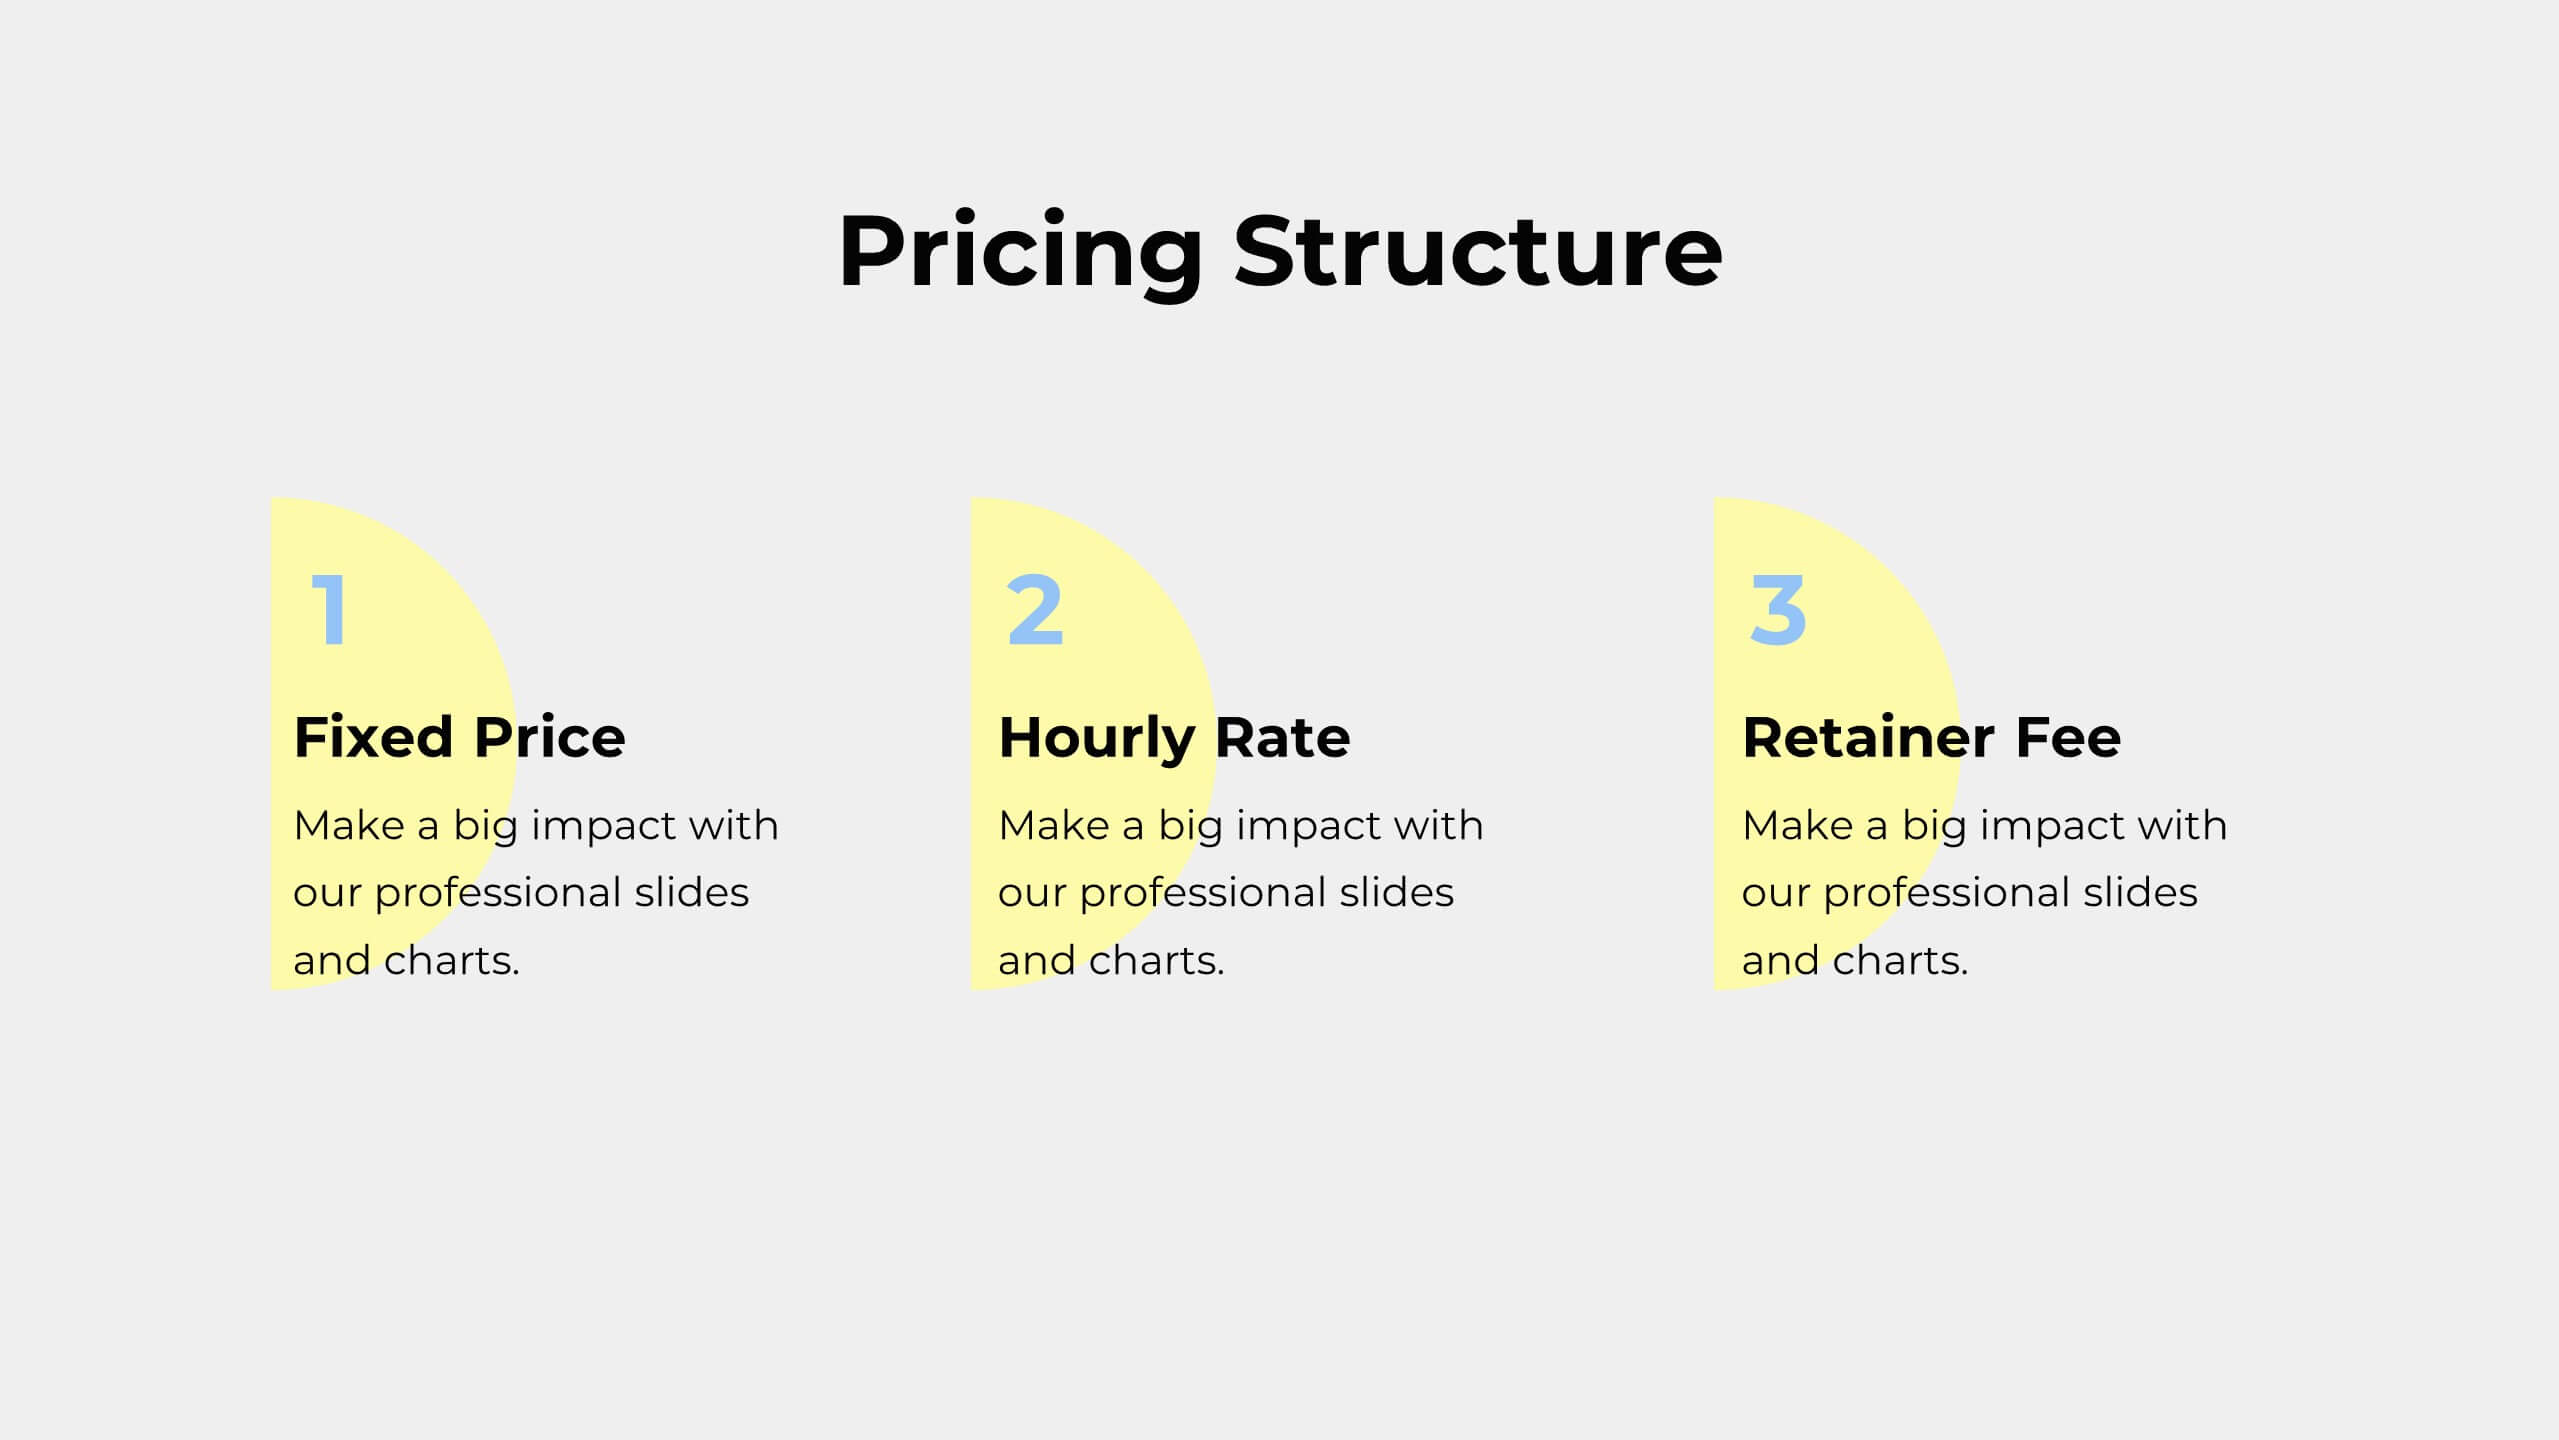
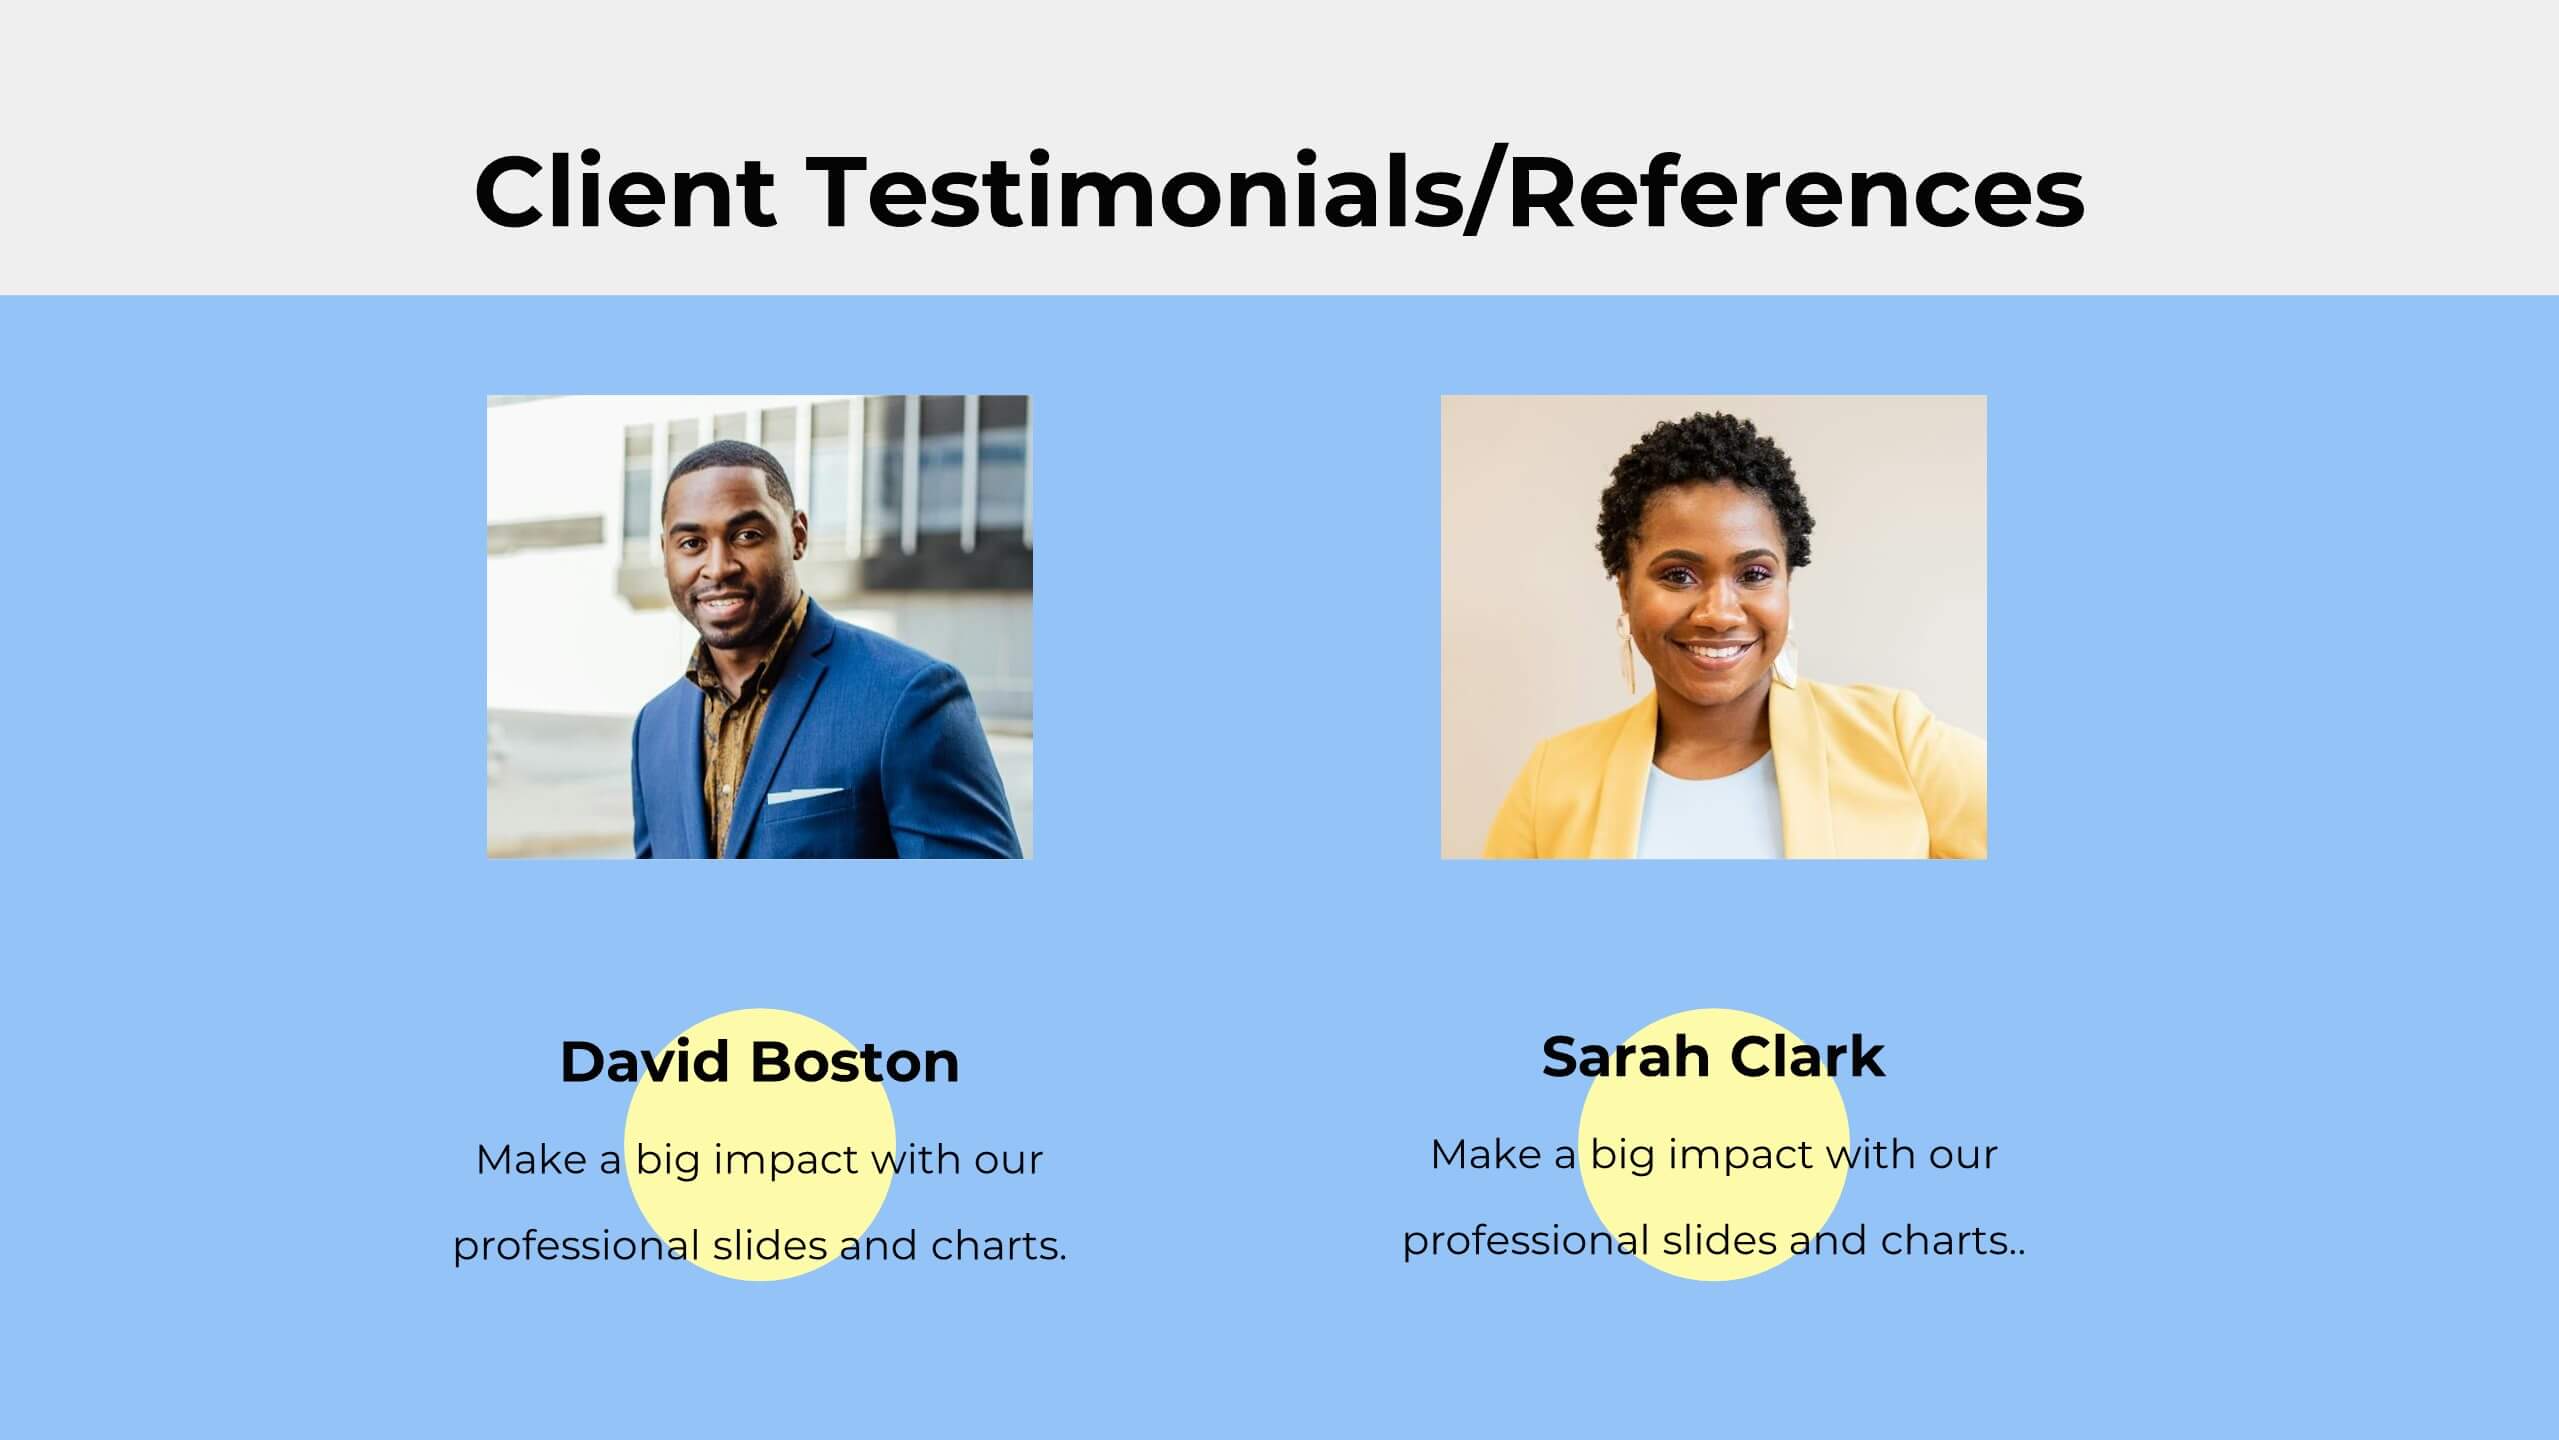
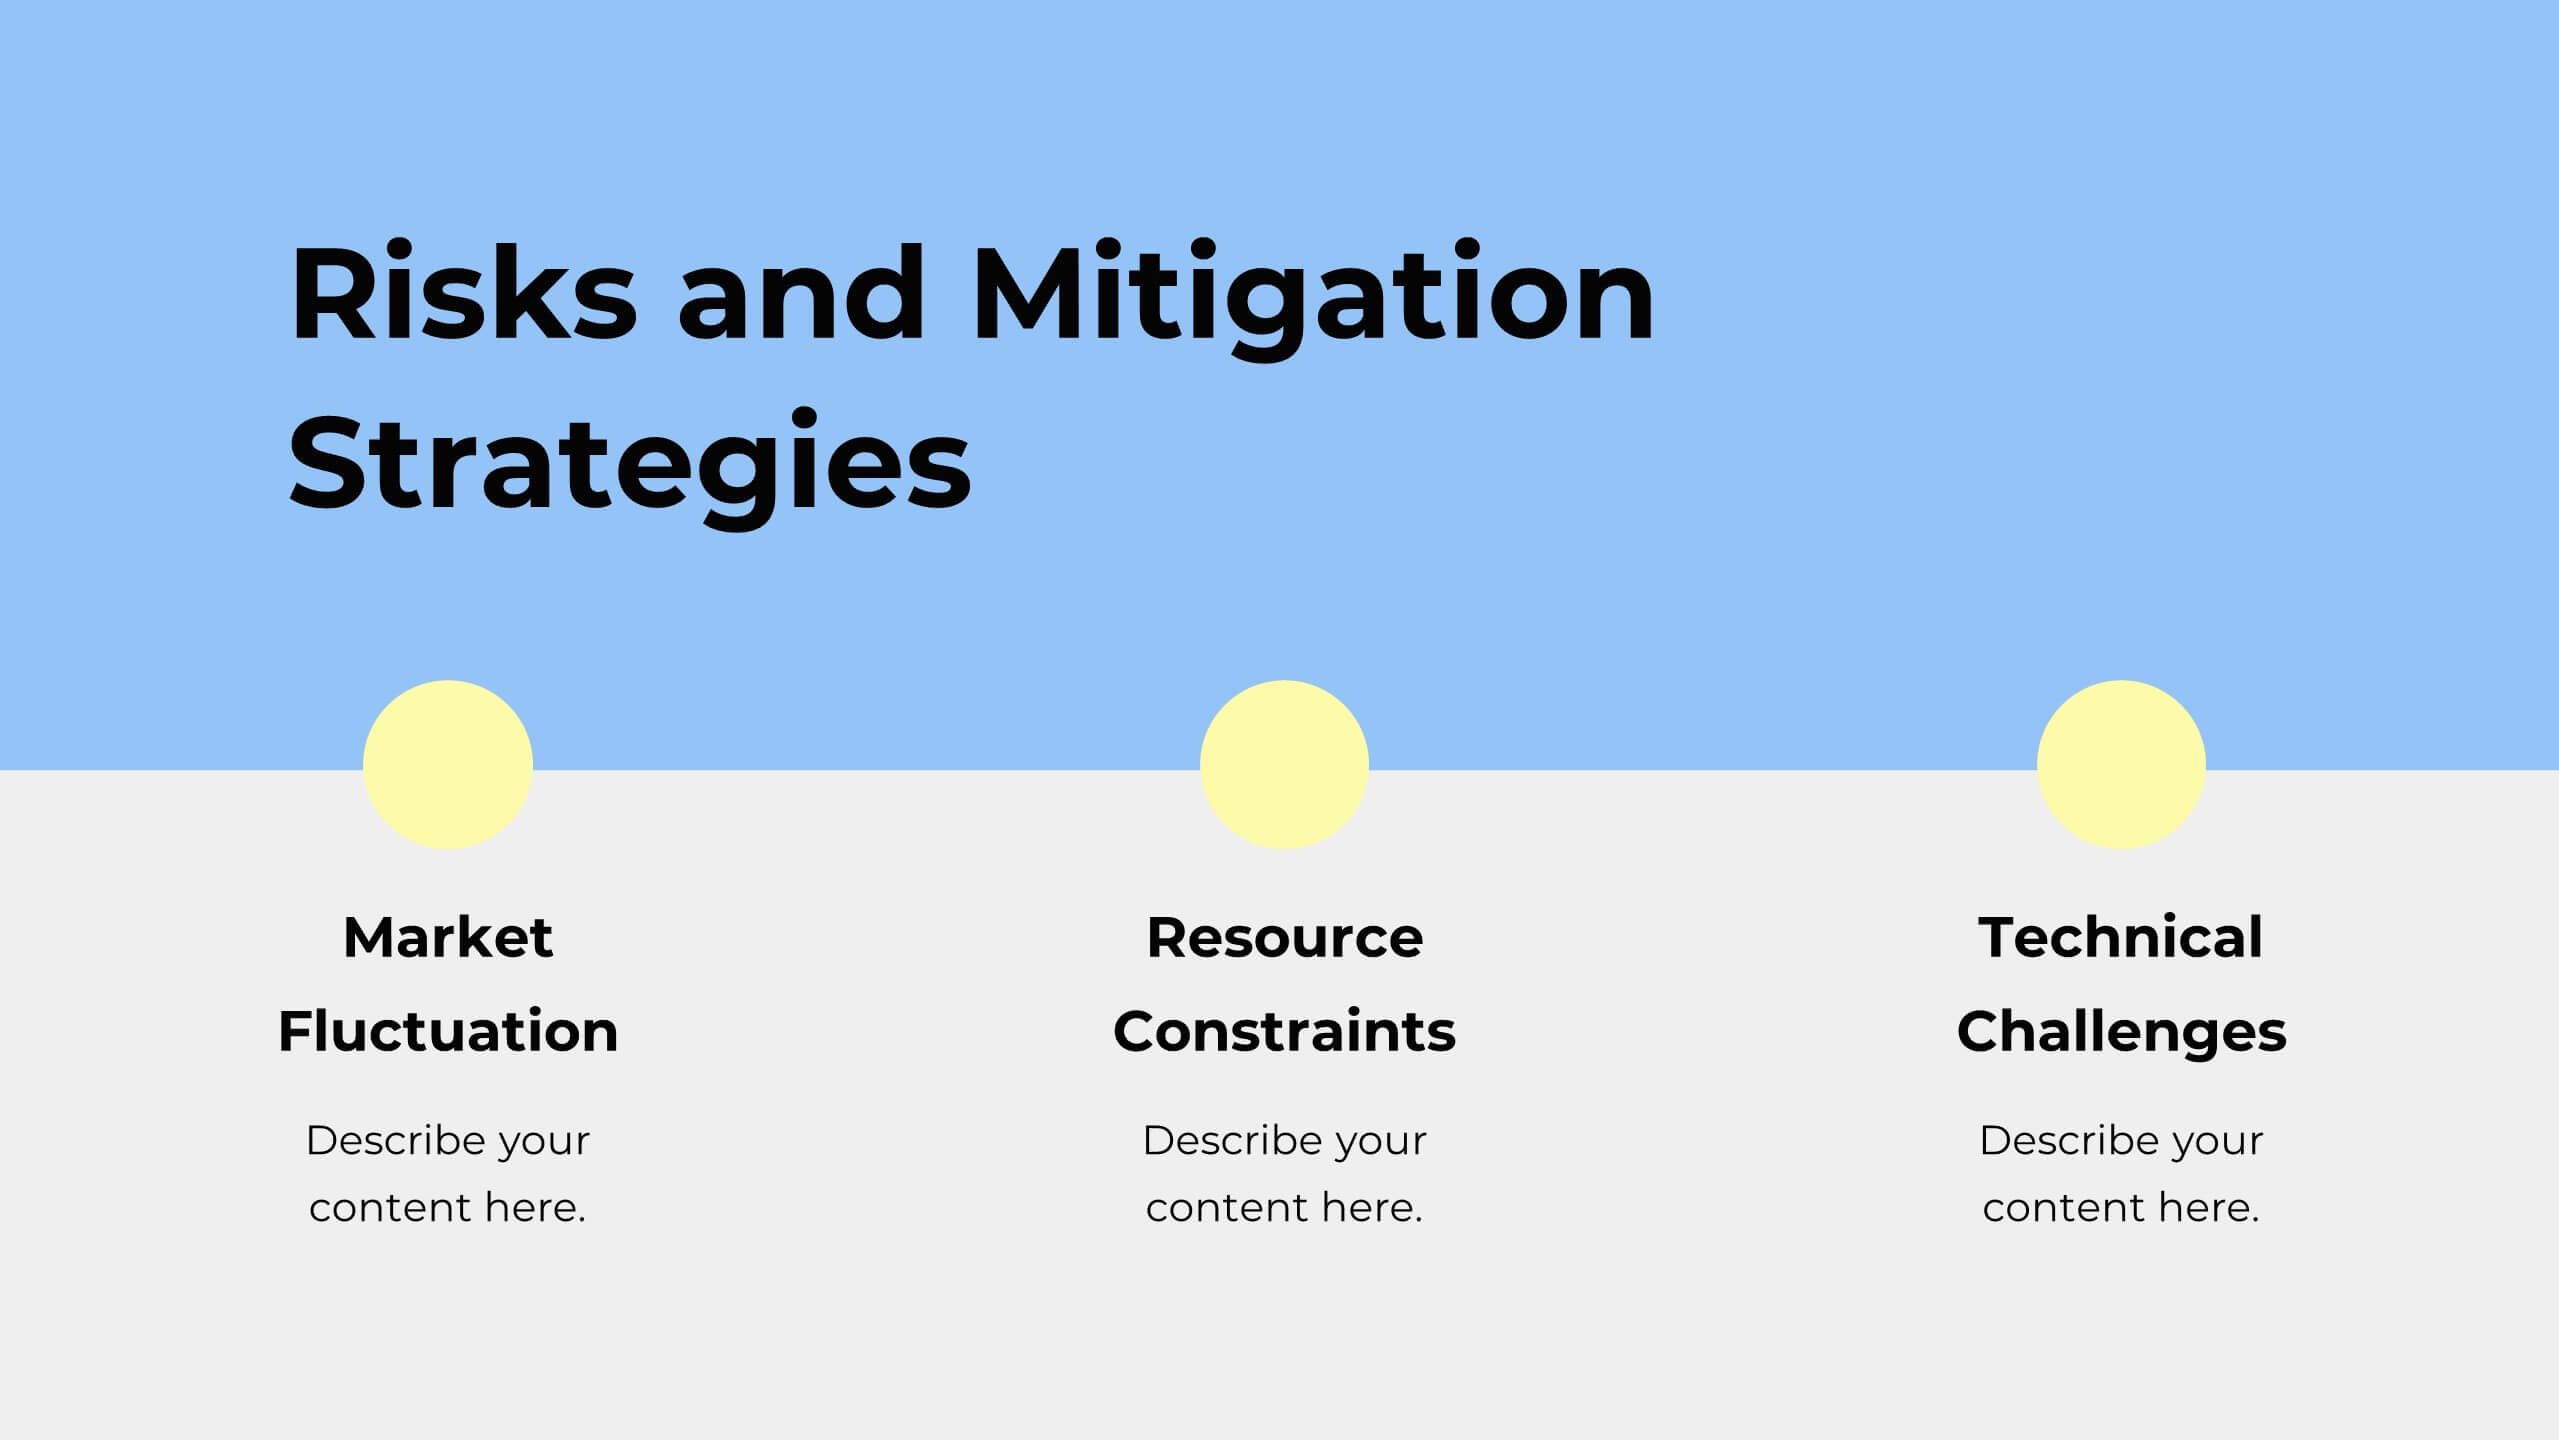
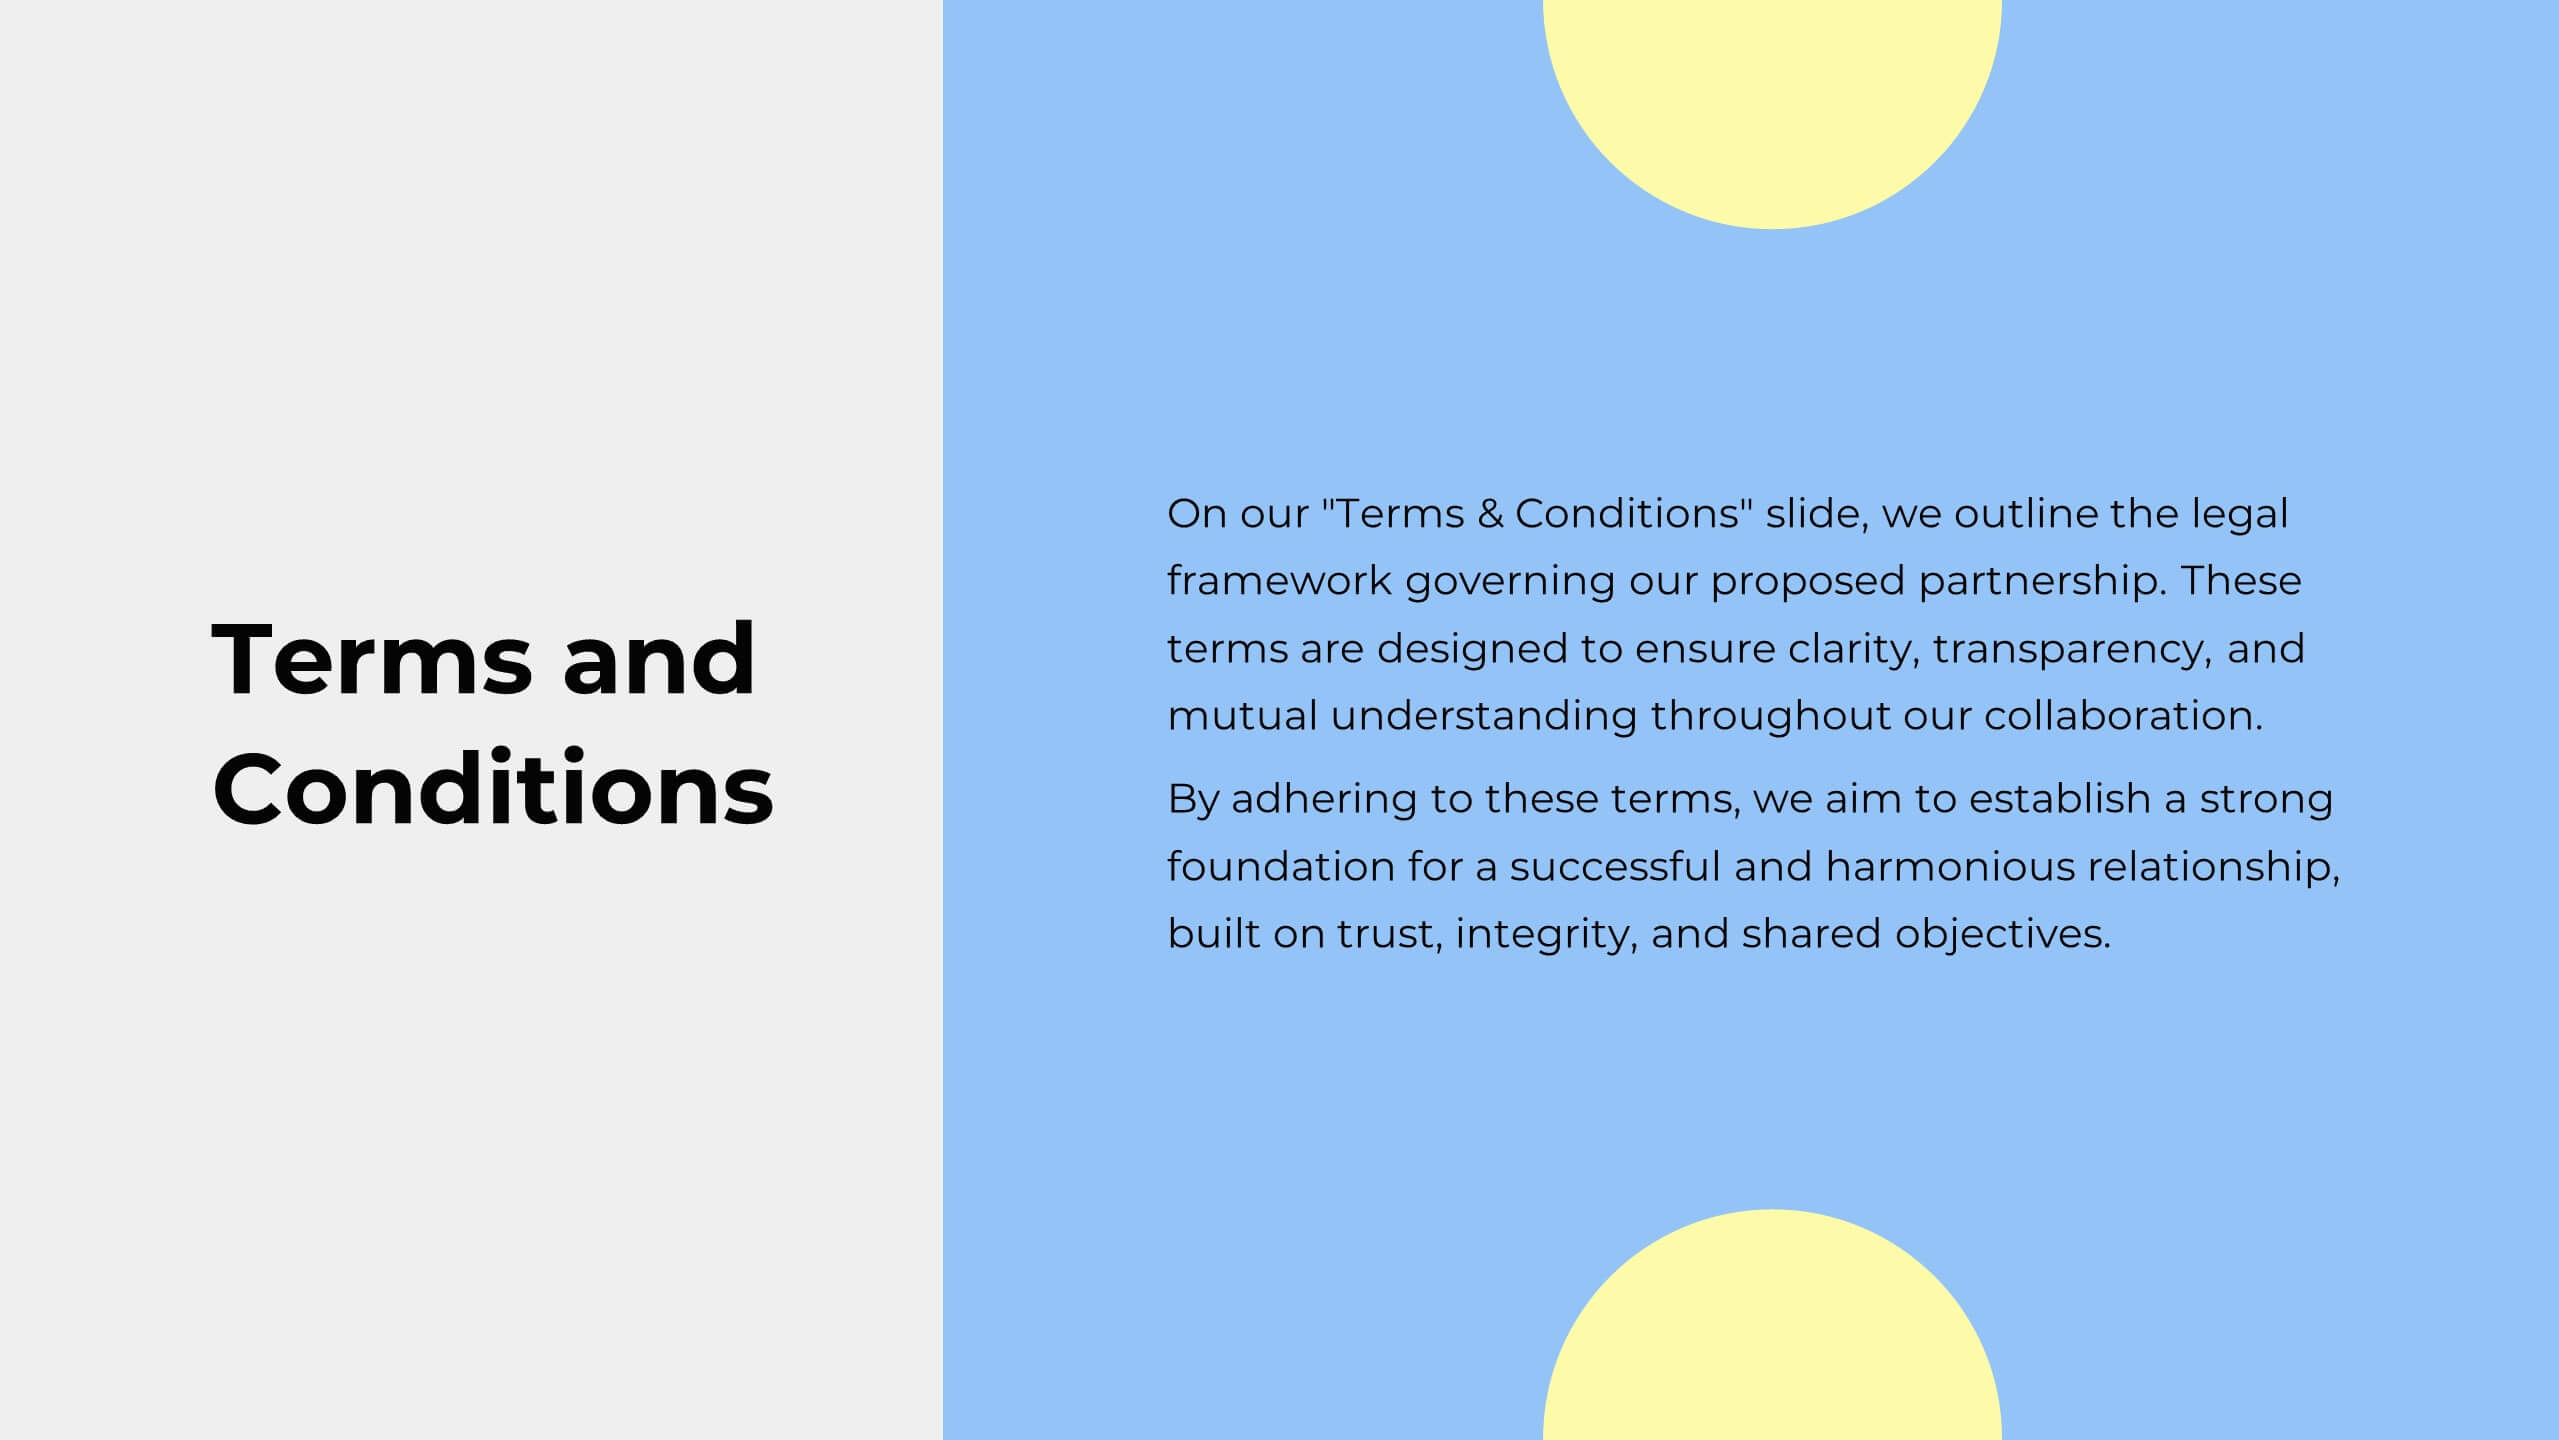
Wonderis Design Proposal Presentation
Deliver an impeccable pitch with this minimalistic and professional design proposal template. Crafted for designers, agencies, and creative professionals, this presentation allows you to seamlessly showcase your expertise, methodology, and deliverables. Walk your audience through a polished narrative that includes a project summary, proposed solutions, objectives, methodology, and timeline. Highlight your expertise with dedicated slides for team introductions, budget breakdowns, and pricing structures. Ensure confidence with risk mitigation strategies, references, and clear next steps to solidify trust in your approach. This template is fully editable and works flawlessly with PowerPoint, Google Slides, and Keynote, providing the flexibility you need to tailor your proposal to specific client needs. Perfect for client pitches, project proposals, and business presentations that need a sophisticated and concise design.


6 diapositivas
Trends and Forecast Through Data Analytics Presentation
Visualize growth trajectories and future performance with the Trends and Forecast Through Data Analytics Presentation. Featuring clean bar charts and segmented legends, this template is ideal for financial projections, sales trends, and business growth analysis. Fully editable in PowerPoint, Keynote, and Google Slides for seamless customization.