


Características


¿Tienes alguna pregunta?
Recomendar


4 diapositivas
Project Brainstorming Mind Map Layout Presentation
Spark creativity with this Project Brainstorming Mind Map Layout presentation. Featuring a bold lightbulb centerpiece, this layout visually organizes four idea clusters around key project themes. Ideal for creative teams, planning sessions, or innovation workshops. Fully editable in Canva, PowerPoint, and Google Slides for easy personalization and professional impact.


4 diapositivas
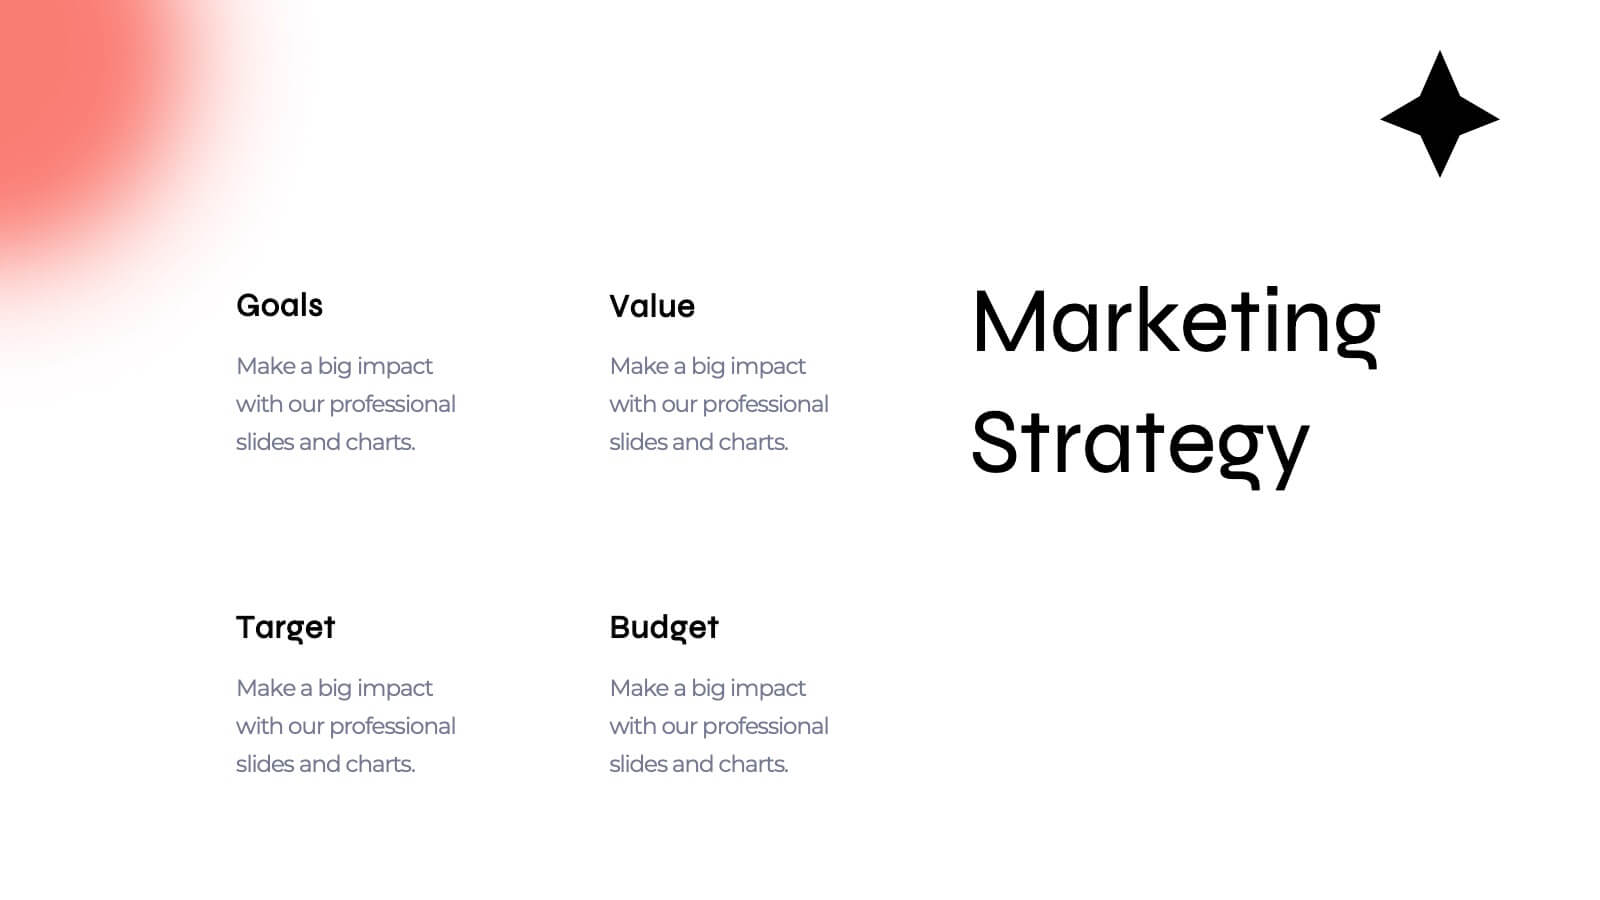
Marketing Plan Overview
Visualize your marketing cycle with this clean, three-stage arrow diagram. Each segment—labeled A, B, and C—represents a key phase in your marketing strategy, making it ideal for campaign planning, product launches, or promotional timelines. Fully editable in PowerPoint, Keynote, and Google Slides for effortless customization.


6 diapositivas
South America Language Map Infographics
South America is located in the Western Hemisphere and is known for its diverse landscapes, cultures, and countries. This infographic template can provide a visual representation of the countries and key information about the continent's geography, culture, economy, and more. This template is designed to help your audience gain insights into the diverse and rich continent, making it a valuable tool for educational, promotional, and informative purposes. This map infographic can be shared on websites, social media platforms, presentations, and marketing materials targeting audiences interested in South America.


4 diapositivas
Annual Report Summary Slide
Present key performance metrics with confidence using this Annual Report Summary Slide. Designed with bold percentage visuals and clear titles, it helps break down quarterly or category results in a clean, professional format. Ideal for financial overviews, sales performance, or strategic summaries. Fully editable in PowerPoint, Keynote, and Google Slides.


20 diapositivas
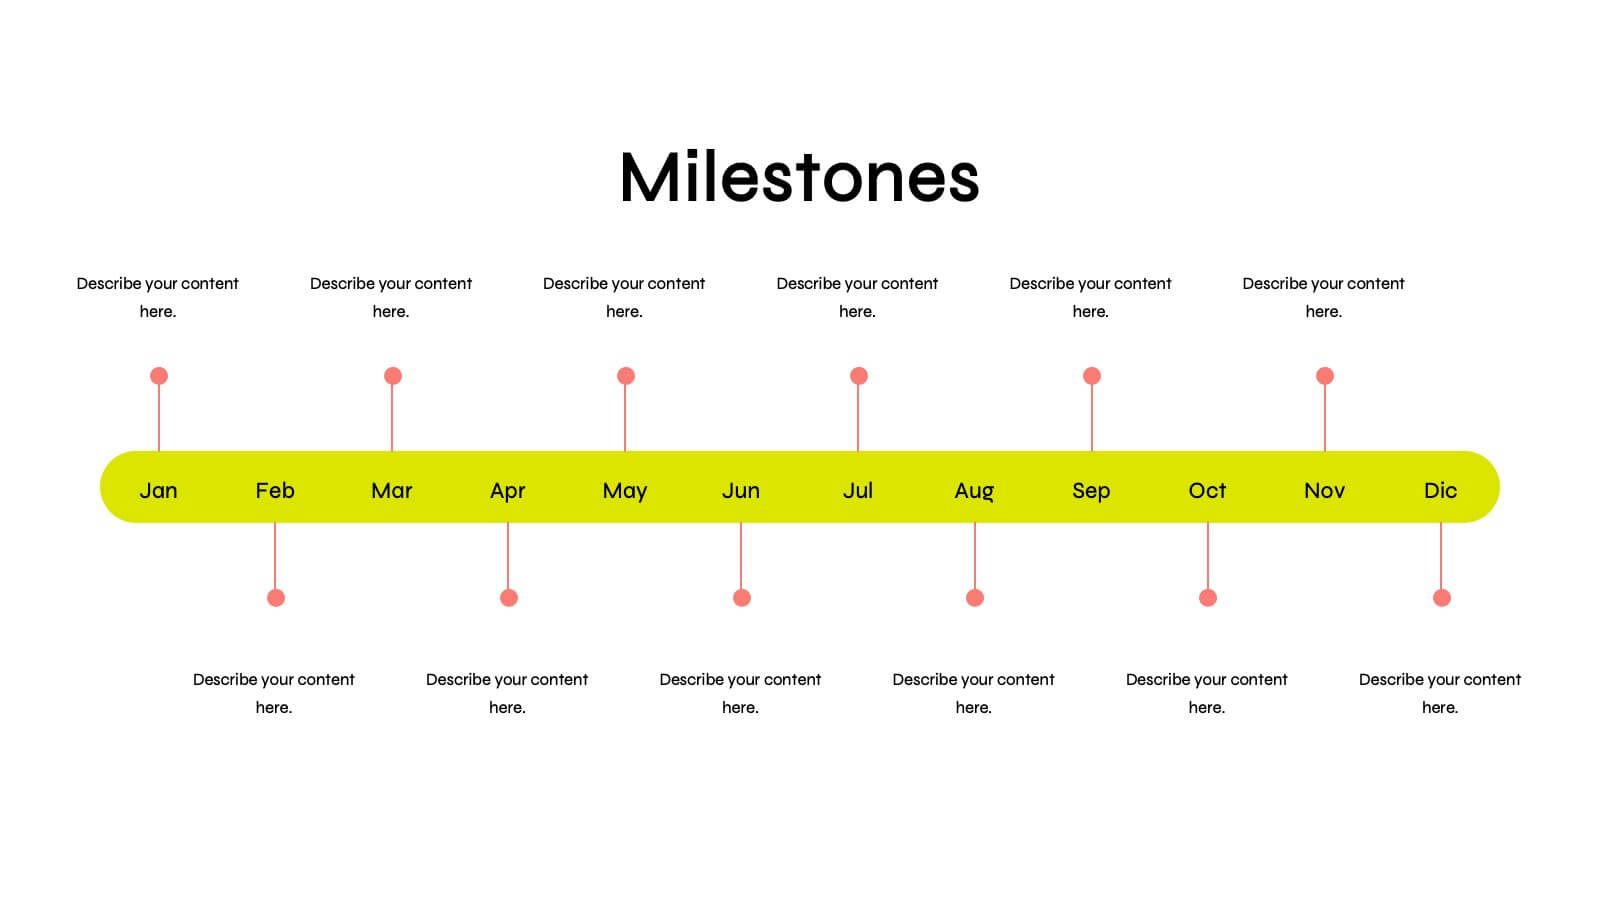
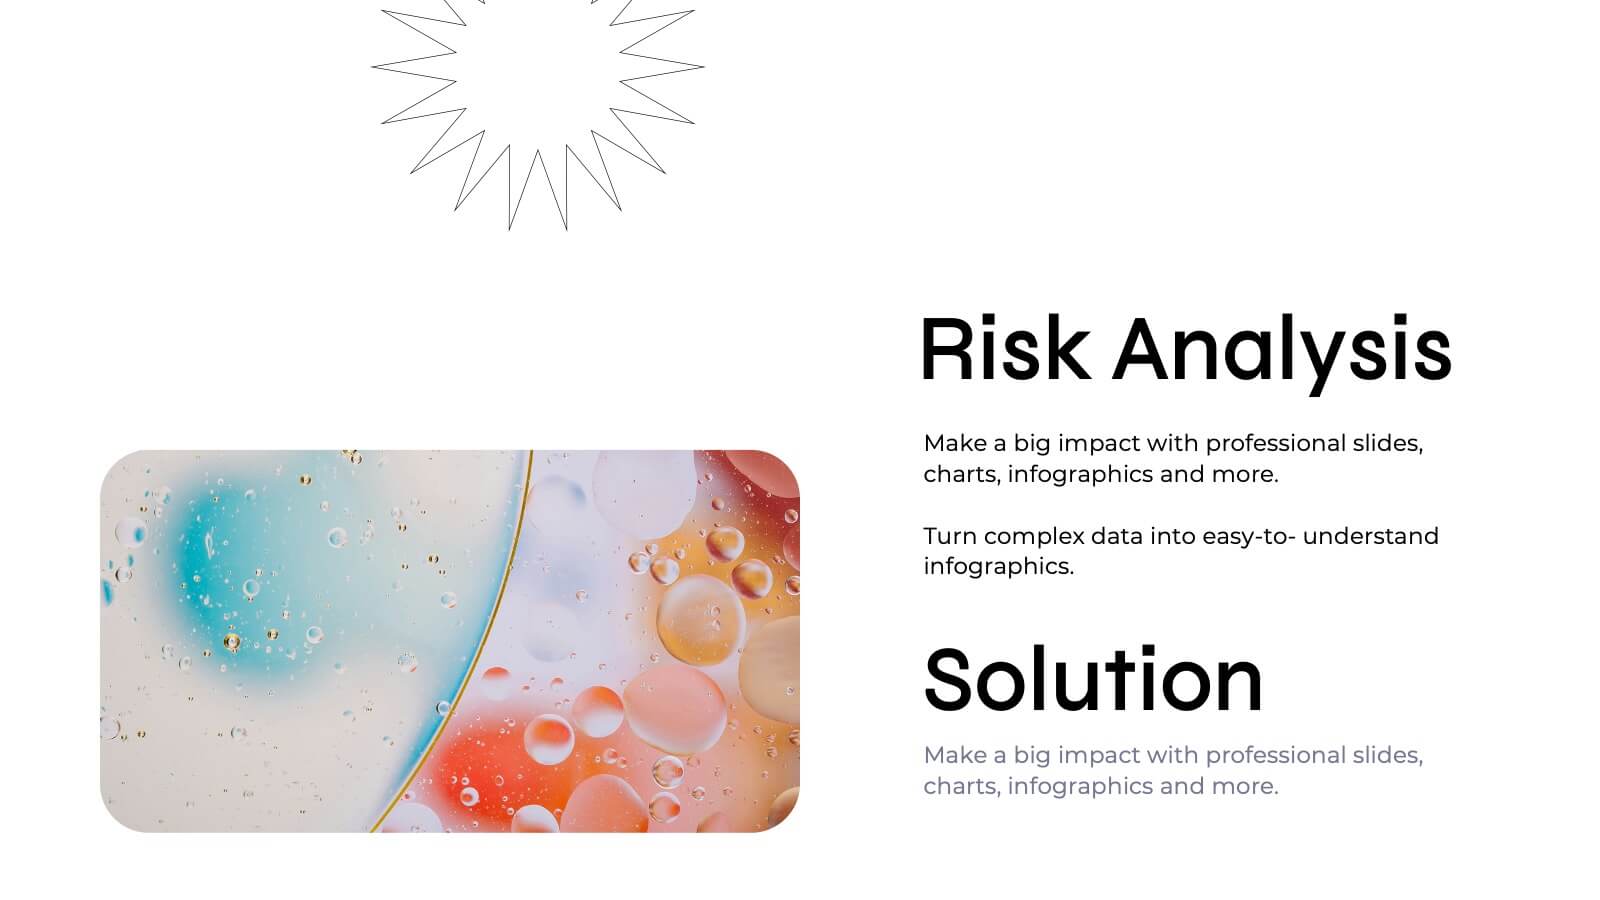
Cascade Detailed Project Execution Plan Presentation
Embark on your next big project with confidence using the Cascade Project Plan template! This visually stunning and meticulously designed template is perfect for laying out the roadmap for any project, whether it's launching a new product or managing a complex initiative. The template features sections for project overview, scope of work, budget breakdown, and risk management, ensuring every aspect of your project is thoroughly covered. Its clean and modern design allows you to present your ideas with clarity, while the customizable slides offer the flexibility to tailor the presentation to your specific needs. With dedicated slides for stakeholder analysis, resource allocation, and timeline milestones, this template helps you keep all parties informed and aligned. Compatible with PowerPoint, Keynote, and Google Slides, the Cascade Project Plan template is your ultimate tool for professional and effective project management presentations. Get ready to impress your team and stakeholders with a well-organized and impactful presentation!


20 diapositivas
Astralisque Sales Proposal Presentation
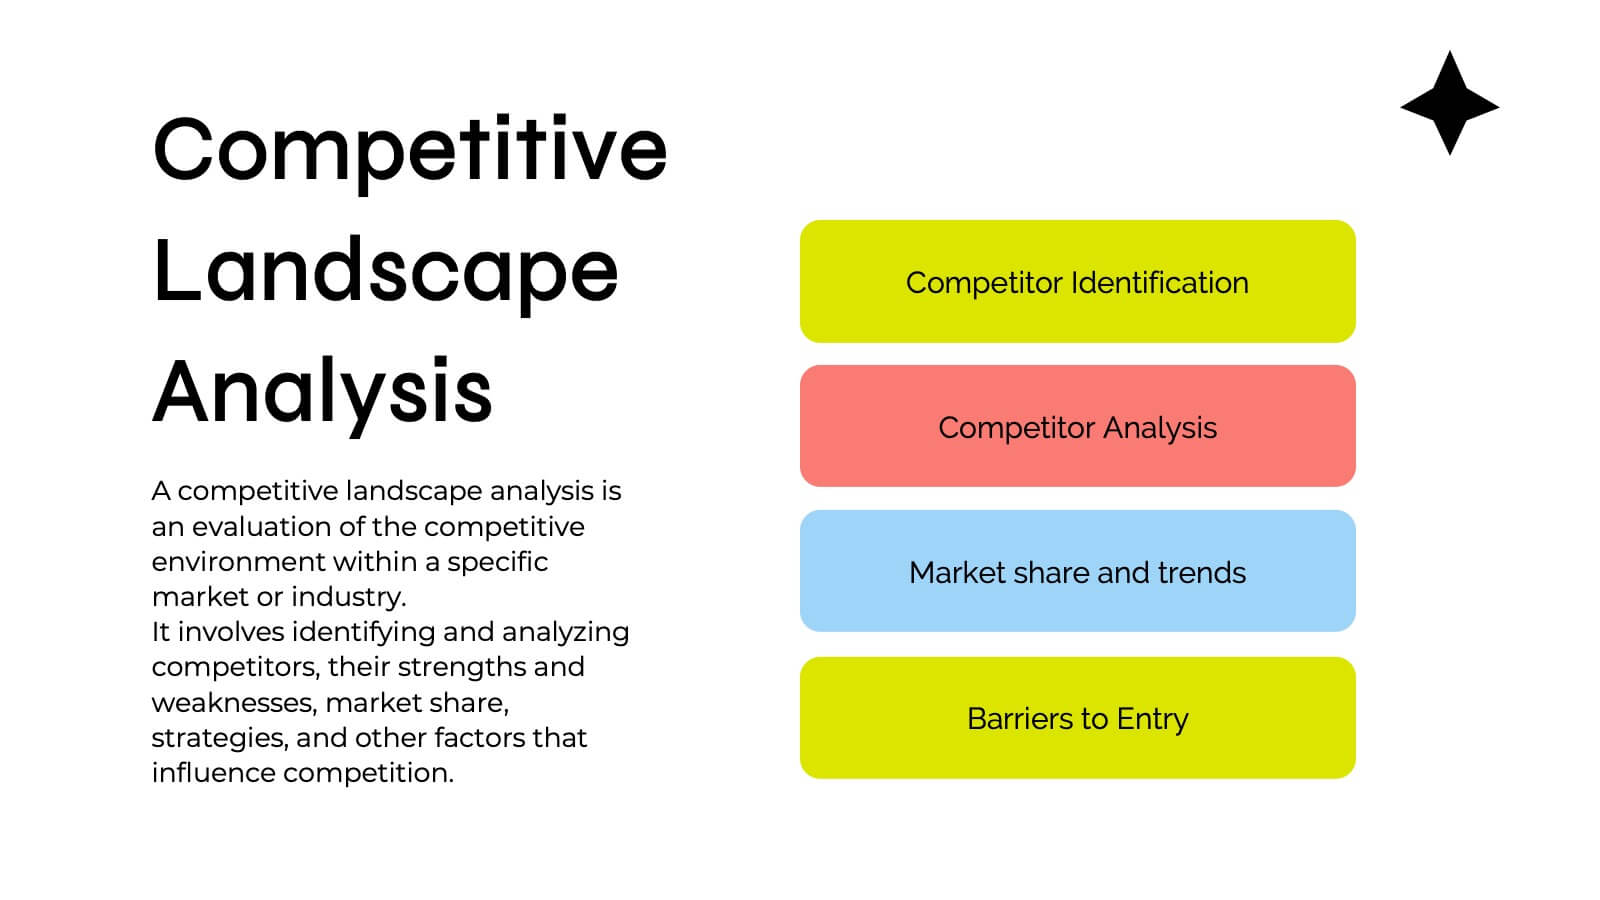
This Sales Proposal Presentation is designed to help businesses outline their sales strategies with a bold and dynamic style. Covering key elements such as competitive analysis, objectives, pricing strategy, and sales performance metrics, it ensures a professional look. Fully customizable and compatible with PowerPoint, Keynote, and Google Slides.


2 diapositivas
Closing Slide with Appreciation Note Presentation
Wrap up your presentation with energy using the Closing Slide with Appreciation Note Presentation. This bold, modern design features a “Thanks” message and a standout CTA—perfect for directing your audience to more content. Includes light and dark background options to match your theme. Fully editable in Canva, PowerPoint, Keynote, and Google Slides.


6 diapositivas
Employee Change Management Strategy Presentation
Communicate change with clarity using this structured, gear-themed presentation slide. Designed to visualize six strategic stages of employee transition, it's ideal for HR professionals, team leaders, and consultants managing organizational change. Each step is represented with a numbered circle and aligned text for easy guidance. Fully customizable in PowerPoint, Keynote, and Google Slides.


7 diapositivas
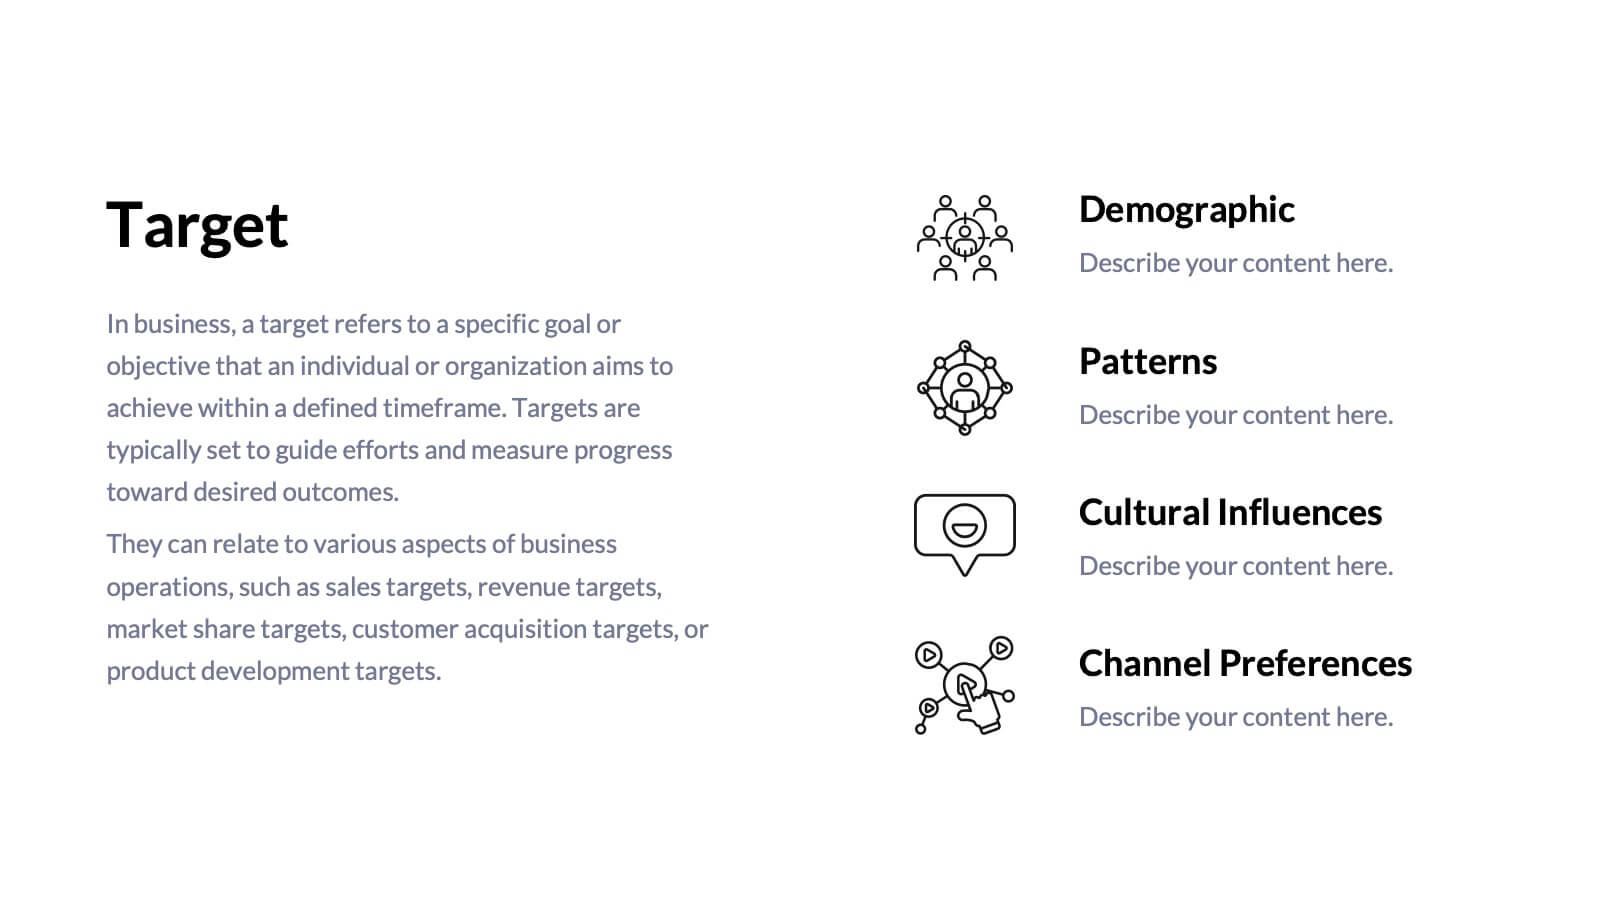
Target Market Advertising Infographic
Target market advertising, also known as target advertising or target marketing, is a strategy in marketing and advertising where promotional efforts are directed towards a specific and well-defined group of consumers who are most likely to be interested in a product or service. The goal of this infographic template is to tailor marketing messages and campaigns to resonate with the characteristics and preferences of your specific audience, thus increasing the effectiveness and efficiency of the marketing efforts. Fully customize the content, to educate about targeting the right audience for advertising presentations.


5 diapositivas
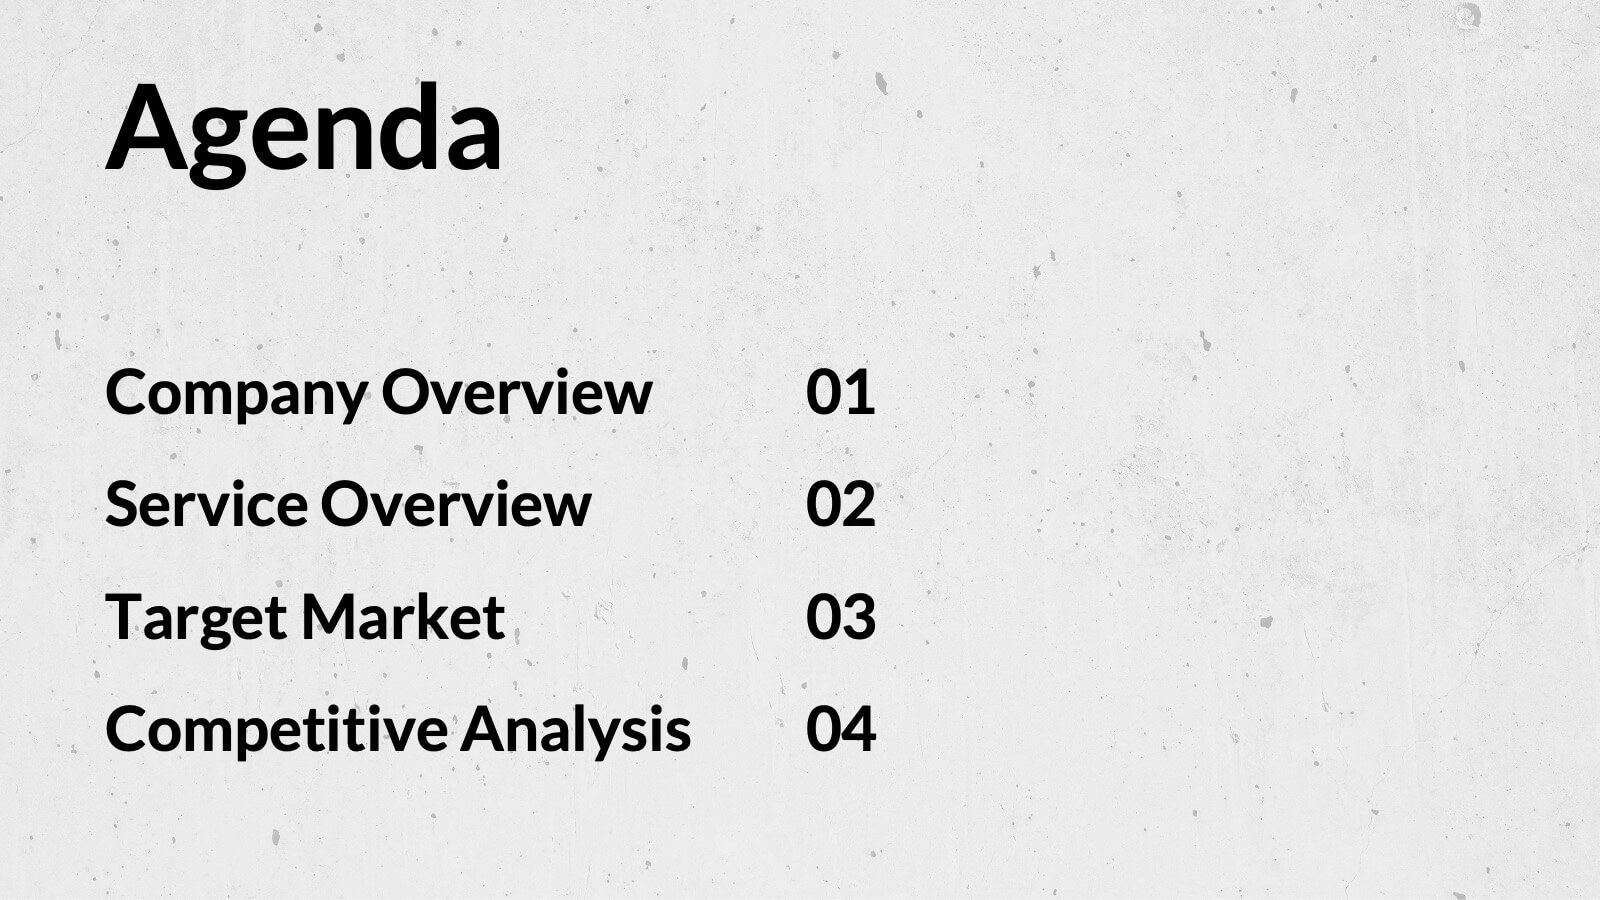
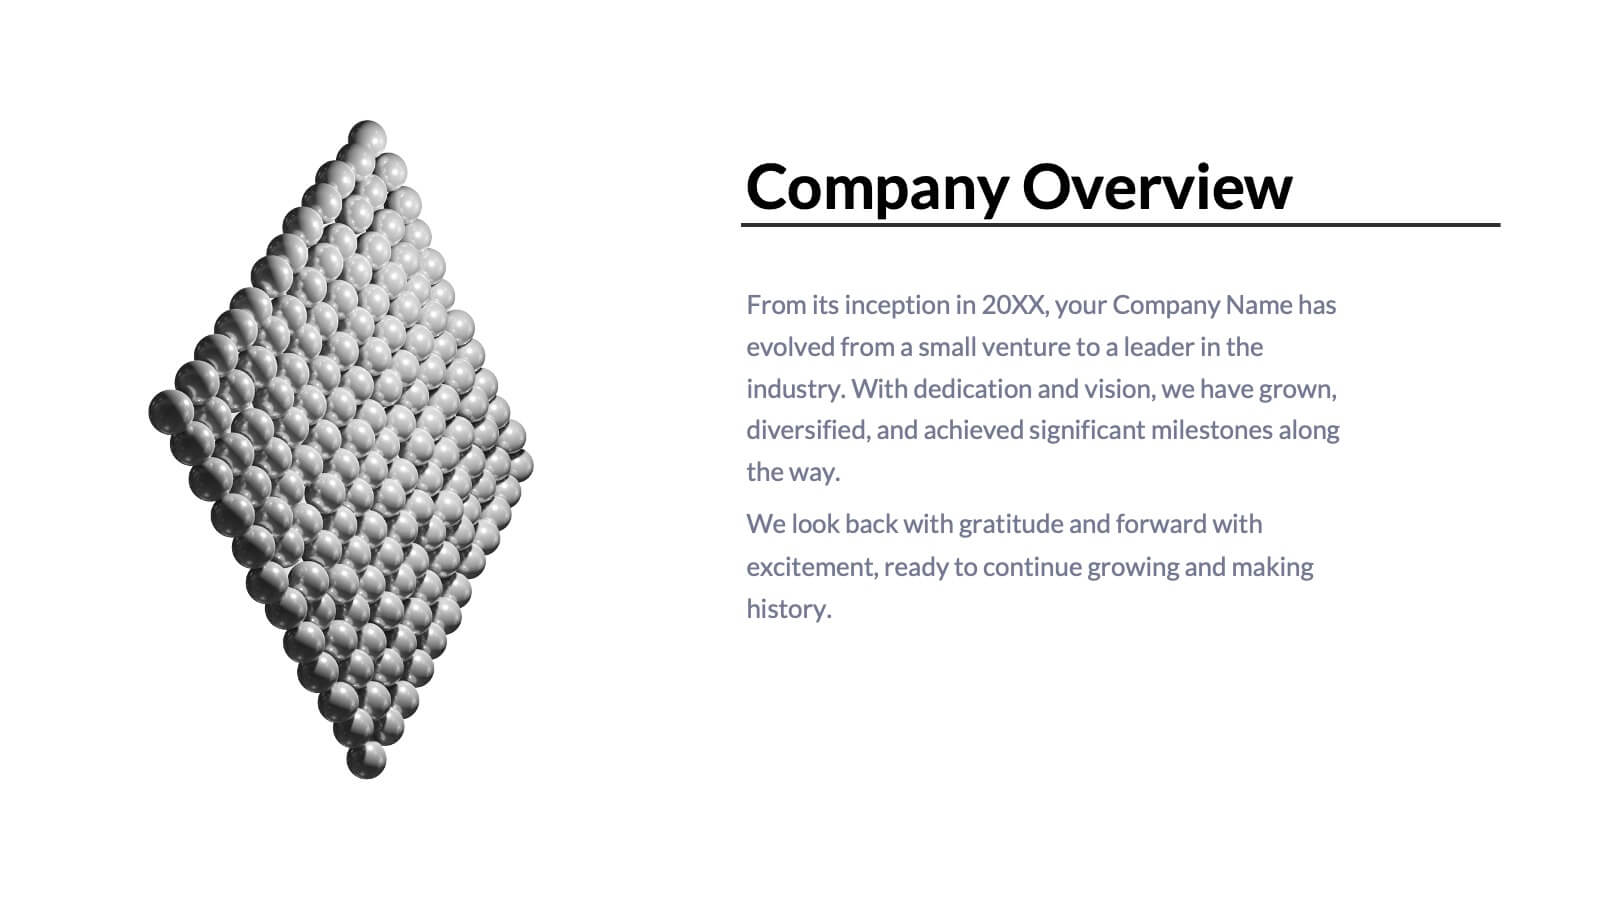
Professional Business Proposal Presentation
Make your pitch stand out with a polished, minimal design that highlights every key stage of your business strategy. This clean visual layout is perfect for outlining project phases, services, or data-driven insights with clarity and impact. Fully compatible with PowerPoint, Keynote, and Google Slides for easy customization.


22 diapositivas
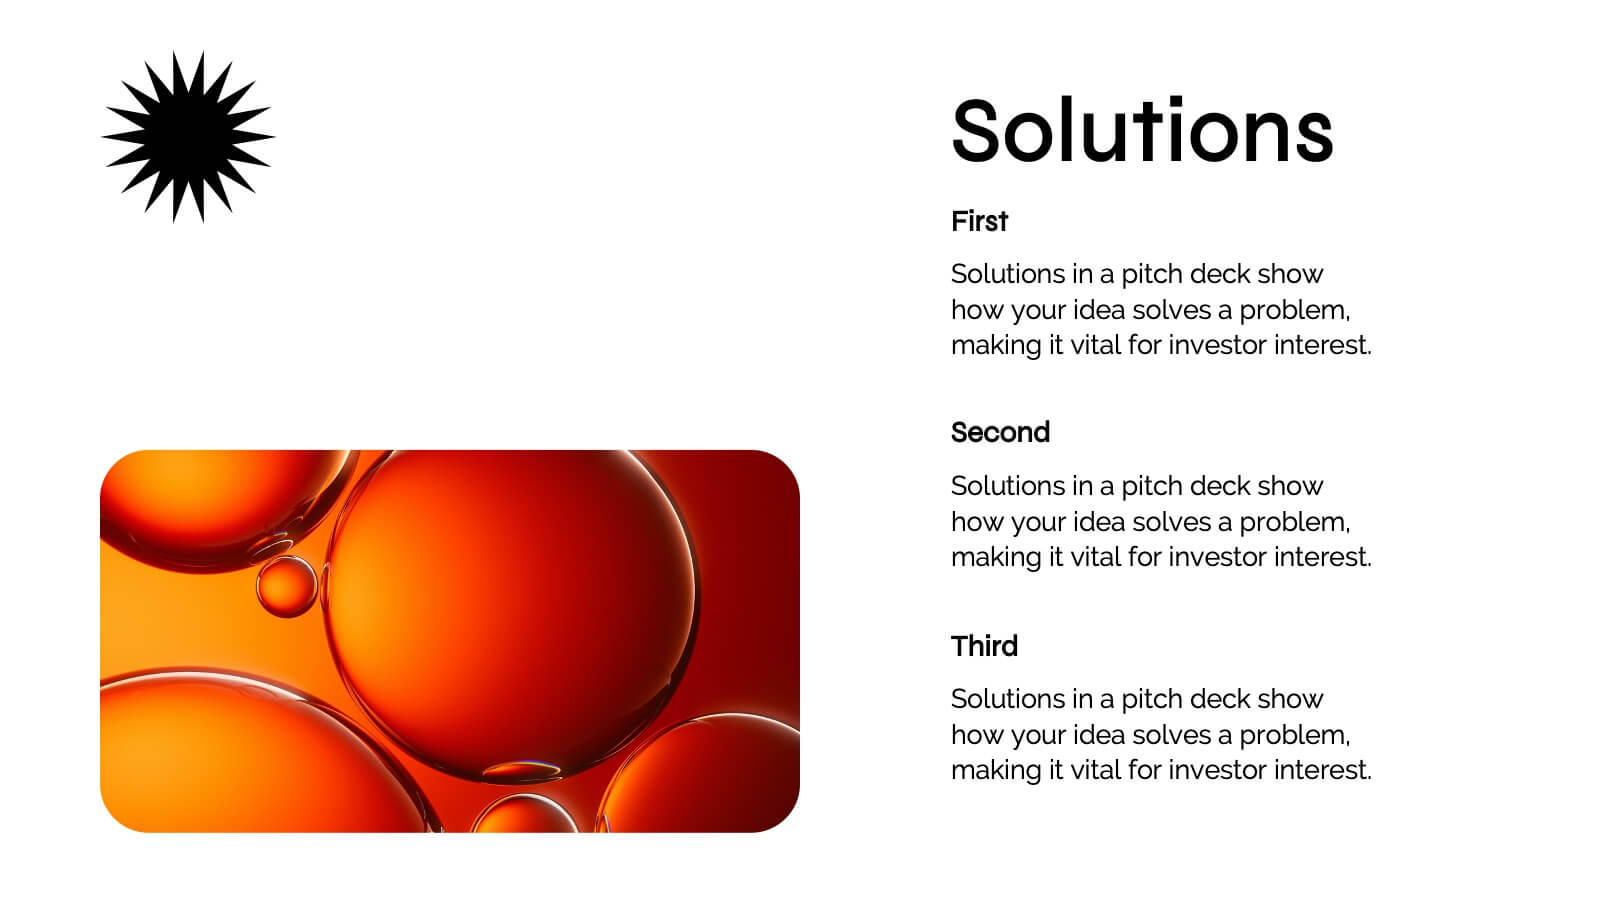
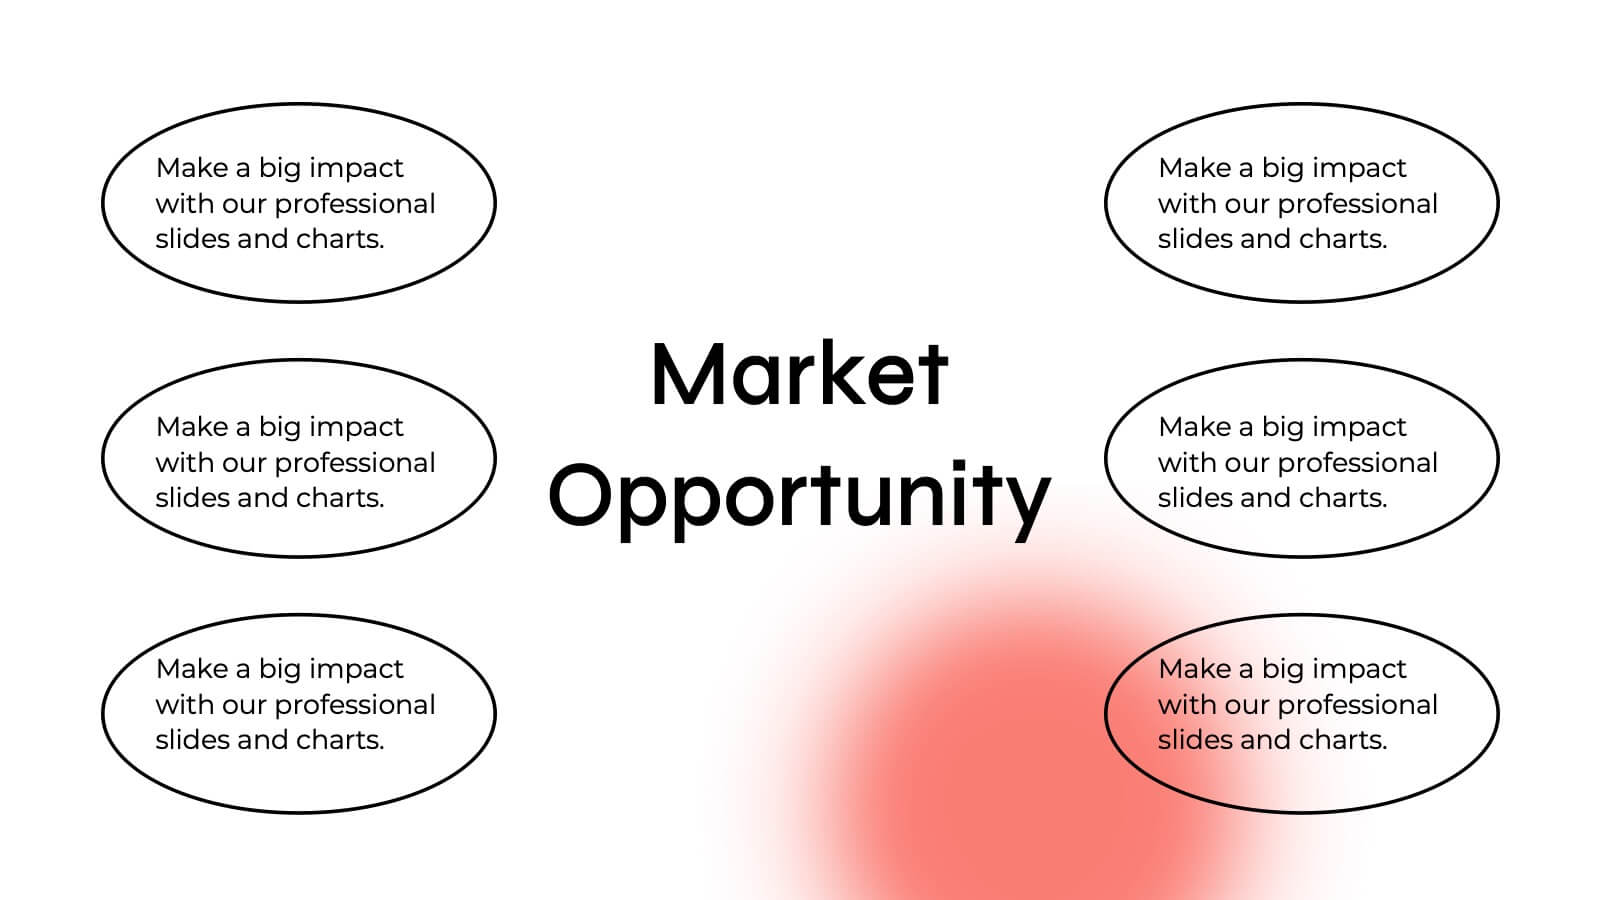
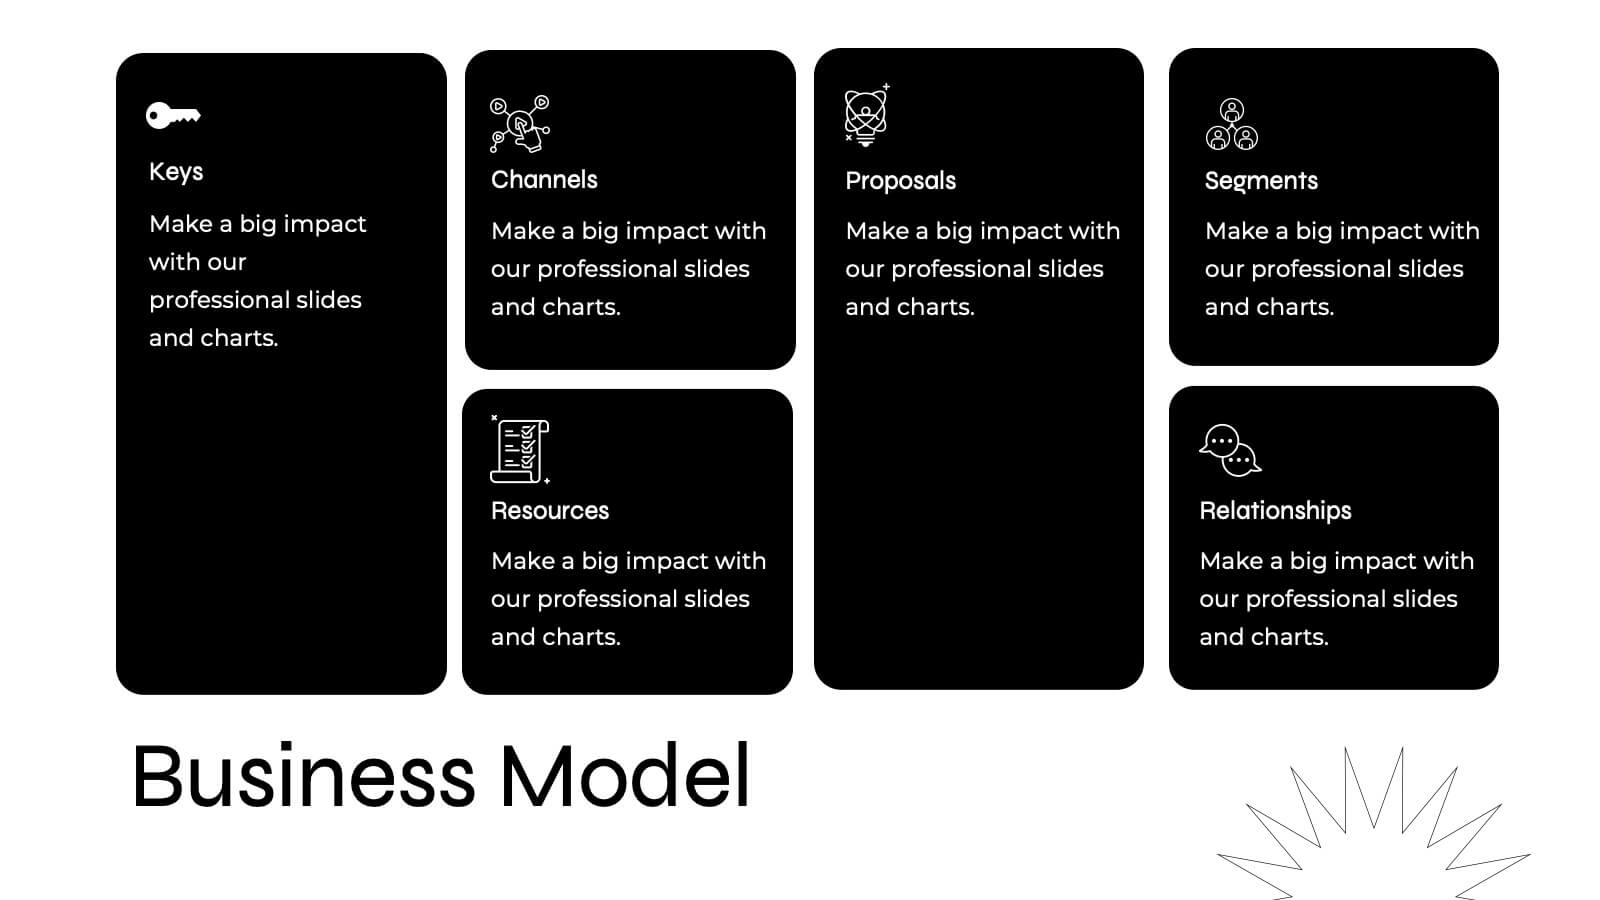
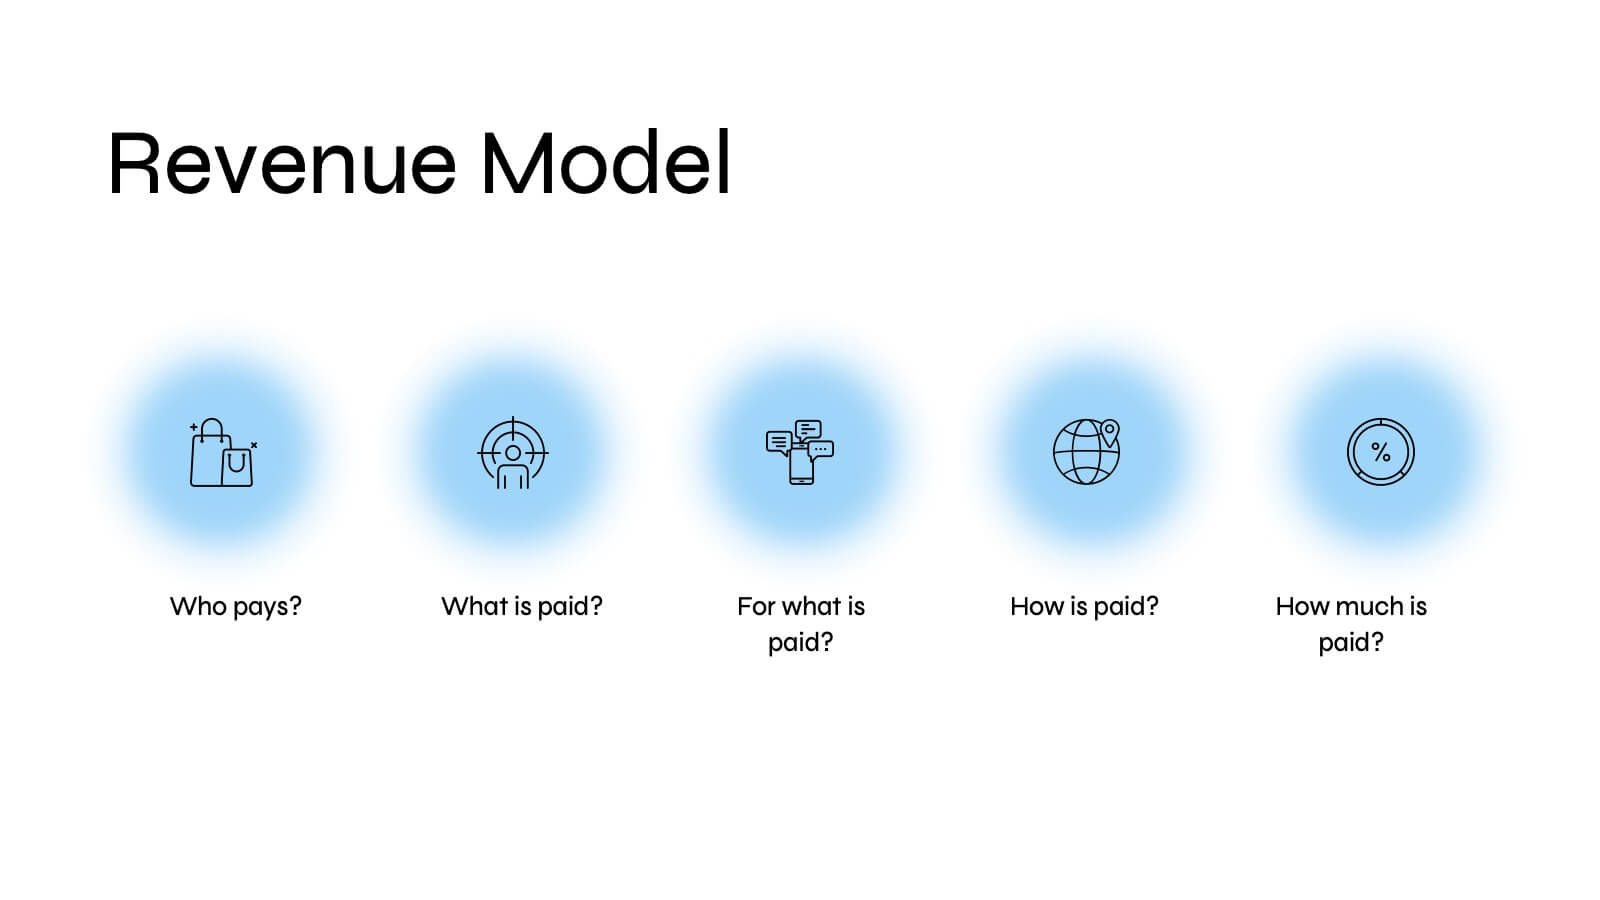
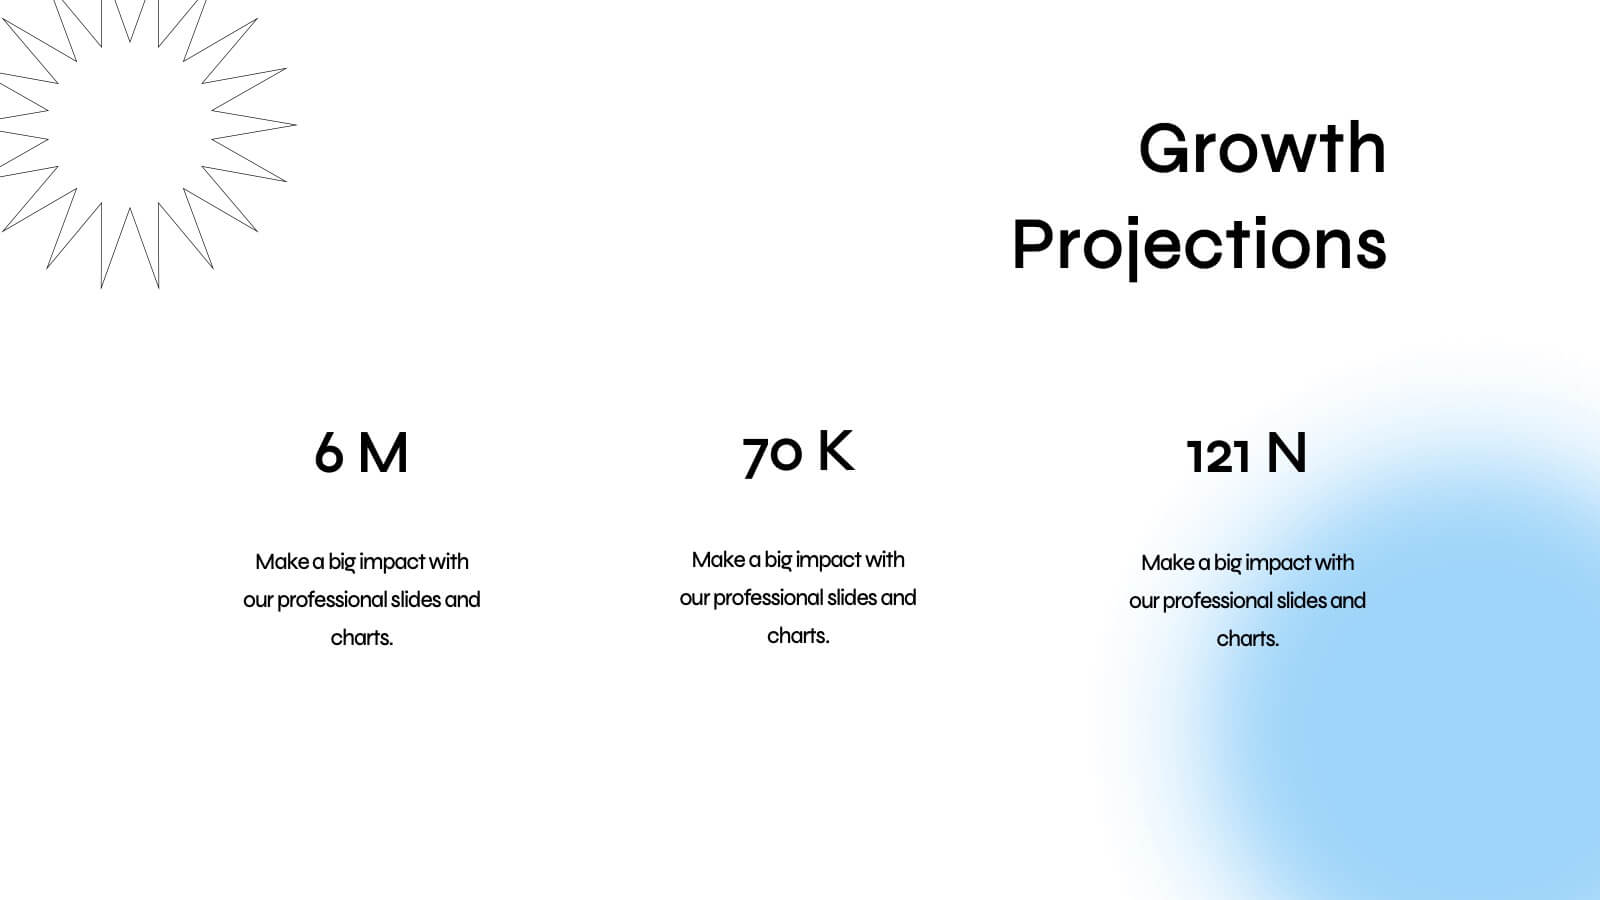
Quirinus Investor Pitch Presentation
Ready to impress investors and stakeholders? This sleek and modern pitch deck template covers all the essentials, from problem statements and market opportunities to revenue models and growth projections. Each slide is designed to convey clear and compelling information for maximum impact. Fully compatible with PowerPoint, Keynote, and Google Slides, making it the perfect tool for your next product launch!


21 diapositivas
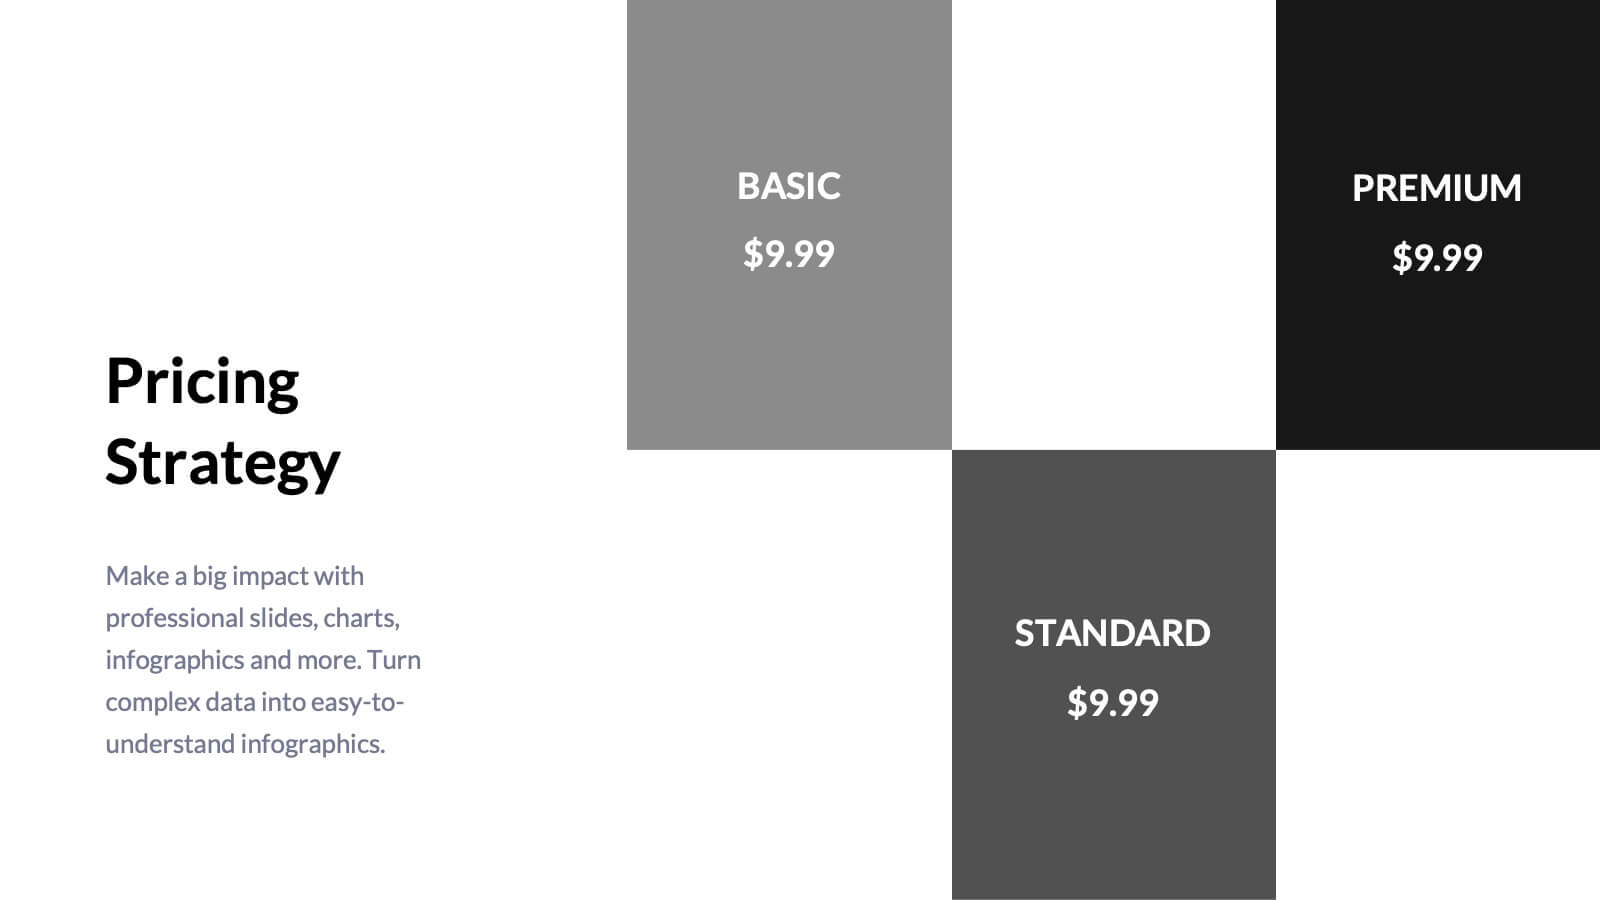
Tempest Sales Performance Report Presentation
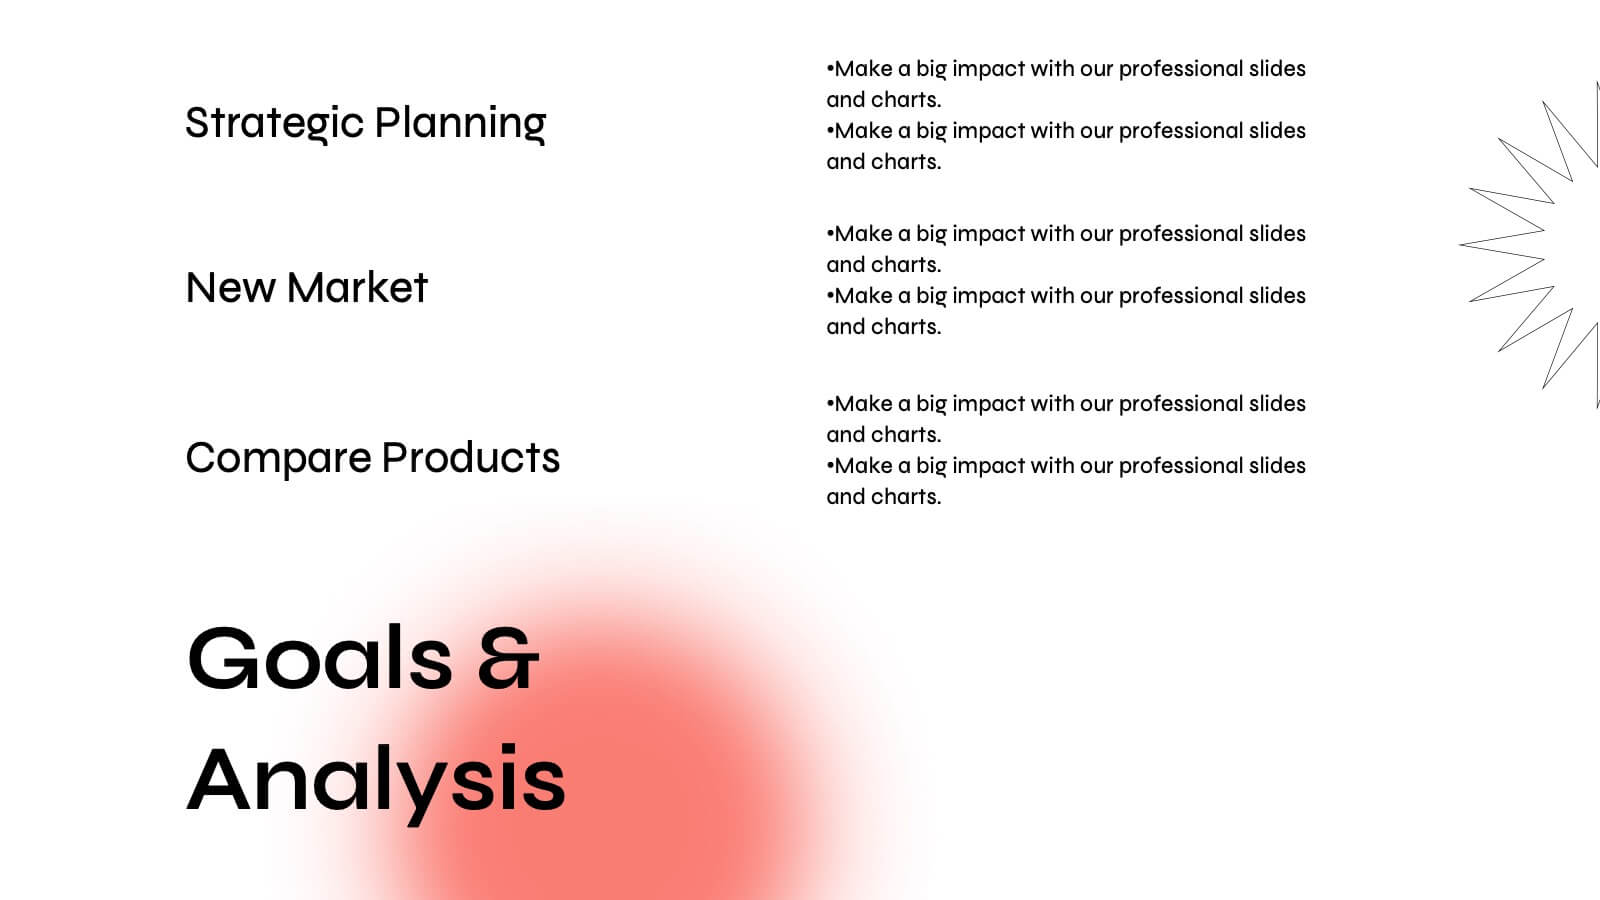
Supercharge your sales presentations with this sleek, professional template. Perfect for outlining sales objectives, processes, and performance metrics, it features a clean, minimalist design that enhances clarity and impact. Highlight key elements like competitive analysis, pricing strategy, and future opportunities to captivate your audience. Compatible with PowerPoint, Keynote, and Google Slides, it ensures seamless presentations on any platform.


5 diapositivas
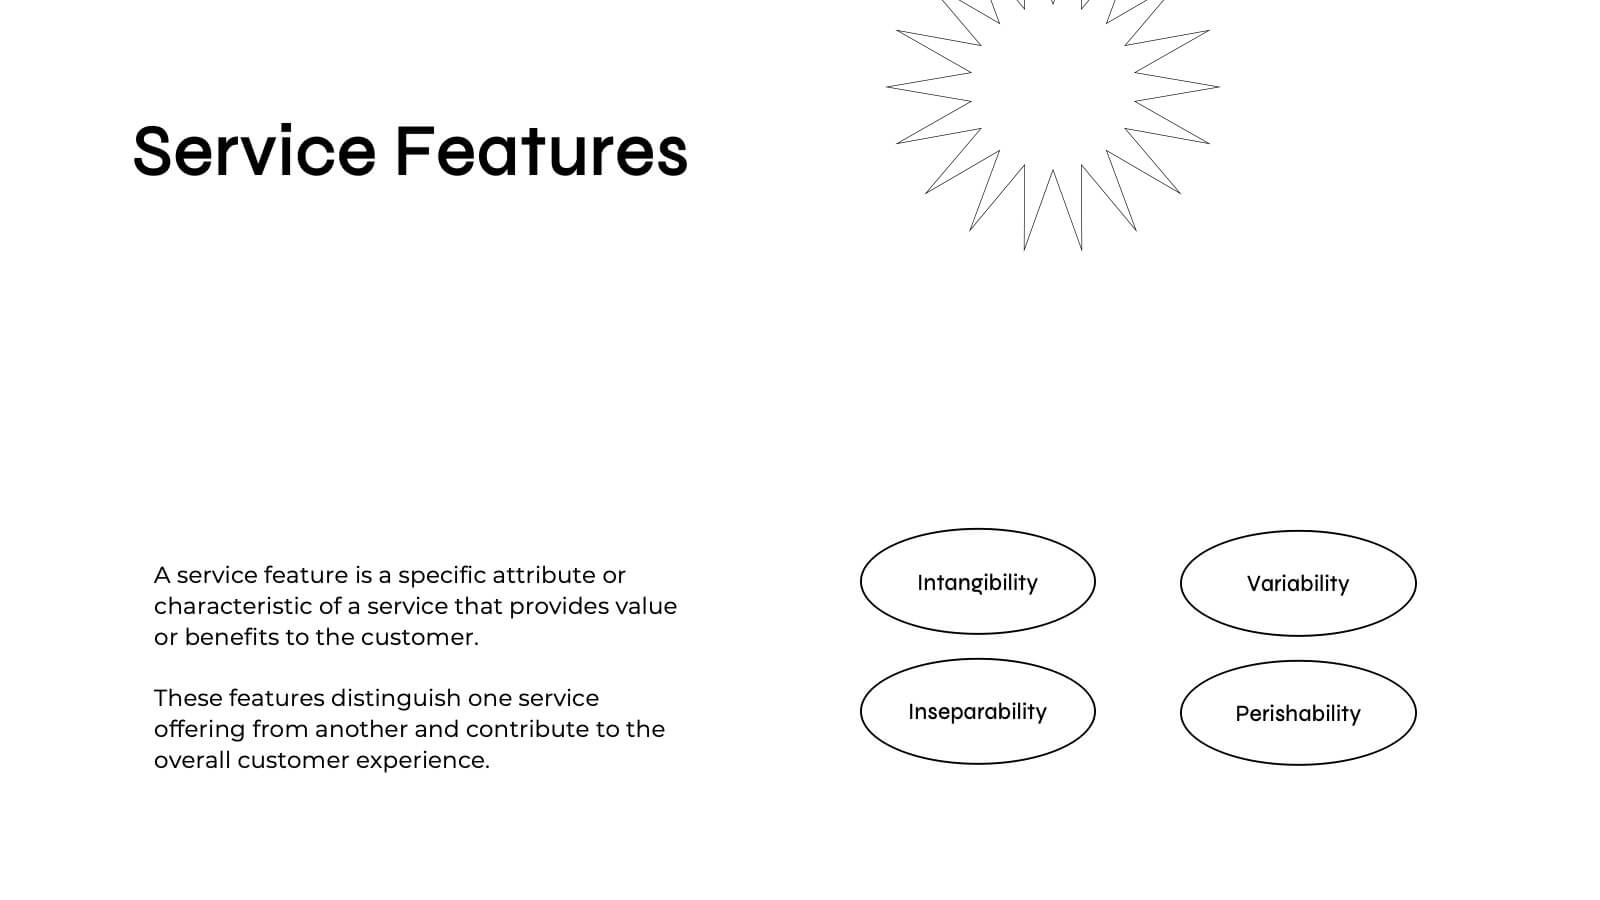
Key Business Benefits and Value
Present your organization’s core strengths using this 4-part value diagram. Ideal for outlining benefits, service pillars, or strategic goals, the slide features directional arrows with matching icons for clarity and structure. Easy to customize in PowerPoint, Keynote, and Google Slides—adjust text, icons, and colors to align with your business branding.


6 diapositivas
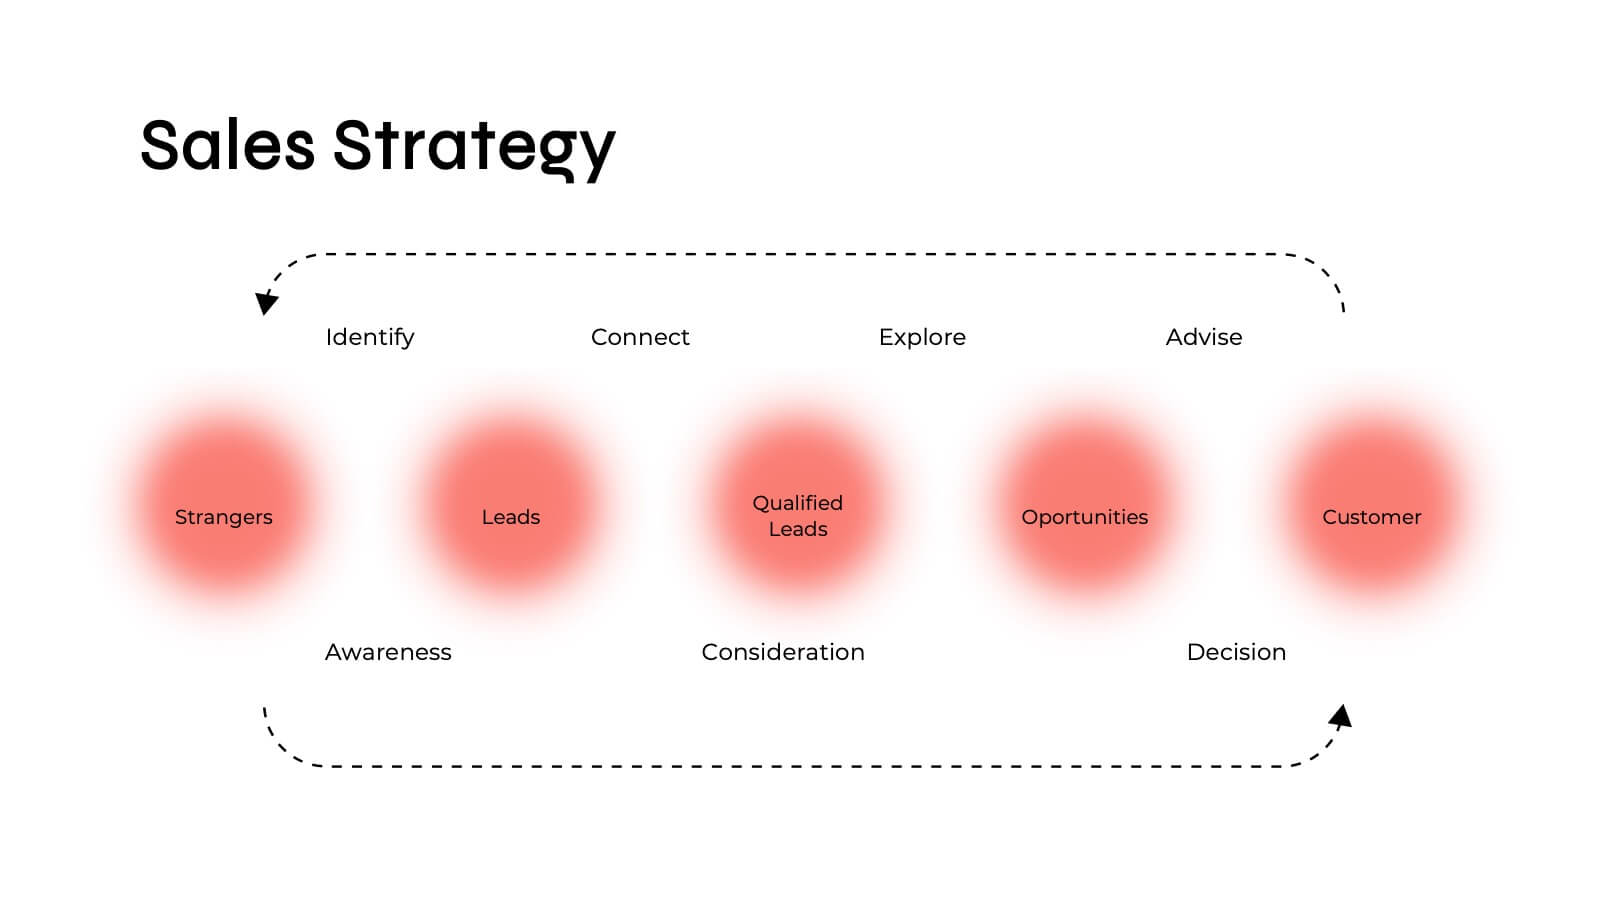
Sales Funnel Strategy Presentation
Clearly map your marketing efforts with this Sales Funnel Strategy Presentation. Featuring a bold, inverted funnel design with six customizable layers, this slide is perfect for illustrating your lead nurturing stages—from prospecting to conversion. Each segment includes editable titles and icons, making it ideal for PowerPoint, Keynote, or Google Slides. Great for sales teams, marketers, and strategists looking to drive results.


7 diapositivas
South America Countries Map Infographic
This South America Countries Map infographic template is designed for detailed presentations on the geographical and statistical information of South American countries. Compatible with PowerPoint, Google Slides, and Keynote, the template set includes maps with data points indicating various statistics such as population percentages, and demographic information. Visual aids like pie charts, bar graphs, and icon representations help to depict data in an easily understandable manner. The color-coding and labels are clear, making it easy to differentiate between countries and regions. This template is ideal for educators, analysts, and business professionals needing to present country-specific data across South America.


23 diapositivas
Dragonveil Product Launch Pitch Deck Presentation
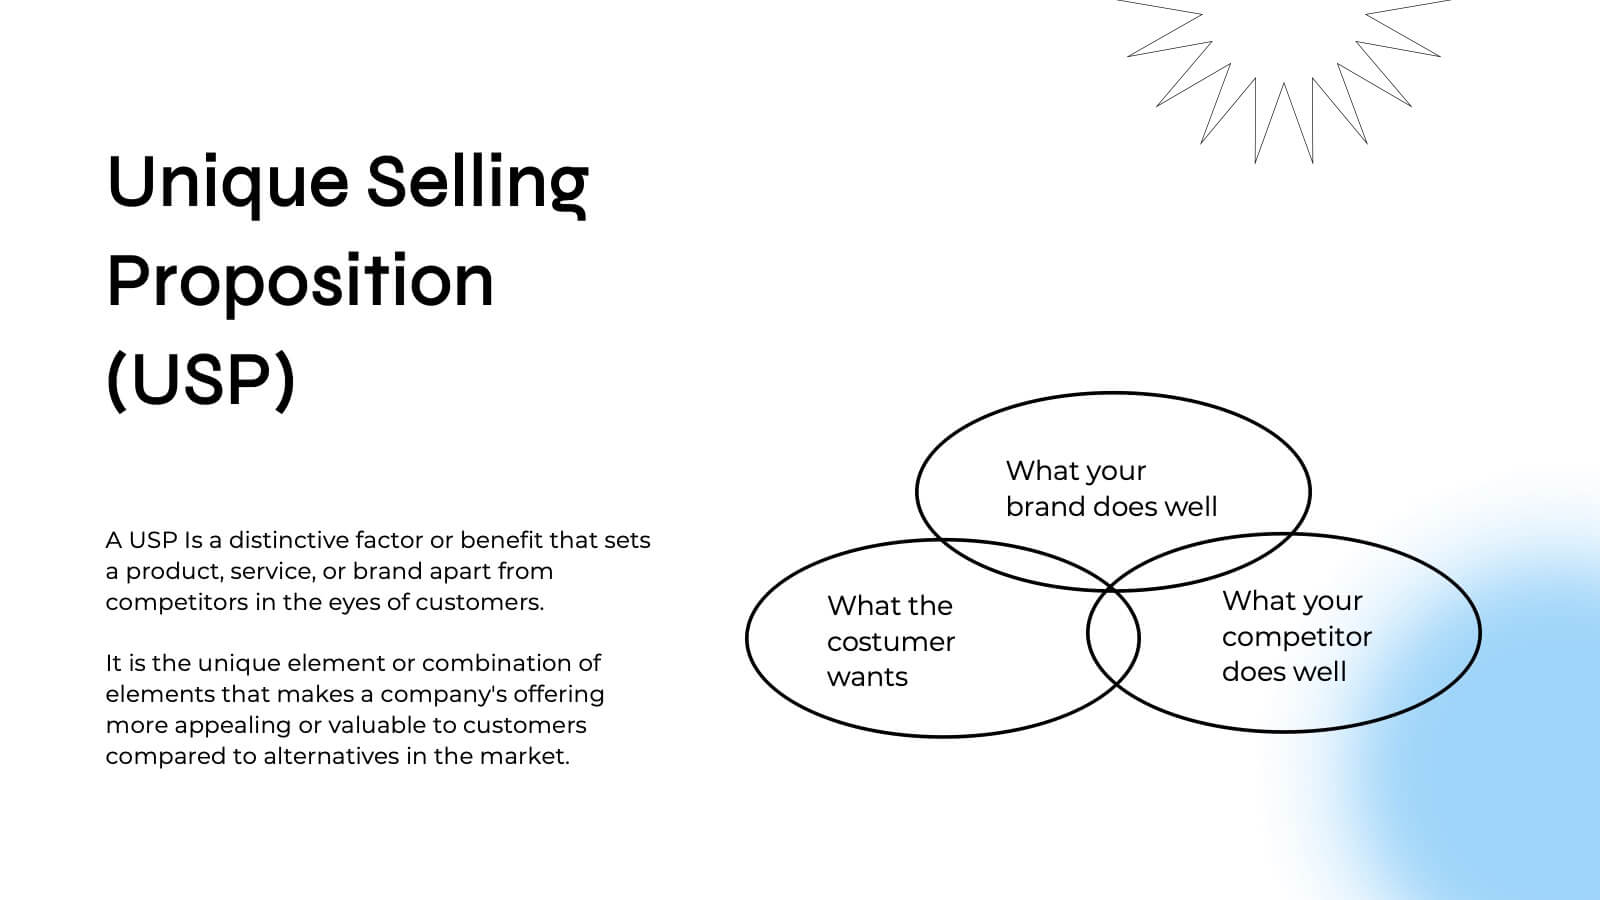
The Product Launch Pitch Deck Presentation Template features 23 fully customizable slides designed to outline key aspects such as market opportunity, revenue model, and sales strategy. Ideal for startups and businesses launching new products, it ensures a compelling pitch. Compatible with PowerPoint, Keynote, and Google Slides.


6 diapositivas
Editable Weekly Calendar Slide Presentation
Bring your week into focus with a vibrant layout that turns daily planning into something you actually look forward to. This presentation helps you outline tasks, deadlines, and priorities in a clear, color-coded structure perfect for productivity. Fully editable and compatible with PowerPoint, Keynote, and Google Slides.