


Características


¿Tienes alguna pregunta?
Recomendar


26 diapositivas
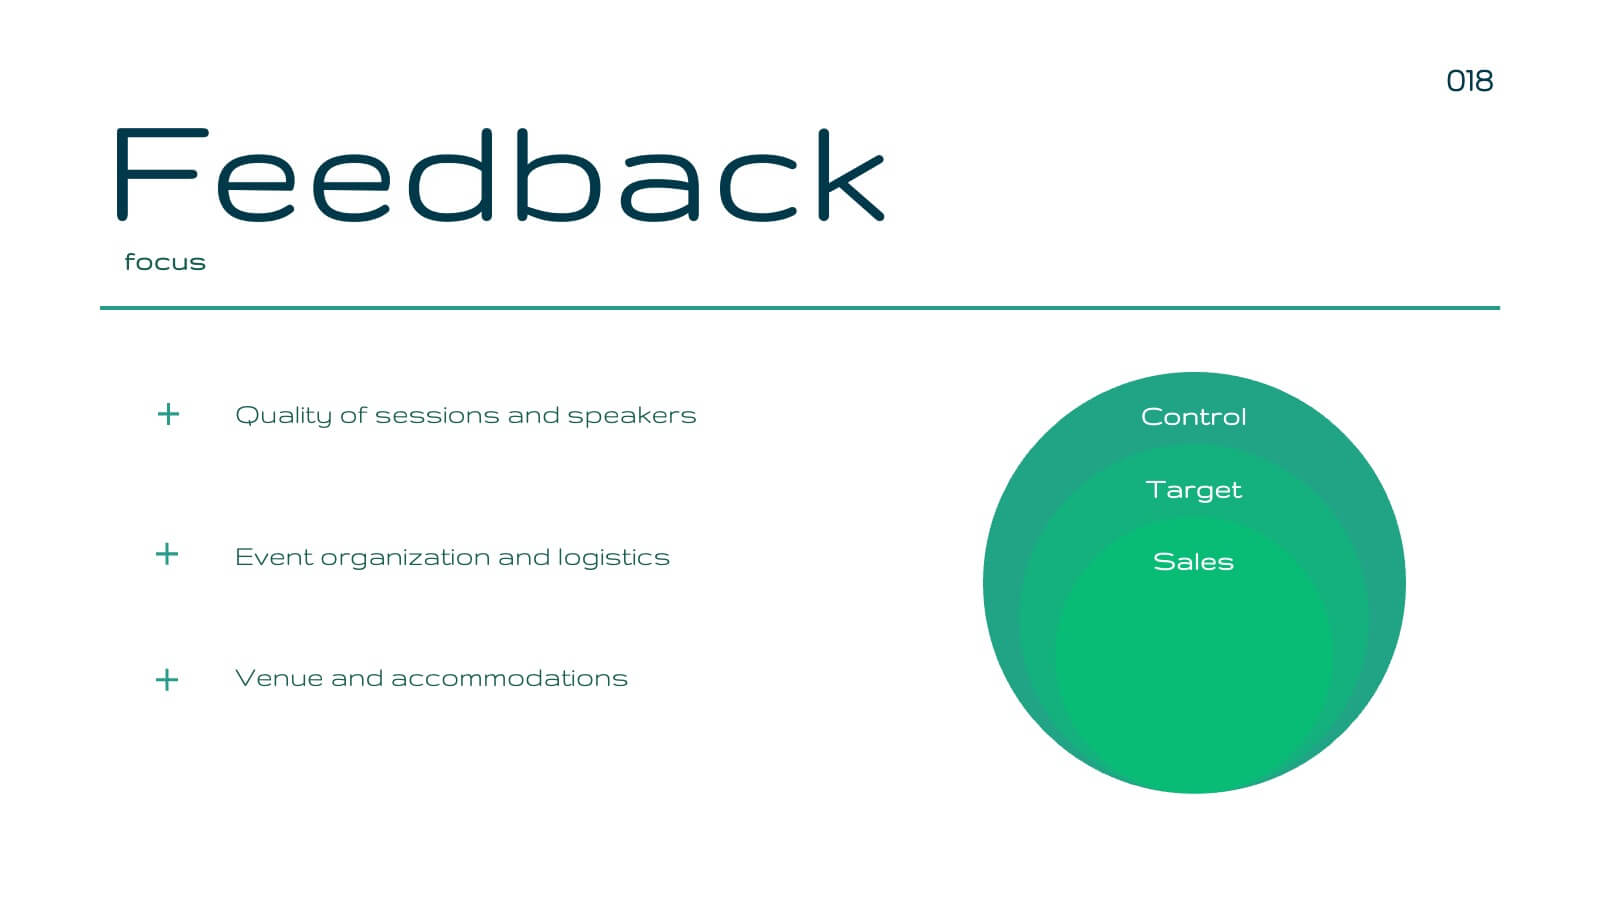
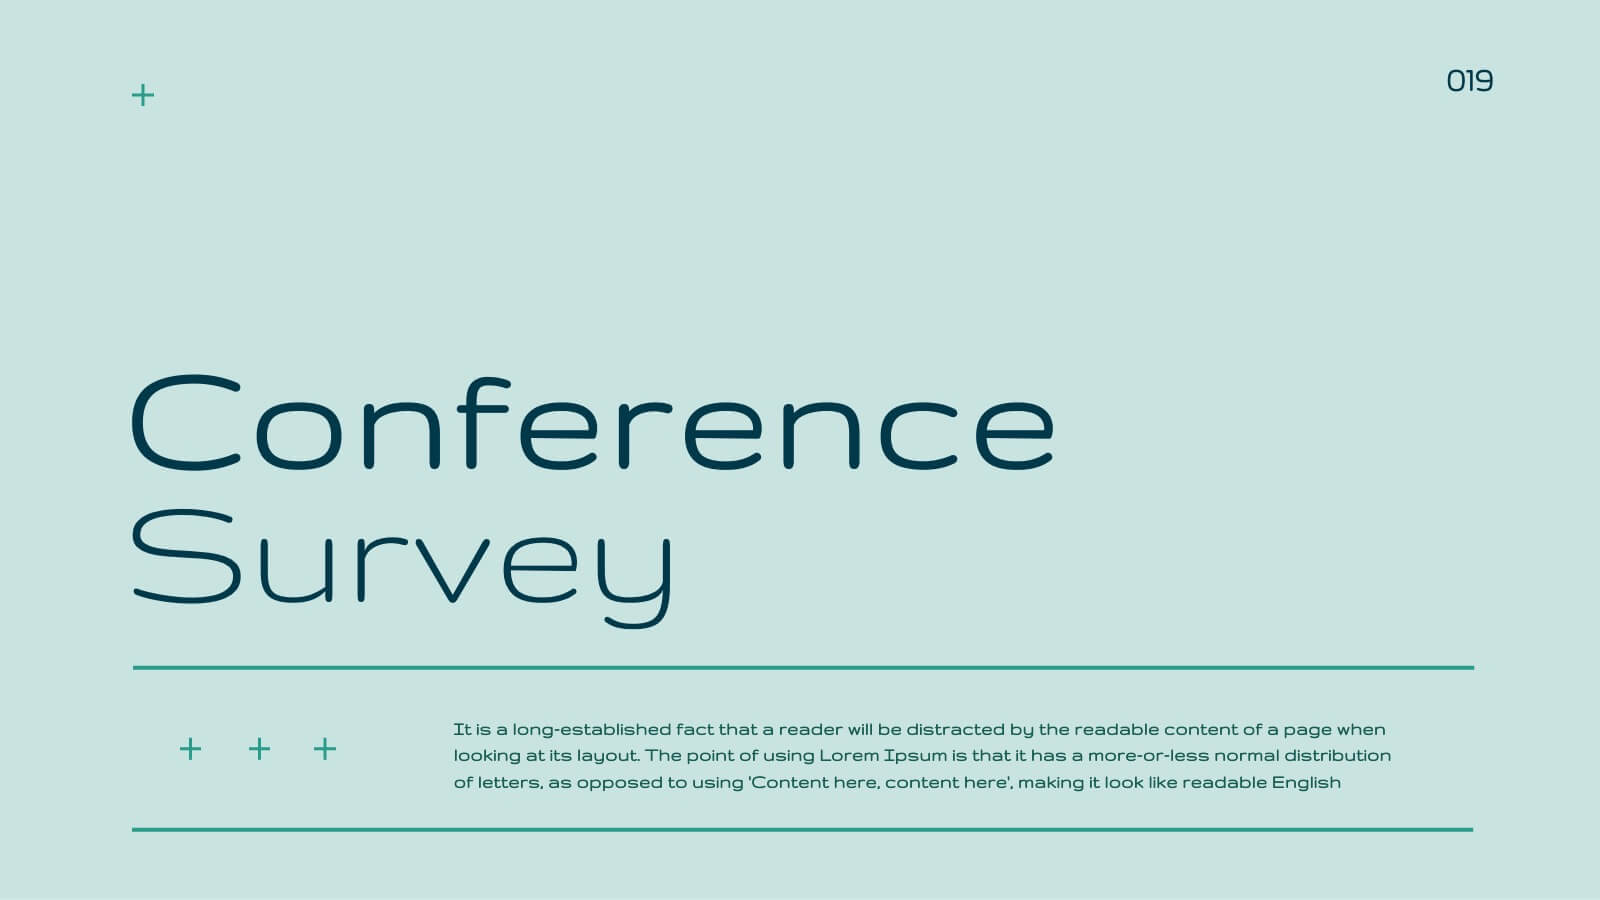
Maev Presentation Template
Maev is a perfect modern template with a clean and professional feel. Maev was designed by professionals to help businesses connect with their audience. This template has a modern, chic aesthetic and very detailed look which is extremely appealing. The colors are fresh which help keep the look clean and easy to read. The theme comes packed with features to target your audience and help you get your message across. Charts, timelines and easy to edit text, this template is perfect for businesses seeking to make an impression on their audience. by demonstrating they are transparent and reliable.


6 diapositivas
SMART Goals Breakdown Presentation
Bring clarity and momentum to your planning with this clean, easy-to-follow slide that breaks down each step of the SMART framework. It helps audiences understand how goals become actionable through structure and measurement. Perfect for training, strategy, or coaching sessions. Fully compatible with PowerPoint, Keynote, and Google Slides.


4 diapositivas
Sustainability Report Slide Deck Presentation
Bring your sustainability story to life with a bright, modern layout that turns complex environmental data into a clear visual narrative. This presentation helps you outline key initiatives, performance metrics, and long-term goals in a clean, structured format. Fully editable and compatible with PowerPoint, Keynote, and Google Slides.


21 diapositivas
Vibrato Startup Funding Proposal Presentation
This bold startup funding proposal sparks investor interest with a powerful story, innovative solutions, and high-growth strategies. Showcase game-changing technology, a passionate team, and an unstoppable roadmap to success. With clear metrics and dynamic visuals, this pitch invites investors to fuel the next big breakthrough.


6 diapositivas
Real Estate Housing Solutions Presentation
Present property features and real estate plans with this creative multi-level housing diagram. Designed for agents, developers, or housing consultants, this layout clearly segments space usage or service offerings. Fully customizable in PowerPoint, Keynote, and Google Slides—perfect for showcasing floor plans, room functions, or housing solutions with vibrant clarity.


6 diapositivas
Hierarchical Thought Flow Mind Map Presentation
Present your ideas with clarity using this Hierarchical Thought Flow Mind Map presentation. Designed for structured thinking, this layout displays six key concepts radiating from a central theme, making it ideal for workflows, strategies, or team roles. Fully editable in Canva, PowerPoint, and Google Slides for total customization.


7 diapositivas
Design Mockup Infographic
Present your creative projects with precision and style using this collection of design mockup templates. Each template is expertly crafted to showcase your graphic designs, digital art, or branding projects across multiple devices and settings, emphasizing both detail and context. Featuring sleek, modern layouts, these mockups integrate vibrant color schemes and dynamic typography to make your designs pop. Ideal for graphic designers, marketers, and creative agencies, these templates provide a professional setting for presenting web designs, app interfaces, and other digital products to clients and stakeholders. Customize these templates with ease, adding your own images and text to tailor the mockups to your specific project needs. Whether you're creating a portfolio, client presentation, or marketing materials, these mockups will help you display your work in the most effective and engaging way.


22 diapositivas
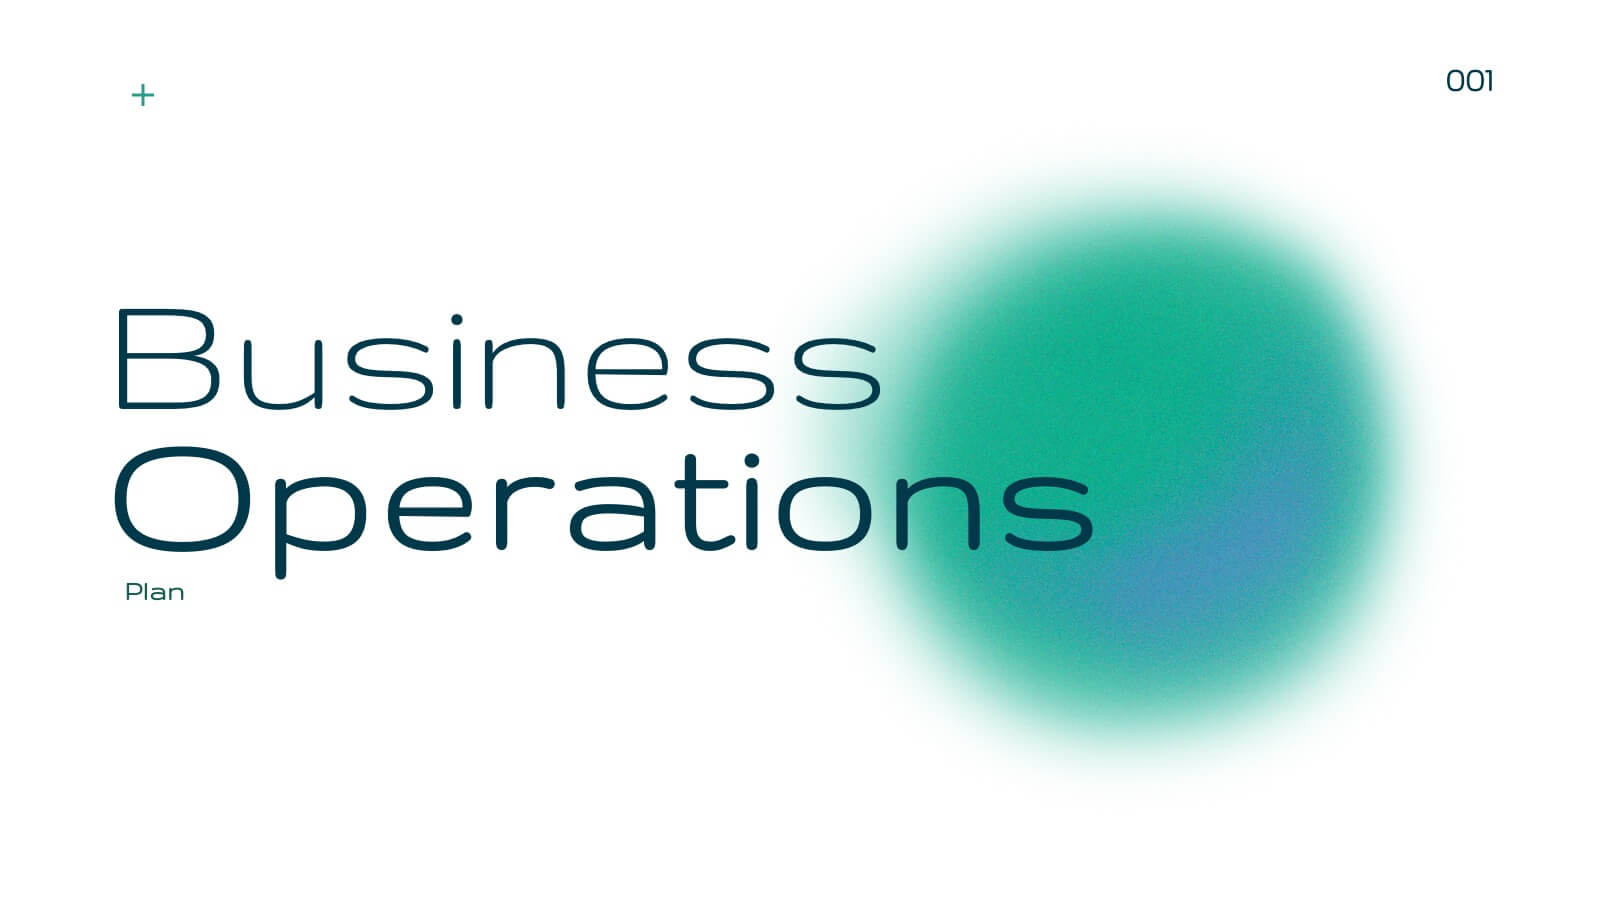
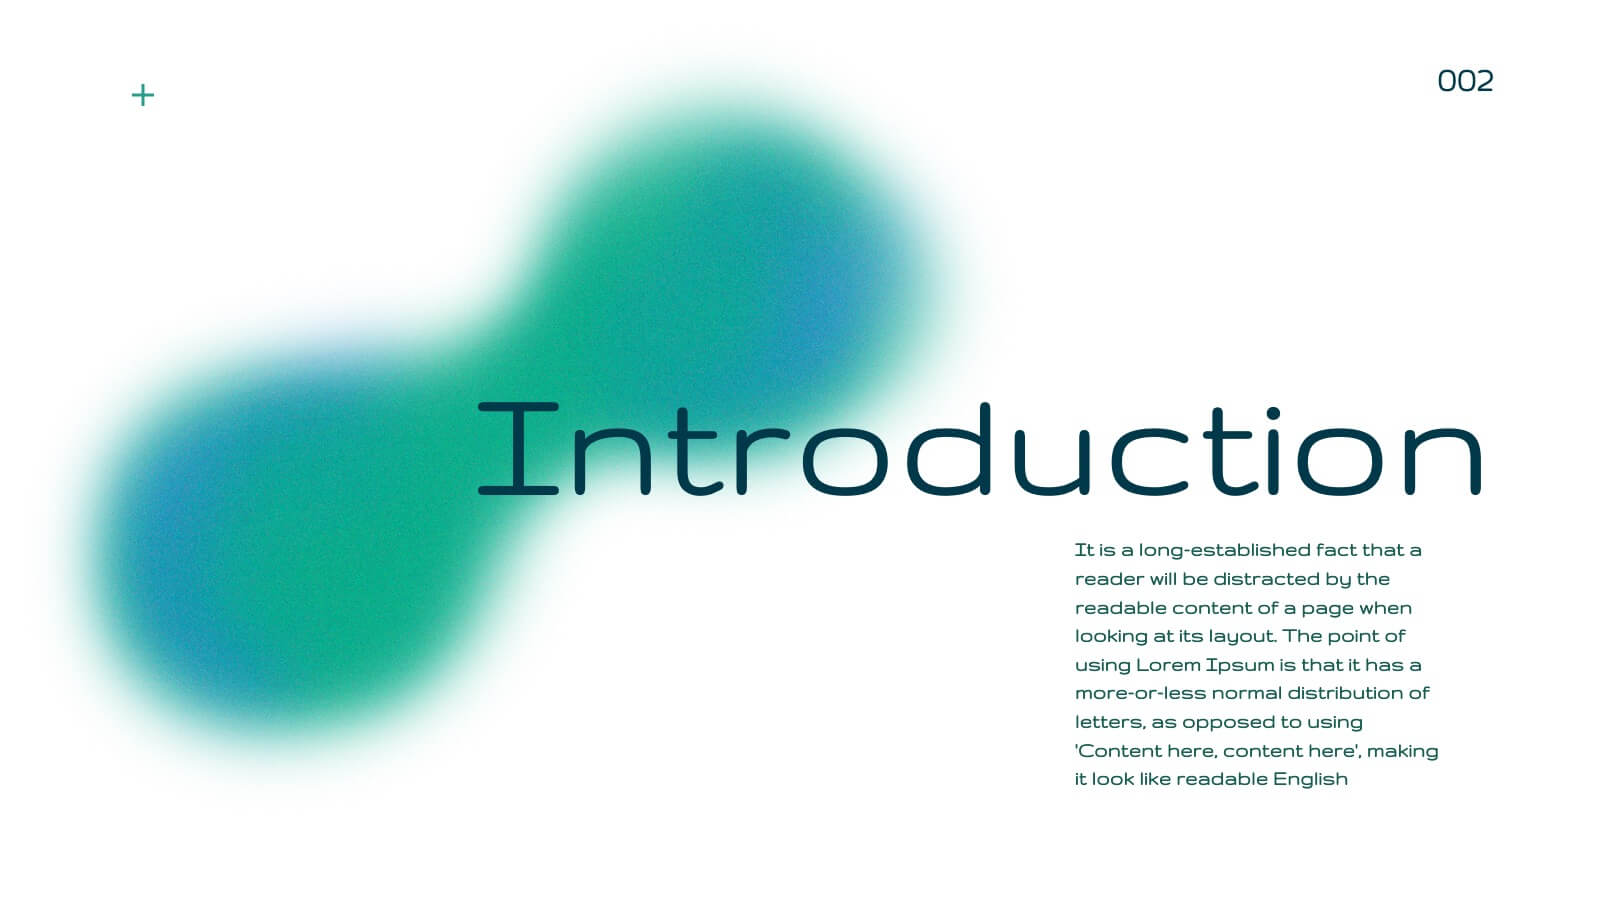
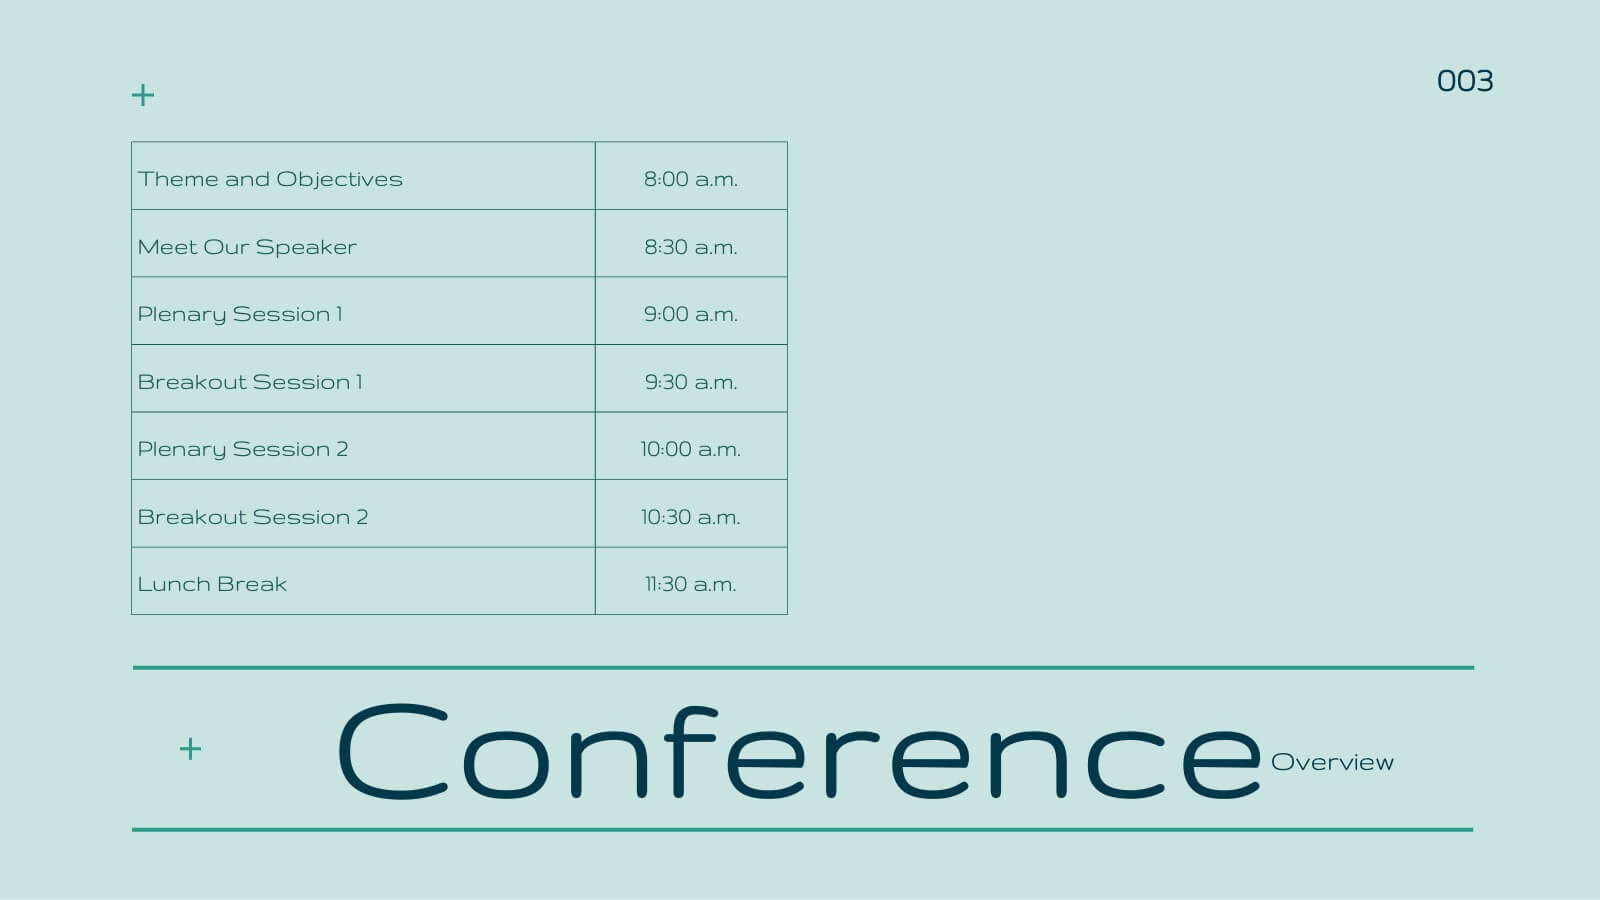
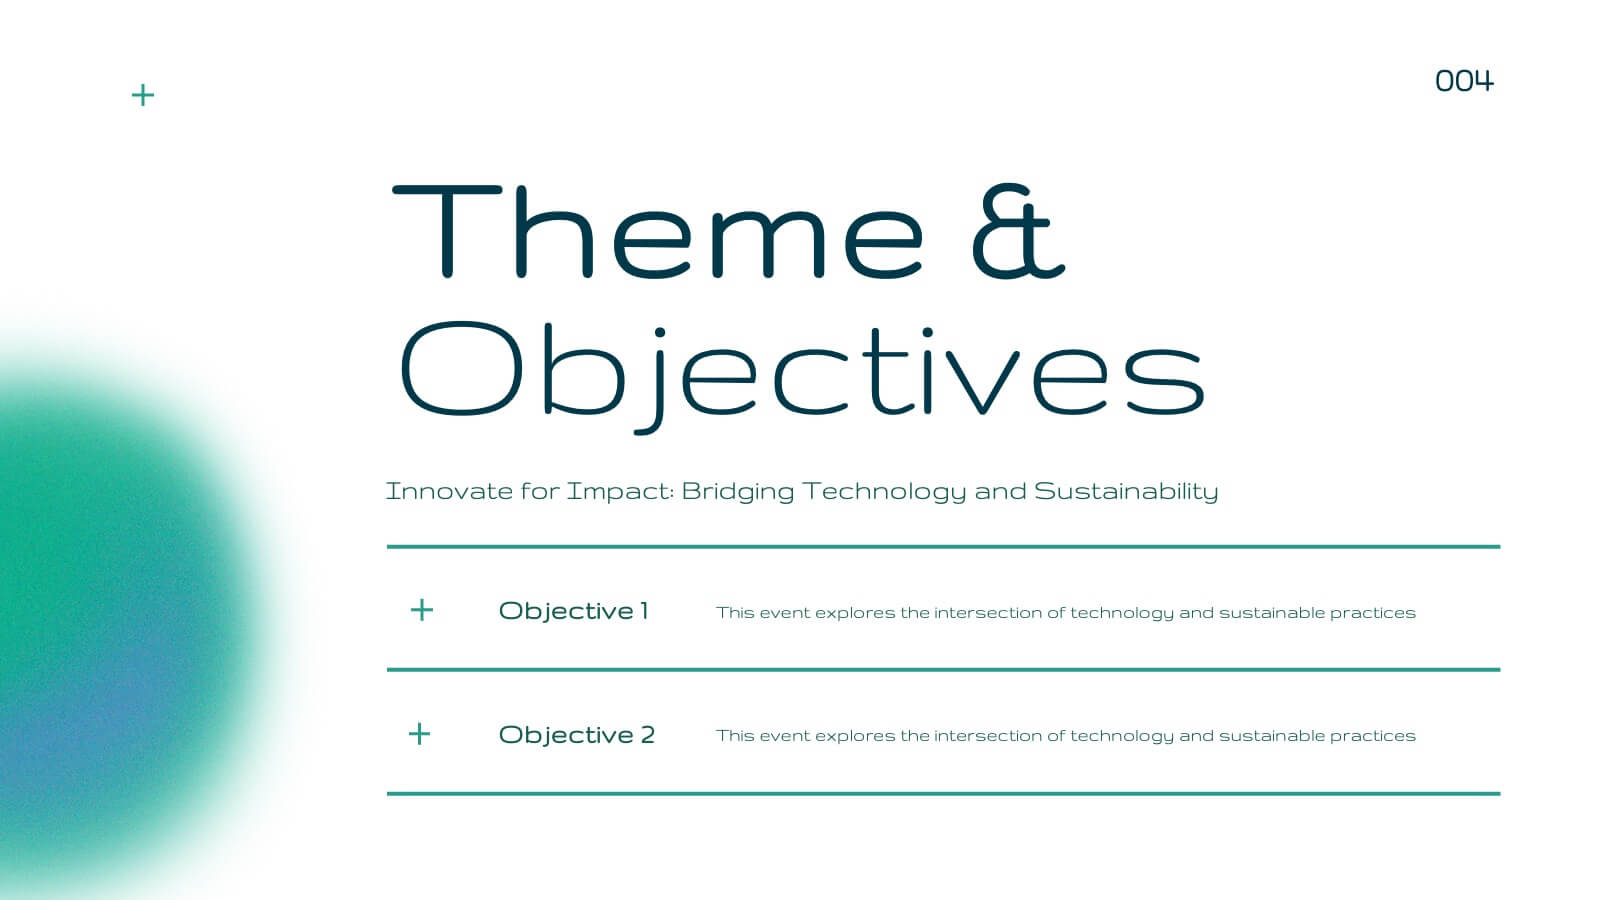
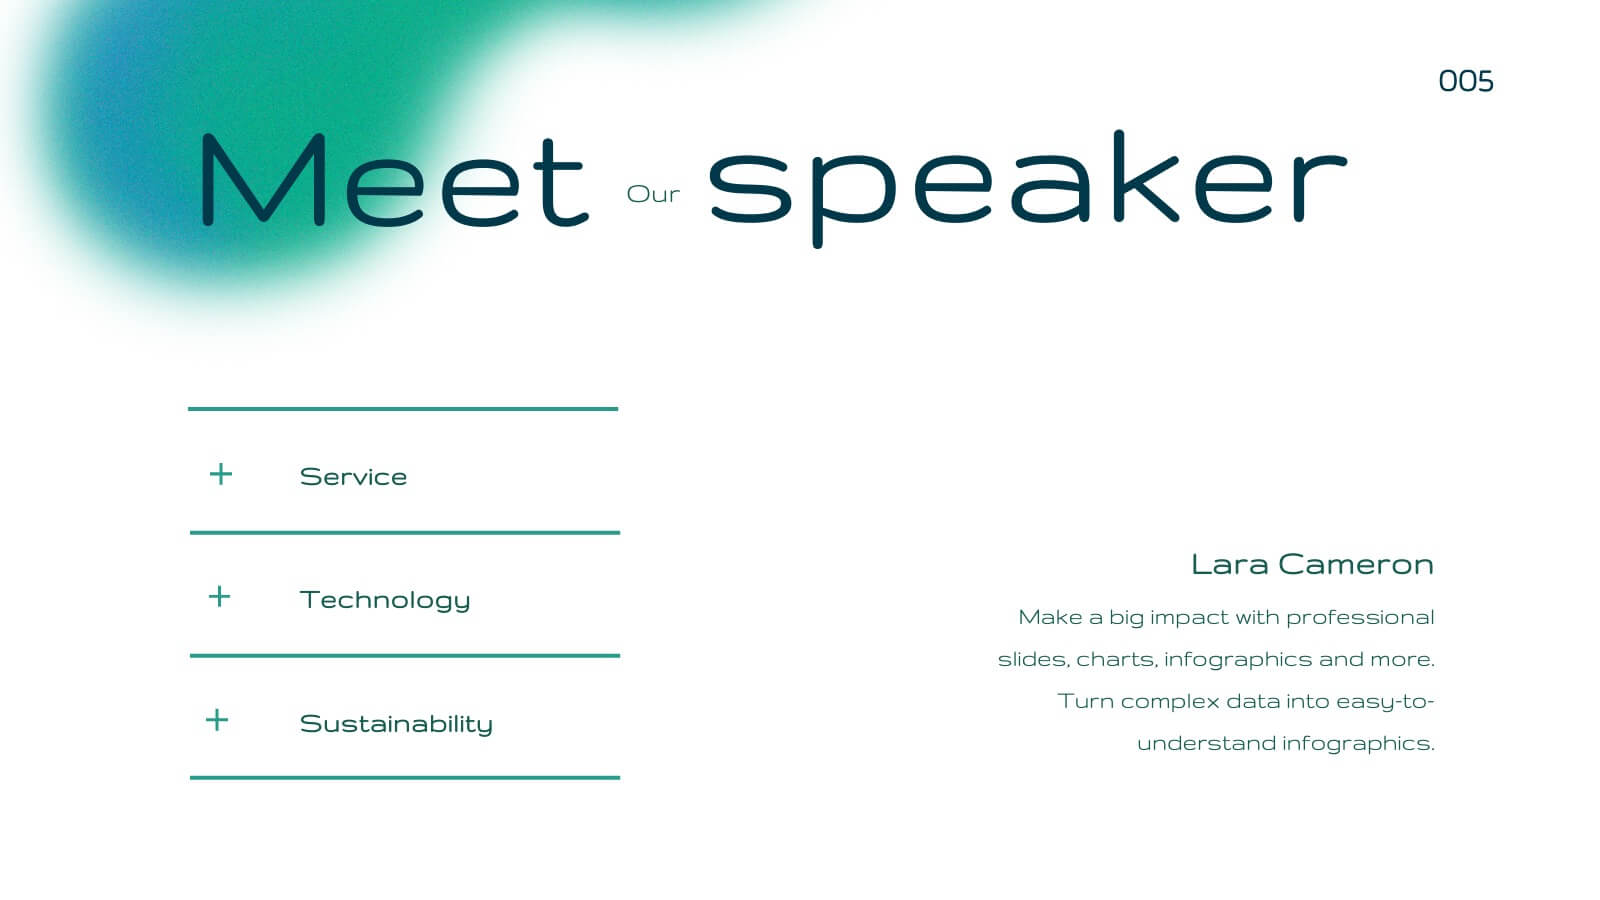
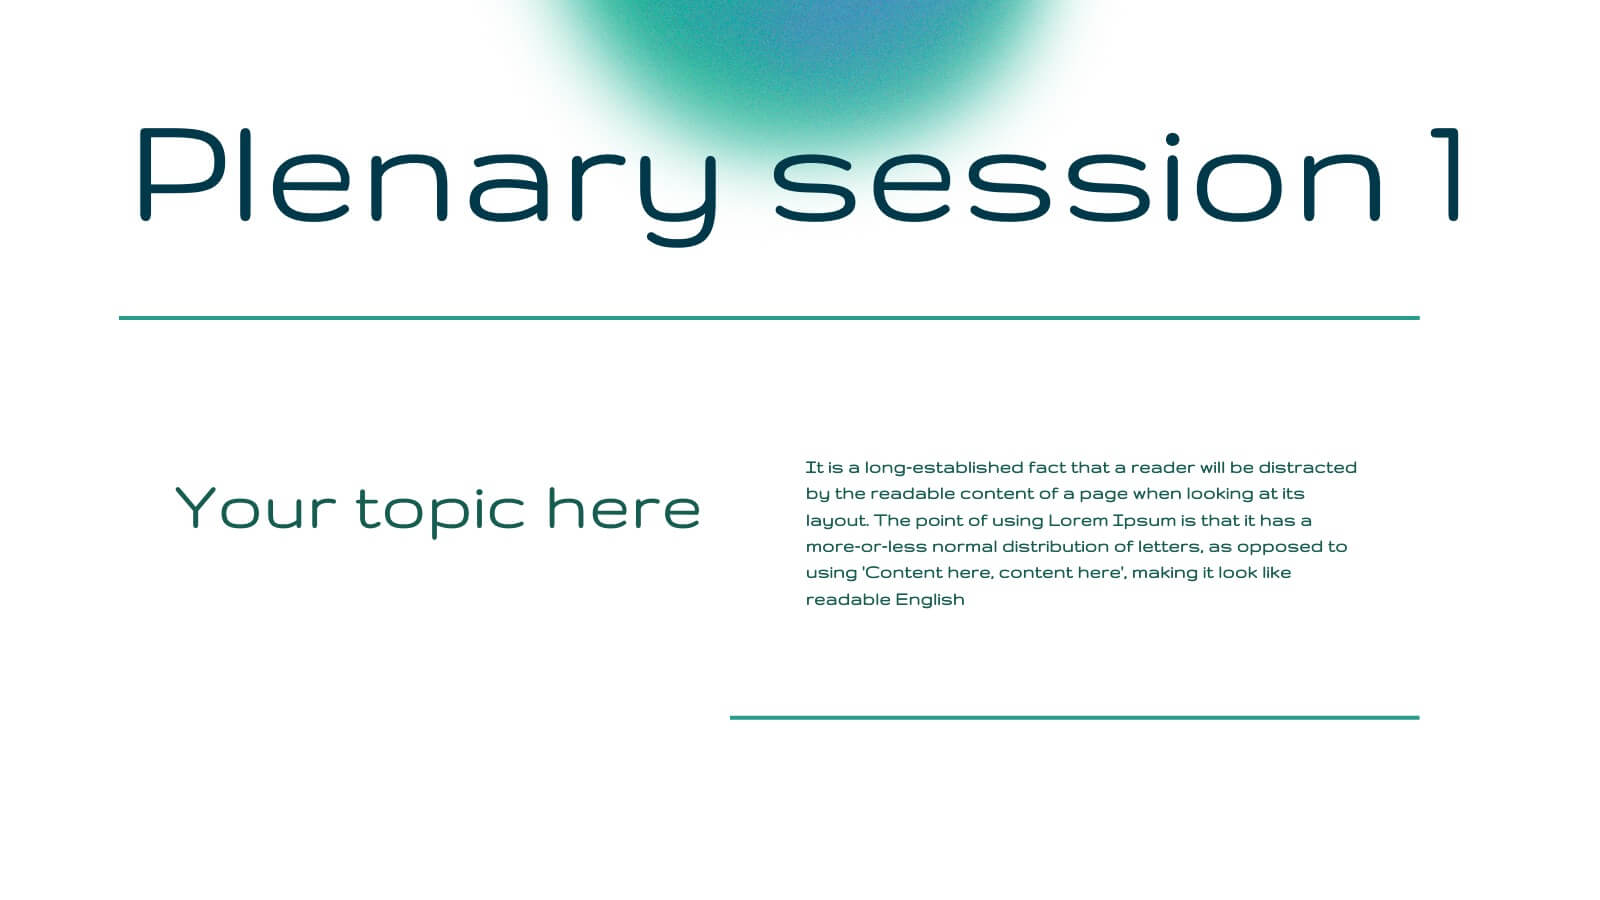
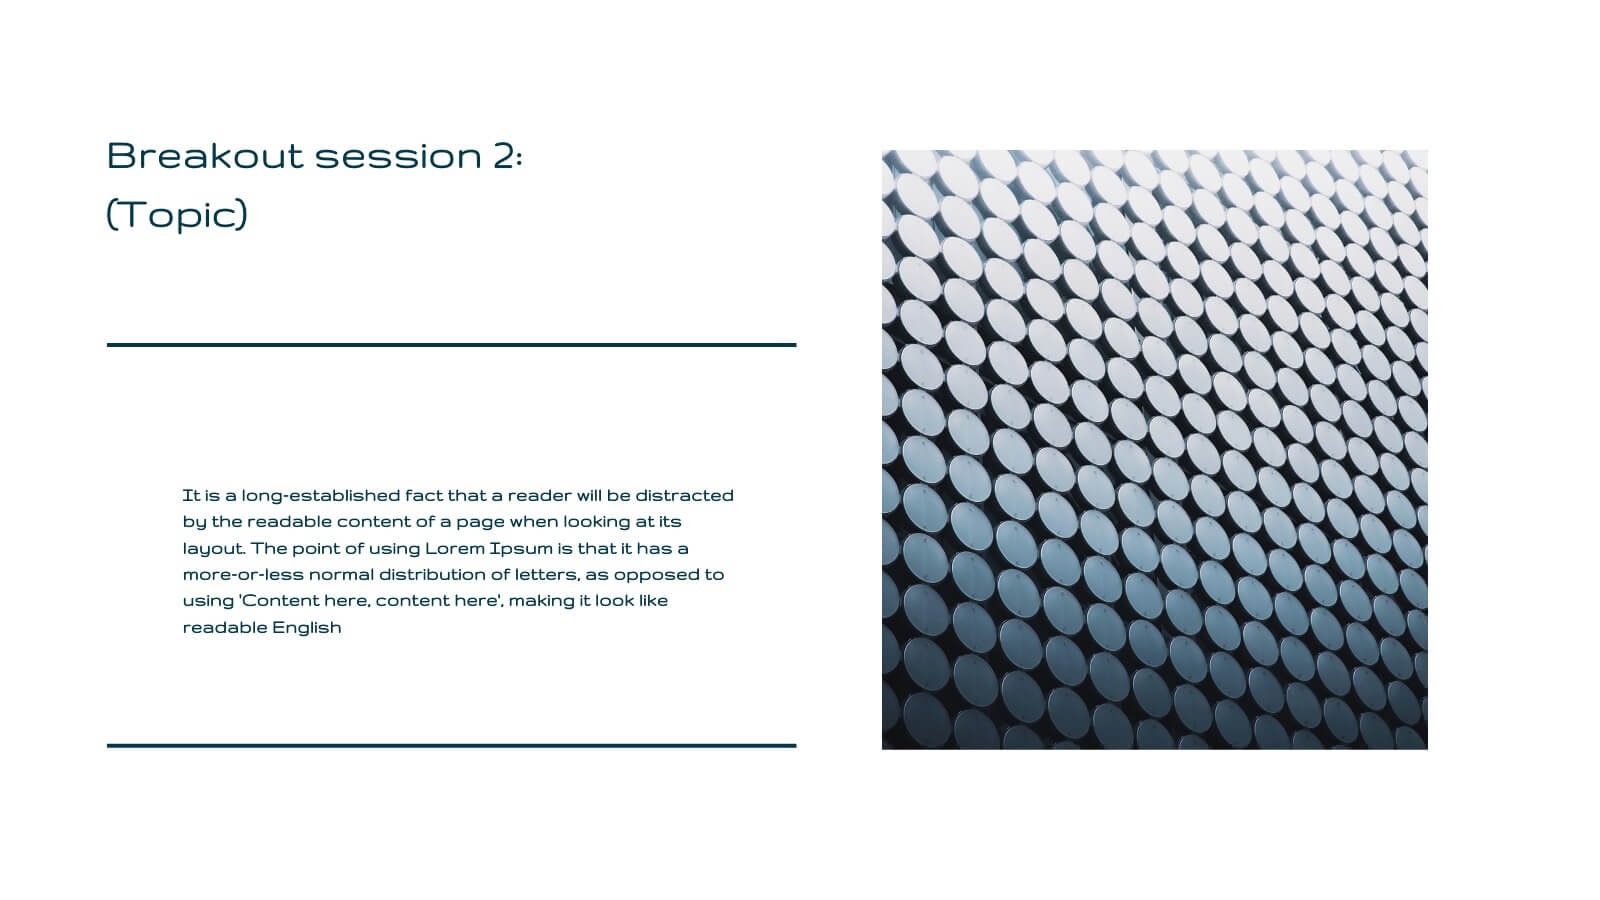
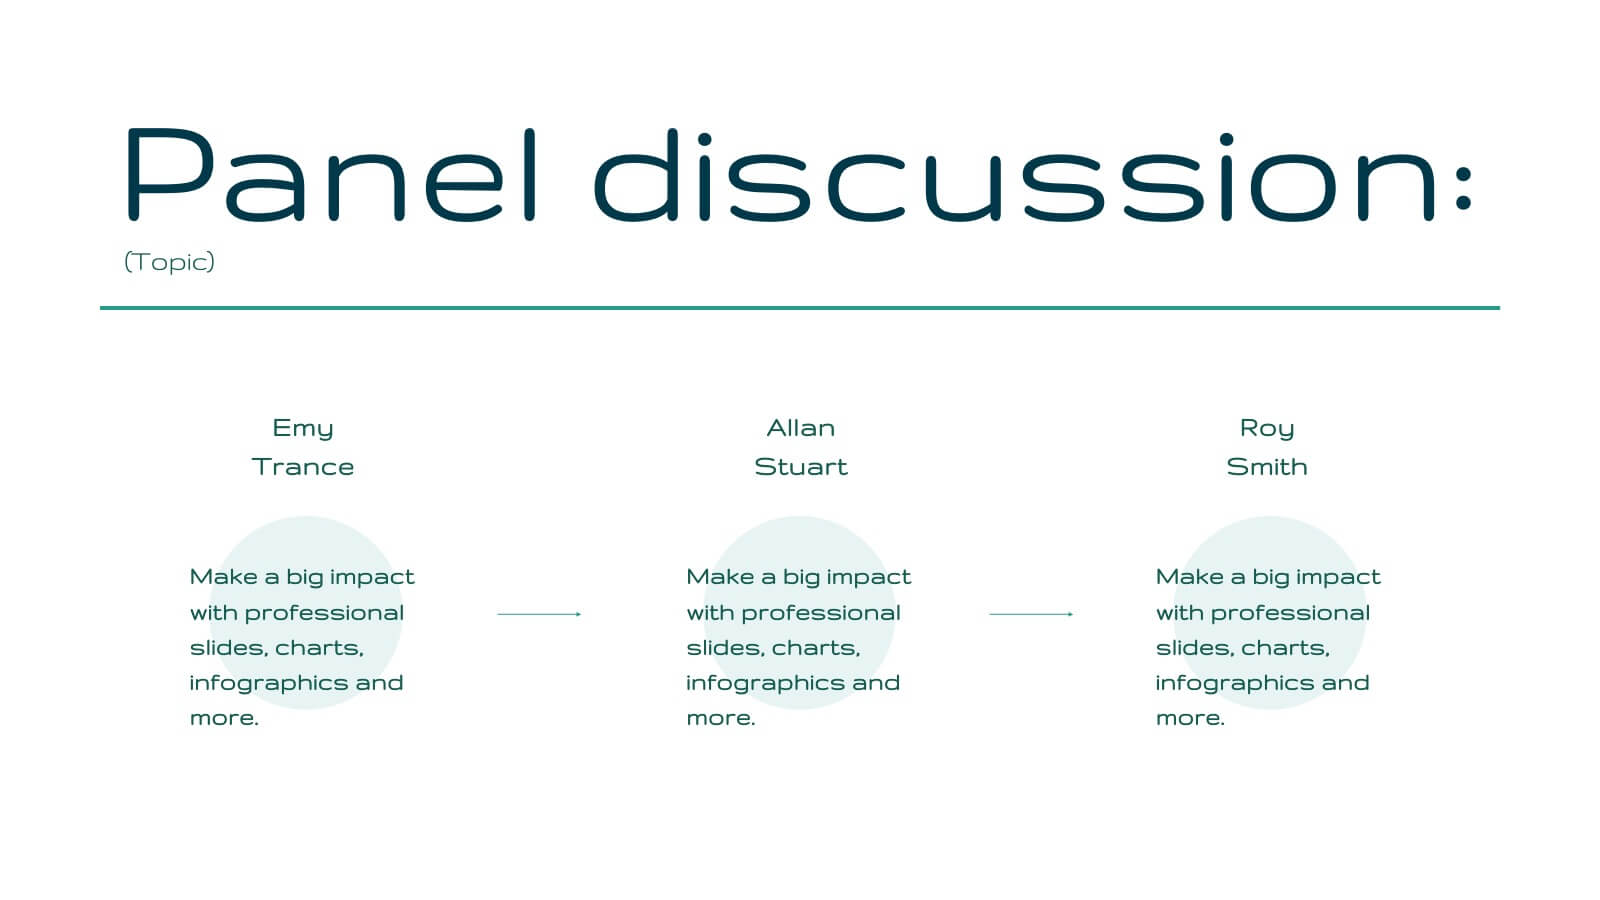
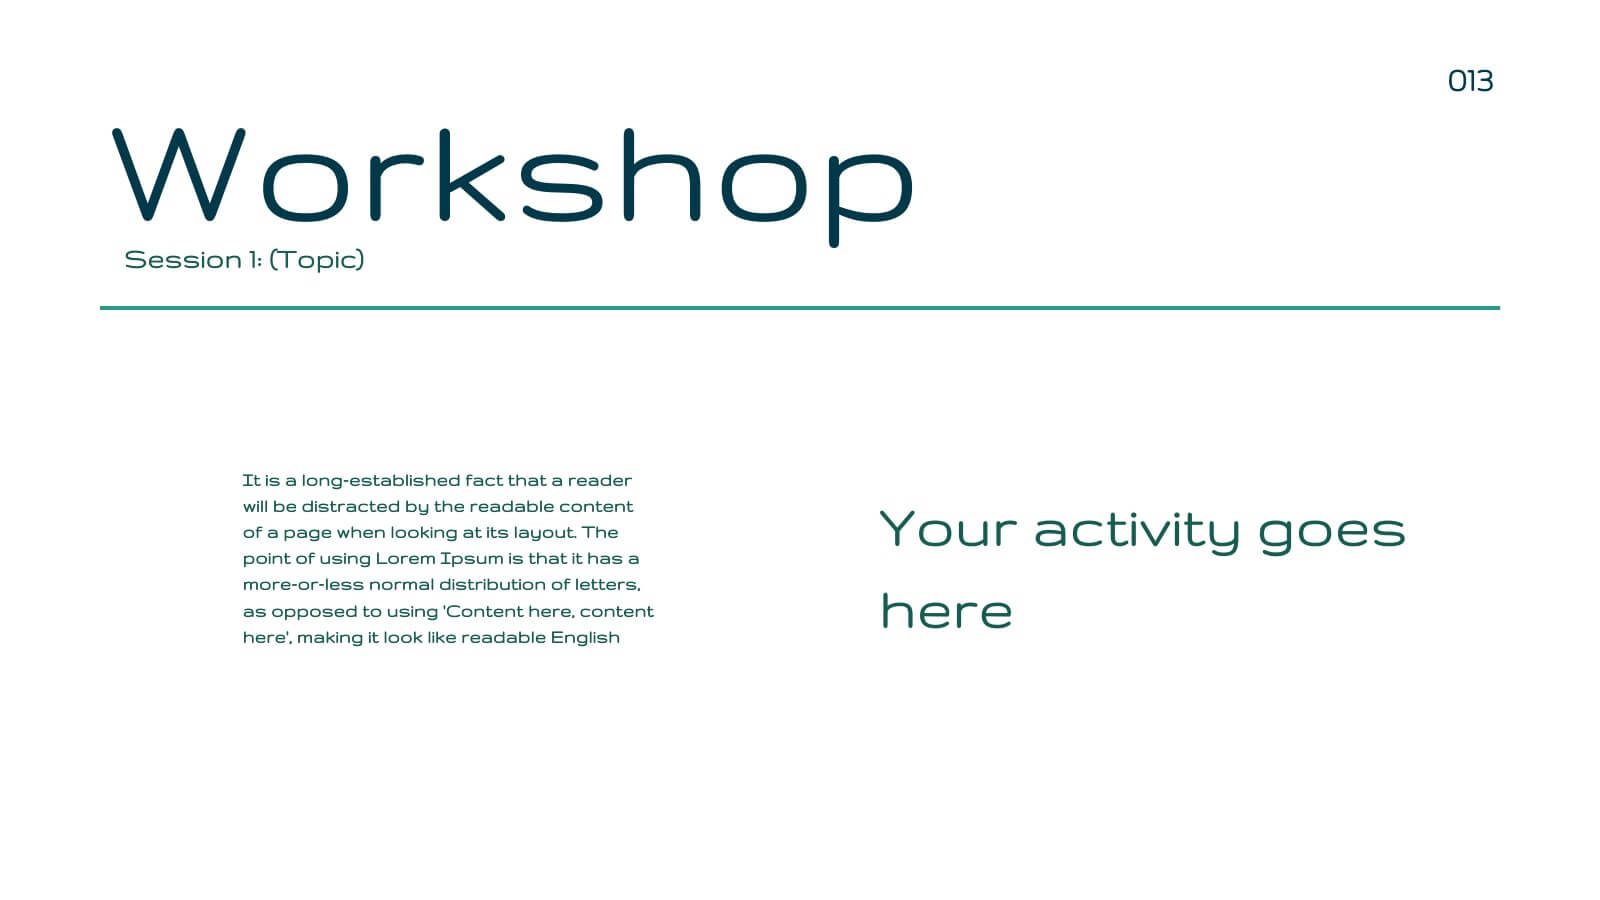
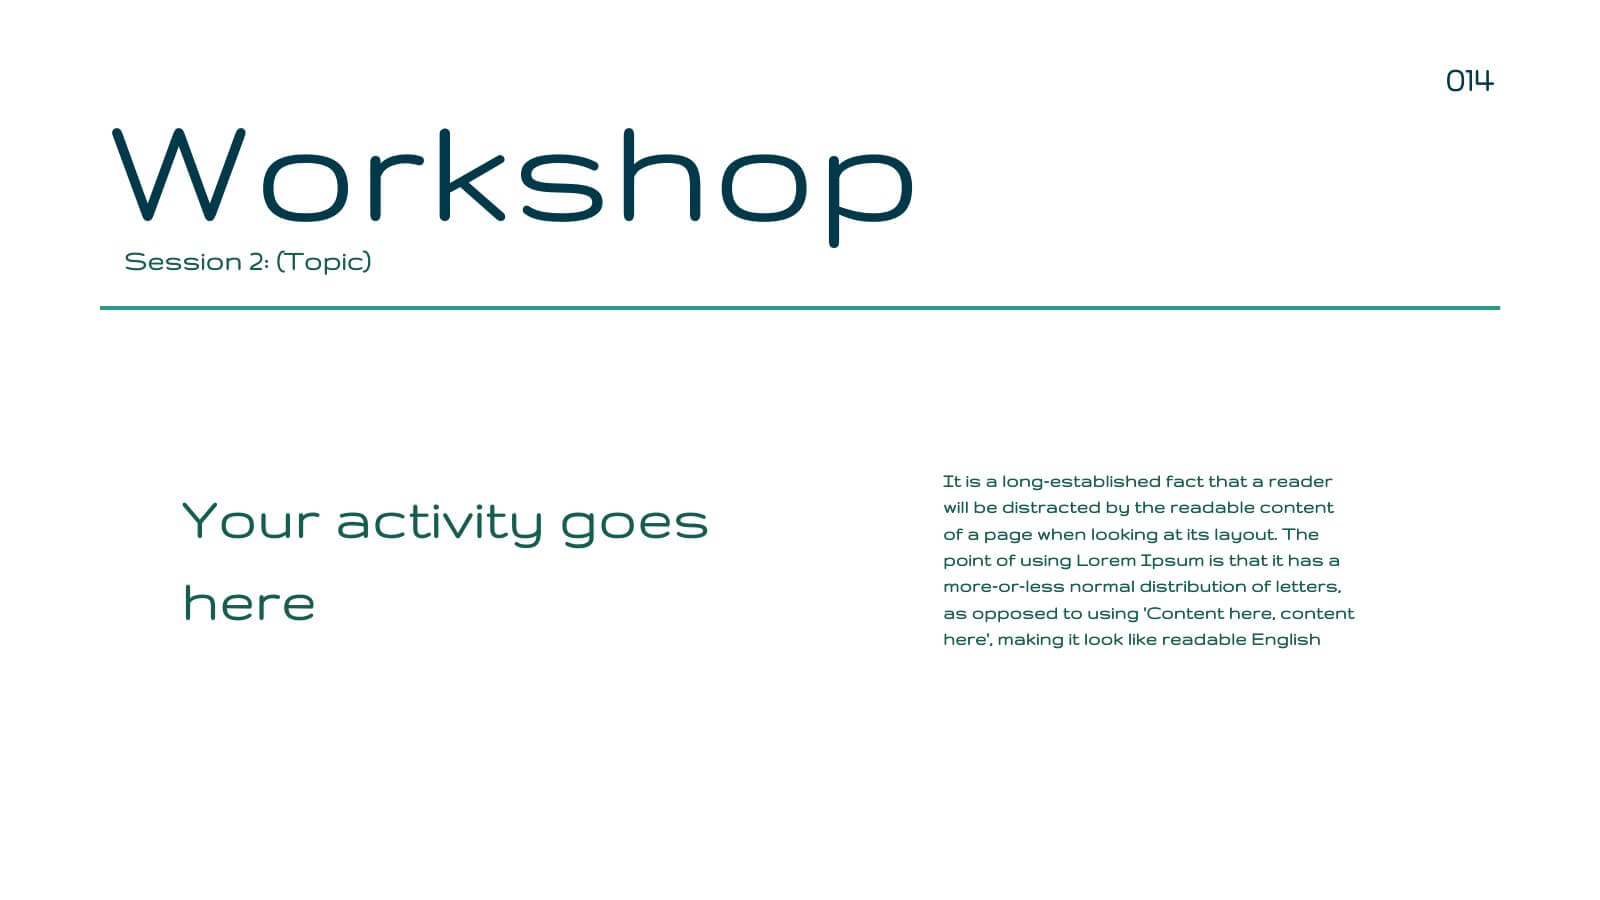
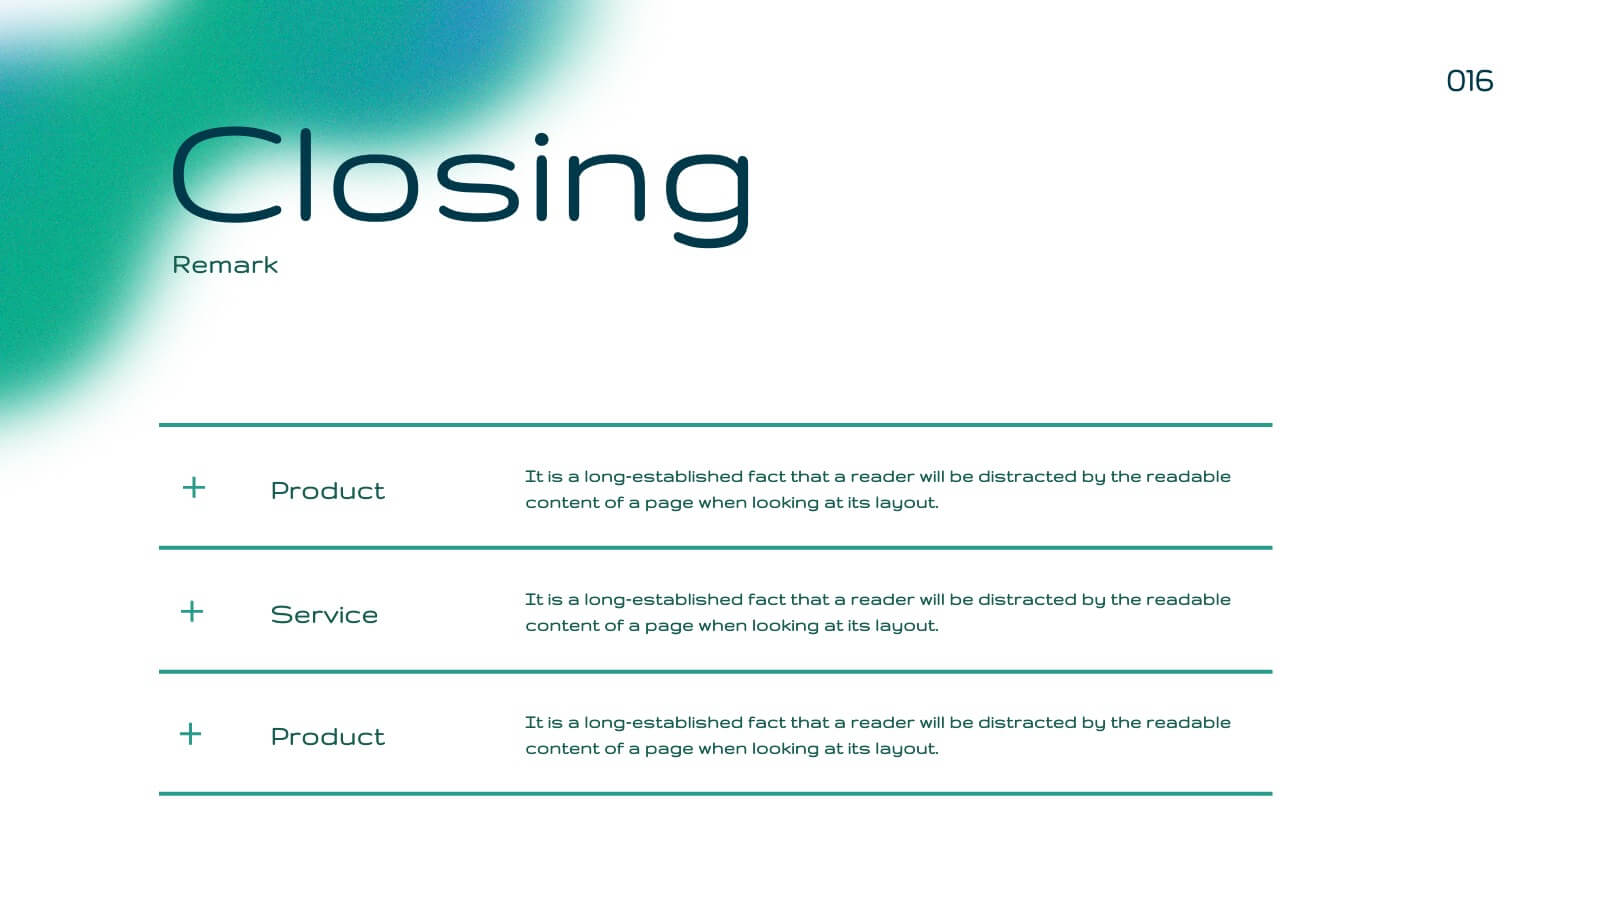
Blaze Business Operations Plan Presentation
Elevate your business presentations with this elegant, modern template designed for comprehensive business operations. Perfect for covering themes, objectives, workshops, and panel discussions, it ensures a professional and engaging delivery. The clean design and structured layout enhance clarity and impact. Compatible with PowerPoint, Keynote, and Google Slides, it’s versatile for any platform.


5 diapositivas
Supply Chain Management Infographics
Navigate the intricacies of logistics with our supply chain management infographics. This template, designed in a spectrum of strategic blues, combines a vertical, informative, and creative style, making complex data accessible. Is ideal for business analysts, and students who seek to visually convey the nuances of supply chain. The design incorporates detailed graphics and descriptive icons, all curated to facilitate a clearer understanding of supply chain. This infographic is the key to unlocking streamlined communication and enhanced comprehension of multifaceted logistical operations within corporate presentations, academic materials, or professional seminars.


8 diapositivas
Responsibility Assignment Overview Presentation
The Responsibility Assignment Overview Presentation is a practical and visually structured RACI matrix layout, ideal for clarifying team roles across multiple tasks. Featuring a clear grid system, it highlights who is Responsible, Accountable, Consulted, and Informed for each task—ensuring project accountability and team alignment. Each letter is color-coded for easy scanning, with editable placeholders for up to six tasks and roles. Perfect for project managers, HR professionals, and operations teams. Fully customizable in PowerPoint, Keynote, and Google Slides.


7 diapositivas
Cycle Infographic Presentation Template
A cycle infographic is a visual representation of a repeating pattern of events. This template can be used to show the stages of a process or the sequence of events that make up a cycle. The purpose of this cycle infographic is to provide a clear and easy-to-understand illustration of a repeating pattern, helping to clarify the steps involved and to show the interrelationships between different elements. This well-designed cycle infographic can help you identify areas for improvement, improve communication and collaboration, and support decision-making by providing a view of the cycle.


7 diapositivas
Academic Year Schedule and Class Structure Presentation
Organize your school week with clarity using the Academic Year Schedule and Class Structure Presentation. Perfect for teachers, school coordinators, and academic planners, this timetable slide helps map out subjects and activities across days and periods. Fully customizable in PowerPoint, Keynote, Google Slides, and Canva for seamless editing.


8 diapositivas
Cooperative Team Collaboration Strategy Presentation
Illustrate your teamwork dynamics with this interconnected diagram that visually represents synergy, communication flow, and shared responsibilities. Ideal for project planning, remote team updates, or stakeholder presentations. Fully editable in PowerPoint, Keynote, and Google Slides—adjust icons, colors, and text effortlessly to fit your narrative.


8 diapositivas
Project Milestones and Deliverables Presentation
Visualize your project’s journey with this step-by-step milestone timeline—ideal for tracking key phases, task ownership, or delivery checkpoints. The diagonal path connects colorful icons and editable text blocks, helping teams align on objectives and timelines. Compatible with PowerPoint, Keynote, and Google Slides.


5 diapositivas
Vaccine Myths Infographic
Vaccine Myths are false or misleading claims about vaccines that can contribute to vaccine hesitancy and misinformation. These infographic templates are designed to debunk common misconceptions and myths surrounding vaccines. These visually appealing and informative templates are ideal for healthcare professionals, educators, and organizations aiming to promote accurate information about vaccines and combat vaccine hesitancy. These infographics aim to educate and empower individuals to make informed decisions about vaccination and contribute to public health efforts. Compatible with Powerpoint, Keynote, and Google Slides.


7 diapositivas
Cyber Security News Infographic Presentation
Cyber Security is the practice of protecting computer systems, networks, and digital data from theft, damage, or unauthorized access. This Cyber Security template is the most comprehensive and easy to use cyber security resource. It contains visually attractive visuals, allowing you to easily create a infographic to present your ideas. By using this template, you can raise awareness about how to protect your network from hackers and reduce the risk of data theft or leaks. This infographic template is easy to edit, customize, and download in Powerpoint, Keynote, and Google slides.


6 diapositivas
Legal Policy Overview Presentation
Make your legal and compliance reports look polished and professional with this clean, organized layout. Designed to simplify complex information, it’s ideal for presenting policies, frameworks, and regulations with clarity. Easily customize the content and visuals—fully compatible with PowerPoint, Keynote, and Google Slides for effortless editing and use.