


Características


¿Tienes alguna pregunta?
Recomendar


5 diapositivas
Poaching Effects Infographics
Navigate the critical issue of wildlife endangerment with our poaching effects infographics. Crafted in earthy tones of brown and tan, this informative and creatively styled vertical template sheds light on the harsh realities of illegal wildlife hunting. Whether you're an environmental activist, an educator, or part of an ecological research team, this infographic is structured to resonate with your audience, offering compelling visuals and thematic icons that starkly represent the consequences of poaching. It's more than a presentation; it's a call to global action, crucial for anyone advocating for wildlife preservation and aiming to inspire change through storytelling.


4 diapositivas
Risk Assessment Heat Map
Visualize and evaluate risk levels with clarity using this impact-based heat map layout. Ideal for risk management reports, audits, and strategic planning, this template highlights potential threats across multiple categories and severity levels. Fully customizable in PowerPoint, Keynote, and Google Slides.


6 diapositivas
Modern Circle Infographic
Our Modern Circle infographic is a contemporary visual tool designed for seamless integration with Powerpoint, Keynote, and Google Slides. This infographic is particularly useful for professionals and educators looking to present information in a cyclical process or to illustrate a concept that involves interconnected elements. The design of the Modern Circle infographic is intuitive and engaging, facilitating the representation of processes, relationships, or statistics in a clear, circular format. The sleek and modern aesthetic ensures that your information is conveyed in a visually appealing manner, keeping your audience engaged and focused on the content. By utilizing this infographic, you have the ability to present complex data or concepts in a simplified form, making it accessible for all audience types. Whether you’re detailing a business cycle, demonstrating a feedback loop, or presenting a series of steps in a continuous process, the Modern Circle infographic is your go-to for adding a touch of sophistication to your presentations. Its adaptability and stylish design will enhance your ability to communicate effectively with any audience.


4 diapositivas
Mirror Data Distribution Butterfly Format Presentation
Present side-by-side comparisons with clarity using the Mirror Data Distribution Butterfly Format Presentation. This layout helps visualize balanced data sets, performance comparisons, or goal vs. outcome metrics with mirrored bars and intuitive icons. Fully customizable in Canva, PowerPoint, Google Slides, and Keynote to match your brand's aesthetic and message.


5 diapositivas
Annual Overview Report Template Presentation
Bring your yearly achievements to life with this sleek and structured layout designed for clarity and impact. Ideal for summarizing company performance, milestones, and future goals, it organizes data into easy-to-follow visuals. Fully editable and compatible with PowerPoint, Keynote, and Google Slides for a smooth presentation experience.


6 diapositivas
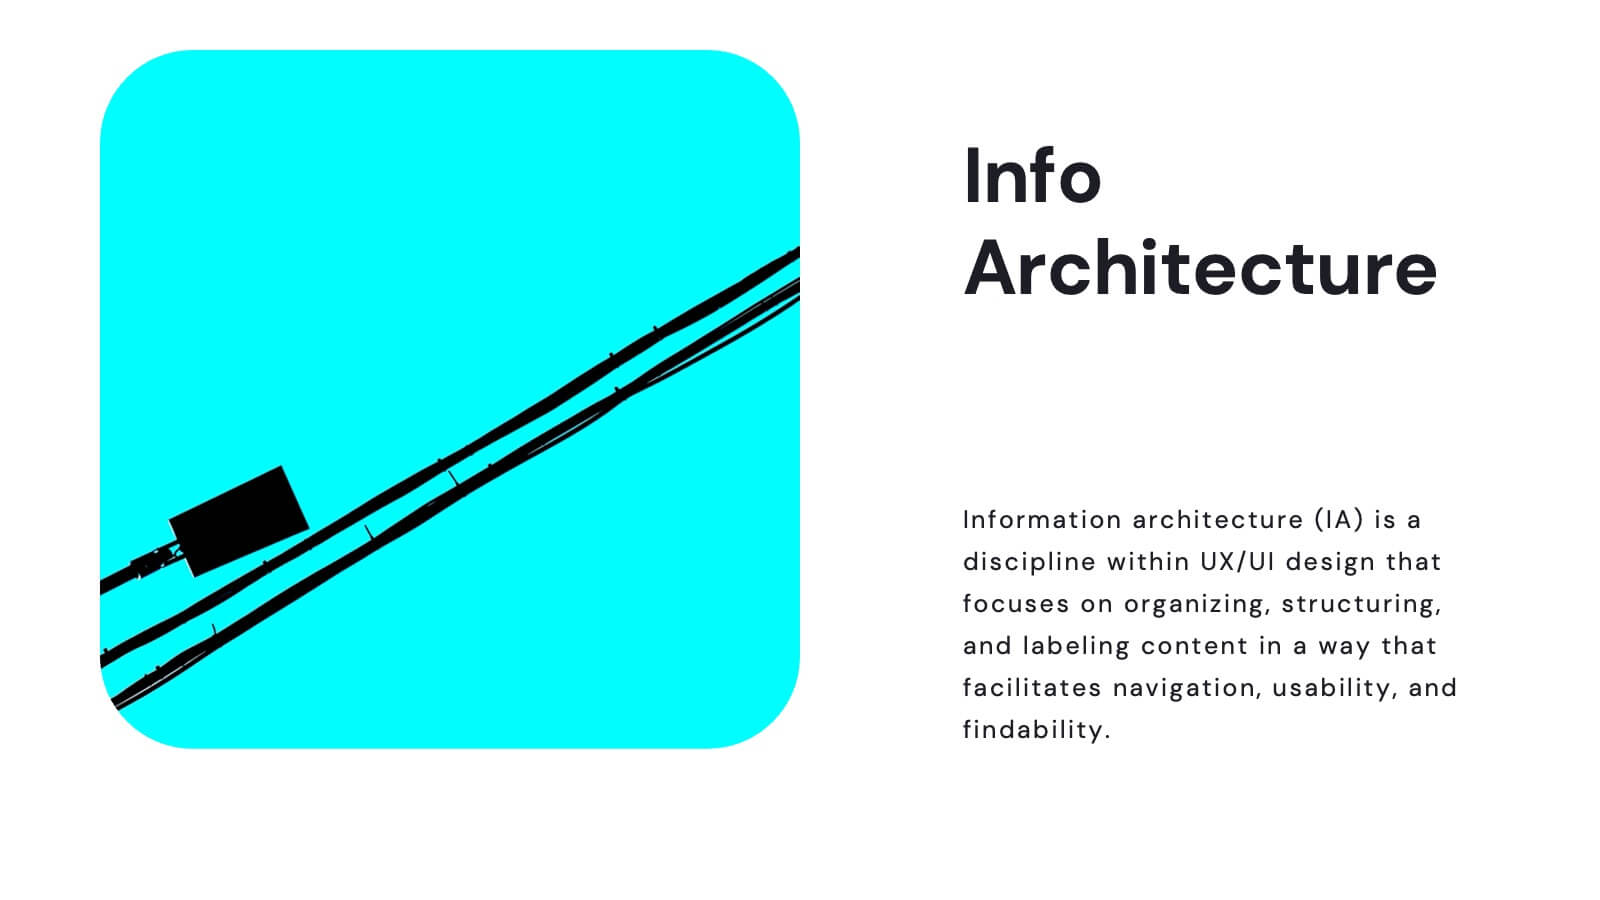
IT Architecture Diagram Presentation
Turn complex system structures into clear visual stories with this professional presentation. Perfect for mapping processes, software layers, or organizational workflows, it helps communicate how technology components connect and operate. Fully editable and compatible with PowerPoint, Keynote, and Google Slides for seamless customization and engaging technical presentations.


5 diapositivas
Business Activity Rotation Cycle Presentation
Showcase continuous workflows with the Business Activity Rotation Cycle Presentation. Ideal for operations, planning, and strategy meetings, this template visualizes multi-phase cycles with clean, editable layouts. Use it to outline repeated business functions, processes, or initiatives. Compatible with PowerPoint, Keynote, and Google Slides—perfect for consultants, teams, and business professionals.


5 diapositivas
Retention and Loyalty Program Benefits Presentation
Showcase the value of your loyalty strategy with the Retention and Loyalty Program Benefits presentation. This template clearly communicates reward tiers, membership perks, and engagement incentives using a card-based visual structure. Perfect for marketing presentations, customer success teams, and subscription-based business models. Fully customizable in PowerPoint, Keynote, and Google Slides.


24 diapositivas
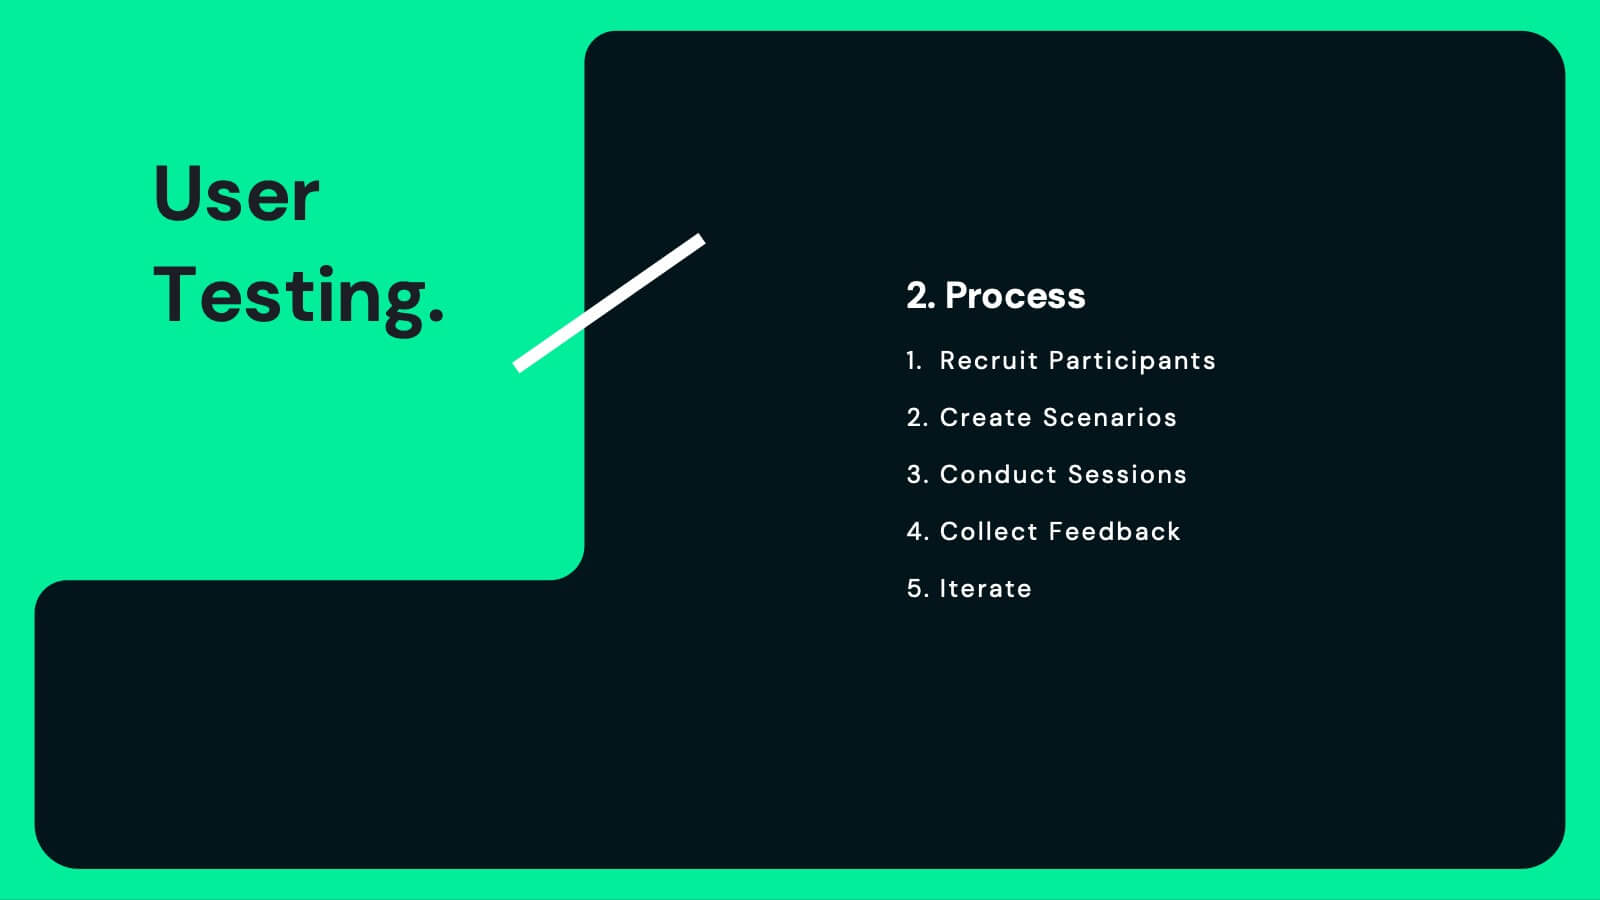
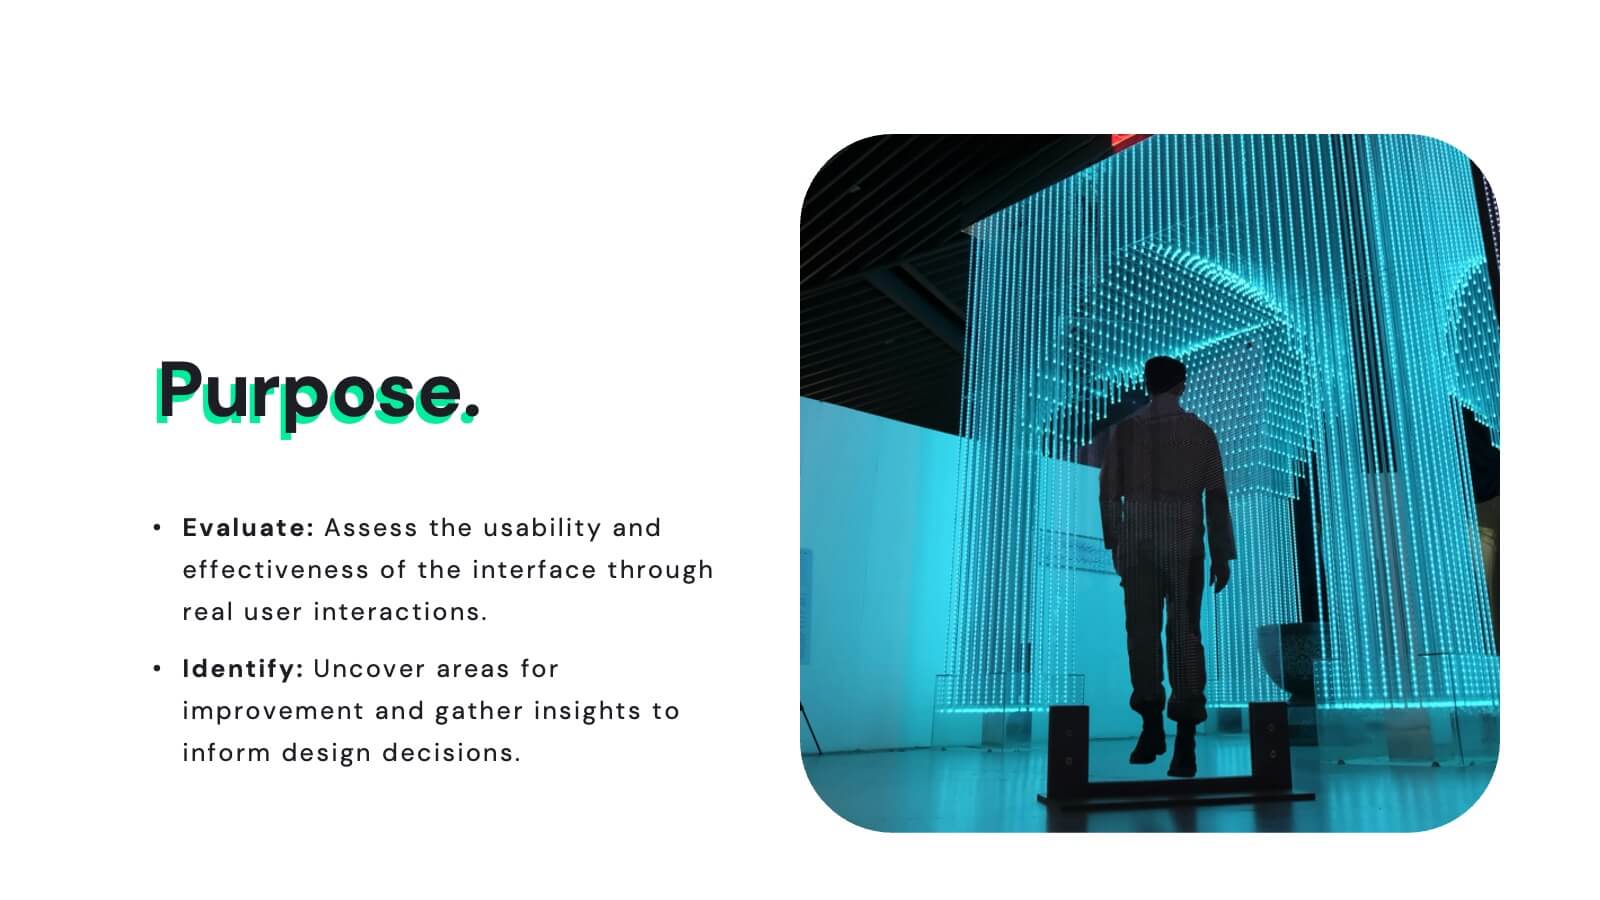
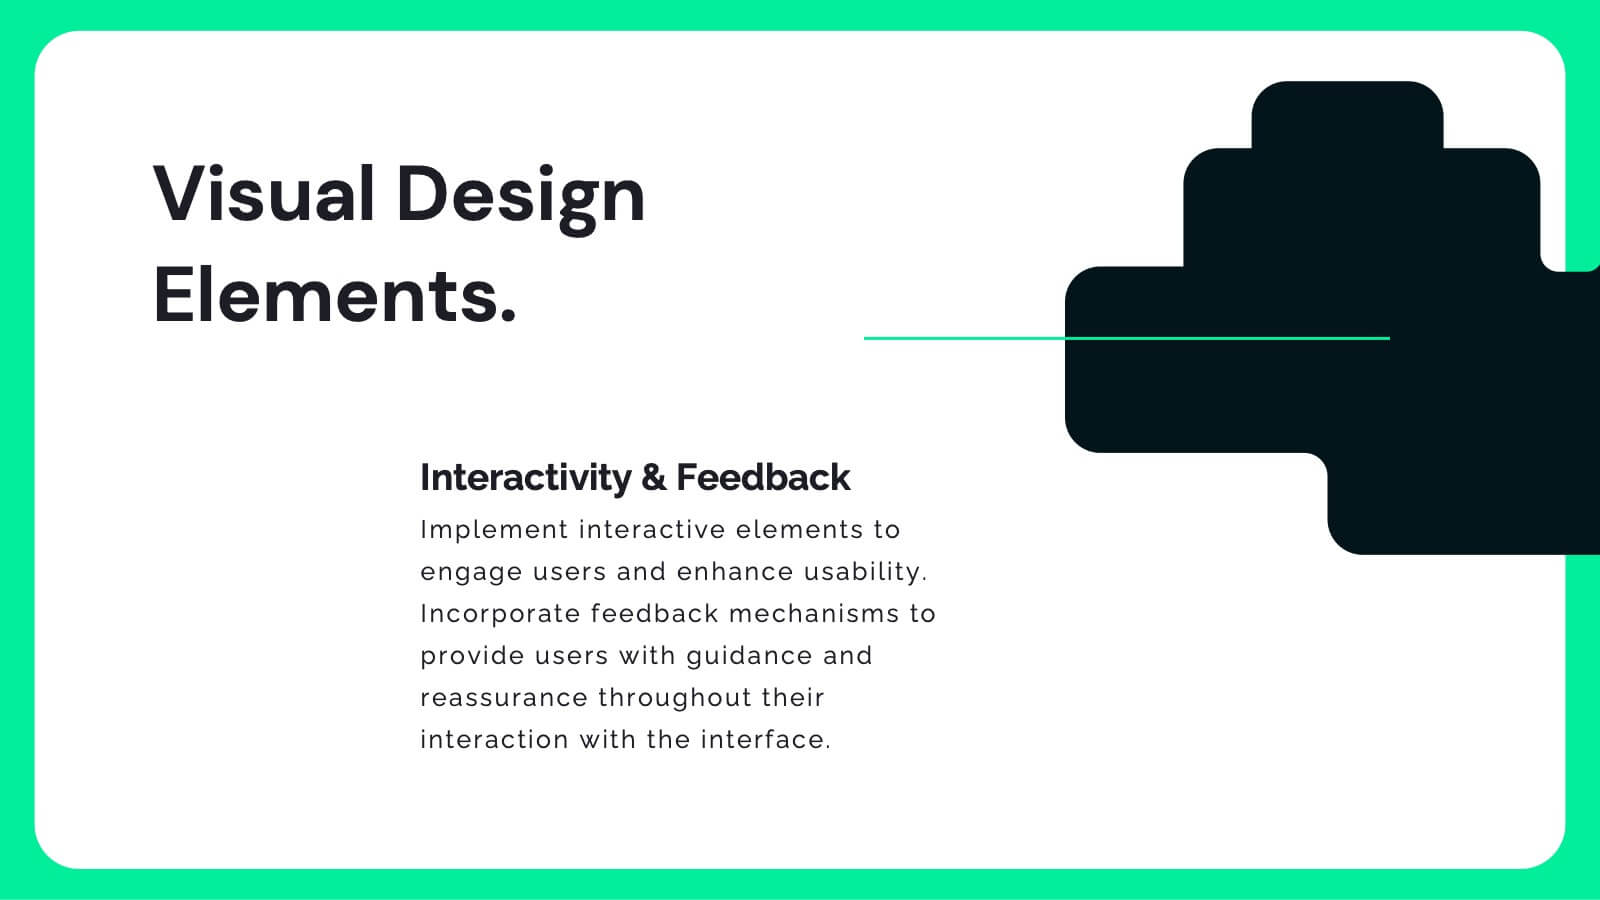
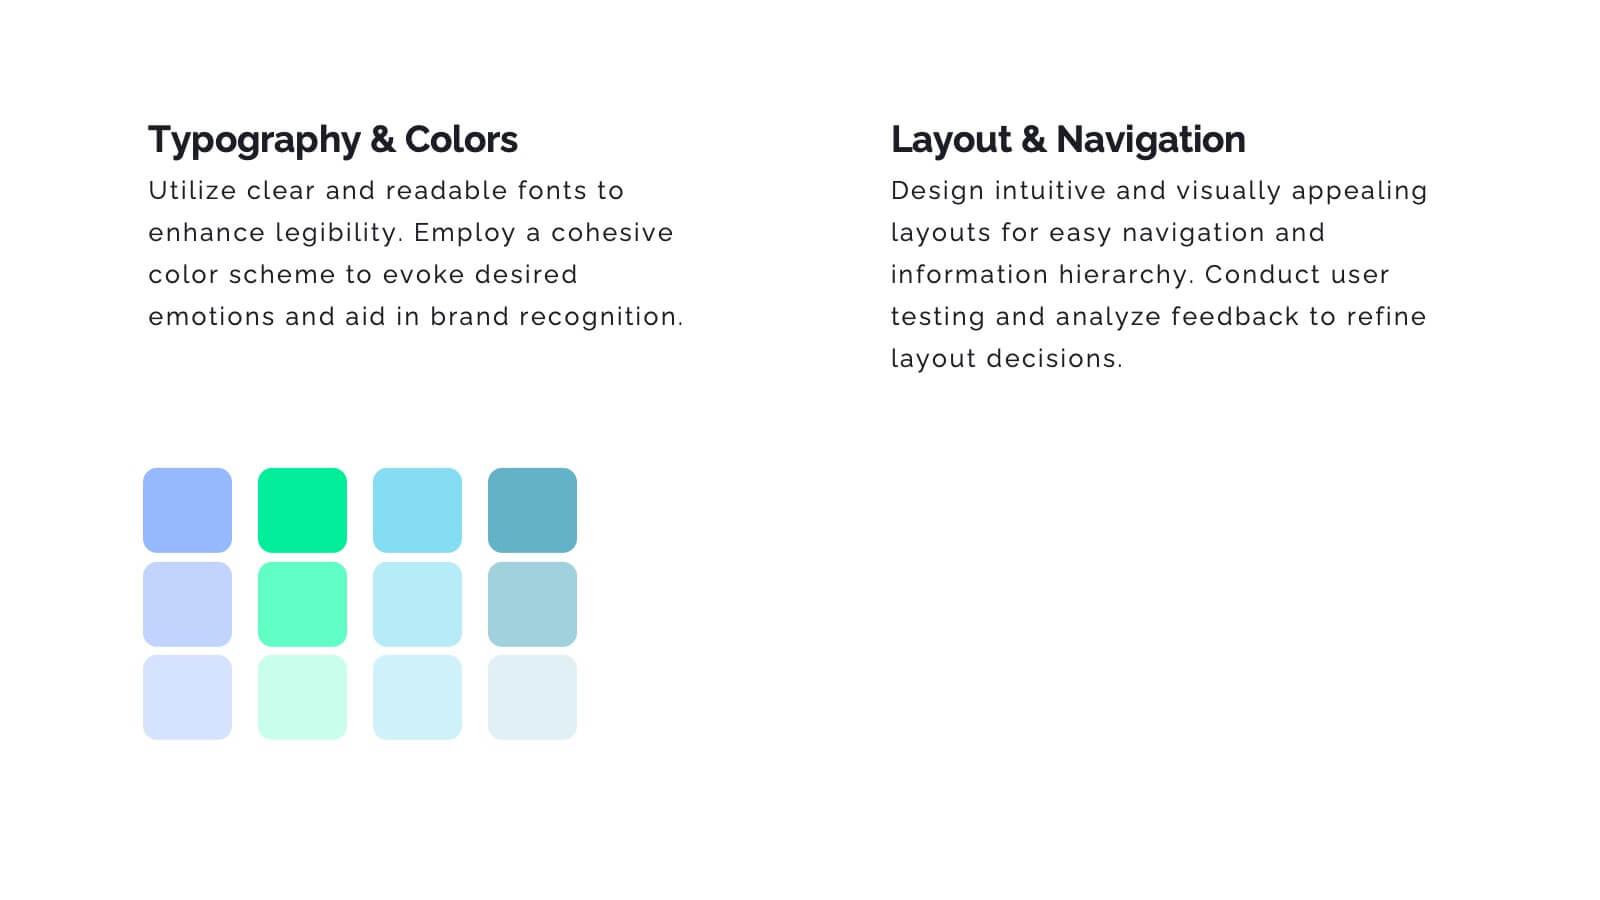
Wanderra UX Design Presentation
Elevate your user experience strategy with this comprehensive presentation template. Covering key aspects such as personas, wireframes, usability guidelines, and design systems, this template helps you create engaging and intuitive experiences. Fully customizable and compatible with PowerPoint, Keynote, and Google Slides.


4 diapositivas
Root Cause Analysis Fishbone Presentation
Pinpoint problems efficiently with this Root Cause Analysis Fishbone template. Designed to help you identify and visualize causes clearly, it’s perfect for process improvement and team brainstorming. Fully editable and easy to use in PowerPoint, Keynote, and Google Slides for maximum flexibility across your workflow.


4 diapositivas
4-Quadrant RACI Chart Slide Presentation
Bring structure and clarity to your workflow with a bold, pyramid-style layout that makes responsibilities instantly understandable. This presentation helps teams outline who leads, supports, approves, and informs across key tasks, turning complex processes into a clean visual map. Fully editable and compatible with PowerPoint, Keynote, and Google Slides.


6 diapositivas
Organizational Change Management Presentation
Visualize transformation with clarity using this structured slide, perfect for outlining your change roadmap, initiatives, or strategic phases. The layout features six labeled steps with icons and editable text for seamless communication of your process—from awareness to adoption. Ideal for HR leaders, consultants, and operations managers. Fully editable in PowerPoint, Keynote, and Google Slides.

21 diapositivas
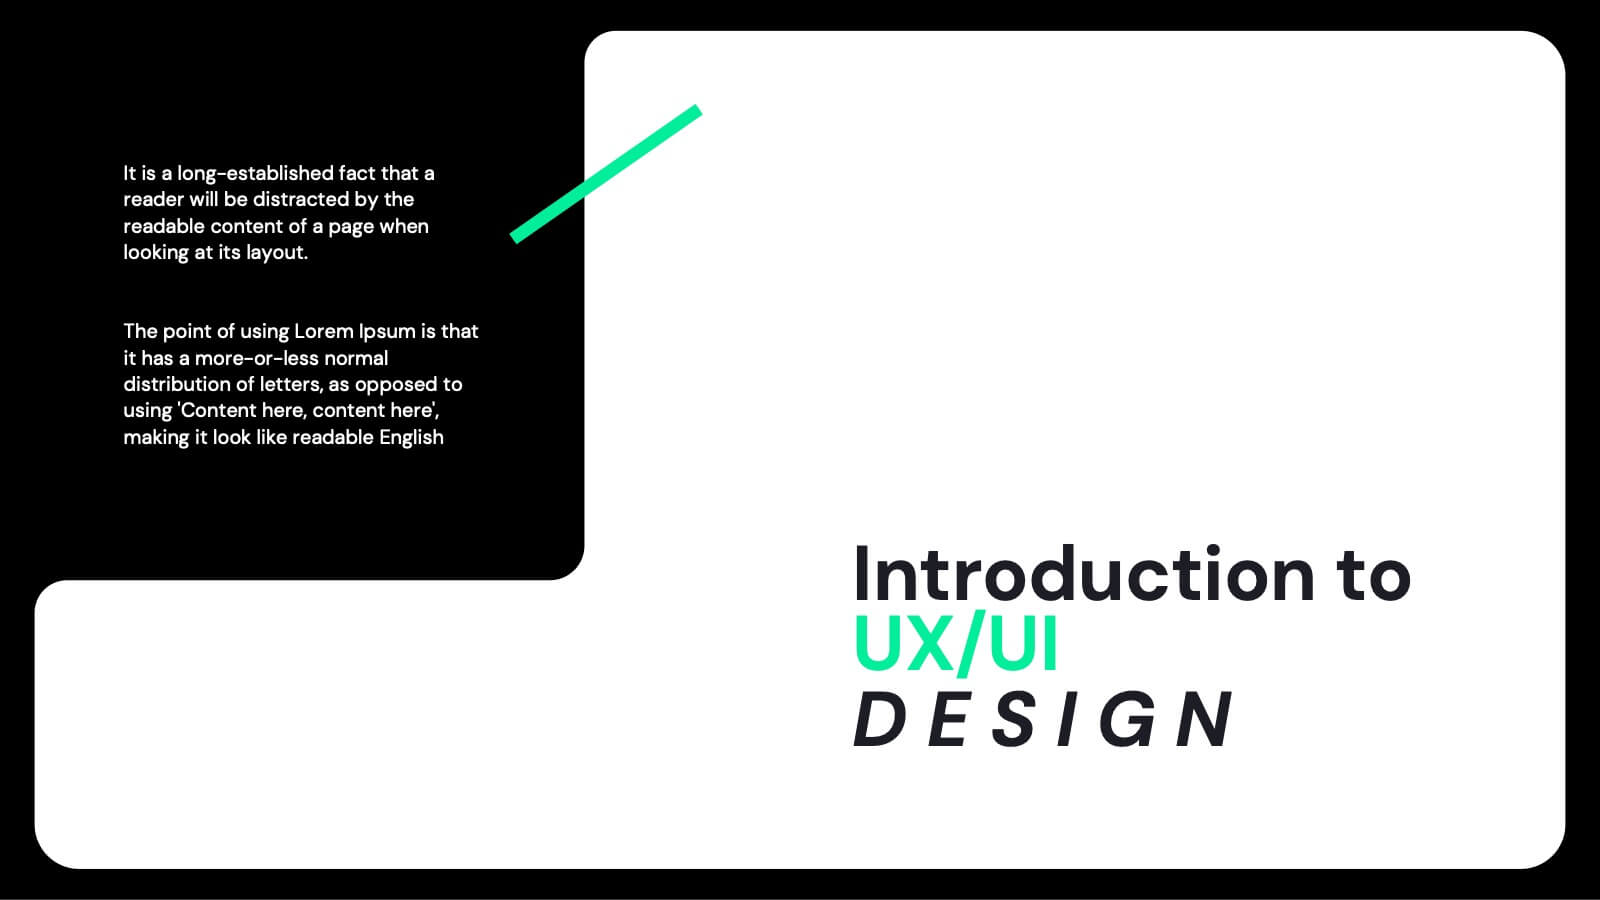
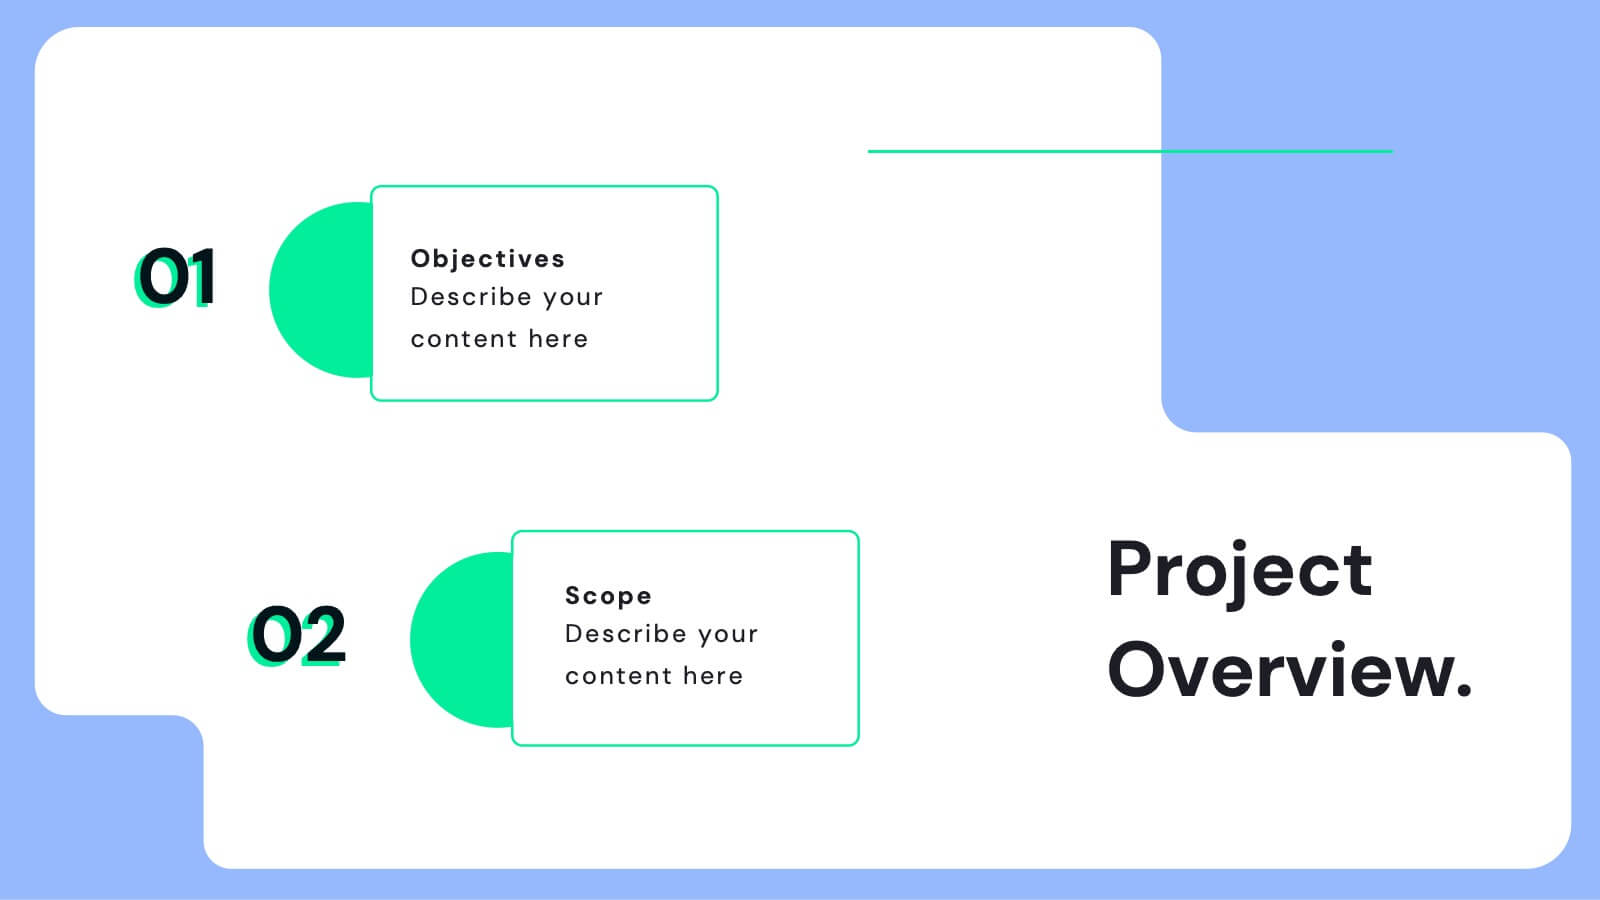
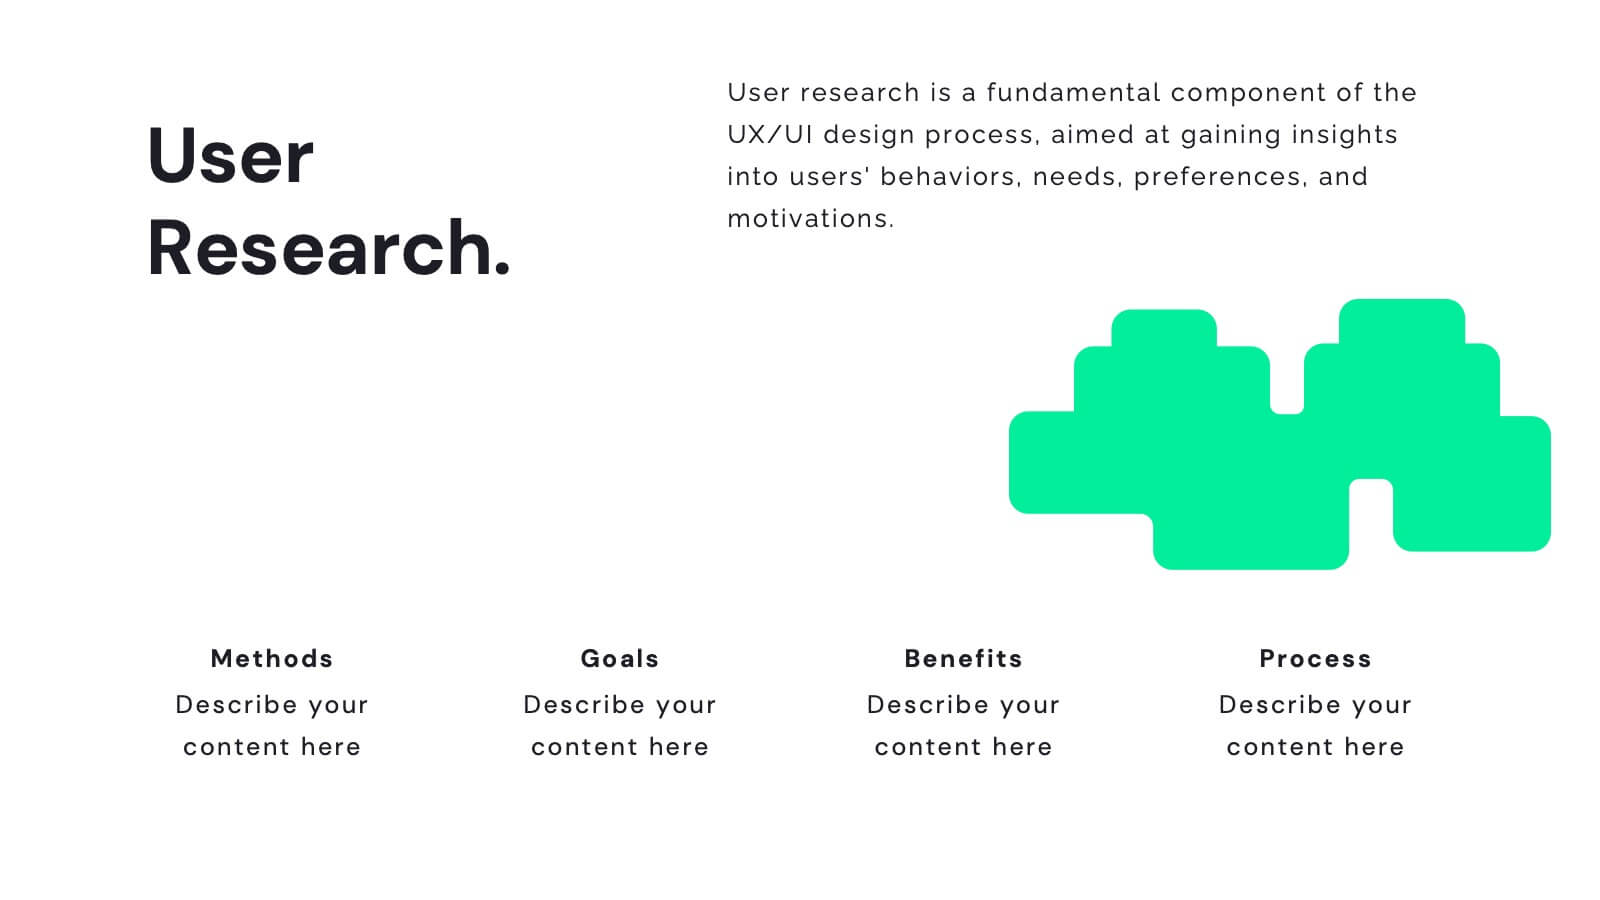
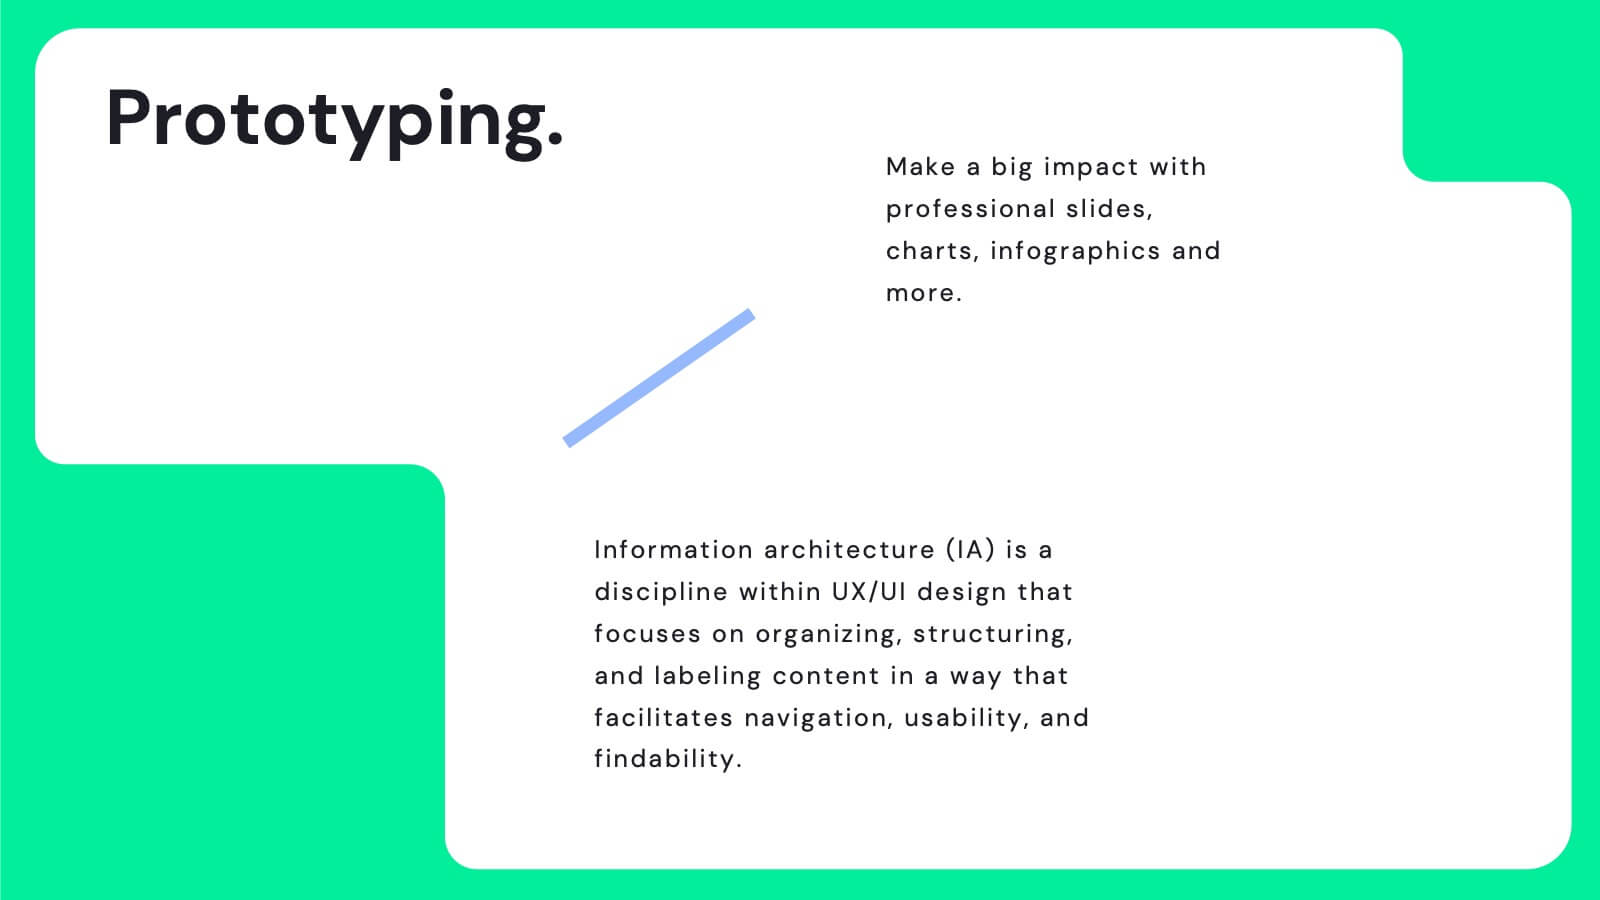
Juno UX Case Study Presentation
Enhance your UX presentations with this sleek, user-friendly template designed for showcasing detailed case studies and user research. With a modern layout and clear sections for user journey mapping, prototyping, and usability guidelines, this template ensures a professional and engaging presentation. Compatible with PowerPoint, Keynote, and Google Slides, it's perfect for any platform.


4 diapositivas
Business Growth Strategy Presentation
Visualize strategic priorities with this Business Growth Strategy Presentation. Designed as a 2x2 matrix, this slide showcases market and product positioning across four quadrants: present vs. future and market fit vs. innovation. Each section is color-coded and icon-supported, making it easy to highlight initiatives and growth paths. Fully editable in PowerPoint, Keynote, and Google Slides.


22 diapositivas
Mistgrove Digital Agency Strategy Plan Presentation
Craft an impactful strategy for your digital agency with this sleek and professional presentation template. Highlight your agency's mission, vision, and services while showcasing success stories through client testimonials and case studies. Dive into essential sections like market analysis, industry trends, and competitive positioning to communicate a forward-thinking strategy effectively. This template includes dedicated slides for creative processes, strategy development, and campaign execution, ensuring you present your approach clearly and confidently. With options for measurement and analytics, future outlooks, and social impact initiatives, it empowers you to convey the value and growth potential of your strategies. Fully compatible with PowerPoint, Google Slides, and Keynote, this template offers seamless customization to align with your agency's unique brand identity and goals.


6 diapositivas
Business Performance Dashboard
Enhance your business presentations with our "Business Performance Dashboard" template. This comprehensive infographic provides a detailed overview of crucial business metrics, structured within a user-friendly dashboard layout. It includes financial data like total orders and cash on hand, operational stats such as project updates, and engagement metrics including views and follows. Each section is visually distinct, with icons and color blocks that make data easy to read and analyze. Ideal for managers and analysts, this template offers a snapshot of company performance, facilitating informed decision-making and efficient reporting. Compatible with PowerPoint, Keynote, and Google Slides, it's an essential tool for any business analysis.


5 diapositivas
Skills Gap Assessment Presentation
Spot talent strengths and uncover hidden weaknesses with a clean, visual layout that makes workforce insights easy to understand. This presentation helps teams evaluate current abilities, identify missing competencies, and plan targeted development. Ideal for HR, training, and leadership reviews. Fully compatible with PowerPoint, Keynote, and Google Slides.